Inflationary effect of oil-price shocks in an imperfect market: A partial transmission...
16
Journal of Policy Modeling 35 (2013) 354–369 Available online at www.sciencedirect.com Inflationary effect of oil-price shocks in an imperfect market: A partial transmission input–output analysis Libo Wu a,b,c , Jing Li b , ZhongXiang Zhang b,c,d,∗ a School of Economics, Fudan University, No. 600 Guoquan Road, Shanghai 200433, China b Center for Energy Economics and Strategy Studies, Fudan University, No. 600 Guoquan Road, Shanghai 200433, China c Research Institute for the Changing Global Environment, Fudan University, Shanghai 200433, China d Research Program, East-West Center, 1601 East-West Road, Honolulu, HI 96848-1601, USA Received 29 August 2011; received in revised form 1 December 2011; accepted 19 January 2012 Available online 31 January 2012 Abstract This paper aims to examine the impacts of sectoral price control policies on oil price pass-through into China’s aggregate price level. To that end, we develop a partial transmission input–output model that captures the uniqueness of the Chinese market. We hypothesize and simulate price control, market factors and tech- nology substitution – the three main factors that restrict the functioning of a price pass-through mechanism during oil-price shocks. Using the models of both China and the US, we separate the impact of price control from that of other factors leading to China’s price stickiness under oil-price shocks. The results show a sharp contrast between China and the US, with price control in China significantly preventing oil-price shocks from spreading into its domestic inflation, especially in the short term. However, in order to strengthen the economy’s resilience to oil-price shocks, the paper suggests a gradual relaxing of price control in China. © 2012 Society for Policy Modeling. Published by Elsevier Inc. All rights reserved. JEL classification: Q43; Q41; Q48; O13; O53; P22; E31 Keywords: Oil-price shocks; Price pass-through; Price control; Input–output analysis; Inflation; China 1. Introduction Inflationary impacts of oil-price shocks have always been concerned by oil importing countries. China’s rapid industrialization, urbanization and motorization on the one hand and its stagnating ∗ Corresponding author at: Research Program, East-West Center, 1601 East-West Road, Honolulu, HI 96848-1601, USA. Tel.: +1 808 944 7265; fax: +1 808 944 7298. E-mail address: [email protected] (Z. Zhang). 0161-8938/$ – see front matter © 2012 Society for Policy Modeling. Published by Elsevier Inc. All rights reserved. doi:10.1016/j.jpolmod.2012.01.008
-
Upload
zhongxiang -
Category
Documents
-
view
213 -
download
0
Transcript of Inflationary effect of oil-price shocks in an imperfect market: A partial transmission...

Journal of Policy Modeling 35 (2013) 354–369
Available online at www.sciencedirect.com
Inflationary effect of oil-price shocks in an imperfectmarket: A partial transmission input–output analysis
Libo Wu a,b,c, Jing Li b, ZhongXiang Zhang b,c,d,∗a School of Economics, Fudan University, No. 600 Guoquan Road, Shanghai 200433, China
b Center for Energy Economics and Strategy Studies, Fudan University, No. 600 Guoquan Road, Shanghai 200433,China
c Research Institute for the Changing Global Environment, Fudan University, Shanghai 200433, Chinad Research Program, East-West Center, 1601 East-West Road, Honolulu, HI 96848-1601, USA
Received 29 August 2011; received in revised form 1 December 2011; accepted 19 January 2012Available online 31 January 2012
Abstract
This paper aims to examine the impacts of sectoral price control policies on oil price pass-through intoChina’s aggregate price level. To that end, we develop a partial transmission input–output model that capturesthe uniqueness of the Chinese market. We hypothesize and simulate price control, market factors and tech-nology substitution – the three main factors that restrict the functioning of a price pass-through mechanismduring oil-price shocks. Using the models of both China and the US, we separate the impact of price controlfrom that of other factors leading to China’s price stickiness under oil-price shocks. The results show a sharpcontrast between China and the US, with price control in China significantly preventing oil-price shocksfrom spreading into its domestic inflation, especially in the short term. However, in order to strengthen theeconomy’s resilience to oil-price shocks, the paper suggests a gradual relaxing of price control in China.© 2012 Society for Policy Modeling. Published by Elsevier Inc. All rights reserved.
JEL classification: Q43; Q41; Q48; O13; O53; P22; E31
Keywords: Oil-price shocks; Price pass-through; Price control; Input–output analysis; Inflation; China
1. Introduction
Inflationary impacts of oil-price shocks have always been concerned by oil importing countries.China’s rapid industrialization, urbanization and motorization on the one hand and its stagnating
∗ Corresponding author at: Research Program, East-West Center, 1601 East-West Road, Honolulu, HI 96848-1601,USA. Tel.: +1 808 944 7265; fax: +1 808 944 7298.
E-mail address: [email protected] (Z. Zhang).
0161-8938/$ – see front matter © 2012 Society for Policy Modeling. Published by Elsevier Inc. All rights reserved.doi:10.1016/j.jpolmod.2012.01.008

L. Wu et al. / Journal of Policy Modeling 35 (2013) 354–369 355
domestic production of oil on the other hand have produced a growing hunger for foreign oil.Since 2009, China has imported more than half of its oil demand, and its oil imports will continueto soar in the decades ahead (IEA, 2010; Zhang, 2011a). China’s growing thirst for foreign oilimplies that China is becoming more sensitive or even more vulnerable to external oil-price shocks.Inflationary impact of oil-price shock has been tested for its robustness in most of the developedeconomies in the 20th century. However, China’s economy maintained its growth momentum inthe recent oil-price soaring period of 2003–2008, during which China’s consumer price index(CPI) is far less synchronous with oil-price change compared to other developed nations (Wu,Tang, & Sun, 2011). While oil consumption per unit of economic output has been decreasing overthe past decades, it is still much higher than that of other developed economies in absolute terms(Tang, Wu, & Zhang, 2010). All these attributes should make China vulnerable to internationaloil-price shocks. However, China’s performance with respect to economic growth and CPI doesnot follow all these inferences and thus needs further investigations.
Intuitively, China’s resilience to oil-price shocks is due to policy interventions, which have beenprotecting the Chinese aggregate price level from frequent fluctuations in international commodityprice. Although China had become a net importer of crude oil since 1993, its domestic oil markethas to date not been deregulated completely. Deviating from an absolutely planned system, Chinesedomestic petroleum market started its reform in 1998 to get linked with international oil market.The prices of domestic petroleum products were set, taking reference to the prices of oil productsin Singapore initially and then being linked to the weighted average prices in Singapore, New Yorkand Rotterdam over the period of 2000 to late 2008. However, differing from a comprehensivepegging system, China’s domestic petroleum market was essentially controlled by the centralgovernment and various kinds of policy intervention and distortion were implemented. As aresult, instant pass-through of oil-price changes could hardly realize either between internationaland domestic market or across the upstream and downstream industries. Since petroleum refineryand retail industries have been partially privatized, upstream monopoly together with price controlled to serious shortage of gasoline and diesel supply in the oil-price soaring periods and blackmarket arbitrages were also rampant.
In China, price control policy targets two kinds of commodities: primary resources and CPI-indexed commodities. Since those industries producing the first category of commodities are proneto be monopolized, price control is implemented mainly to prevent monopoly from encroachingon public interest. Measures taken are to keep their profit at reasonable levels. Another reasonfor such price control policy is to strengthen the international competitiveness of the Chineseenterprises by factor price depreciation. For the second category, price control is enforced torestrain inflation and to mitigate the impact of price turbulence on the general public’s livingconditions. Price control policy has acted as a useful tool against inflation in China for a longperiod of time. However, this policy has led to many induced inefficiencies and inequities, which inturn call for complete market reform. Accordingly, the Chinese government has made continuousefforts towards price liberalization since its access to the World Trade Organization. However, acertain level of price control is still imposed on China’s various sectors.
From the preceding discussion, it thus follows that China’s resilience to oil-price shocks shouldbe largely attributed to price control policies, which weather the possible inflationary impacts offurther oil market liberation. However, what remains unknown is how and to what extent theprice control system has influenced China’s responses to an oil-price shock? While a number ofstudies have been conducted to explore the correlations between CPI, PPI (producer price index)and oil prices, few have clarified how such macro relationships are formulated by industrial-levelpolicy interventions. Whether and to what extent the upperstream industries can transfer the cost

356 L. Wu et al. / Journal of Policy Modeling 35 (2013) 354–369
burden to the downstream industries is dependent on their relative price elasticity, market structureand policy interventions. Disentangling the effects of price control policies from other potentialfactors is the main aim of this study.
This paper is organized as follows. Section 2 will provide a comprehensive review of literatureon oil-price inflationary effects and clarify our starting point. Section 3 introduces the modelingframework of our analysis. We tailor the traditional input–output method to better reflect theuniqueness of China’s reality. In Section 4, we manage to separate the effect of price control fromthat of other factors leading to China’s price stickiness under oil-price shocks, using the partialtransmission input–output models of both China and the US. Section 5 discusses some policyimplications. The conclusions are drawn in Section 6.
2. Literature review
Over the past three decades, there has been a growing literature examining the inflationary effectof oil-price shocks. Early studies attempted to clarify the “input-cost” effect of oil-price changetheoretically or empirically based on production–function analysis (Atkeson & Kehoe, 1999;Burbidge & Harrison, 1984; Lee, Lee, & Ratti, 2001; Mork, Olsen, & Mysen, 1994; Pindyck& Rotemberg, 1983). Based on a thorough review of these studies, Brown and Yücel (2002)pointed out that in spite of large body of empirical evidences proving the correlation betweenoil price and overall price level, there are still some remaining issues to be explored. The centraldebate lies on the fact that energy costs account for only small portion of total production costsand should not lead to a significant rise of aggregate price level. Oil price pass-through effectshould be magnified by other market factors or external interventions. Based on multi-functioneconometric models, such as VAR, SVAR or VEC, recent studies investigate the role of moremacroeconomic variables, such as interest rate, exchange rate, monetary supply and so on, toclarify the contribution of oil-price shocks to macroeconomic stagflation or recession (Cunado& de Gracia, 2003; Herrera & Pesavento, 2009; Lardic & Mignon, 2006; Lee & Ni, 2002; Tanget al., 2010). In addition to econometric models, input–output models and computable generalequilibrium models are also utilized to shed more light on the agents behavior change and to sim-ulate alternative outcomes under various shocks (Berument & Tasci, 2002; Guivarch, Hallegatte,& Crassous, 2009; Kerschner & Hubacek, 2009; Leduc & Sill, 2004). Since such models arebased on periodical input–output table or social accounting matrix instead of time series data,these studies provide more comprehensive policy evaluations than econometric studies, whichare highly dependent on stylized facts.
Most of the studies targeting on mature economies indicate longer-lived effects of oil shocks onmacroeconomic variables, such as output, aggregate price level and investment in 20th century, andsuch effects are weakened over time (Chen, 2009). As for developing countries, there are mixedfindings regarding the relationship between international oil shocks and domestic macroeconomicperformance (Jongwanich & Park, 2009; Lin & Wang, 2009; Ren, Pan, & Liu, 2007; Tang et al.,2010). Regional diversifications might be due to market structure, oil dependence and non-marketinterventions. Adopting a VAR model, Du, He, and Wei (2010) find out that while China’s GDPgrowth is positively correlated with the world oil price, oil-price shocks can have a significantimpact on domestic inflation. Faria, Mollick, Albuquerque, and León-Ledesma (2009) examinethe reasons behind the rapid expansion of the Chinese exports under oil-price shocks. Huang andGuo (2007) investigate the impact of oil-price shocks on China’s real exchange rate. However,it is not until recently that researchers bring the issue of China’s sticky oil price pass-throughinto their research framework. Tang et al. (2010) observe China’s price stickiness in the oil price

L. Wu et al. / Journal of Policy Modeling 35 (2013) 354–369 357
pass-through, and using a SVAR model they show that price stickiness and rigidity of investmentin a short period make the impact of oil-price shocks on China’s economy gradual but permanent.Using an input–output model, Ren et al. (2007) measure the impact of oil price on China’s priceindex and attribute the stickiness of China’s oil price pass-through to such factors as marketcompetition, price control and energy substitution.
Given the fact that China is already the world’s largest carbon emitter and its emissions con-tinue to rise rapidly in line with its industrialization and urbanization, China is seen to have greatercapacity, capability and responsibility. The country is facing great pressure both inside and out-side international climate negotiations to be more ambitious in combating global climate change(Zhang, 2010, 2011b, 2011c). Phasing out energy subsidies, introducing fuel or carbon taxes anddeveloping a fully pegging system are among options that China needs to take in order to tran-sit to a low-carbon economy. However, implementing these long-awaited options are hamperedby the conviction of inflationary impact of oil-price changes. This study will attempt to revealthe inter-relationships of sectoral pass-through of oil-price changes and simulate a free-marketscenario by taking the US market as a reference.
3. The model
The input–output (IO) analysis is a powerful tool in determining the gradual inflationary effectof oil-price shocks. The advantage of an IO analysis can be observed at least from the followingthree perspectives. First, an IO modeling is specialized in analyzing the “cost-driven inflation”,while China’s inflation observed during the last oil-price shock is just characterized by “cost-driven”. Secondly, an oil-price shock is gradually realized through the inter-connection betweenindustries. Meanwhile, the IO table gives a comprehensive structural description of the entireeconomy in a particular year (Carter, 1974; Leontief, 1986). Therefore by using the informationprovided by an IO table, an IO model enables us to dissect the complex interdependencies of indus-tries within an economy, and measure the complete inflationary effect of oil-price shocks. Thirdly,while other empirical methods ignore the indirect or ripple effects, an IO analysis allows captur-ing inter-industry linkages and measures both the direct and indirect effects of oil-price shocks(Kerschner & Hubacek, 2009; Liu & Ren, 2006). Therefore, we have adopted an IO framework forour study. However, given the built shortcomings in the traditional IO model, we have developeda partial transition IO model to better reflect the imperfect market conditions in China.
3.1. Traditional input–output analysis
3.1.1. Major assumptionsThree main assumptions are built in an IO analysis. First, the demand-driven nature. All input
requirements for the production of some exogenously given demand will be automatically andinstantaneously met. Secondly, instant transmission. The price turbulence in upstream industriescan be completely and instantaneously transmitted to downstream industries. Thirdly, fixed techni-cal coefficients. The cost reduction efforts made by manufacturers through technology innovationare not considered.
The demand-driven nature of an IO model may not be justifiable for the Western economy(Giarratani, 1976); however, given the abundant unused capacity of China, this assumption maywork for our analysis. The “instant transmission” assumption of an IO model ignores any possibleimpediment in the transmission of oil-price shocks; and thus exaggerates the effect of oil-priceshocks. Since this is usually not the case in reality, we will ease this assumption in Section 3.2.

358 L. Wu et al. / Journal of Policy Modeling 35 (2013) 354–369
The ignorance of technical innovations in an IO model may not be justifiable in the long term;however, this may reflect the short-term reality in China. As we will further put it in Section4, the price control in China actually discourages manufacturers from applying energy-savingtechnologies to reduce their costs when oil price rises.
3.1.2. Traditional input–output methodologyUnder the assumptions discussed above, a price increase in industry i of �pi will lead to a cost
rise in industry j, which uses products from industry i by �piaij, where aij is the correspondingdirect consumption coefficient. Likewise, to keep profit steady, industries other than industry iwill have to increase their prices by
�pi[ ai1 ai2 . . . ai,i−1 ai,i+1 . . . ain ]T
with the matrix form of �piaTi , where ai represents the vectors in row i excluding aii. This reflects
the first-round effect of a price shock in the upstream industry.The price rise of other products incurred by the initial price surge in industry i will gradually
lead to the ripple effects on other industries. The overall inflationary effects of the initial priceshock can be summarized into
�pi[aTi + AaT
i + (A2)TaTi + (A3)
TaTi . . .] = �pi(1 − AT )
−1aTi
This is the famous Leontief’s inversion method (Leontief, 1986). It represents both the directand indirect impacts of a price shock, initiated from industry i on other industries. The Leontief’sinversion method enables us to calculate the total effect of a price shock. In order to further analyzethe marginal changes in price level under oil-price shocks, we will adopt the iteration method tosimulate the gradual price change during an oil-price shock.
3.2. Partial transmission input–output model
As the traditional IO model reflects the inflationary effect of a price shock in an ideal world,the ultimate impact of the initial price surge is certainly not as significant and swift as the modelindicates, due to a number of factors, such as market competition pressure, technology innovation,and energy substitution. Most notably, price control policies on certain commodities are stillimplemented in China today, suggesting that the need to modify the traditional IO model to betterreflect the real economy and derive the realistic results. In this section, we will introduce somenew concepts into the traditional IO model. Specifically, we will incorporate the “frictions” inChina’s price transmission mechanism into the traditional IO model, quantify the impacts of suchfrictions and thus better simulate the price pass-through during an oil-price shock.
3.2.1. Capability of transmitting costSince the real price adjustment scale may not be as great as the cost increase level, we use the
ratio of “real price increase” to “ideal price increase” to reflect the capability of an industry intransmitting its cost pressure to downstream industries. Here the “ideal price increase” equals theweighted average cost increase, assuming that an upstream manufacturer can fully transmit itscost increase to downstream manufacturers. The cost increase for each input is derived from CPIindices, while the cost weights for each industry are obtained from the corresponding columns

L. Wu et al. / Journal of Policy Modeling 35 (2013) 354–369 359
in the IO direct requirement tables. We term this ratio as the capability of transmitting cost(CTC).1
We denote �rpj as the real price increase, and∑n
i=1piaij as the weighted cost increase or“ideal price increase”. Therefore, the capability of transmitting cost (CTC) can be written as
CTCj = �rpi∑n
i=1�piaij
CTC is a row vector. Intuitively, the greater the capability of transmitting cost, the industryis more capable of excising cost pressure to other industries by raising its price. The empiricalresults of CTC are shown in Section 4. Given the numbers of CTC, we can understand under acertain level of cost increase, how producers are capable of transmitting their cost pressure or bywhat level they can raise their prices.
3.2.2. Partial transmission IO modelArguably, CTC contains valuable information regarding frictions in price transmission mech-
anism. In light of this, our next step is to modify the “direct requirement table” by using the CTCmatrix. By using the modified direct requirement table, our aim is to create a “partial transmissionIO model”, which considers price transmission frictions on top of IO relations between industries.
The modified direct requirement table is denoted as A′
A′ij = CTCT
j · Aij
and
a′ij = CTCj · aij
A′ is obtained by multiplying every coefficient in the original direct requirement table bythe corresponding “capability of transmitting cost” of the output industry. Using the modifieddirect requirement table A′, the total impact of an oil-price shock on inflation can be obtained bysummarizing all rounds of price shocks, calculated by means of
�pi[(a′i)
T + A′T (a′i)
T + (A′2)T
(a′i)
T + (A′3)T
(a′i)
T. . .]
Here,
a′ij = CTCj · aij
a′ij contains information from both sides: the cost composition (from the original direct require-
ment coefficient) and the capability of transmitting cost for each industry. For example, when costof the ith input of the jth industry increases by x%, with all other costs remaining unchanged,it will increase the cost of the jth industry by (x × aij) percent; since the jth industry is onlycapable of transmitting CTCj (in percentages) of its cost rise, the initial price increase shouldbe (x × aij × CTCj), i.e. (x × a′
ij). This initial price increase will then spread into other indus-tries, thus resulting in a cost-driven inflation. Because this new IO model reflects baffled pricetransmission mechanism in reality, we call it the “partial transmission input–output model”.
1 Ren et al. (2008) introduce the concept of “capability of transmitting cost” in order to illustrate the capability of differentindustries in transmitting cost pressure during inflation. Here we broaden the scope of its application by incorporatingCTC into the traditional IO model to create the “partial transmission IO model”.
360 L. Wu et al. / Journal of Policy Modeling 35 (2013) 354–369
3.3. Multi scenario analysis
With the partial transmission IO model introduced above, we will now develop two scenarios,using data from both China and the US, in an effort to identify factors in blocking price pass-through during oil-price shocks. We take the US as a reference because it is considered as thefreest market in the world, with little intervention from the government. Most of the frictions inprice transmission in the US result from the market itself, rather than price control policies of thegovernment. On the contrary, the baffled price transmission mechanism in China is a result of bothgovernment intervention and market factors. Therefore, a comparison between China and the USscenarios can give us valuable information regarding the relative impact of different transmissionfrictions in price pass-through mechanisms.
3.3.1. Scenario I: complete transmissionUnder this scenario, we ignore the factors that baffle a price pass-through during an oil-price
shock, and use the traditional IO method to determine the maximum impact of an oil-price shockon general price level. Simulation results of a hypothetical 100% oil-price increase under thisscenario are derived using data from both China and the US (see Section 4).
3.3.2. Scenario II: partial transmissionUnder the assumption that price adjustment is baffled by distorted price mechanism, we use
the “partial transmission IO model” to simulate the inflation level during a hypothetical oil-priceshock. Arguably, simulation results in both countries under this scenario should be smaller andmore plausible compared with that under Scenario I.
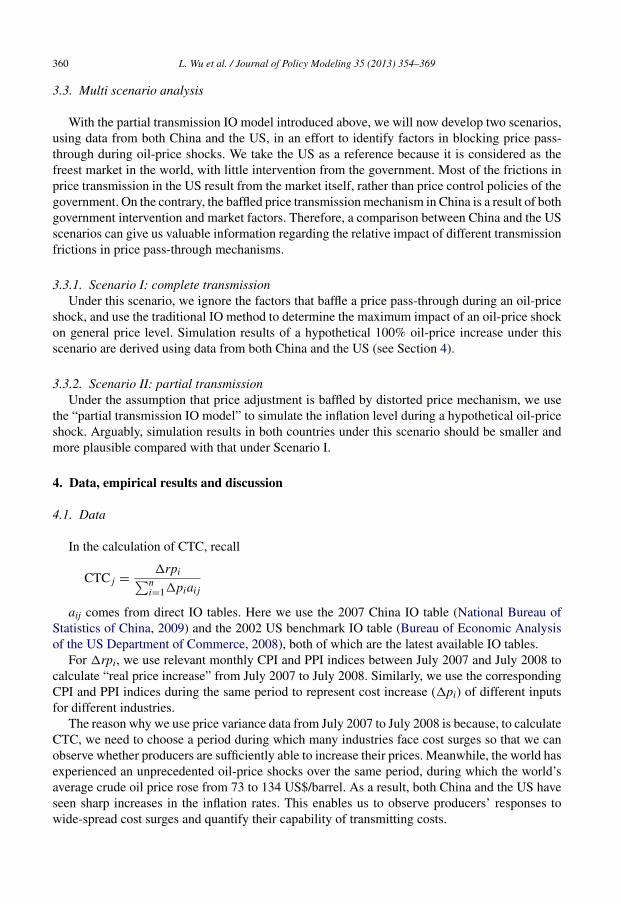
4. Data, empirical results and discussion
4.1. Data
In the calculation of CTC, recall
CTCj = �rpi∑n
i=1�piaij
aij comes from direct IO tables. Here we use the 2007 China IO table (National Bureau ofStatistics of China, 2009) and the 2002 US benchmark IO table (Bureau of Economic Analysisof the US Department of Commerce, 2008), both of which are the latest available IO tables.
For �rpi, we use relevant monthly CPI and PPI indices between July 2007 and July 2008 tocalculate “real price increase” from July 2007 to July 2008. Similarly, we use the correspondingCPI and PPI indices during the same period to represent cost increase (�pi) of different inputsfor different industries.
The reason why we use price variance data from July 2007 to July 2008 is because, to calculateCTC, we need to choose a period during which many industries face cost surges so that we canobserve whether producers are sufficiently able to increase their prices. Meanwhile, the world hasexperienced an unprecedented oil-price shocks over the same period, during which the world’saverage crude oil price rose from 73 to 134 US$/barrel. As a result, both China and the US haveseen sharp increases in the inflation rates. This enables us to observe producers’ responses towide-spread cost surges and quantify their capability of transmitting costs.

L. Wu et al. / Journal of Policy Modeling 35 (2013) 354–369 361
Table 1Ten Chinese industries with the highest CTCs and ten with the lowest CTCs.
Industries with the highest CTCs CTC Industries with the lowest CTCs CTC
Financial services 13.18 Information, computer services andsoftware
−1.03
Oil and gas extraction 8.37 Communications equipment,computer and other electronicinstrument manufacturing
−0.96
Waste products and materials 5.75 Culture, sports and entertainment −0.29Agriculture, forestry, fishing and herding 4.46 Post services 0.00Coal mining 4.01 Electric power, heat generation,
transmission and distribution0.15
Metal ores mining 3.55 Transportation equipmentmanufacturing
0.16
Nonmetallic mineral mining and quarrying 2.39 Device, office equipmentmanufacturing
0.16
Real estate 2.06 Chemistry 0.24Health, social security and social benefit 1.53 Electronic equipment manufacturing 0.24Research and experiment 1.52 Natural gas manufacturing and
distribution0.27
4.2. Capability of transmitting cost
As would be expected, the CTC coefficients vary from one industry to another, with patternwidely differentiated between China and the US.
As shown in Tables 1 and 2, the industries “oil and gas extraction” of both countries areamong the top-10 CTC list, indicating that oil and gas prices are more driven by demand factorsrather than cost turbulences. However, China has more mining industries on the top-10 CTC list(coal mining, metal ores mining, etc.), implying a better bargaining power of upstream energy
Table 2Ten US industries with the highest CTCs and ten with the lowest CTCs.
Industries with the highest CTCs CTC Industries with the lowest CTCs CTC
Securities, commodity contracts,investments, and related activities
31.18 Computer and peripheral equipmentmanufacturing
−262.50
Oil and gas extraction 24.60 Funds, trusts, and other financial vehicles −3.95Monetary authorities, credit intermediation
and related activities13.88 Owner-occupied dwellings −2.89
Legal services 10.87 Travel arrangement and reservationservices
−2.43
Water, sewage and other systems 10.59 Lesser of nonfinancial intangible assets −2.13Automotive equipment rental and leasing 10.55 Telecommunications −2.04Real estate 8.72 Semiconductor and other electronic
component manufacturing−1.74
Rail transportation 7.71 Audio, video, and communicationsequipment manufacturing
−1.37
Wholesale trade 7.39 Radio and television broadcasting −0.96Management, scientific, and technical
consulting services7.17 Computer systems design and related
services−0.43

362 L. Wu et al. / Journal of Policy Modeling 35 (2013) 354–369
producers in China. Financial services and real estate industry have similar high levels of CTCs inboth China and the US, consistent with the common sense that these industries set prices accordingto the benchmark price level (often set by influential manufacturers in the industry), rather thantheir costs. As for industries with the lowest CTCs, China and the US follow more or less thesame pattern: information-related industries occupy most of the list; their negative CTCs implythat prices in these industries are mostly irrelevant with their manufacturing costs, revealing theirvulnerability under a general price surge.
While some industries have CTCs well above 1 (notice those industries with the highestCTCs), other industries have very low CTCs (far less than 1), indicating little discretion in priceadjustment under oil-price shocks. The reason behind manufacturers raising prices beyond costhikes is indeed very complex. While the cost of production is among the most important factorsin pricing, other factors cannot be neglected. For example, price turbulence in global market,demand surge in local market, perceived reliability of supply and supply disruption as a result ofnatural disasters and other unexpected events, either individually or in combination, would leadto dramatic price hikes where the cost of production has not markedly increased. Moreover, it islikely that industries having CTC larger than 1 would have taken advantage of cost hikes (e.g.oil-price shocks) by excessively adjusting their price (compared with their cost rise levels).
The phenomenon of “over-shooting” under oil-price shocks is intriguing in itself; but it goesbeyond the scope of this paper. As mentioned above, we intend to focus on industries where pricetransmission has been baffled, given that IO types of models implicitly exclude the possibility ofdemand-driven inflation. Consequently, we will only pay attention to industries with CTC lessthan 1, leaving those “over-shooting” industries to future studies. Accordingly, for industries withCTC coefficients larger than 1, we adjust them to 1, implying that manufacturers will adjust theirprice no greater than the level of their cost surge.
As for most industries with CTCs less than 1, it is clear that many manufacturers are notcapable of fully transmitting cost to their customers. The reason behind a partial transmission inChina during oil-price shocks can be attributed to such factors as price control, market factorsand technology substitution, each being briefly explained below.
4.2.1. Price controlPrice control policy in China targets two kinds of commodities: fundamental resources and
CPI-indexed commodities. This policy is enforced in efforts to control inflation and preventmonopoly from encroaching on the public interest. While price control policy is implemented outof goodwill and is arguably helpful in mitigating the impact of price shocks, it has made priceextremely rigid and has kept industries from quickly reacting to cost shocks.
4.2.2. Market factorsEven in a market free of price control (like the US), producers still cannot fully transmit cost
increases to their customers. This can result from several factors, market competition pressurebeing among one of them. For example, producers may want to keep their price level unchangedor even lower (as is the case in information industries), which have negative CTCs for both Chinaand the US,2 so as to remain competitive in the market, even if their costs have been increased.There are also possibilities that demand elasticity is extremely high. Therefore a slight rise in
2 This implies that manufacturers lower their prices when costs rise. This may result from the highly competitive natureof information industry. Prices of new products tend to drop after hitting on the market.

L. Wu et al. / Journal of Policy Modeling 35 (2013) 354–369 363
price will cause huge decrease in demand, which deters producers from lifting their prices. Inother cases, prices may be set beforehand in annual contracts; therefore producers are prohibitedfrom raising prices, even when their costs have been markedly increased.
4.2.3. Technology substitutionIn an economy that is frequently and severely attacked by oil-price shocks, producers will
gradually find ways to adapt and counteract the negative influence of oil-price shocks by improvingtheir manufacturing technologies. For example, they can use renewable energies instead of oil,or adopt technologies with higher energy efficiency. The technology substitution efforts madeby producers will help cut costs and therefore curb inflation during oil-price shocks. However,this effect cannot be realized in the short term, especially when we consider the slow pace oftechnology advancement in China today.
4.3. Oil-price shocks and general price levels
4.3.1. General price levelApplying both complete and partial transmission IO model to China and the US would enable
us to simulate price changes of different industries under two scenarios when crude oil pricedoubles, namely, increases by 100%. The IO table provides us with the composition of the finalresidential consumption. By using this data as the weighting number, we can have the weightedaverage “general price level” changes under a hypothetical oil-price shocks. However, it should bepointed out that, although this number offers meaningful information regarding how consumersare affected during oil-price shocks, the so-called “general price level” is still not equal to the CPIdue to different statistical approach.
4.3.2. Simulation resultsIn an ideal world, China will experience a 4.91% increase in general consumer price level under
a doubling of oil price after 10 iterations (China, Scenario I). However, after the pass-throughfriction is taken into consideration, the general price level surge will be significantly mitigated to1.39% (China, Scenario II). Also, if the price transmission is complete, the US will see a 1.80%rise in its general consumer price level (US, Scenario I), while the price level rise will slightlydecrease to 1.30% in a partial transmission IO model (US, Scenario II) (Fig. 1).
Fig. 1. Simulation results of an input–output analysis for China and the US.

364 L. Wu et al. / Journal of Policy Modeling 35 (2013) 354–369
4.4. Discussion
Generally speaking, the impact of oil-price shocks on price level depends on five major factors:industrial structure, oil intensity, market factors, price control, and technology substitution. Intu-itively, an economy relying more on manufacturing industry than service industry is more proneto oil-price shocks. Likewise, an economy with higher oil intensity is more vulnerable to oil-priceshocks than those with less oil dependence. In a market with less favorable market conditionwhere competitions are more intensified, manufacturers may feel reluctant to raise prices in orderto pass through the impact of oil-price shocks. However, the price control policy distorts pricemechanism and mitigates the short-term impact of oil-price shocks on price levels. Moreover,the quick adaption to oil-price shocks by technology substitution will help businesses overcomeoil-price shocks without raising prices.
In order to understand the impact of the aforementioned factors, we categorize the above fivefactors into two groups: group A (industrial structure and energy intensity) and group B (marketfactors, price control, and technology substitution). While the information of factors in groupA can be found in IO table, the information contained in group B are embodied in our CTCcoefficients (see Table 3).
With simulation results in the above two scenarios for China and the US, we now arrange thesetwo groups of factors into the following numerical relationships:
Ac1 · Ac
2 = 4.91% (1)
Ac1 · Ac
2 · Bc1 · Bc
2 · Bc3 = 1.39% (2)
Au1 · Au
2 = 1.80% (3)
Au1 · Au
2 · Bu1 · Bu
2 · Bu3 = 1.30% (4)
Combining Eqs. (1) and (2), as well as Eqs. (3) and (4), we have
Bc1 · Bc
2 · Bc3 = 28.31%, Bu
1 · Bu2 · Bu
3 = 72.22%
Here the residual value of (1 − B1 · B2 · B3) shows us the level of inflation that will be mitigatedby taking factors in group B (market factors, price control, and technology substitution) intoconsideration. Based on our calculations, the combination of market factors, price control andtechnology substitution will push the inflation rate in China down by 71.69% (1 − Bc
1 · Bc2 · Bc
3),while these three factors will mitigate the inflation rate in the US only by 21.78% (1 − Bu
1 ·
Table 3Simulation results and the five major factors in determining the impact of oil-price shocks.
Simulationresults
Major factors in determining the impact of oil-price shocks
Industrialstructure (A1)
Oil intensity(A2)
Marketfactors (B1)
Pricecontrol (B2)
Technologysubstitution (B3)
China Scenario I 4.91% Ac1 Ac
2China Scenario II 1.39% Ac
1 Ac2 Bc
1 Bc2 Bc
3The US Scenario I 1.80% Au
1 Au2
The US Scenario II 1.30% Au1 Au
2 Bu1 Bu
2 Bu3
Note: Superscripts “u” and “c” represent the US and China, respectively.

L. Wu et al. / Journal of Policy Modeling 35 (2013) 354–369 365
Fig. 2. Terms of trade indices for China and the US, 1980–2009.Source: UNCTAD (2010).
Bu2 · Bu
3). Also, the difference between Ac1 · Ac
2 (4.91%) and Au1 · Au
2 (1.80%) shows that the lessindustry-oriented economic structure and lower oil intensity in the US help mitigate inflation by3.11% in absolute terms or 63.34% in relative terms.
To further separate the impact of price control from other factors, we need to examine thesefactors more closely. To that end, we need to make the necessary assumptions.
4.4.1. Technology substitutionIdeally, in the face of an oil shock, some manufacturers may counteract the negative impact
through technical innovation, by adopting less oil-intensive technology and/or substituting oilwith other types of energies. Using substituted technology to mitigate the impact of oil-priceshocks is based on two prerequisites: adequate technology competency and quick technologytransformation pace. Although the reoccurring oil-price shocks have prodded industries to findalternative energies or develop more oil-efficient technologies, it will usually take quite sometime before the technologies come to commercialization. Therefore, the effect of technologysubstitution may not be reflected during the current round of an oil-price shock, but will helpcounteract the risks in the oil shocks in the future. In light of this, we assume that the factor of“technology substitution” can be neglected in the near term, both in the US and in China, namely,Bu
3 = Bc3 = 100%.
4.4.2. Market factorsMarket factors, such as willingness to remain competitive, high price elasticity and fixed
contracts, are the major causes behind partially price pass-through, especially for a free marketslike the US. The significance of market factors in determining oil price pass-through is dependentvery much on the bargaining power of different industries. In a market where competitions arehighly intensive or where products are of very high price elasticity, suppliers are expected to havelower bargaining power and are more likely to bear the cost during oil-price shocks or sign fixedcontracts which expose themselves to future cost shocks.
The terms of trade index compares export price change with import price change. A rise inthe index means that relative export price increase exceeds relative import price increase; in otherwords, the trade condition is in favor of the exporting country with a rise in the bargaining powerin international trade. Enlightened by this, we employ the terms of trade index published by theUNCTAD (2010) to quantify the relative bargaining power of the overall economy for China andthe US.

366 L. Wu et al. / Journal of Policy Modeling 35 (2013) 354–369
As shown in Fig. 2, the terms of trade index of the US is 24% higher than that of China in2008, implying that industries in the US have greater bargaining power than those in China. Inother words, it is more difficult for industries in China to pass through the cost pressure.
With this in mind, we assume that the retardant effect of market factors in China is 24% greaterthan that of the US, assigning Bu
1 = (1 + 24%) · Bc1. Meanwhile, the technology substitution factor
can be neglected in the short term, and no price control policy is enforced in the US, i.e.
Bu2 = 100%, Bu
3 = Bc3 = 100%
We have
Bu1 = 72.22%, Bc
1 = 58.24%, Bc2 = 48.61%
The results show that the market factors in the US and China account for a 21.78% and 41.76%decrease in the inflation rate respectively, implying that China’s market is more stagnated thanthat of the US in terms of transmitting the cost pressure during oil-price shocks. Meanwhile, theprice control mitigates inflation by 51.39%, indicating that price control in China significantlyprevents producers from passing through their costs during oil-price shocks.
5. Policy implications
Our empirical results have shown that China’s price control policy significantly lowers thecapability of China’s industries in price pass-through during oil shocks. This policy prevents oilshocks from quickly spreading into downstream industries and thus helps curb inflation in theshort term. However, effective as it is, the side effects of price control are very destructive for theeconomy.
First of all, the policy distorts price adjustment mechanism. When international oil price surges,domestic oil price will not rise simultaneously, due to an adjustment lag caused by oil pricecontrol. With domestic oil prices remain unchanged, manufacturers will increase their demandfor oil products, since they expect oil price to rise in the near future. Consequently, oil pricecontrol turns the price elasticity of downstream manufacturers from negative to positive; thehigher the international oil prices, the higher the demand, the larger the discrepancy betweendemand and supply for oil products. Price control in fact prevents the economy from reachingmarket equilibrium by itself.
Secondly, price control causes manipulation and probably amplifies the overall inflationaryeffect. The widening gap between oil supply and demand would prod manipulation activities,driving prices in black markets higher and higher. This, in turn, increases price expectation in theregulated market and exaggerates oil shortage crisis, adding enormous pressure on policy makers.When the oil price control is eventually relaxed, the oil price is sometimes increased more thanenough to cover the original international oil price surge, due to higher demand for oil products.From an economic point of view, the resulting inflation is both pushed by cost and pulled bydemand. As a result, although oil price control can delay the impact of oil shocks on inflation inthe short term, it is possible that the overall inflationary effect is greater than that without oil pricecontrol, especially in the long term, when the expectation of oil price rise is fully realized.
Thirdly, price control discourages technical innovation. Ideally, in a market where oil pricepass-through is very difficult, manufacturers will be seriously hit by oil shocks. In order to mitigatethe negative impact, they will try to find alternative technologies. While in a market where pricemechanism is less stagnated and manufacturers manage to pass through the cost impact, customerswill choose products using less oil since their prices are less affected by oil shock. A combination

L. Wu et al. / Journal of Policy Modeling 35 (2013) 354–369 367
of the two factors encourages producers to adopt new technologies. By contrast, because of oilprice control in China, the domestic oil price fails to respond to international oil price surge in theshort term. Therefore, downstream manufacturers have less incentive to reduce oil intensity. As aresult, as the inflationary effect of oil shocks fully comes into play, the producers will be seriouslyhurt in the long term, since they are not fully prepared due to rigidness in oil price pass-through.
Last but not least, price control squeezes business profits and lower investment incentives.During an oil shock, price control on oil products will gradually erode the profits of oil producers,with enlarging discrepancy between imported oil price and domestic oil price. After the govern-ment adjusts the domestic oil price, however, downstream manufacturers will gradually feel thecost pressure when the price shock is gradually transmitted through the industry chain. However,for those producers of CPI-indexed commodities under price control, they are incapable of furthertransmitting cost increase. Consequently, investment in those industries will be largely cut back,which will in turn have a negative impact on the upstream industries. As a result, the investmentincentives within the whole economy will be greatly diminished, thus leading to lower chancesof survival for individual business and slower recovery aftermath for the whole economy.
All the aforementioned taken into account, although price control can offset the impact of oil-price shocks in the short term, it in fact distorts price mechanism, exaggerates long-term inflationeffect, discourages technical innovation and dampens investment incentives. Thus, instead ofimposing a price control policy on commodities, efforts towards reducing energy intensity andadjusting industrial structure can be taken as a more persistent and instructive policy tool incombating inflation during oil-price shocks (less industrial structure and lower oil intensity in theUS help mitigate inflation by 63.34%, compared with China).
In addition, lack of bargaining power is another major reason behind China’s unsuccessful oilshock pass-through (market factor decreases the inflation rate by 41.76% for China). In light ofthis, industrial upgrading can be considered as another long-term solution to mitigate the impactof oil shocks on China’s economy. It should be emphasized that the consequence of relaxingprice control combined with efforts in reducing energy intensity, adjusting industrial structureand industrial upgrading is not as terrible as some may expect. As shown in our study, in a freemarket economy like the US, a 100% oil-price increase will only raise the inflation rate by 1.30%,which is even lower than our simulation results of China (1.39%) under price control.
6. Conclusions
China’s oil imports have accounted for over half of its total oil consumption and the oil intensityof its economy is still very higher than that of industrialized countries. A combination of the twofactors would make China’s economy vulnerable to world oil-price shocks. However, China hadmanaged to maintain its growth momentum with its CPI less influenced during the 2007–2008oil-price shock. In this paper, we attempt to understand China’s less vulnerability to oil-priceshocks by investigating the price control policy in China. To that end, we tailor the traditionalIO analysis according to China’s uniqueness. Taking into consideration the baffled price pass-through mechanism in reality, we incorporate the capability of transmitting cost into the direct IOtable and develop a partial transmission IO model. This new approach reflects the frictions in aprice transmission process and thus enables us to better simulate the cost-driven inflation duringoil-price shocks.
Our simulation results show that under an ideal scenario China will experience a 4.91% increasein general price level when oil price doubles; the inflation rate will drop significantly to 1.39%,after factoring in the transmission friction. By contrast, the inflation rate in the US will only

368 L. Wu et al. / Journal of Policy Modeling 35 (2013) 354–369
decrease from 1.80% under a complete transmission scenario to 1.30% under a partial transmissionscenario.
To further identify the factors in determining the impact of oil-price shocks, we divide thosefactors into industrial structure, oil intensity, market factors, price control, and technology substi-tution, and incorporate the five factors into the traditional IO model. Under the several reasonableassumptions, we find out that the less industry-oriented economic structure and lower oil inten-sity in the US help mitigate inflation by 3.11% in absolute terms or 63.34% in relative terms.Meanwhile, the market factors (including fierce competition, high demand elasticity, fixed con-tract, etc.) in the US and China account for a 21.78% and 41.76% decrease in the inflation rate,respectively; and the price control in China mitigates inflation by 51.39%.
Based on our quantitative results, we can draw the following conclusions. First, reducingoil intensity and adjusting industrial structure can be taken as a persistent and guiding policytool in curbing inflation during oil-price shocks. Secondly, lack of bargaining power is anothermajor reason behind China’s partial oil price pass-through. Therefore, industrial upgrading isanother long-term solution to mitigate the impact of oil-price shocks on China’s economy. Thirdly,although price control offsets the impact of oil-price shocks in the short term, it distorts priceadjustment mechanism, exaggerates long-term inflation effect, discourages technical innovationand dampens investment incentives. Consequently, relaxing price control is a necessary steptowards making price pass-through mechanism work in China. Finally, the consequences ofrelaxing price control as well as other recommended policies are acceptable and controllable.Our simulation results show that in a free market economy like the US, the inflation rate under adoubling of oil price rises even less than our simulation results of China under price control.
Acknowledgments
This paper has benefited from helpful comments from Antonio Maria Costa and anonymousreferees. That said, the views expressed here are those of the authors. The authors bear soleresponsibility for any errors and omissions that may remain.
References
Atkeson, A., & Kehoe, P. J. (1999). Models of energy use: Putty–putty versus putty–clay. American Economic Review,89, 1028–1043.
Berument, H., & Tasci, H. (2002). Inflationary effect of crude oil prices in Turkey. Physica A, 316(1–4), 568–580.Brown, S. P. A., & Yücel, M. K. (2002). Energy prices and aggregate economic activity: An interpretative survey. Quarterly
Review of Economics and Finance, 42, 193–208.Burbidge, J., & Harrison, A. (1984). Testing for the effects of oil-price rise using vector autoregressions. International
Economic Review, 25, 459–484.Bureau of Economic Analysis of the US Department of Commerce. (2008). 2002 benchmark input–output data.
http://www.bea.gov/industry/io benchmark.htm.Carter, A. P. (1974). Applications of input–output analysis to energy problems. Science, 184(4134), 325–329.Chen, S. S. (2009). Oil price pass-through into inflation. Energy Economics, 31, 126–133.Cunado, J., & de Gracia, F. P. (2003). Do oil price shocks matter? Evidence for some European Countries. Energy
Economics, 25(2), 137–154.Du, L. M., He, Y. N., & Wei, C. (2010). The relationship between oil price shocks and China’s macro-economy: An
empirical analysis. Energy Policy, 38(8), 4142–4151.Faria, J. R., Mollick, A. V., Albuquerque, P. H., & León-Ledesma, M. A. (2009). The effect of oil price on China’s exports.
China Economic Review, 20(4), 793–805.Giarratani, F. (1976). Application of an inter-industry supply model to energy issues. Environment and Planning A, 8,
447–454.

L. Wu et al. / Journal of Policy Modeling 35 (2013) 354–369 369
Guivarch, C., Hallegatte, S., & Crassous, R. (2009). The resilience of the Indian economy to rising oil prices validationtest for global energy–environment–economy CGE model. Energy Policy, 37, 4259–4266.
Herrera, A. M., & Pesavento, E. (2009). Oil price shocks, systematic monetary policy, and the “great moderation”.Macroeconomic Dynamics, 13(1), 107–137.
Huang, Y., & Guo, F. (2007). The role of oil price shocks on China’s real exchange rate. China Economic Review, 18(4),403–416.
IEA. (2010). World energy outlook 2010. Paris: International Energy Agency (IEA).Jongwanich, J., & Park, D. (2009). Inflation in developing Asia. Journal of Asian Economics, 20, 507–518.Kerschner, C., & Hubacek, K. (2009). Assessing the suitability of input–output analysis for enhancing our understanding
of potential economic effects of peak oil. Energy, 34, 284–290.Lardic, S., & Mignon, R. (2006). The impact of oil prices on GDP in European countries: An empirical investigation
based on asymmetric cointegration. Energy Policy, 34, 3910–3915.Leduc, S., & Sill, K. (2004). A quantitative analysis of oil price shocks, systematic monetary policy and economic
downturns. Journal of Monetary Economics, 51(4), 781–808.Lee, K., & Ni, S. (2002). On the dynamic effects of oil price shocks: A study using industry level data. Journal of Monetary
Economics, 49, 823–852.Lee, B. R., Lee, K., & Ratti, R. A. (2001). Monetary policy, oil price shocks, and the Japanese economy. Japan and the
World Economy, 13(3), 321–349.Leontief, W. (1986). Input–output economics. Cambridge: Oxford University Press.Lin, B., & Wang, F. (2009). Impact of oil price shock on China’s aggregate price level. Economic Study, 66–79.Liu, Q., & Ren, Z. (2006). Estimation and empirical study on price impact model. China Price, 12, 35–40.Mork, K. A., Olsen, O., & Mysen, H. T. (1994). Macroeconomic responses to oil price increases and decreases in seven
OECD countries. Energy Journal, 15, 19–36.National Bureau of Statistics of China. (2009). 2007 input–output tables of China. Beijing: China Statistics Press.Pindyck, R. S., & Rotemberg, J. J. (1983). Dynamic factor demands and the effects of energy price shocks. American
Economic Review, 73, 1066–1079.Ren, Z., Pan, W., & Liu, Q. (2007). Crude oil price effects on China’s price level based on input–output price model.
Statistical Research, 24(11), 22–28.Ren, Z., Yang, J., & Wu, K. (2008). Inflation’s impact on industrial climate based on CTC model. Statistical Research,
25(10), 46–53.Tang, W. Q., Wu, L. B., & Zhang, Z. X. (2010). Oil price shocks and their short- and long-term effects on the Chinese
economy. Energy Economics, 32, S3–S14.United Nations Conference on Trade and Development (UNCTAD). (2010). Merchandise trade indices,
annual, 1980–2009 – terms of trade indices. Geneva: UnctadStat. http://unctadstat.unctad.org/TableViewer/tableView.aspx?ReportId=119
Wu, L. B., Tang, W. Q., & Sun, L. J. (2011). The characteristics of oil price fluctuation since this century. EconomicReview, 4, 51–54.
Zhang, Z. X. (2010). China in the transition to a low-carbon economy. Energy Policy, 38, 6638–6653.Zhang, Z. X. (2011a). China’s energy security, the Malacca dilemma and responses. Energy Policy, 39, 7612–7615.Zhang, Z. X. (2011b). In what format and under what timeframe would China take on climate commitments? A roadmap
to 2050. International Environmental Agreements: Politics, Law and Economics, 11(3), 245–259.Zhang, Z. X. (2011c). Energy and environmental policy in China: Towards a low-carbon economy. Cheltenham, UK and
Northampton, USA: Edward Elgar.