Inflation Targeting in an Uncertain External Backdrop Lynch - Emerging Markets...Inflation Targeting...
35
1 Inflation Targeting in an Uncertain External Backdrop Mário Mesquita October 2008 Inflation Targeting in an Uncertain External Backdrop Mário Mesquita October 2008
Transcript of Inflation Targeting in an Uncertain External Backdrop Lynch - Emerging Markets...Inflation Targeting...

1
Inflation Targeting in an Uncertain External Backdrop
Mário MesquitaOctober 2008
Inflation Targeting in an Uncertain External Backdrop
Mário MesquitaOctober 2008

2
I. An Uncertain External Backdrop
3
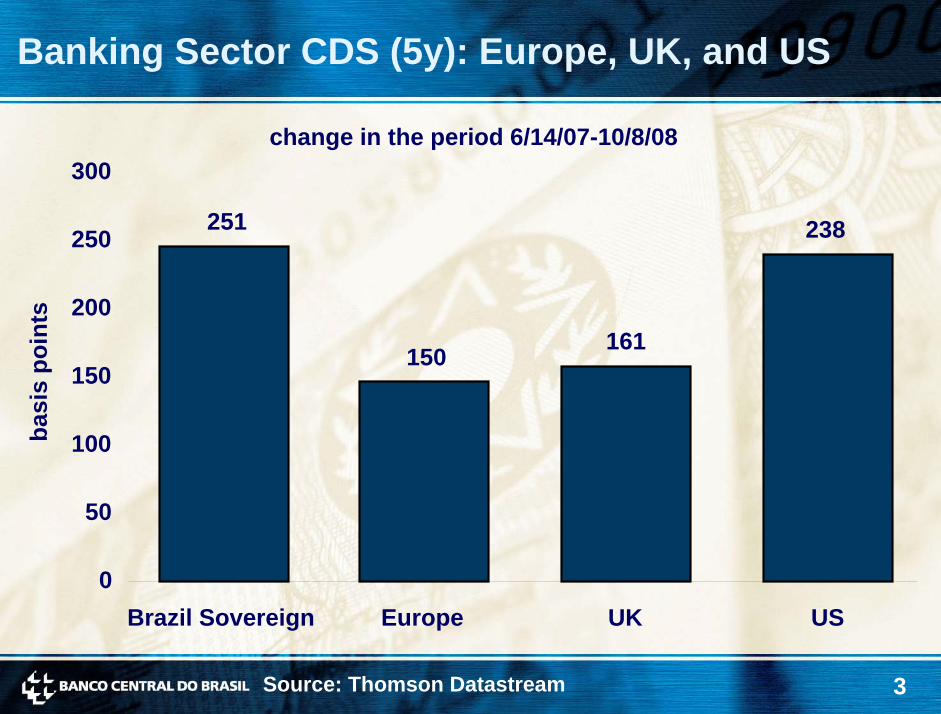
Banking Sector CDS (5y): Europe, UK, and US
change in the period 6/14/07-10/8/08300
Source: Thomson Datastream
basi
s po
ints
251 238250
200161150
150
100
50
0Brazil Sovereign UK USEurope

4
Ibovespa x Global Stock Exchange Indices
change in the period 6/14/07-10/10/085
MumbayShanghai CAC 40Nikkei FTSEDAX S&P HangSeng
Ibovespa IBEX 355
% c
hang
e
15
25
35
45
55Japan France UK Brazil Hong
KongChina Germany USA Spain India
Source: Bloomberg

5
Stock Price Indices: Banking Sector
change in the period 6/14/07-10/8/080
-49-51 -51
-10
% c
hang
e
-20
-30
-33-40
-50
-53-60
Brazil US UK Japan EuropeanUnion

6
Country Risk and Risk Aversion Index (RAVI)
BRL floating
basi
s po
ints
Russian crisis ARS floating
Brazil confidence crisis
subprime “first strike”
subprime “second strike”
credit crisis
0
500
1000
1500
2000
2500
-2.2
-1.2
-0.2
0.8
1.8
2.8
3.8
EMBI+ EMBI+ BR IARJan May Oct Feb Jul Nov Apr Aug Oct*98 99 00 02 03 04 06 07 08
Sources: JP Morgan Chase and Merrill Lynch *up to 10/8

7
CDS (5y): LatAm
Brazil
Argentina
Venezuela
Mexico
Latin
Chile0
200
400
600
800
1000
1200
1400
1600
6/14 7/21 8/27 10/3 11/912/16 1/22 2/28 4/5 5/12 6/18 7/25 8/31 10/8
18006/14/07-10/8/08
basi
s po
ints
Source: Thomson Datastream

8
CDS (5y): LatAm
change in the period 6/14/07-10/8/081800
15891600
basi
s po
ints
1400
1200 1069
1000
800 639600
400 251218187200
0Chile BrazilMexico LatinArgentinaVenezuela
Source: Thomson Datastream
9
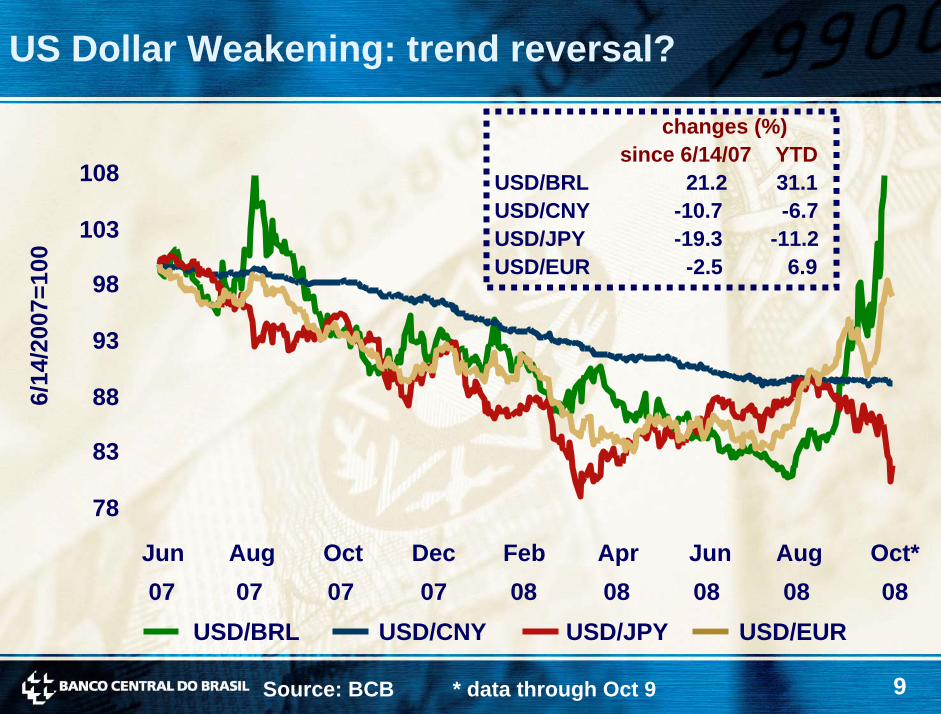
US Dollar Weakening: trend reversal?
changes (%)since 6/14/07 YTD
USD/BRL 21.2 31.1USD/CNY -10.7 -6.7USD/JPY -19.3 -11.2USD/EUR -2.5 6.9
108
6/14
/200
7=10
0
103
98
93
88
83
78
Jun Aug Oct Dec Feb Apr Jun Aug Oct*07 07 07 07 08 08 08 08 08
USD/BRL USD/CNY USD/JPY USD/EUR
Source: BCB * data through Oct 9

10
CPIs and Food Inflation - Selected Countries12
mon
th-a
ccum
ulat
ed %
CPI99 00 01 02 03 04 05 06 07
China **
-12-7-238
1318
Jan Jan Jan Jan Jan Jan Jan Jan Jan Aug08
Brazil
-505
1015202530
Jan99
Jan00
Jan01
Jan02
Jan03
Jan04
Jan05
Jan06
Jan07
Aug08
USA*
0.51.52.53.54.55.56.5
Jan99
Jan00
Jan01
Jan02
Jan03
Jan04
Jan05
Jan06
Jan07
Aug08
South Africa*
0
4
8
12
16
20
Jan99
Jan00
Jan01
Jan02
Jan03
Jan04
Jan05
Jan06
Jan07
Aug08
food inflation
Source: Datastream *CPI – Jul/08 **food inflation – Jul/08

11
II. Brazil: Increased Resilience to Shocks

12
Real Effective Exchange Rate
basket of 15 currencies180
99.4
160
Jun
94=1
00
140
120
100
80
60
Jan Jan Jan Jan Jan Jan Jan Jan Jan Jan Aug
88 90 92 94 96 98 00 02 04 06 08
Source: BCB

13
Current Account Balance
-33.4-28.8
-33.1
14.0
-1.9
-4.3 -4.2
-1.8
1.8
US$ bi
% of GDP
20 2
110
0
US$
bill
ion
0
% o
f GD
P-1-10
-2
-20-3
-30 -4
-5-4096 97 98 99 00 01 02 03 04 05 06 07 08* 09*
Source: BCB *2007: preliminary data; 2008/09: projection

14
Current Account/GDP
3210
% o
f GD
P
Source: BCB; 2008/09: projection
-8-7-6-5-4-3-2-1
1970
1972
1974
1976
1978
1980
1982
1984
1986
1988
1990
1992
1994
1996
1998
2000
2002
2004
2006
2008
2009
-1.8 -1.9

15
Net FDI vs. Current Account
current account
accumulated in 12 months
net FDI
40
30
20
US$
bill
ion 10
0
-10
-20
-30
-40Jan99
Jan00
Jan01
Jan02
Jan03
Jan04
Jan05
Jan06
Jan07
Aug08
Source: BCB

16
Trade Balance
12-month accumulated
exports
imports
US$
bill
ion
12-monthsurplus:
US$28.8 bi
194.9
166.1
40
80
120
160
200
Jan99
Jan00
Jan01
Jan02
Jan03
Jan04
Jan05
Jan06
Jan07
Jan08
Sep08
Source: MDIC

17
Diversification of Exports Markets: 2008
Exports (12m through September)
USA14.5%
others20.2%
European Union24.2%
LatinAmerica
23.1%
Asia (exc. Middle East)
18.0%
Source: MDIC

18
Diversification of Exports by Products: 2008
Exports (12m through September)
primary products
semi-manufacturedproducts
37.2%
manufactured products48.8%
14.0%
Source: MDIC

19
BCB Purchases in the FX Market
9078.6
2.3
-7.2 -9.1
1.6 5.3
21.5
34.329.7
75
60
US$
bill
ion
45
30
15
0
-152000 2001 2002 2003 2004 2005 2006 2007 2008*
Source: BCB *12m through August

20
BCB Purchases in the FX Market (Accumulated Flows since Jan 2004)
US$
bill
ion
157.8
0
20
40
60
80
100
120
140
160
Jan04
Jun04
Nov04
Apr05
Sep05
Feb06
Jul06
Dec06
May07
Oct07
Aug08
Source: BCB

21
Net FDI and Net Foreign Investment in Stocks and Short- and Long-Term Fixed-Income
45
net FDI
equities + long-term fixed income
short-term fixed income-5
5
15
25
35
US$
bill
ion
-15Jan99
Jan00
Jan01
Jan02
Jan03
Jan04
Jan05
Jan06
Jan07
Aug08
Source: BCB

22
International Reserves and Sovereign SpreadU
S$ b
illio
n
basi
spo
ints
reserves
avg EMBI+BR
Sources: BCB e JPMorgan Chase
0
300
600
900
1200
1500
1800
2100210
180
150
120
90
60
30
0
Jan May Sep Jan May Sep Jan Sep99 00 01 03 04 05 07 08
23
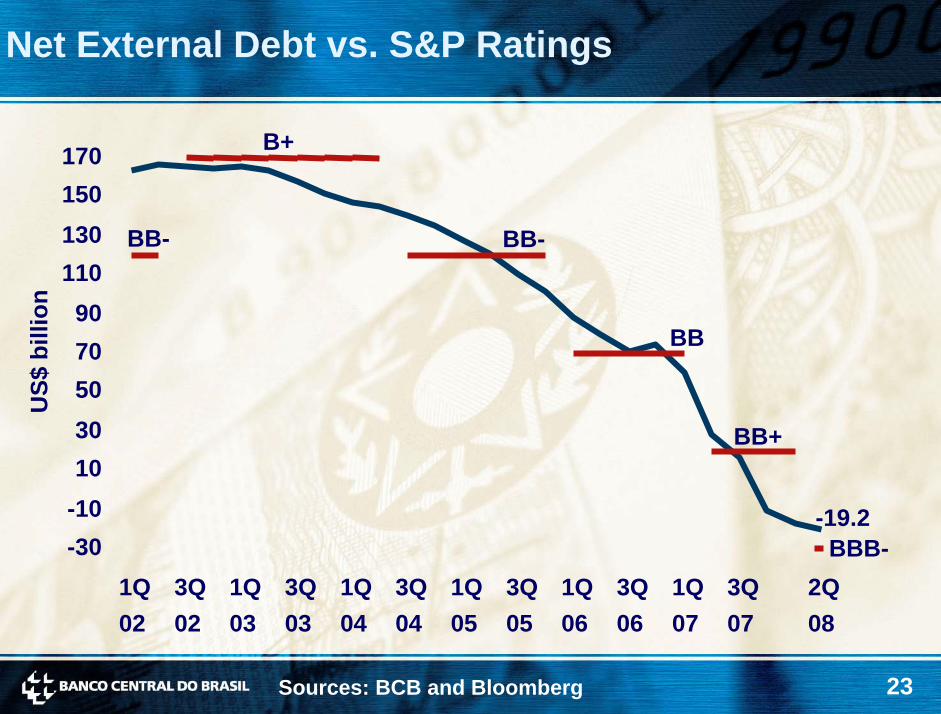
Net External Debt vs. S&P RatingsU
S$ b
illio
n
Sources: BCB and Bloomberg
BBB-
BB+
BB
BB-
B+
BB-
-19.2
170150130110
9070503010
-10-30
1Q02
3Q02
1Q03
3Q03
1Q04
3Q04
1Q05
3Q05
1Q06
3Q06
1Q07
3Q07
2Q08

24
External Sustainability Indicators
net external debt/exports net external debt/GDP
from 3.1 to -0.1* from 32.7 to –1.1%* 3.5 35
Source: BCB * Record low since the start of the series in 1970; 2008 – estimates.
%
(Aug)(Aug)
-0.5
0.0
0.5
1.0
1.5
2.0
2.5
3.0 30
25
20
15
10
5
0
-5
00 01 02 03 04 05 06 07 0800 01 02 03 04 05 06 07 08

25
External Vulnerability Indicators – Reserves
3006
reserves/short-term debt* (right)reserves/debt service (left)
96 98 00 02 04 06 08**95
2505
2004
%1503
1002
501
00
Source: BCB *includes medium- and long-term debt ammortizationsdue in the next 360 days. **estimates for August

26
Response of Debt/GDP Ratio to a 1% Exchange Rate Change
basi
spo
ints
-11.4-12
-8-4048
121620242832
Jan01
Jan02
Jan03
Jan04
Jan05
Jan06
Jan07
Aug08
Source: BCB

27
III. Brazil: Inflation Targeting in Practice

28
Contribution of Domestic and External Demandto GDP Growth
9 compared to the same quarter in the previous year
domestic demandexternal demand
8.08.5
-2.5-1.8
-2.6
8.6
7
5
3
%
1
-1
-3
-5
1Q03
3Q03
1Q04
3Q04
1Q05
3Q05
1Q06
3Q06
1Q07
3Q07
2Q08
Sources: IBGE and BCB

29
Inflation Targets
IPCA14IPCA (consensus)12.5targets12tolerance interval
%
10 9.38.9
0
2
4
6
8
1999
7.77.6
6.0
3.1
5.7
4.5
2000 2001 2002 2003 2004 2005 2006 2007
6.1 4.9
20092008
Source: BCB

30
IPCA Inflation
%
7.6
5.7
3.1
4.5
6.1
4.9
0
2
4
6
8
2004 2005 2006 2007 2008* 2009*
Sources: BCB and IBGE *market expectations (Oct 3)
% p
.m.
-0.3-0.2-0.10.00.10.20.30.40.50.60.70.80.9
avg. 2006:0.26%
avg. 2007:0.36%
avg. 2008:0.52%
avg. 2005:0.46%
Jan05
Jul05
Jan06
Jul06
Jan07
Jul07
Jan08
Sep08

31
Core Inflation
6-month moving average, annualized18
smoothednon-smoothed
exclusion16
14
12
% p
.a. 10
8
6
4
2
0Jan02
Jul02
Jan03
Jul03
Jan04
Jul04
Jan05
Jul05
Jan06
Jul06
Jan07
Jul07
Jan08
Sep08
Source: BCB

32
IPCA – 12-month change
6.509.5
non-tradables
services
%
6.258.56.00
7.55.75
% 5.506.5
5.255.55.00
4.54.75
4.503.5Jan Apr Jul Oct Jan Apr Sep07 07 07 07 08 08 08

33
IPCA Expectations and Target
15
central target
12-month IPCA expectations
upper limit
lower limit3
6
9
12
% p
.a.
0
Jan02
Jan03
Jan04
Jan05
Jan06
Jan07
Jan08
Jan09
Jan10
Dec10
Sources: BCB and IBGE

34
2009 IPCA Market Expectations
35Jul 31: 5.00Aug 29: 5.00Oct 3: 4.85
30
rela
tive
freq
uenc
y(%
)
25
20
15
10
5
0
<4.1 <4.3 <4.5 <4.7 <4.9 <5.1 <5.3 <5.5 <5.7 <5.9 <6.1
Source: BCB

35
Inflation Targeting in an Uncertain External Backdrop
Mário MesquitaOctober 2008
Inflation Targeting in an Uncertain External Backdrop
Mário MesquitaOctober 2008