Inflation and Unemployment.ppt
55
Inflation and Unemployment
-
Upload
shubham-agarwal -
Category
Documents
-
view
21 -
download
0
description
inflation & unemploymenteconomics
Transcript of Inflation and Unemployment.ppt
Inflation and Unemployment
Content
• The causes and consequences of unemployment• The natural rate of unemployment hypothesis• The phillips curve• The causes and consequences of inflation

Unemployment
• There are a number of types of unemployment:– Structural unemployment – Cyclical unemployment– Frictional unemployment
• Structural unemployment occurs when the economy changes and industries die out
• Training is needed to give the unemployed workers new skills

Unemployment
• Cyclical unemployment is caused by the business cycle
• Frictional unemployment is caused when people are temporarily out of work as they are moving jobs

Unemployment and PPF• Unemployment means that
scarce economic resources are being wasted reducing the long run potential of the economy
• Where there are high levels of unemployment an economy will be operating inside the perimeters of its PPF

Unemployment and AD / AS
• As Aggregate demand increases unemployment will decrease
• Supply side policies can be used to increase aggregate supply in the economy and thereby reduce the level of unemployment
• However if the growth in the level of aggregate demand is less than the underlying trend growth in output unemployment is likely to occur

Causes and Consequences of Unemployment
• Unemployment is caused by demand and supply side factors
• On the demand side if the demand curve shifts inwards unemployment will rise
• Supply side factors such as an excess of supply of workers also means unemployment will increase

Policies that increase labour market flexibility
• A number of policies can be implemented to increase market flexibility and reduce unemployment
• Policies can be implemented on the supply side and the demand side by the government

Supply side policies
• Supply side policies include:• Reducing the occupational mobility of labour – this
can be through providing training for the unemployed, increasing the availability and quality of education and providing incentives for people to work
Demand side policies
• Employment subsidies can be used by the government to encourage businesses to give jobs to the long term unemployed
Effects of Unemployment• On an individual level unemployment reduces the level of income that
an individual earns• As their income is reduced consumption also reduces as they pay for
necessities rather than luxuries• Goods that are income elastic will be consumed less • Quality of life will be reduced for the unemployed worker• Workers may become discouraged and give up searching for jobs
becoming part of the long term structural unemployment in the country
Effects of Unemployment
• Unemployment can have significance effects on the performance of the economy as a whole
• The effects are most marked due to long terms unemployment
• If there is unemployment in the economy resources are not being used effectively and the economy will be operating below any points on the PPF curve
Economic effects of unemployment
• If unemployment rates are rising there will be a negative impact on economic growth potential
• Consumption is likely to fall as consumers will have had a decrease in income levels
• Government spending will increase as the government will be responsible for benefit payments
• Taxation levels will decrease as less people are in work and therefore paying taxes

Natural Rate of Unemployment Hypothesis
• The natural rate of unemployment recognizes that there will always be some level of unemployment in an economy
• At the natural rate all unemployment will be voluntary
• This is the employment rate when the economy is operating at full employment
Determinants of the natural rate
• The natural rate is determined by the interaction of the demand for labour and the supply of labour
• At the equilibrium wage rate all people who want a job can get a job
• However at this wage rate their will be some people who choose not to work
Determinants of the natural rate
• The natural rate of unemployment is determined by:– Value of welfare benefits– Trade union power– Taxation system– Migration of labour– Social factors
Natural rate of unemployment and policy
• If governments want to reduce the natural rate of unemployment they need to concentrate on supply side policies
• If the benefits system is relatively high in a country it will cause less people to want to work

Inflation
• Inflation- The rise in the general level of prices• In the long term, inflation erodes consumer purchasing
power. • That means that accumulated wealth buys less and less,
with the passage of time.• Where there is high inflation it is difficult for businesses to
plan for the future as there is uncertainty regarding the cost of raw materials

19 of 47
The Aggregate Demand Curve
• Aggregate demand is the total demand for goods and services in the economy.

20 of 47
Deriving the Aggregate Demand Curve
• To derive the aggregate demand curve, we examine what happens to aggregate output (income) (Y) when the price level (P) changes, assuming no changes in government spending (G), net taxes (T), or the monetary policy variable (Ms).

21 of 47
Deriving the Aggregate Demand Curve
• The aggregate demand (AD) curve is a curve that shows the negative relationship between aggregate output (income) and the price level.

22 of 47
The Aggregate Demand Curve:A Warning
• At all points along the AD curve, both the goods market and the money market are in equilibrium.

23 of 47
Other Reasons for a Downward-Sloping Aggregate Demand
Curve• The consumption link: The
decrease in consumption brought about by an increase in the interest rate contributes to the overall decrease in output.

24 of 47
Other Reasons for a Downward-Sloping Aggregate Demand
Curve• The real wealth effect, or
real balance, effect is the change in consumption brought about by a change in real wealth that results from a change in the price level.

25 of 47
Aggregate Expenditureand Aggregate Demand
• At every point along the aggregate demand curve, the aggregate quantity of output demanded is exactly equal to planned aggregate expenditure.
Y = C + I + G
equilibrium condition

26 of 47
Shifts of the Aggregate Demand Curve
• An increase in the quantity of money supplied at a given price level shifts the aggregate demand curve to the right.

27 of 47
Shifts of the Aggregate Demand Curve
• An increase in government purchases or a decrease in net taxes shifts the aggregate demand curve to the right.
28 of 47
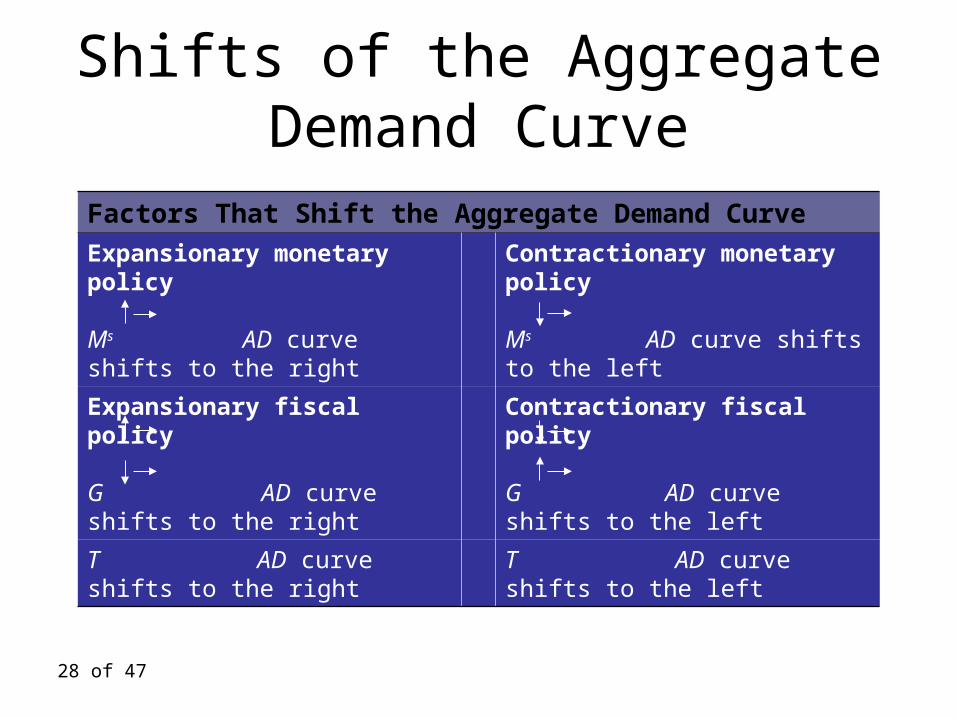
Shifts of the Aggregate Demand Curve
Factors That Shift the Aggregate Demand Curve
Expansionary monetary policy
Ms AD curve shifts to the right
Contractionary monetary policy
Ms AD curve shifts to the left
Expansionary fiscal policy
G AD curve shifts to the right
Contractionary fiscal policy
G AD curve shifts to the left
T AD curve shifts to the right T AD curve shifts to the left

29 of 47
The Aggregate Supply Curve
• Aggregate supply is the total supply of all goods and services in the economy.
30 of 47
The Aggregate Supply Curve
• The aggregate supply (AS) curve is a graph that shows the relationship between the aggregate quantity of output supplied by all firms in an economy and the overall price level.

31 of 47
Aggregate Supply in the Short Run
• In the short run, the aggregate supply curve (the price/output response curve) has a positive slope.

32 of 47
Shifts of the Short-RunAggregate Supply Curve• A cost shock, or supply shock, is a
change in costs that shifts the aggregate supply (AS) curve.

33 of 47
Shifts of the Short-RunAggregate Supply Curve
Bad weather, natural disasters, destruction from wars
Good weather
Public policy waste and inefficiency over-regulation
Public policy supply-side policies tax cuts deregulation
Stagnation capital deterioration
Economic growth more capital more labor technological change
Higher costs higher input prices higher wage rates
Lower costs lower input prices lower wage rates
Shifts to the LeftDecreases in Aggregate Supply
Shifts to the RightIncreases in Aggregate Supply
Factors That Shift the Aggregate Supply Curve

34 of 47
Causes of Inflation
• Inflation is an increase in the overall price level.
• Sustained inflation occurs when the overall price level continues to rise over some fairly long period of time.
35 of 47
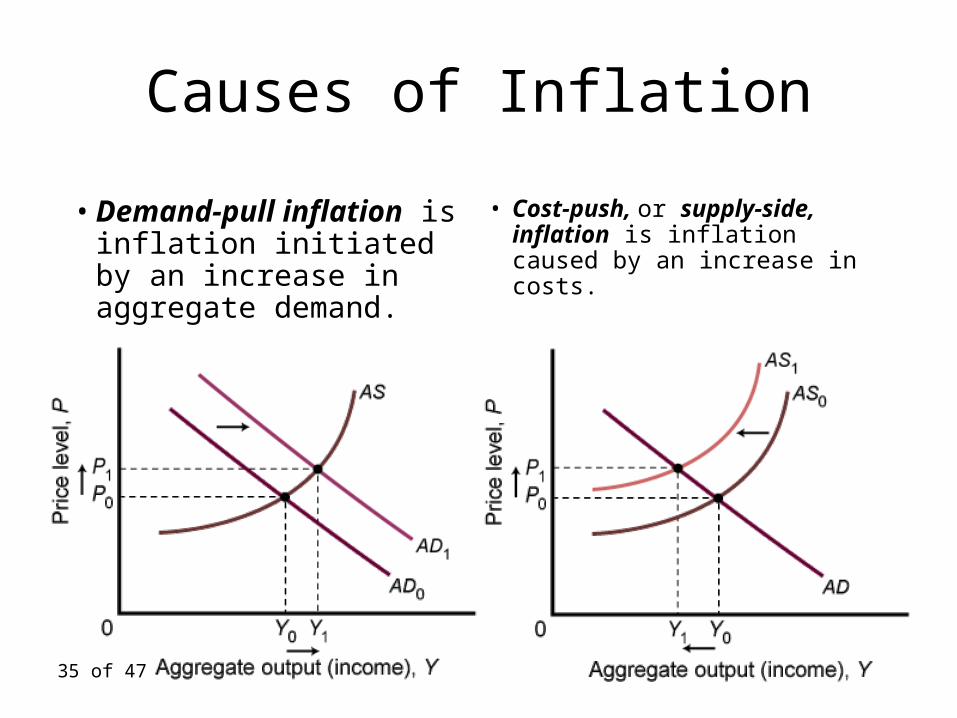
Causes of Inflation
• Demand-pull inflation is inflation initiated by an increase in aggregate demand.
• Cost-push, or supply-side, inflation is inflation caused by an increase in costs.

36 of 47
Cost-Push, or Supply-Side Inflation
• Stagflation occurs when output is falling at the same time that prices are rising.
• One possible cause of stagflation is an increase in costs.
37 of 47 ++ `
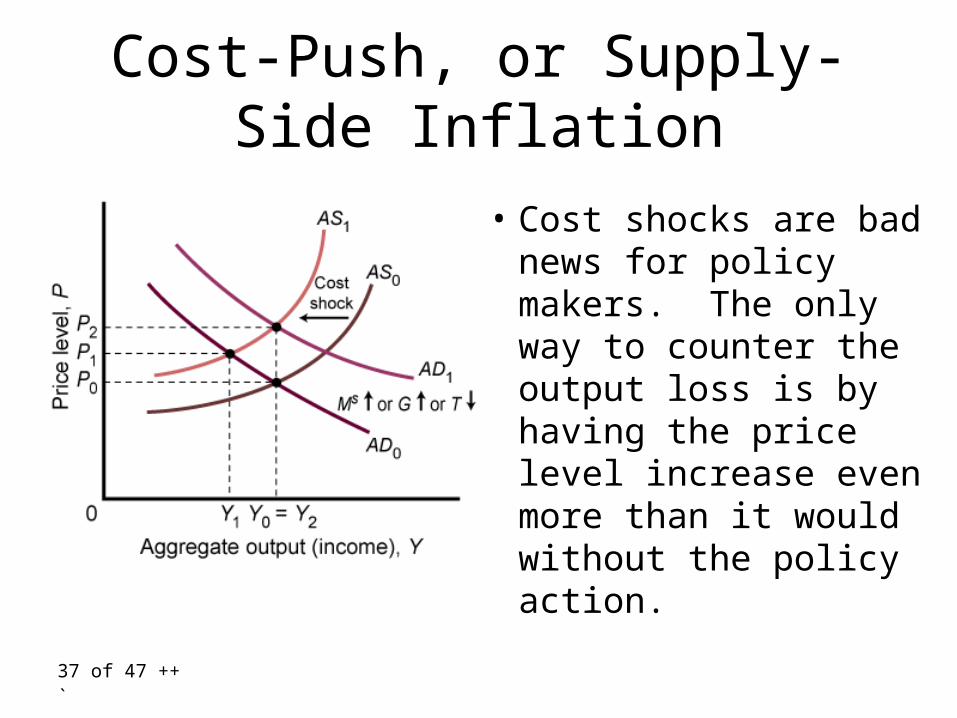
Cost-Push, or Supply-Side Inflation
• Cost shocks are bad news for policy makers. The only way to counter the output loss is by having the price level increase even more than it would without the policy action.

38 of 47
Money and Inflation
• Hyperinflation is a period of very rapid increases in the price level.
39 of 47
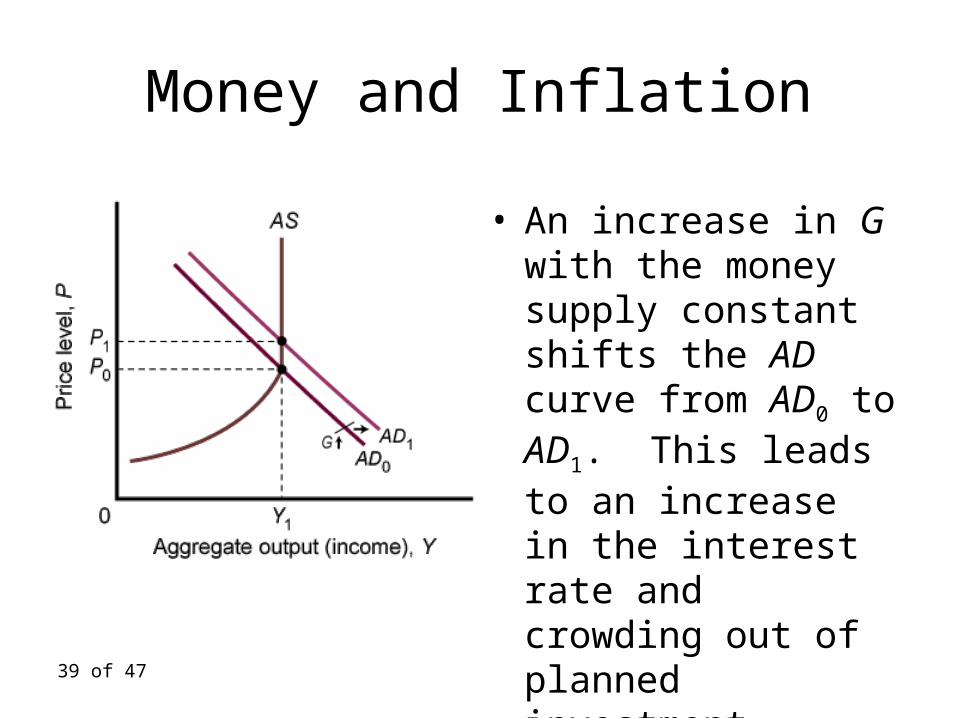
Money and Inflation
• An increase in G with the money supply constant shifts the AD curve from AD0 to AD1. This leads to an increase in the interest rate and crowding out of planned investment.
40 of 47
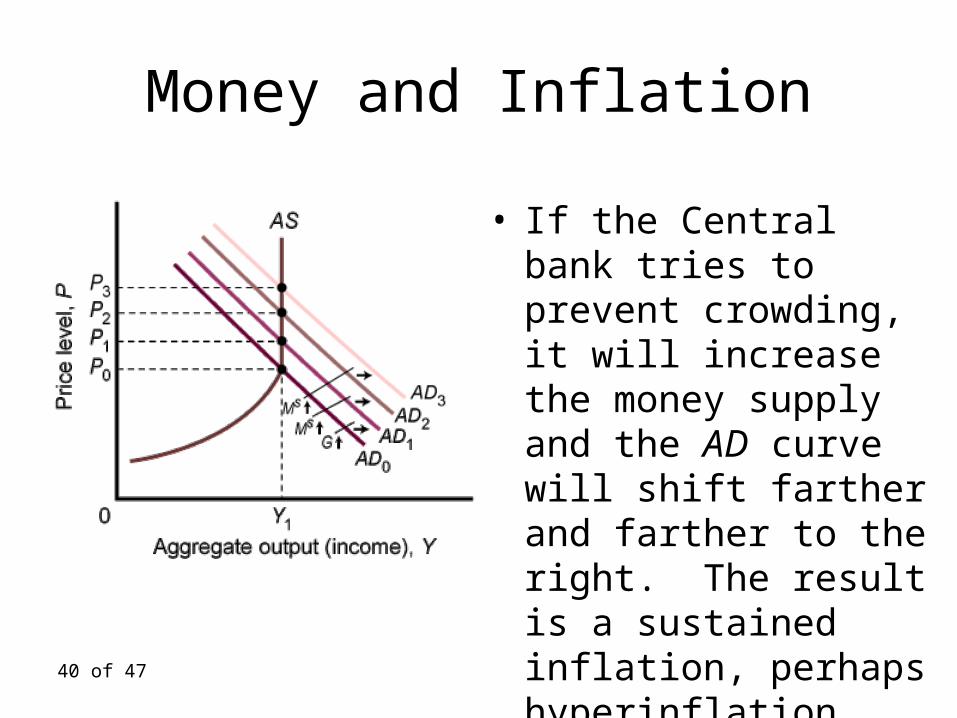
Money and Inflation
• If the Central bank tries to prevent crowding, it will increase the money supply and the AD curve will shift farther and farther to the right. The result is a sustained inflation, perhaps hyperinflation.
The causes of inflation• inflation results when the macro economy has too much
demand for available production. These alternatives fall under two general categories:
• Demand-Pull Inflation: This inflation occurs when household, business, government, and foreign industries collectively try to purchase more output than the economy is capable of producing. In effect, the demand side of the aggregate market is "pulling" the price level higher.
• Cost-Push Inflation: Cost-push inflation is inflation attributable to decreases in supply, primarily due to increases in production cost
Cost Push Inflation
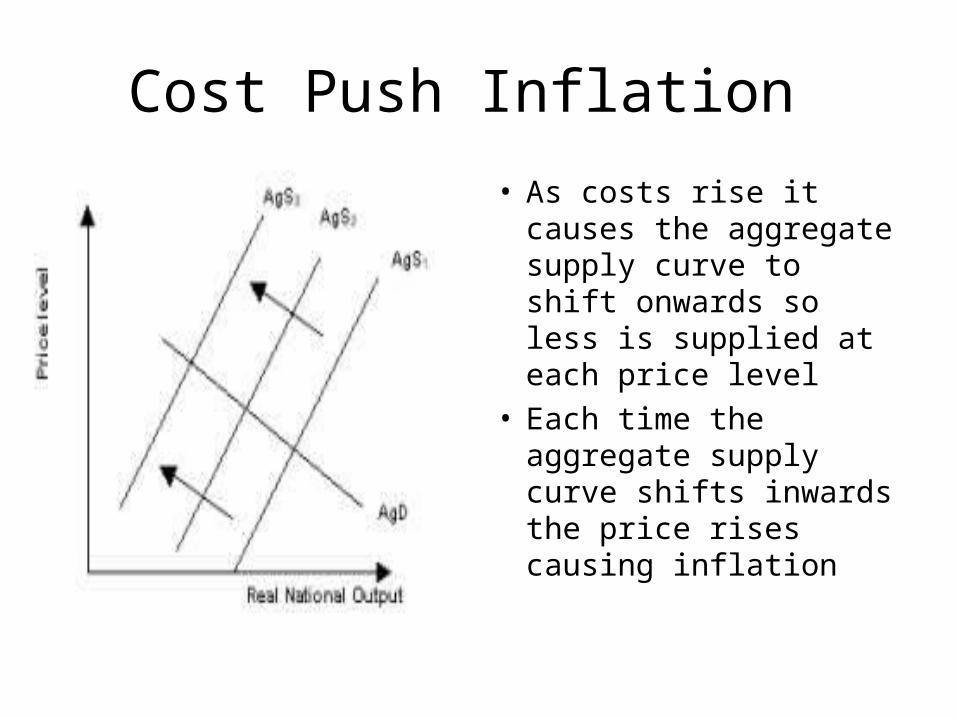
• As costs rise it causes the aggregate supply curve to shift onwards so less is supplied at each price level
• Each time the aggregate supply curve shifts inwards the price rises causing inflation

Demand pull inflation• As aggregate demand
increases then the general price level rises
• When total demand exceeds total supply demand pull inflation occurs
• If the economy is close to full capacity the effects of demand pull inflation will be greater

Preventing inflation
• One of the best ways to prevent inflation is through stock and variable universal life insurance. These alternatives provide the potential for returns that exceed inflation over the long term.
• Central banks place high interest rates using unemployment and the decline of production to prevent price increases.
Short Run Trade Off Between Inflation and Unemployment

Unemployment and Inflation
• The natural rate of unemployment depends on various features of the labor market.
• Examples include minimum-wage laws, the market power of unions, the role of efficiency wages, and the effectiveness of job search.
• The inflation rate depends primarily on growth in the quantity of money, controlled by the Central Bank.

Trade Off
• Society faces a short-run tradeoff between unemployment and inflation.
• If policymakers expand aggregate demand, they can lower unemployment, but only at the cost of higher inflation.
• If they contract aggregate demand, they can lower inflation, but at the cost of temporarily higher unemployment.

Phillips Curve
• The Phillips curve illustrates the short-run relationship between inflation and unemployment.

The Phillips Curve
UnemploymentRate (percent)
0
InflationRate
(percentper year)
Phillips curve
4
B6
7
A2
Copyright © 2004 South-Western
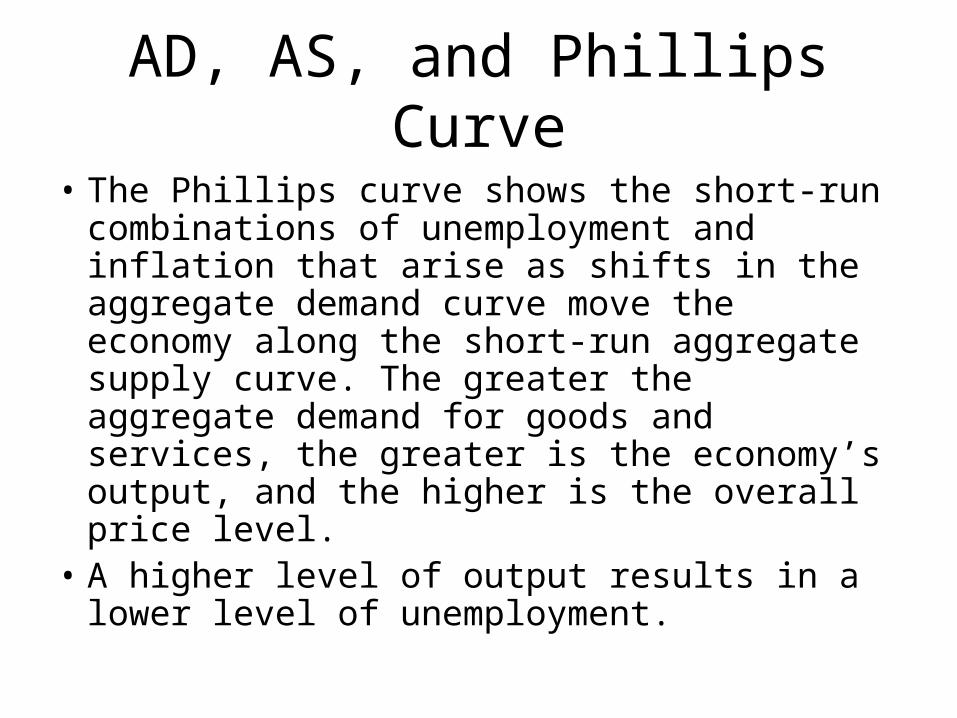
AD, AS, and Phillips Curve
• The Phillips curve shows the short-run combinations of unemployment and inflation that arise as shifts in the aggregate demand curve move the economy along the short-run aggregate supply curve. The greater the aggregate demand for goods and services, the greater is the economy’s output, and the higher is the overall price level.
• A higher level of output results in a lower level of unemployment.

Quantityof Output
0
Short-runaggregate
supply
(a) The Model of Aggregate Demand and Aggregate Supply
UnemploymentRate (percent)
0
InflationRate
(percentper year)
PriceLevel
(b) The Phillips Curve
Phillips curveLow aggregate
demand
Highaggregate demand
(output is8,000)
B
4
6
(output is7,500)
A
7
2
8,000(unemployment
is 4%)
106 B
(unemploymentis 7%)
7,500
102 A
Copyright © 2004 South-Western

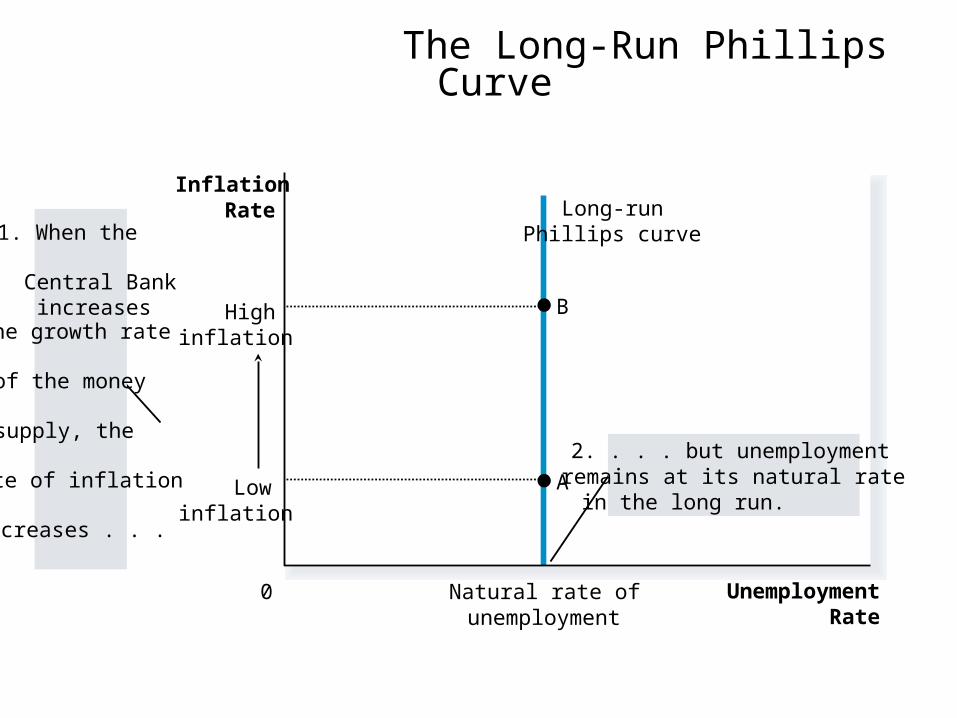
Long-Run Phillips Curve
• In the 1960s, Friedman and Phelps concluded that inflation and unemployment are unrelated in the long run.– As a result, the long-run Phillips curve is
vertical at the natural rate of unemployment.– Monetary policy could be effective in the short
run but not in the long run.
The Long-Run Phillips Curve
UnemploymentRate
0 Natural rate ofunemployment
InflationRate Long-run
Phillips curve
BHighinflation
Lowinflation
A
2. . . . but unemploymentremains at its natural ratein the long run.
1. When the
Central Bank increases
the growth rate
of the money
supply, the
rate of inflation
increases . . .
Copyright © 2004 South-Western

Quantityof Output
Natural rateof output
Natural rate ofunemployment
0
PriceLevel
P
Aggregatedemand, AD
Long-run aggregatesupply
Long-run Phillipscurve
(a) The Model of Aggregate Demand and Aggregate Supply
UnemploymentRate
0
InflationRate
(b) The Phillips Curve
2. . . . raisesthe pricelevel . . .
1. An increase in the money supplyincreases aggregatedemand . . .
AAD2
B
A
4. . . . but leaves output and unemploymentat their natural rates.
3. . . . andincreases theinflation rate . . .
P2B
Copyright © 2004 South-Western

Summary• There are three main types of unemployment:
– Structural– Cyclical– Frictional
• Unemployment means that an economy cant operate on its ppf • As AD increases unemployment decreases• The natural rate of unemployment recognises there will always be some level of
unemployment in the economy• The Phillips curve shows an inverse relationship between unemployment and
inflation • Inflation is a rise in the general level of prices• There are two causes of inflation:
– Cost push – Demand pull