Inflation & Index Numbers Problems & Issues Dr. D. Foster – ECO 285.

Inflation and the Consumer Price IndexEmirate of Dubai
2008

General Index Number
Inflation Rate for 2008 amounted to 10.77% compared to 2007. Restaurants and Hotels group obtained highest inflation rate at 25.49%, followed by Food and Non-Alcoholic Beverages group amounted to 21.06% and 19.54% for Clothing and Footwear group. Beside that, inflation rate of Miscellaneous Goods and Services group increase by 19.17%. Further, the inflation rate for the Education group reached 18.49%, while Furniture and Furnishings group reached 13.76%. Followed by increasing in Transportation group 8.95%, Health group by 6.66%, Alcoholic Beverages and Tobacco group by 5.65%. Then Housing, Electricity, Water, Gas, and Fuel group reached 5.60%, Leisure and Culture group at 2.85%, and 1.71% for Communications group. Table (1) and Chart (1) shows 2008 inflation rate and Consumer Price Index.
Table (1) the rate of inflation and the Consumer Price Index 2008
2007 = 100
% of Inflation rateCPIWeightExpenditure groups
10.77110.77100.00The general index number21.06121.0611.08Food and non-alcoholic beverages5.65105.650.24Alcoholic beverages and tobacco19.54119.545.52Clothing and footwear5.60105.6043.70Housing, water, electricity, gas, and fuel13.76113.763.34Furniture and furnishings, household items and repairing6.66106.661.08Healthcare8.95108.959.08Transportation1.71101.716.00Communications2.85102.854.24Leisure and culture18.49118.494.09Education25.49125.495.48Restaurants and hotels19.17119.176.15Miscellaneous goods and services
Chart (1) Consumer Price Index 2008
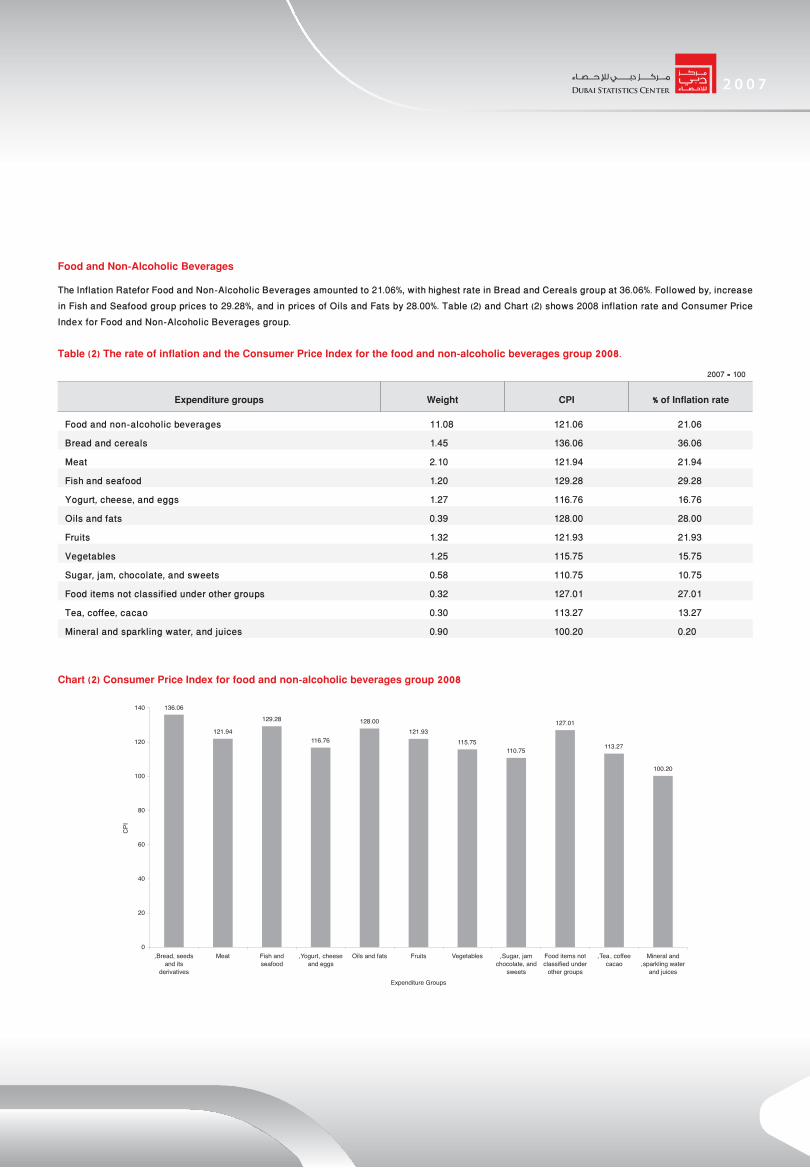
Food and Non-Alcoholic Beverages
The Inflation Ratefor Food and Non-Alcoholic Beverages amounted to 21.06%, with highest rate in Bread and Cereals group at 36.06%. Followed by, increase in Fish and Seafood group prices to 29.28%, and in prices of Oils and Fats by 28.00%. Table (2) and Chart (2) shows 2008 inflation rate and Consumer Price Index for Food and Non-Alcoholic Beverages group.
Table (2) The rate of inflation and the Consumer Price Index for the food and non-alcoholic beverages group 2008.
2007 = 100
% of Inflation rateCPIWeightExpenditure groups
21.06121.0611.08Food and non-alcoholic beverages
36.06136.061.45Bread and cereals
21.94121.942.10Meat
29.28129.281.20 Fish and seafood
16.76116.761.27Yogurt, cheese, and eggs
28.00128.000.39Oils and fats
21.93121.931.32Fruits
15.75115.751.25Vegetables
10.75110.750.58Sugar, jam, chocolate, and sweets
27.01127.010.32Food items not classified under other groups
13.27113.270.30Tea, coffee, cacao
0.20100.200.90Mineral and sparkling water, and juices
Chart (2) Consumer Price Index for food and non-alcoholic beverages group 2008

Alcoholic Beverages and Tobacco
Inflation rate for the Alcoholic Beverages and Tobacco group reached 5.65%, due to the increase of Alcoholic Beverages at rate of 16.34%. Followed by, 2.06% inflation rate for Tobacco. Table (3) and Chart (3) shows 2008 inflation rate and Consumer Price Index for Alcoholic Beverages and Tobacco group.
Table (3) The rate of inflation and the Consumer Price Index for the alcoholic beverages and tobacco group 2008.
2007 = 100
% of Inflation rateCPIWeightExpenditure groups
5.65105.650.24Alcoholic beverages and tobacco
16.34116.340.06Alcoholic beverages
2.06102.060.18Tobacco
Chart (3) The Consumer Price Index for the alcoholic beverages and tobacco group 2008.

Clothing and Footwear
The rate of inflation for Clothing and Footwear group reached 19.54%, as a result of increasing in prices of accessories by 50.80%. Moreover, prices of Dry-Cleaning and Wages of Custom tailoring rose to 39.48% and textiles to 29.26%. Table (4) and Chart (4) shows 2008 inflation rate and Consumer Price Index for Clothing and Footwear group.
Table (4) The rate of inflation and the Consumer Price Index for the clothing and footwear group 2008.
2007 = 100
% of Inflation rateCPIWeightExpenditure groups
19.54119.545.52Clothing and footwear
29.26129.260.34Textiles
18.65118.653.77Readymade clothing
50.80150.800.06Accessories
39.48139.480.39Wages of custom tailoring and dry-cleaning
9.79109.790.96Shoes and other footwear
Chart (4) The Consumer Price Index for the clothing and footwear group 2008.

Housing, Water, Electricity, Gas, and Fuel
The inflation rate for Housing, Water, Electricity, Gas, and Fuel group reached 5.60%. Liquid Fuel has highest rate about 26.58%. Followed by, an increase in Gas price by 25.96% and in Rents by 5.99%. Table (5) and Chart (5) shows 2008 inflation rate and Consumer Price Index for Housing, Water, Electricity, Gas, and Fuel group.
Table (5) The rate of inflation and the Consumer Price Index for the housing, water, electricity, gas, and fuel group 2008.
2007 = 100
% of Inflation rateCPIWeightExpenditure groups
5.60105.6043.70Housing, water, electricity, gas, and fuel
5.99105.9938.33Rents
3.72103.720.22Materials, services, and maintenance of housing
100.001.41Water servicesــ
100.003.19Electricityــ
25.96125.960.51Gas
26.58126.580.02Liquid fuels
3.24103.240.02Dry and solid materials
Chart (5) The Consumer Price Index for the housing, water, electricity, gas, and fuel group 2008.

Furniture and Furnishings, and Household Items and Repairing
The inflation rate for Furniture and Furnishings, and Household Items and Repairing group reached 13.76%, due to the increase in Non-durable Household goods by 21.28%. Followed by, an increase in the prices of Furniture and Furnishings by 15.57%. Behinds, the prices of Tableware, Household Metal Items, and Glassware increase by 13.99%. Table (6) and Chart (6) shows 2008 inflation rate and Consumer Price Index for Furniture and Furnishings, and Household Items and Repairing group.
Table (6) The rate of Inflation and the Consumer Price Index for the furniture and furnishings, and household items and repairing group 2008.
2007 = 100
% of Inflation rateCPIWeightExpenditure groups
13.76113.763.34Furniture and furnishings, household appliances, and repairing
15.57115.570.37Furniture
12.21112.210.03Carpets and floor coverings
9.09109.090.07Household embroidery
6.81106.810.14Basic home appliances
7.58107.580.01Small electrical home appliances
13.99113.990.40Cutlery and household metal items, glassware, and tableware
7.26107.260.04Miscellaneous small accessories (lighting accessories)
21.28121.280.61Household non-durable goods
11.56111.561.67Household services
Chart (6) The Consumer Price Index for the furniture and furnishings, and household items and repairing group 2008.

HealthcareHealthcare group inflation rate amounted to 6.66%, due to the raise of Hospital Services with amount of 45.56%. Followed by, an increase in the price of Treatment Equipment and Appliances by 21.37% and Medical Analysis and X-ray by 13.18%. Table (7) and Chart (7) shows 2008 inflation rate and Consumer Price Index for Healthcare group.
Table (7) The rate of inflation and the Consumer Price Index for the healthcare group 2008
2007 = 100
% of Inflation rateCPIWeightExpenditure groups
6.66106.661.08Healthcare
1.19101.190.73Pharmaceutical products
2.18102.180.04Other medical products
21.37121.370.02Treatment equipment and appliances
2.39102.390.04Physician and nursing services
3.22103.220.02Dental services
13.18113.180.15Medical analysis and X-ray
45.56145.560.08Hospital services and the like
Chart (7) The Consumer Price Index for the healthcare group 2008.

TransportationThe rate inflation for Transportation group reached 8.95%, with the highest rate of price in the Maintenance and Repairing services of the Modes of Transportation at 23.63%. Following, 23.54% increase in the price of spare-parts and modes of Transportation Accessories and an increase in the price of air transportation at 11.72%. Table (8) and Chart (8) shows 2008 inflation rate and Consumer Price Index for transportation group 2008.
Table (8) The Consumer rate of inflation and the Price Index for the transportation group 2008.
2007 = 100
% of Inflation rateCPIWeightExpenditure groups
8.95108.959.08Transportation
4.45104.451.17Personal modes of transportation
6.20106.200.01Motorcycles
23.54123.541.08Spare-parts and modes of transportation accessories
3.04103.044.47Fuels and oils for modes of transportation
23.63123.631.41Maintenance and repair services for modes of transportation
1.54101.540.46Other expenditures on modes of transportation
4.63104.630.39Land transportation
11.72111.720.09Air transportation
Chart (8) The Consumer Price Index for the transportation group 2008.

Communications
The inflation rate for Communications group reached 1.71% as a result of increasing Postal Services prices by 45.73%. Furthermore, an increase in Wireless and Wired Services prices by 1.79%. On the other hand, the prices of wireless and wired equipment decreased by 13.90%. Table (9) and Chart (9) shows 2008 inflation rate and Consumer Price Index for Communications group.
Table (9) The rate of inflation and the Consumer Price Index for the communications group 2008.
2007 = 100
% of Inflation rateCPIWeightExpenditure groups
1.71101.716.00Communications
45.73145.730.03Postal services
-13.9086.100.12Wireless and wired equipment
1.79101.795.85Wireless and wired services
Chart (9) The Consumer Price Index for the communications group 2008.

Leisure and CultureLeisure and Culture group inflation rate amounted to 2.85%. due to high increase in the price of equipment for the processing of collected information by 26.19%. In addition, Stationery and Painting Material prices increased by 21.81% and by 10.34% Sport Leisure Services prices increased. Table (10) and Chart (10) shows 2008 inflation rate and Consumer Price Index for Leisure and Culture group.
Table (10) The rate of inflation and the Consumer Price Index for the leisure and culture group 2008.
2007 = 100
% of Inflation rateCPIWeightExpenditure groups
2.85102.854.24Leisure and culture
100.000.11Visual and audio equipment and the likeــ
100.000.05Photography equipment and accessoriesــ
26.19126.190.06Information processing equipment
100.000.16Toysــ
100.000.08Plants and flowersaــ
10.34110.340.25Sport leisure services
1.71101.710.61Cultural services
3.38103.380.15Books
100.002.48Newspapers and periodicalsــ
21.81121.810.29Stationery and painting materials
Chart (10) The Consumer Price Index for the leisure and culture group 2008.

EducationEducation inflation rate has increased by 18.49%, due to tuition fees. Table (11) and Chart (11) shows 2008 inflation rate and Consumer Price Index for education group.
Table (11) The rate of inflation and the Consumer Price Index for the education group 2008.
2007 = 100
% of Inflation rateCPIWeightExpenditure groups
18.49118.494.09Education
18.49118.494.09Education
Chart (11) The Consumer Price Index for the education group 2008.

Restaurants and Hotels
Inflation rate for Restaurants and Hotels group reached 25.49% because of high increases in the price of restaurants and cafes by 25.52%. Rate of Hotels accommodation increased by 18.09%. Table (12) and Chart (12) shows inflation rate and Consumer Price Index for restaurants and hotels group.
Table (12) The rate of inflation and the Consumer Price Index for the restaurants and hotels group 2008
2007 = 100
% of Inflation rateCPIWeightExpenditure groups
25.49125.495.48Restaurants and hotels
25.52125.525.45Restaurants and cafes
18.09118.090.03Hotel accommodation
Chart (12) The Consumer Price Index for the restaurants and hotels group 2008.

Miscellaneous Goods and ServicesMiscellaneous Goods and Services group reached 19.17% due to increase in the prices of car insurance by 31.19%. Personal Care Electrical Equipment increased by 27.65%, and personal care services by 22.14%. Table (13) and Chart (13) shows 2008 inflation rate and Consumer Price Index for miscellaneous goods and services group.
Table (13) The rate of inflation and the Consumer Price Index for the miscellaneous goods and services group 2008.
2007 = 100
% of Inflation rateCPIWeightExpenditure groups
19.17119.176.15Miscellaneous groups and services
22.14122.140.78Personal care services
27.65127.650.02Personal care electrical equipment Personal care materials and appliances
19.02119.022.34Jewelry and watches
18.18118.180.29Other personal goods
13.18113.180.05Health insurance
100.000.41Car insuranceــ
31.19131.191.53Card issuing and renewal fees
2.55102.550.73Miscellaneous groups and services
Chart (13) The Consumer Price Index for the miscellaneous goods and services group 2008.