Inflation, Inflation Uncertainty and Economic Growth Nex ...
Upload
phungtuyenCategory
view
214download
0
CBN Journal of Applied Statistics Vol.3 No.2 99
Inflation and Economic Growth in Nigeria:
Detecting the Threshold Level
Sani I. Doguwa1
This paper re-examines the issue of the existence and the level of inflation threshold
in the relationship between inflation and growth in Nigeria, using three different
approaches that provide appropriate procedures for estimating the threshold level
and inference. While Sarel’s (1996) approach provides a threshold point estimate of
9.9 per cent that was not well identified by the data, the technique of Khan and
Senhadji (2001) identifies a 10.5 per cent inflation threshold as statistically
significant to explain the inflation-growth nexus in Nigeria. Also, the approach of
Drukker et al (2005) suggests a two threshold point model with 11.2 and 12.0 per
cent as the appropriate inflation threshold points. These results suggest that the
threshold level of inflation above which inflation is inimical to growth is estimated at
10.5 to 12 per cent for Nigeria. Using the estimated two threshold point model, this
paper did not find enough reasons to accept the null hypothesis of the super-
neutrality of money, and therefore, suggest that there is a threshold level of inflation
above which money is not super-neutral.
Keywords: threshold model, super-neutrality, inflation-growth nexus,
inflation threshold points
JEL Classification: E31, O40
1.0 Introduction
High and sustained output growth in conjunction with low inflation is the
common objective of macroeconomic policy all over the world. But can they
coexist? Could there be a trade-off between lowering inflation and achieving
sustained and higher growth? At the operational level, there is recognition that
inflation-growth nexus depends on the level of inflation ostensibly because, at
some low levels inflation may be positively correlated with output growth, but
at higher levels inflation is likely to be inimical to growth. This relationship
has been translated into the use of threshold models, which suggest that when
inflation exceeds the threshold, higher inflation becomes immediately very
1 Sani Doguwa is a staff of the Statistics Department, Central Bank of Nigeria, Abuja. The
views expressed in this paper are those of the author and do not necessarily represent the
official views of the Bank. The author is particularly grateful to B.S. Omotosho for the
provided research assistance and the anonymous referees for their incisive comments that led
to the improvement of the paper.

100 Inflation and Economic Growth in Nigeria:
Detecting the Threshold Level Doguwa
detrimental to growth, a result that would call for immediate policy changes as
soon as inflation exceeds the threshold.
The debate on inflation-growth nexus has remained perennial and has
attracted substantial theoretical and empirical efforts. For instance, while the
structuralists argue that inflation is crucial for economic growth, the
monetarists posit that inflation is harmful to economic growth. The two basic
aspects of the debate relate to the presence as well as nature of relationship
between inflation and growth and the direction of causality. Commenting on
the inconclusive nature of the relationship between inflation and economic
growth, Friedman (1973) noted that some countries have experienced inflation
with and without development and vice versa.
Wai (1959) argues that there is no relationship between inflation and
economic growth noting that growth has been possible without inflation in
some countries while in others; there have been inflation without growth.
Similarly, Johanson (1967) posits that there is no convincing evidence of any
clear association, positive or negative, between the rate of inflation and the
rate of economic growth. He argues that it is not inflation that determines
economic growth but the application of knowledge, through technical and
managerial change and the improvement of human capacities.
Also, in a study on Nigeria, Chimobi (2010) investigates the existence of a
relationship between inflation and economic growth using annual data for the
period 1970 – 2005. The study finds no co-integrating relationship between
the two variables. Using Granger causality test, however, the study established
unidirectional causality running from inflation to economic growth.
The studies on the nonlinear relationship between inflation and economic
growth argue that at low inflation levels, the relationship between inflation
and economic growth is non-existent or positive while at higher levels of
inflation, the relationship becomes significant and negative. Fischer (1993)
was among the first to identify such a relationship and since then, various
researchers have attempted to estimate a threshold beyond which inflation
becomes injurious to growth. For instance, Sarel (1996) estimates a threshold
of 8 per cent in his cross country study, while Ghosh and Philips (1998) report
a lower threshold of 2.5 per cent using a larger sample of countries.

CBN Journal of Applied Statistics Vol.3 No.2 101
In terms of country specific studies, Mubarik (2005) uses annual data from
1973 to 2000 to investigate the relationship between inflation and growth in
Pakistan. He finds a threshold of 9 per cent and concluded that inflation levels
beyond the estimated threshold would confer significant output cost on the
country. Also, Hussain and Malik (2011) use granger causality test to
determine the direction of causality between inflation and economic growth in
Pakistan and the error correction model to explore the nature of relationship
between the variables. Employing annual data from 1960 to 2006, they find
that inflation granger causes growth and not vice versa. In addition, they
establish a positive relationship between inflation and economic growth.
Similar to the findings of Mubarik (2005), their model detects a threshold of 9
per cent, beyond which inflation begins to lower growth
Mohanty et al. (2011) explore possible nonlinear relationship between
inflation and growth in India using quarterly series and infer that the inflation
rate of 4 to 5.5 per cent may be considered as an inflation threshold. Though
their empirical investigation do not find conclusive evidence of the existence
of an inflation threshold, they opine that inflation rate less than 5.5 per cent
impact positively on Indian economic growth, while the relationship changes
once the 5.5 per cent level is exceeded.
Salami and Kelikume (2010) use annual data for the period 1970 to 2008 and
1980 to 2008 to estimate an inflation threshold for Nigeria. For the period
1970 to 2008, an inflation threshold of 8 per cent is detected, while for 1980
to 2008 an insignificant threshold of 7 per cent is established. In a similar
study for Nigeria using annual data from 1970 to 2006, Bassey and
Onwioduokit (2011) use the framework of Li (2005) to investigate the
relationship between inflation and economic growth as well as detect an
appropriate threshold. Having established the presence of a negative
relationship, they identify a statistically insignificant threshold level of 18 per
cent and establish that inflation rates below the threshold are growth
propelling. Also, employing the threshold regression model developed by
Khan and Senhadji (2001) on a mixture of quasi and actual quarterly data
spanning 1981 to 2009, Bawa and Abdullahi (2012) estimate a higher
threshold inflation level of 13 per cent when compared with Salami and
Kelikume’s point estimate, but a lower threshold when compared with the
point estimate suggested by Bassey and Onwioduokit.
102 Inflation and Economic Growth in Nigeria:
Detecting the Threshold Level Doguwa
While the dummy2 variable specification in Salami and Kelikume may be
flawed resulting in the 8 per cent inflation threshold that is not well identified
by the data used, the 18 per cent threshold suggested by Bassey and
Onwioduokit is not conclusive, as the classical tests for the existence of the
threshold at 18 per cent was rejected. Adapting Sarel (1996), Khan and
Senhadji (2001) and Drukker et al (2005) methodologies on recent quarterly
data spanning 2005Q1 to 2012Q1, this paper re-examines the issue of the
existence of the threshold effects of inflation for Nigeria. These
methodologies are used in this paper to ensure the robustness of the results
and confirm earlier findings.
For ease of exposition, the paper is structured into seven sections; with section
one as the introduction. Section two uses recent data to provide some stylized
facts on Nigeria’s inflation-growth nexus. Section three reviews both the
theoretical and empirical literature for the study. While section four discusses
the methodology adapted for the study, the optimization and inferential
methods of determining the inflation thresholds are presented in section five.
Data analysis, results and discussions are contained in section six, while
section seven concludes the paper.
2.0 Growth-Inflation Nexus in Nigeria: Some Stylized Facts
The Nigerian economy recorded significant growth in the last two quarters3 of
2005 with over 8 per cent growth in each of the two quarters. The impressive
growth in output recorded in these quarters was attributable to the effective
implementation of the economic reform agenda under the auspices of the
National Economic and Development Strategy (NEEDS). The main drivers of
growth in output during the period were agriculture, general commerce and
services (CBN, 2005). Though there were inflationary pressures during the
first three quarters of the year, the impressive growth rate in Q4, 2005 was
associated with a drastic decline in inflation from almost 24.3 per cent in Q3,
2005 to about 11.3 per cent during the fourth quarter of the year. The initial
inflationary pressure in the year was caused by increased food prices
2 The relationship between threshold k, and log (π) in defining the dummy variable should
have been in the form log(π) > log(k) or π > k or 10log(π)
> k, rather than in the form 100 log(π)
> k. 3 The quarterly GDP compilation, a collaborative effort of the Central Bank of Nigeria (CBN)
and National Bureau of Statistics (NBS) commenced in Q1, 2004.
CBN Journal of Applied Statistics Vol.3 No.2 103
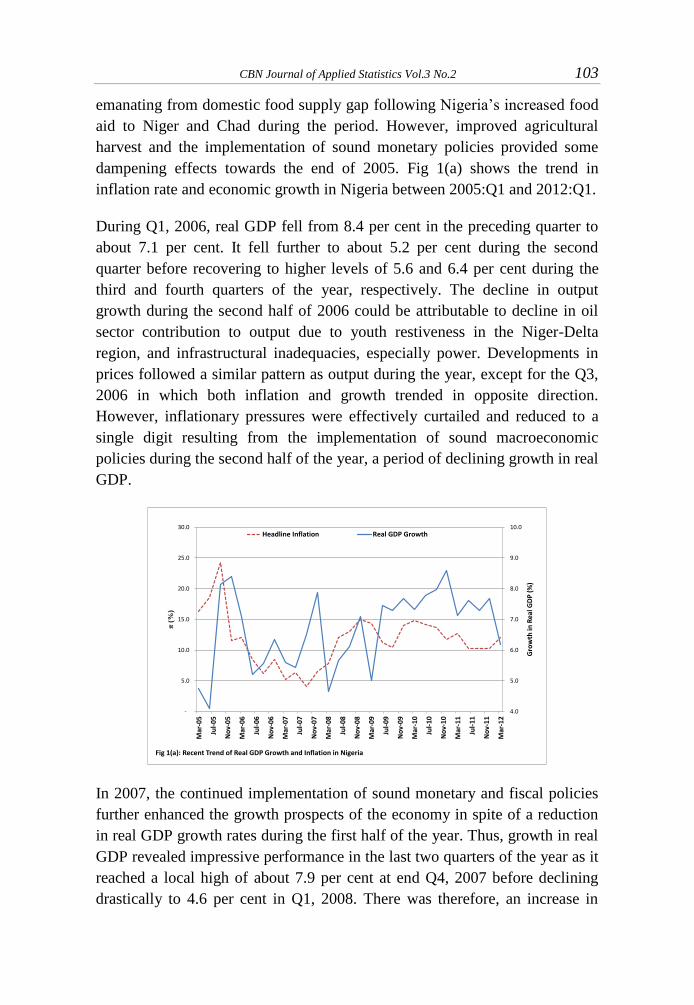
emanating from domestic food supply gap following Nigeria’s increased food
aid to Niger and Chad during the period. However, improved agricultural
harvest and the implementation of sound monetary policies provided some
dampening effects towards the end of 2005. Fig 1(a) shows the trend in
inflation rate and economic growth in Nigeria between 2005:Q1 and 2012:Q1.
During Q1, 2006, real GDP fell from 8.4 per cent in the preceding quarter to
about 7.1 per cent. It fell further to about 5.2 per cent during the second
quarter before recovering to higher levels of 5.6 and 6.4 per cent during the
third and fourth quarters of the year, respectively. The decline in output
growth during the second half of 2006 could be attributable to decline in oil
sector contribution to output due to youth restiveness in the Niger-Delta
region, and infrastructural inadequacies, especially power. Developments in
prices followed a similar pattern as output during the year, except for the Q3,
2006 in which both inflation and growth trended in opposite direction.
However, inflationary pressures were effectively curtailed and reduced to a
single digit resulting from the implementation of sound macroeconomic
policies during the second half of the year, a period of declining growth in real
GDP.
In 2007, the continued implementation of sound monetary and fiscal policies
further enhanced the growth prospects of the economy in spite of a reduction
in real GDP growth rates during the first half of the year. Thus, growth in real
GDP revealed impressive performance in the last two quarters of the year as it
reached a local high of about 7.9 per cent at end Q4, 2007 before declining
drastically to 4.6 per cent in Q1, 2008. There was therefore, an increase in
4.0
5.0
6.0
7.0
8.0
9.0
10.0
-
5.0
10.0
15.0
20.0
25.0
30.0
Mar
-05
Jul-
05
No
v-0
5
Mar
-06
Jul-
06
No
v-0
6
Mar
-07
Jul-
07
No
v-0
7
Mar
-08
Jul-
08
No
v-0
8
Mar
-09
Jul-
09
No
v-0
9
Mar
-10
Jul-
10
No
v-1
0
Mar
-11
Jul-
11
No
v-1
1
Mar
-12
Gro
wth
in R
eal G
DP
(%
)
π(%
)
Fig 1(a): Recent Trend of Real GDP Growth and Inflation in Nigeria
Headline Inflation Real GDP Growth

104 Inflation and Economic Growth in Nigeria:
Detecting the Threshold Level Doguwa
output in 2007 and a decline in inflation rate. The decline in inflation was
attributed to good agricultural harvest and sound macroeconomic policies.
Following the decline in output in Q1, 2008, increased growths rates were
experienced during the last three quarters of the year partly due to increased
availability of funds to the private sector. Other contributory factors to output
growth were the stability in the foreign exchange market, sound
macroeconomic policies, and clement weather conditions. Similar to the trend
in output, prices in 2008 rose significantly and steadily owing to factors such
as the global financial crisis, rising liquidity and depreciating exchange rate of
the Naira (CBN, 2008).
In 2009, both output growth and inflation rate fell during the first quarter
relative to their levels in the preceding quarter. However, the pattern was
reversed during Q2, 2009 as output increased to 7.4 per cent, while inflation
moderated to 11.2 per cent from 14.4 per cent achieved in Q1, 2009. Again,
both output and prices trended downwards in Q3, 2009 and upwards in Q4,
2009. Output growth was driven largely by the non-oil sector and propelled by
sound macroeconomic policies, while increases in food prices led to
inflationary pressures.
In 2010 a combination of growth enhancing policies led to a steady increase in
real GDP relative to its level in the previous year. For instance, the growth
rate of real GDP in Q1 and Q4 of the year were 7.3 per cent and 8.6 per cent,
respectively. The 8.6 per cent growth in output achieved in Q4, 2010 was the
highest during the study period. This output growth was driven largely by
agriculture, services, wholesale and retail trade as well as building and
construction sectors of the economy. The gradual increase in output during the
year was accompanied by a steady decline in prices, due to factors such as
improved agricultural harvest and the relative stability in the supply and prices
of petroleum products (CBN, 2010).
The first quarter of 2011 witnessed a decline in real GDP relative to the level
recorded in Q4, 2010, and a rise in inflation rate. Similarly, the moderate
improvement in output achieved in the second quarter was associated with a
moderation in inflation rate. For instance, while the output growth rose from
from7.1 per cent in Q1, 2011 to 7.6 per cent in Q2, 2011, inflation rate
moderated substantially from 12.8 per cent to 10.2 per cent in the same period.
CBN Journal of Applied Statistics Vol.3 No.2 105
Similar pattern was observed in the remaining two quarters of the year as
increased output growth was associated with falling prices. Also, note that the
recorded growth in quarterly output of 6.2 per cent in Q1, 2012 was the lowest
since Q1, 2009. This deceleration in growth was accompanied by acceleration
in inflation rate from 10.2 per cent in Q2, 2011 to 12.1 per cent in the first
quarter of 2012.
3.0 Literature Review
The growth theory literature on inflation-growth nexus in the 1950s
emphasized the positive impact of inflation on the rate of economic growth
(popularly known as the Tobin effect) while the costs of inflation detailed in
Fischer and Modigliani (1978) suggested a negative association through the
new growth theory mechanisms. Other strands of related literature have also
argued that the negative relationship between inflation and growth is not
universal (i.e. it appears after certain inflation thresholds) and hence
nonlinear.
Paul et al (1997) used annual data spanning the period 1960-1989 on 48
developing countries and 22 developed ones to examine the inflation-growth
nexus. They found mixed evidences as the relationship was negative in some
countries and positive in others. In a study of eleven African economies, CBN
(1974) examined the relationship between inflation and output growth and
found that in six of the countries (Egypt, Gabon, Ghana, Ivory Coast, Kenya
and Sudan) the sign of the price coefficient in the growth regressions was
negative. However, for the other five countries (Morocco, Nigeria, Tunisia,
Uganda and Zambia) the price coefficient suggested a positive relationship
between inflation and growth. The regression coefficients for both the
individual countries and the group estimates were not statistically significant
and therefore could not provide basis for firm conclusion. This study was
however deficient in the sense that the relationships specified assumed that
price was the only important variable influencing output, thus, ignoring other
crucial control variables.
Barro (1995) used data for 100 countries from 1960 to 1990 to investigate the
effects of inflation on economic performance by using the instrumental
variable estimation method. He found that a 10 percentage point increase in
average inflation per year yielded a reduction in growth rate of real per capita
GDP of between 0.2 and 0.3 percentage points. He further noted that the

106 Inflation and Economic Growth in Nigeria:
Detecting the Threshold Level Doguwa
inclusion of high inflation experiences in the growth regressions yielded more
statistically significant results and stated that the direction of causation runs
from higher inflation to reduced growth. Malla (1997) used a small sample of
eleven OECD countries in a pooled time series and cross-section fashion to
examine the relationship between inflation and growth. He concluded that the
negative effects of inflation on economic growth more than outweigh its
positive effects.
Faria and Carneiro (2001) examined the inflation-growth nexus from the
perspective of an economy suffering from high and persistent inflation. He
studied the case of Brazil and found empirical evidence for a negative effect
of inflation on output in the short run. Also, Smyth (1992) confirmed a
negative relationship between inflation and growth in the USA and estimated
that each one percentage point increase in the USA inflation reduces the
country’s annual growth rate by 0.223%. In another study on the USA, Smyth
(1994) showed that increased inflation impacts growth negatively in the USA
and estimated that each one percentage point increase in inflation caused a
reduction of 0.158% in America’s output growth. In the case of Germany,
Smyth (1995) estimated that a 10% increase in the rate of inflation reduces the
rate of growth of total factor productivity by 0.025%. Umaru and Zubairu
(2012) examined the impact of inflation on economic growth and
development in Nigeria between 1970-2010 and found that inflation possessed
a positive impact on economic growth through encouraging productivity and
output level and on evolution of total factor productivity
Bruno and Easterly (1998) investigated possible relationship between inflation
and economic growth using cross country data. They found that inflation has
negative effect on medium to long term economic growth and showed that the
relationship is influenced by countries with extreme values (either very high
or very low inflation). They argued that inflation rates in excess of a critical
value of 40 per cent are inimical to growth and went ahead to investigating
only cases of discrete high-inflation (40 per cent and above) crises. This
yielded very robust empirical result that growth falls sharply during high-
inflation episodes and recovers rapidly as inflation falls to moderate levels.
Bullard (1995) also provided firm evidence that the negative relationship
between inflation and growth only manifests when inflation rates are in excess
of some threshold levels.
CBN Journal of Applied Statistics Vol.3 No.2 107
Examining the non-linear relationship between inflation and economic
growth, Burdekin(2000) showed that the effects of inflation on growth
reverses substantially as the inflation rate rises. He concluded that the
threshold at which inflation first begins to negatively affect growth is around 8
per cent for industrial economies and 3 per cent or less for developing
countries. Also, Mallik and Chowdhury (2001) empirically examined the
relationship between inflation and GDP growth for four South Asian countries
(Bangladesh, India, Pakistan and Sri Lanka) using co-integration and error
correction models. They found evidence of a long-run positive relationship
between GDP growth and inflation. They also discovered significant
feedbacks between inflation and economic growth and concluded that the
sensitivity of inflation to changes in growth rates is larger than that of growth
to changes in inflation rates. This study puts the countries on a knife edge as
they struggle to achieve non-inflationary growth. The challenge for them,
therefore, is to find a growth rate that is consistent with a stable inflation rate,
rather than beat inflation first to take them to a path of faster economic
growth.
Khan and Senhadji (2001) estimated a panel regression with data from 140
countries and spanning about 40 years to investigate the nonlinear relationship
between inflation and economic growth. Having established the presence of
nonlinearity, they found a threshold range of 1-3 per cent for industrial
economies and 11 – 12 per cent for developing economies. The estimated
relationships were found to be robust to different estimation procedures,
alternative specifications, changes in threshold levels and different data
frequency.
Drukker et al. (2005) used data from a sample of 138 countries from 1950 to
2000 to investigate the threshold effects in the relationship between inflation
and economic growth. The panel regression results revealed that there is one
threshold with an estimated value of 19.16 per cent that is well identified by
the full sample. For the industrialized sample, the results indicated that there
are two threshold points at 2.57 per cent and 12.61 per cent.
Li (2005) used data for 90 developing countries and 28 developed countries
over the period 1961 – 2004 and found evidence of a nonlinear relationship
between inflation and economic growth. He further showed that the form of
nonlinearity in the inflation-growth relationship for developed countries differ
from that of the developing ones. While two thresholds were found for the
108 Inflation and Economic Growth in Nigeria:
Detecting the Threshold Level Doguwa
latter, only one threshold was detected for the former. He also studied the
transmission channel through which inflation affects economic growth in a
nonlinear manner. Based on theory and empirical findings, he identified two
major transmission channels, which are the capital accumulation channel and
the total factor productivity channel. He noted that inflation has been
documented to affect economic growth either directly or via the behavior of
the financial intermediaries. He opined that high and unstable prices affect
the financial market and developments in the financial markets in turn affect
the level and efficiency of investment and ultimately output growth. He
concluded, through his empirical work, that for both developing and
developed countries, the total factor productivity is the channel through which
inflation adversely and nonlinearly affects economic growth.
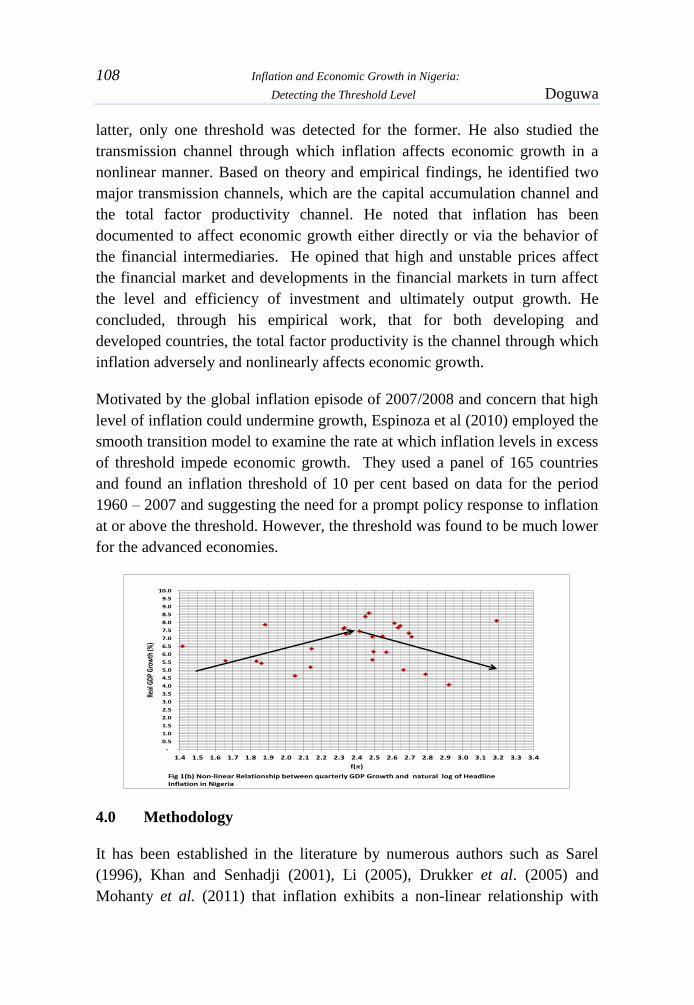
Motivated by the global inflation episode of 2007/2008 and concern that high
level of inflation could undermine growth, Espinoza et al (2010) employed the
smooth transition model to examine the rate at which inflation levels in excess
of threshold impede economic growth. They used a panel of 165 countries
and found an inflation threshold of 10 per cent based on data for the period
1960 – 2007 and suggesting the need for a prompt policy response to inflation
at or above the threshold. However, the threshold was found to be much lower
for the advanced economies.
4.0 Methodology
It has been established in the literature by numerous authors such as Sarel
(1996), Khan and Senhadji (2001), Li (2005), Drukker et al. (2005) and
Mohanty et al. (2011) that inflation exhibits a non-linear relationship with
-
0.5
1.0
1.5
2.0
2.5
3.0
3.5
4.0
4.5
5.0
5.5
6.0
6.5
7.0
7.5
8.0
8.5
9.0
9.5
10.0
1.4 1.5 1.6 1.7 1.8 1.9 2.0 2.1 2.2 2.3 2.4 2.5 2.6 2.7 2.8 2.9 3.0 3.1 3.2 3.3 3.4
Real
GDP
Gro
wth
(%)
f(π)
Fig 1(b) Non-linear Relationship between quarterly GDP Growth and natural log of Headline Inflation in Nigeria
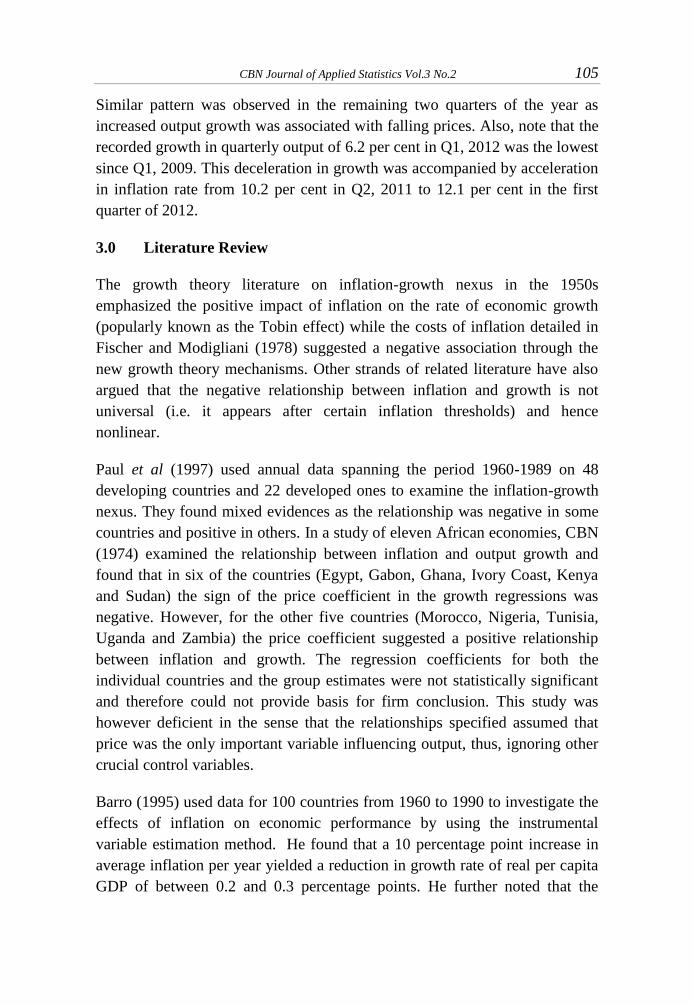
CBN Journal of Applied Statistics Vol.3 No.2 109
economic growth. It is generally accepted that inflation has a negative effect
on growth once it crosses the threshold level, while below the threshold level
it is generally expected to have a positive impact on growth. This non-linear
relationship between growth and inflation appears to also hold for Nigerian
data as depicted in Fig. 1(b).
The list of variables used in the paper for the specifications of the three
adapted threshold inflation models of Sarel (1996), Khan and Senhadji (2001)
and Drukker et al. (2005) are presented in Table 1 below:
4.1 Sarel Threshold Model
Sarel (1996) estimates the coefficients β0 and β1, which for a given country
has the functional form specified in equation (1):
( ) ( )* ( ) ( )+ (1)
where
( ) { ( )
and
{ ( ) ( )
Variable Symbol
π
y
w
μ
ɛ
Autoregressive term
Moving Average term
Headline CPI inflation, that is Quarter t over Quarter t-4
Table 1: List of Variables and their definitions
Variable Definition
Real Gross Domestic Product Growth, that is Quarter t
over Quarter t-4.
Real World Gross Domestic Product Growth, that is
Quarter t over Quarter t-4.

110 Inflation and Economic Growth in Nigeria:
Detecting the Threshold Level Doguwa
In equation (1) denotes the real quarterly GDP growth in time t, is the
coefficient of the semi-log transform of inflation ( ) at time t, is the
coefficient of the extra inflation, and is the expected inflation threshold that
should be determined. The vector constitutes other relevant regressor (or
control) variables and is their coefficient vector. The error or moving
average term ɛt is expected to be identically and independently normally
distributed with mean zero and constant variance σ2. With a chosen basic
model, equation (1) is iterated with different values of log ( ) and the
structural break occurs at the value of for which the chosen statistical loss
function is a minimum. Also, at this value of , the sum of and which
determines the effect of inflation on output growth, will change sign
significantly.
4.2 Khan and Senhadji Threshold Model
Khan and Senhadji (2001) use another econometric method for threshold
estimation and inference that were earlier developed by Chan and Tsay (1998)
and Hansen (2000) in the context of panel models with threshold effects. For a
typical country, the model is specified in equation (2)
* ( ) ( ) ( )+ ( )* ( )
( ) ( )+ (2)
The effect of inflation on GDP growth is captured by γ1 for periods in which
semi-log of inflation is less than or equal to ( ) and for periods when
the semi-log of inflation rates are higher than ( ). The indicator function
( ) equals unity when πt is greater than one and zero, otherwise. All
other parameters are as defined in equation (1). With a basic chosen model,
equation (2) can also be iterated with different values of ( ) to estimate
both the threshold inflation level as well as the model parameters.
4.3 Drukker et al. Threshold Model
Drukker et al. (2005) apply a new econometric method for estimation and
inference in fixed effects panel data models that may contain threshold
inflation effects. This model adapted to estimate the coefficients and number
of threshold points in a given country is specified in equation (3)
CBN Journal of Applied Statistics Vol.3 No.2 111
∑ ( ) (3)
where n is the number of threshold points, denotes the growth in real GDP
at time , is the coefficient on the semi-log transformation of inflation
( ), in threshold region and is a vector of other regressor variables, φ
is a vector of coefficients on and is as defined in equation (1).
The threshold region indicator variable dtk is defined as:
{ (
) ( ) ( )
where ( ) , (
) are the end-points and ( ) for
* + are the threshold inflation points. When , equation (3)
reduces to the classical linear fixed effects (FE) model
( ) (4)
and there is no inflation threshold effect. However when , equation (3)
is non-linear in the semi-log of inflation. If the true number of threshold points
and their values are known, equation (3) would be a linear model and all the
standard estimation methods could be used. However, the lack of knowledge
of the number of threshold points and their values complicates the estimation
and inference. In this case, sequential estimation procedure such as
conditional least squares is applied to estimate the thresholds, the number of
thresholds and other model parameters.
5.0 Optimization and Inferential Method
In the three models considered in equations (1), (2) and (3), the threshold
inflation were unknown and so the models could not be estimated by ordinary
least squares method. These models would have to be estimated ideally using
the non-linear least squares (NLLS), but as Khan and Senhadji (2001) noted,
( ) enters the regression in a non-linear and non-differentiable manner.
This means that conventional gradient search techniques used in NLLS would
not be appropriate, in this case.
Following Khan and Senhadji (2001), the optimization method adopted in this
paper is the conditional least squares, which is described as follows. For any
given ( ), the basic chosen model estimated using the Generalized
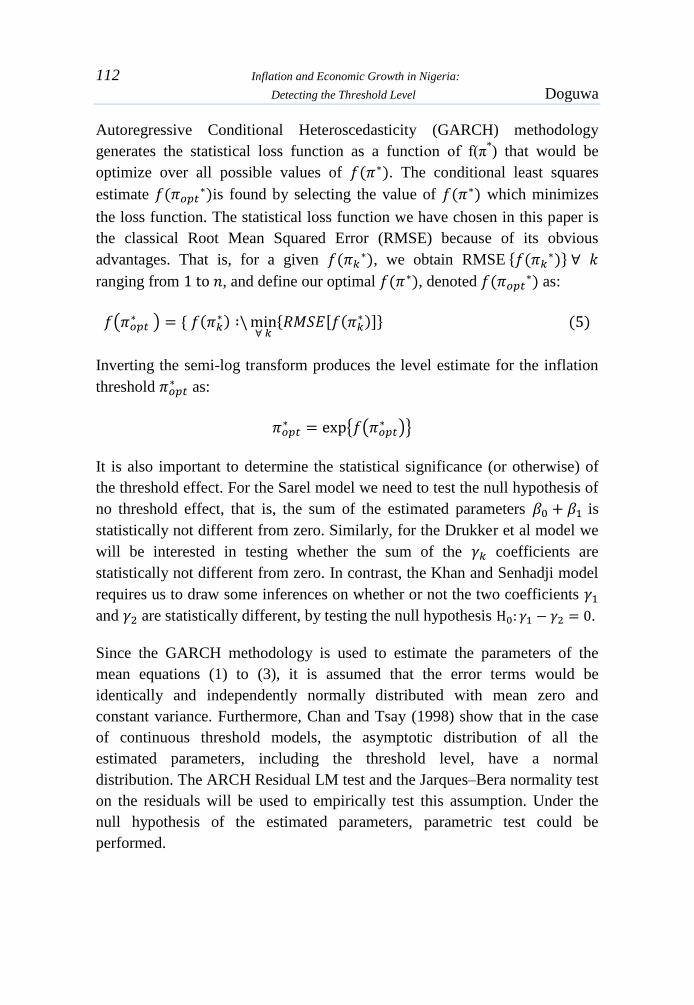
112 Inflation and Economic Growth in Nigeria:
Detecting the Threshold Level Doguwa
Autoregressive Conditional Heteroscedasticity (GARCH) methodology
generates the statistical loss function as a function of f(π*) that would be
optimize over all possible values of ( ). The conditional least squares
estimate ( )is found by selecting the value of ( ) which minimizes
the loss function. The statistical loss function we have chosen in this paper is
the classical Root Mean Squared Error (RMSE) because of its obvious
advantages. That is, for a given ( ), we obtain RMSE * (
)+
ranging from , and define our optimal ( ), denoted ( ) as:
( ) * (
)
* , ( )-+ ( )
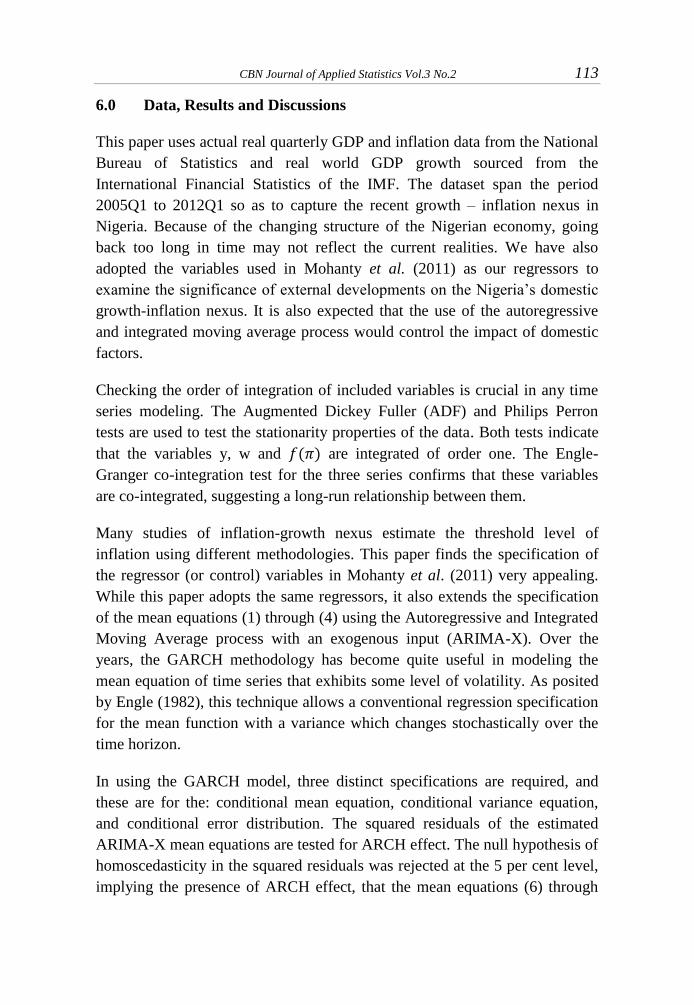
Inverting the semi-log transform produces the level estimate for the inflation
threshold as:
{ (
)}
It is also important to determine the statistical significance (or otherwise) of
the threshold effect. For the Sarel model we need to test the null hypothesis of
no threshold effect, that is, the sum of the estimated parameters is
statistically not different from zero. Similarly, for the Drukker et al model we
will be interested in testing whether the sum of the coefficients are
statistically not different from zero. In contrast, the Khan and Senhadji model
requires us to draw some inferences on whether or not the two coefficients
and are statistically different, by testing the null hypothesis .
Since the GARCH methodology is used to estimate the parameters of the
mean equations (1) to (3), it is assumed that the error terms would be
identically and independently normally distributed with mean zero and
constant variance. Furthermore, Chan and Tsay (1998) show that in the case
of continuous threshold models, the asymptotic distribution of all the
estimated parameters, including the threshold level, have a normal
distribution. The ARCH Residual LM test and the Jarques–Bera normality test
on the residuals will be used to empirically test this assumption. Under the
null hypothesis of the estimated parameters, parametric test could be
performed.
CBN Journal of Applied Statistics Vol.3 No.2 113
6.0 Data, Results and Discussions
This paper uses actual real quarterly GDP and inflation data from the National
Bureau of Statistics and real world GDP growth sourced from the
International Financial Statistics of the IMF. The dataset span the period
2005Q1 to 2012Q1 so as to capture the recent growth – inflation nexus in
Nigeria. Because of the changing structure of the Nigerian economy, going
back too long in time may not reflect the current realities. We have also
adopted the variables used in Mohanty et al. (2011) as our regressors to
examine the significance of external developments on the Nigeria’s domestic
growth-inflation nexus. It is also expected that the use of the autoregressive
and integrated moving average process would control the impact of domestic
factors.
Checking the order of integration of included variables is crucial in any time
series modeling. The Augmented Dickey Fuller (ADF) and Philips Perron
tests are used to test the stationarity properties of the data. Both tests indicate
that the variables y, w and ( ) are integrated of order one. The Engle-
Granger co-integration test for the three series confirms that these variables
are co-integrated, suggesting a long-run relationship between them.
Many studies of inflation-growth nexus estimate the threshold level of
inflation using different methodologies. This paper finds the specification of
the regressor (or control) variables in Mohanty et al. (2011) very appealing.
While this paper adopts the same regressors, it also extends the specification
of the mean equations (1) through (4) using the Autoregressive and Integrated
Moving Average process with an exogenous input (ARIMA-X). Over the
years, the GARCH methodology has become quite useful in modeling the
mean equation of time series that exhibits some level of volatility. As posited
by Engle (1982), this technique allows a conventional regression specification
for the mean function with a variance which changes stochastically over the
time horizon.
In using the GARCH model, three distinct specifications are required, and
these are for the: conditional mean equation, conditional variance equation,
and conditional error distribution. The squared residuals of the estimated
ARIMA-X mean equations are tested for ARCH effect. The null hypothesis of
homoscedasticity in the squared residuals was rejected at the 5 per cent level,
implying the presence of ARCH effect, that the mean equations (6) through
114 Inflation and Economic Growth in Nigeria:
Detecting the Threshold Level Doguwa
(8), using as control variables - the real world GDP growth, AR(3), SAR(4)
and MA(4), possess time varying volatilities.
6.1 Estimation Using Sarel’s Model
Following Sarel (1996) methodology, equation (1) is estimated using
symmetric GARCH (1,1) to obtain the mean equation:
( ) ( )* ( ) ( )+
(6)
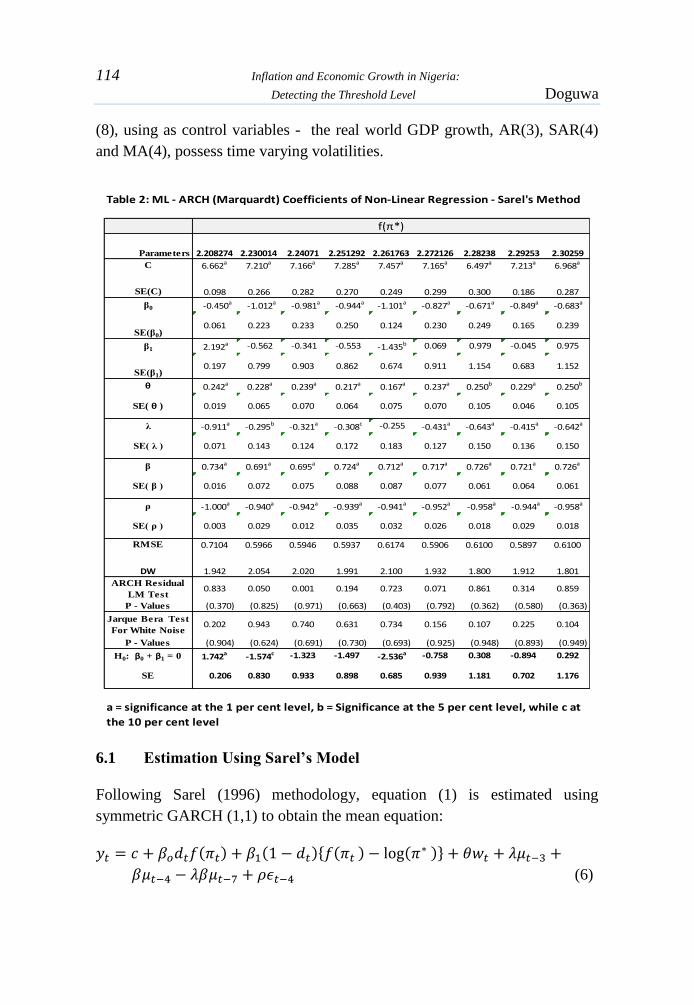
Parameters 2.208274 2.230014 2.24071 2.251292 2.261763 2.272126 2.28238 2.29253 2.30259
C 6.662a 7.210a 7.166a 7.285a 7.457a 7.165a 6.497a 7.213a 6.968a
SE(C) 0.098 0.266 0.282 0.270 0.249 0.299 0.300 0.186 0.287
β0 -0.450a -1.012a -0.981a -0.944a -1.101a -0.827a -0.671a -0.849a -0.683a
SE(β0)0.061 0.223 0.233 0.250 0.124 0.230 0.249 0.165 0.239
β1 2.192a -0.562 -0.341 -0.553 -1.435b 0.069 0.979 -0.045 0.975
SE(β1)0.197 0.799 0.903 0.862 0.674 0.911 1.154 0.683 1.152
θ 0.242a 0.228a 0.239a 0.217a 0.167a 0.237a 0.250b 0.229a 0.250b
SE( θ ) 0.019 0.065 0.070 0.064 0.075 0.070 0.105 0.046 0.105
λ -0.911a -0.295b -0.321a -0.308c -0.255 -0.431a -0.643a -0.415a -0.642a
SE( λ ) 0.071 0.143 0.124 0.172 0.183 0.127 0.150 0.136 0.150
β 0.734a 0.691a 0.695a 0.724a 0.712a 0.717a 0.726a 0.721a 0.726a
SE( β ) 0.016 0.072 0.075 0.088 0.087 0.077 0.061 0.064 0.061
ρ -1.000a -0.940a -0.942a -0.939a -0.941a -0.952a -0.958a -0.944a -0.958a
SE( ρ ) 0.003 0.029 0.012 0.035 0.032 0.026 0.018 0.029 0.018
RMSE 0.7104 0.5966 0.5946 0.5937 0.6174 0.5906 0.6100 0.5897 0.6100
DW 1.942 2.054 2.020 1.991 2.100 1.932 1.800 1.912 1.801
ARCH Residual
LM Test0.833 0.050 0.001 0.194 0.723 0.071 0.861 0.314 0.859
P - Values (0.370) (0.825) (0.971) (0.663) (0.403) (0.792) (0.362) (0.580) (0.363)
Jarque Bera Test
For White Noise0.202 0.943 0.740 0.631 0.734 0.156 0.107 0.225 0.104
P - Values (0.904) (0.624) (0.691) (0.730) (0.693) (0.925) (0.948) (0.893) (0.949)
H0: β0 + β1 = 0 1.742a -1.574c -1.323 -1.497 -2.536a -0.758 0.308 -0.894 0.292
SE 0.206 0.830 0.933 0.898 0.685 0.939 1.181 0.702 1.176
Table 2: ML - ARCH (Marquardt) Coefficients of Non-Linear Regression - Sarel's Method
f(π*)
a = significance at the 1 per cent level, b = Significance at the 5 per cent level, while c at
the 10 per cent level
CBN Journal of Applied Statistics Vol.3 No.2 115
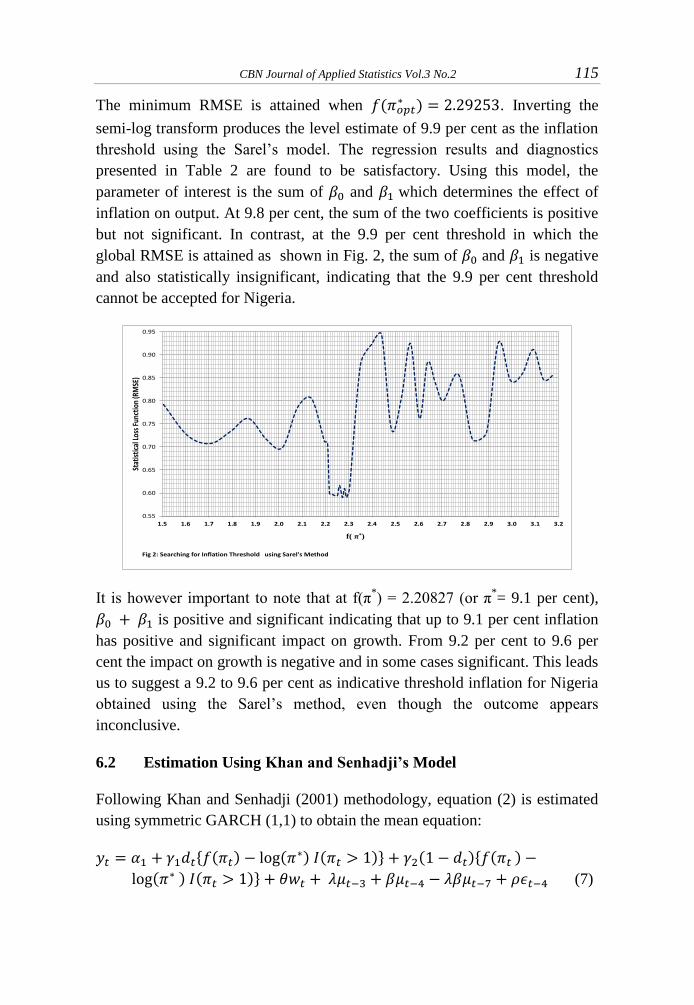
The minimum RMSE is attained when ( ) . Inverting the
semi-log transform produces the level estimate of 9.9 per cent as the inflation
threshold using the Sarel’s model. The regression results and diagnostics
presented in Table 2 are found to be satisfactory. Using this model, the
parameter of interest is the sum of and which determines the effect of
inflation on output. At 9.8 per cent, the sum of the two coefficients is positive
but not significant. In contrast, at the 9.9 per cent threshold in which the
global RMSE is attained as shown in Fig. 2, the sum of and is negative
and also statistically insignificant, indicating that the 9.9 per cent threshold
cannot be accepted for Nigeria.
It is however important to note that at f(π*) = 2.20827 (or π
*= 9.1 per cent),
is positive and significant indicating that up to 9.1 per cent inflation
has positive and significant impact on growth. From 9.2 per cent to 9.6 per
cent the impact on growth is negative and in some cases significant. This leads
us to suggest a 9.2 to 9.6 per cent as indicative threshold inflation for Nigeria
obtained using the Sarel’s method, even though the outcome appears
inconclusive.
6.2 Estimation Using Khan and Senhadji’s Model
Following Khan and Senhadji (2001) methodology, equation (2) is estimated
using symmetric GARCH (1,1) to obtain the mean equation:
* ( ) ( ) ( )+ ( )* ( )
( ) ( )+ (7)
0.55
0.60
0.65
0.70
0.75
0.80
0.85
0.90
0.95
1.5 1.6 1.7 1.8 1.9 2.0 2.1 2.2 2.3 2.4 2.5 2.6 2.7 2.8 2.9 3.0 3.1 3.2
Stat
istic
al L
oss
Func
tion
(RM
SE)
f( π*)
Fig 2: Searching for Inflation Threshold using Sarel's Method
116 Inflation and Economic Growth in Nigeria:
Detecting the Threshold Level Doguwa
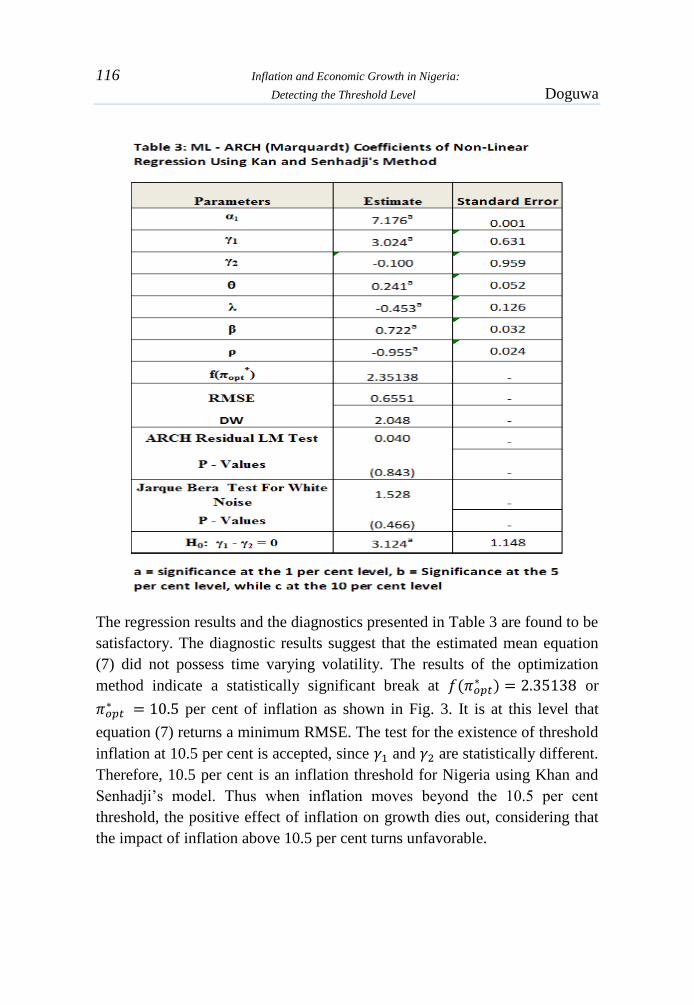
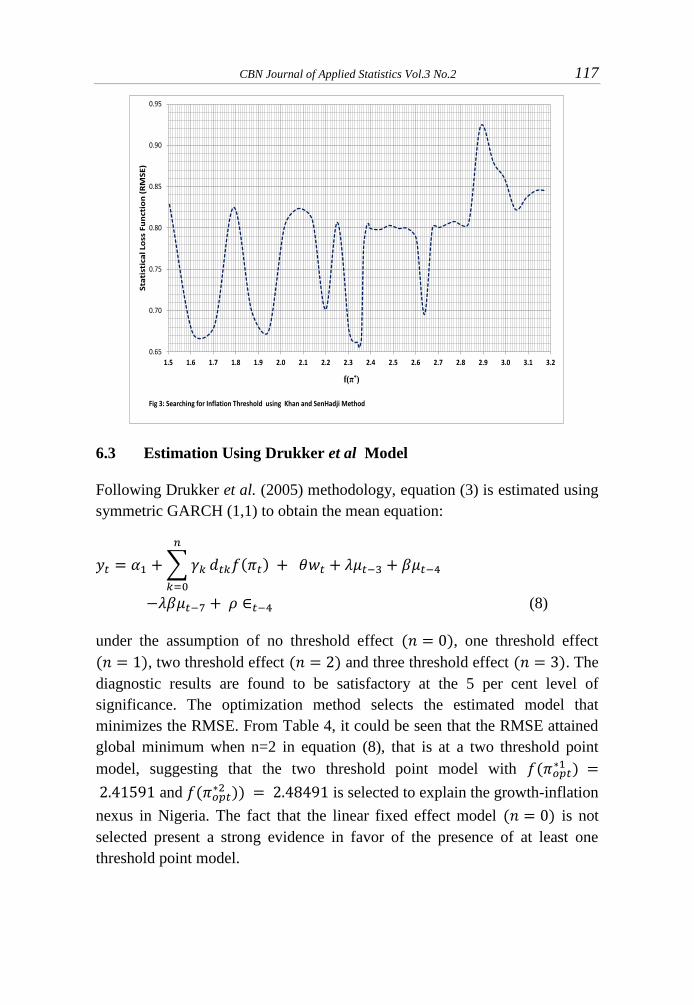
The regression results and the diagnostics presented in Table 3 are found to be
satisfactory. The diagnostic results suggest that the estimated mean equation
(7) did not possess time varying volatility. The results of the optimization
method indicate a statistically significant break at ( ) or
per cent of inflation as shown in Fig. 3. It is at this level that
equation (7) returns a minimum RMSE. The test for the existence of threshold
inflation at 10.5 per cent is accepted, since and are statistically different.
Therefore, 10.5 per cent is an inflation threshold for Nigeria using Khan and
Senhadji’s model. Thus when inflation moves beyond the 10.5 per cent
threshold, the positive effect of inflation on growth dies out, considering that
the impact of inflation above 10.5 per cent turns unfavorable.
CBN Journal of Applied Statistics Vol.3 No.2 117
6.3 Estimation Using Drukker et al Model
Following Drukker et al. (2005) methodology, equation (3) is estimated using
symmetric GARCH (1,1) to obtain the mean equation:
∑
( )
(8)
under the assumption of no threshold effect ( ), one threshold effect
( ), two threshold effect ( ) and three threshold effect ( ). The
diagnostic results are found to be satisfactory at the 5 per cent level of
significance. The optimization method selects the estimated model that
minimizes the RMSE. From Table 4, it could be seen that the RMSE attained
global minimum when n=2 in equation (8), that is at a two threshold point
model, suggesting that the two threshold point model with ( )
and ( )) is selected to explain the growth-inflation
nexus in Nigeria. The fact that the linear fixed effect model ( ) is not
selected present a strong evidence in favor of the presence of at least one
threshold point model.
0.65
0.70
0.75
0.80
0.85
0.90
0.95
1.5 1.6 1.7 1.8 1.9 2.0 2.1 2.2 2.3 2.4 2.5 2.6 2.7 2.8 2.9 3.0 3.1 3.2
Sta
tist
ica
l Lo
ss F
un
ctio
n (
RM
SE
)
f(π*)
Fig 3: Searching for Inflation Threshold using Khan and SenHadji Method

118 Inflation and Economic Growth in Nigeria:
Detecting the Threshold Level Doguwa
Inverting the semi-log transform produces the level threshold inflation
estimates of 11.2 per cent and 12.0 per cent for the two threshold-point model.
No of Thresholds RMSE DWResidual
ARCH LM
Jarques
Bera Test
for White
Noise
0.185 2.504
(0.671) (0.286)
1.793 2.207
(0.192) (0.332)
4.065 1.913
(0.054) (0.384)
0.192 0.692
(0.665) (0.707)
p-values are in bracket
0 0.6881 1.826
1 0.5816 2.416
Table 4: Model Selection for Dukker et al Method
2 0.5759 2.181
3 0.6083 2.239
Parameters Estimate Standard Error
α1 0.723 1.303
γ0 2.933a 0.517
γ1 2.619a 0.417
γ2 2.497a 0.385
θ 0.245a 0.052
λ -0.559a 0.121
β 0.750a 0.053
ρ -0.971a 0.021
f(πopt*1
) 2.41591 -
f(πopt*2
) 2.48491 -
H0: Σi γi = 0 8.050a 0.768
Table 5: ML - ARCH (Marquardt) Coefficients of Non-Linear
Regression Using Drukker, et al 's Method
a = significance at the 1 per cent level, b = Significance at the 5 per
cent level, while c at the 10 per cent level
CBN Journal of Applied Statistics Vol.3 No.2 119
The estimated parameters of this model are presented in Table 5. All the
estimated parameters of equation (8) with , except the constant are
statistically significant. Drukker et al. (2005) noted that although the
thresholds and the semi-log transform of inflation complicates the
computation of the marginal effect of inflation on long-run growth, the
monetary theory literature generates at least an interesting hypothesis about
the coefficients. The null hypothesis that money is super-neutral can be
investigated by testing whether all the are zero, which is equivalent to
testing that their sum add up to zero. From Table 5, it is clear that this
hypothesis of the super- neutrality of money is rejected, suggesting that there
is a threshold level of inflation above which money is not super-neutral.
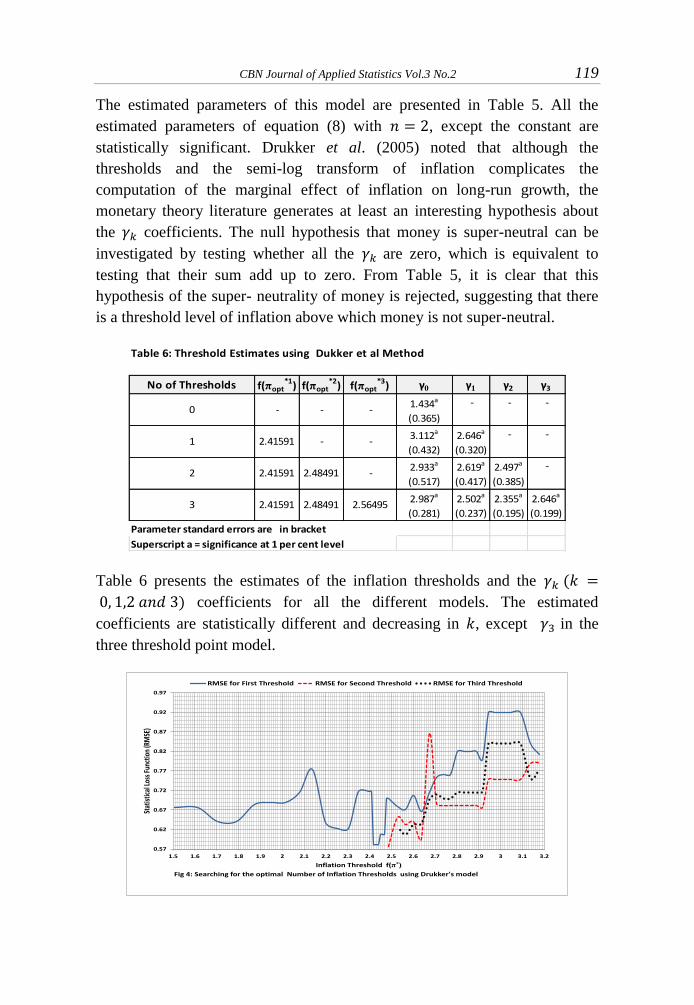
Table 6 presents the estimates of the inflation thresholds and the (
) coefficients for all the different models. The estimated
coefficients are statistically different and decreasing in , except in the
three threshold point model.
No of Thresholds f(πopt*1) f(πopt
*2) f(πopt*3) γ0 γ1 γ2 γ3
1.434a - - -
(0.365)
3.112a 2.646a - -
(0.432) (0.320)
2.933a 2.619a 2.497a -
(0.517) (0.417) (0.385)
2.987a 2.502a 2.355a 2.646a
(0.281) (0.237) (0.195) (0.199)
Parameter standard errors are in bracket
Superscript a = significance at 1 per cent level
1 2.41591 - -
Table 6: Threshold Estimates using Dukker et al Method
0 - - -
2 2.41591 2.48491 -
3 2.41591 2.48491 2.56495
0.57
0.62
0.67
0.72
0.77
0.82
0.87
0.92
0.97
1.5 1.6 1.7 1.8 1.9 2 2.1 2.2 2.3 2.4 2.5 2.6 2.7 2.8 2.9 3 3.1 3.2
Stat
istic
al Lo
ss F
unct
ion
(RM
SE)
Inflation Threshold f(π*)
Fig 4: Searching for the optimal Number of Inflation Thresholds using Drukker's model
RMSE for First Threshold RMSE for Second Threshold RMSE for Third Threshold
120 Inflation and Economic Growth in Nigeria:
Detecting the Threshold Level Doguwa
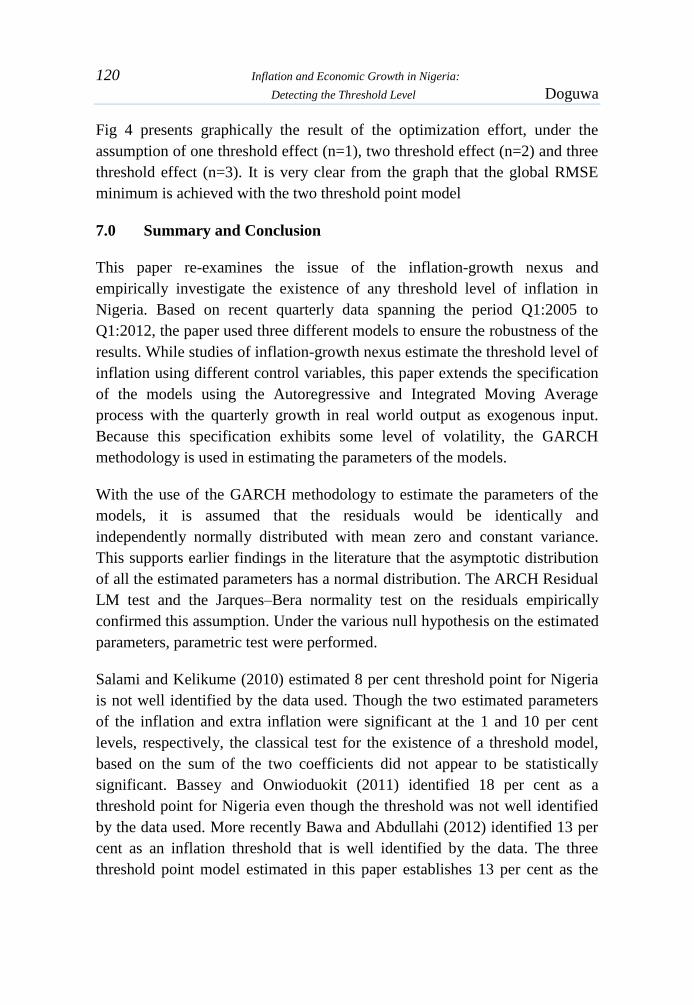
Fig 4 presents graphically the result of the optimization effort, under the
assumption of one threshold effect (n=1), two threshold effect (n=2) and three
threshold effect (n=3). It is very clear from the graph that the global RMSE
minimum is achieved with the two threshold point model
7.0 Summary and Conclusion
This paper re-examines the issue of the inflation-growth nexus and
empirically investigate the existence of any threshold level of inflation in
Nigeria. Based on recent quarterly data spanning the period Q1:2005 to
Q1:2012, the paper used three different models to ensure the robustness of the
results. While studies of inflation-growth nexus estimate the threshold level of
inflation using different control variables, this paper extends the specification
of the models using the Autoregressive and Integrated Moving Average
process with the quarterly growth in real world output as exogenous input.
Because this specification exhibits some level of volatility, the GARCH
methodology is used in estimating the parameters of the models.
With the use of the GARCH methodology to estimate the parameters of the
models, it is assumed that the residuals would be identically and
independently normally distributed with mean zero and constant variance.
This supports earlier findings in the literature that the asymptotic distribution
of all the estimated parameters has a normal distribution. The ARCH Residual
LM test and the Jarques–Bera normality test on the residuals empirically
confirmed this assumption. Under the various null hypothesis on the estimated
parameters, parametric test were performed.
Salami and Kelikume (2010) estimated 8 per cent threshold point for Nigeria
is not well identified by the data used. Though the two estimated parameters
of the inflation and extra inflation were significant at the 1 and 10 per cent
levels, respectively, the classical test for the existence of a threshold model,
based on the sum of the two coefficients did not appear to be statistically
significant. Bassey and Onwioduokit (2011) identified 18 per cent as a
threshold point for Nigeria even though the threshold was not well identified
by the data used. More recently Bawa and Abdullahi (2012) identified 13 per
cent as an inflation threshold that is well identified by the data. The three
threshold point model estimated in this paper establishes 13 per cent as the
CBN Journal of Applied Statistics Vol.3 No.2 121
third threshold point model, but is outperformed by the chosen two threshold
point model.
Although the empirical results presented in this paper identifies 9.9 per cent as
a probable inflation threshold that is not fully identified by the data, the paper
strongly suggests the existence of a one threshold point of 10.5 per cent that is
well identified by the data. The results also suggest a two threshold-point
model for Nigeria, with the two threshold points at 11.2 and 12 per cent
beyond which inflation exerts a negative effect on growth. Also, the two
threshold-point model suggests that there is a threshold level of inflation
above which money is not super-neutral.
It should be noted that the concept of inflation threshold and inflation target
are quite distinct. Inflation targeting is a monetary policy construct in which a
central bank announces a target and then directs its policy tools in achieving
the set target. Inflation threshold on the other hand, is a point of inflexion for
the inflation-growth trade-off, where at some low levels, inflation may be
positively correlated with growth, but at higher levels inflation is likely to be
inimical to growth. While recommending that inflation threshold need not be
necessarily the inflation target, the inflation objective for monetary policy
should be set lower than the inflation threshold.
References
Barro, R. J. (1995), “Inflation and Economic Growth”, NBER working Paper
Series, No. 5326.
Bassey, G. E. and E.A. Onwioduokit (2011), “An Analysis of the Threshold
Effects of Inflation on Economic Growth in Nigeria”, WAIFEM
Review, Vol. 8, No. 2
Bawa, S. and I.S. Abdullahi (2012), “Threshold Effect of Inflation on
Economic Growth in Nigeria”, To Appear in CBN Journal of Applied
Statistics, Vol. 3, No. 1
Bruno, M. and W. Easterly (1998), “Inflation Crisis and Long-Run Growth”,
Journal of Monetary Economics, Vol. 41
122 Inflation and Economic Growth in Nigeria:
Detecting the Threshold Level Doguwa
Bullard, J. K. (1995), “The Long-Run Relationship between Inflation and
Output in Post-war Economies”, Journal of Monetary Economics, Vol.
36, pp 477-496
Burdekin, R. C. K. (2000), “When does Inflation Hurt Economic Growth?
Different Nonlinearities for Different Economies”, Working Papers in
Economics, Claremont Colleges, August 2000.
CBN (1974), “Origin and Development of Inflationary Trends in African
Countries: Impact on their Growth”, Association of Central Banks
seminar held in Addis Ababa, Ethiopia, 5th
– 16th
August, 1974.
Chan, K. and. R.S. Tsay (1998), Limiting Properties of the Least Squares
Estimator of a Continuous Threshold Autoregressive Model,
Biometrika, Vol. 85, No 2 pp. 413-426
Chimobi, O. P. (2010), “Inflation and Economic Growth in Nigeria”, Journal
of Sustainable Development, Vol. 3, No. 2
Dorrance, G. S. (1963), “The Effect of Inflation on Economic Development”
IMF Staff Papers, 10: 1-47
Drukker, D, Gomis-Porqueras, P. and Hernandez-Verme, P. (2005),
“Threshold Effects in the Relationship between Inflation and Growth:
A New Panel-Data approach” http://www.uh.edu/~cmurray/
TCE/papers/Drukker.pdf
Engle, R. (1982), “Autoregressive Conditional Heteroscedasticity with
estimates of the variance of United Kingdom Inflation”,
Econometrica, 50 (1): 987-1007
Espinoza, R., Leon, H. and Prasad, A. (2010), “Estimating the Inflation-
Growth Nexus – A Smooth Transition Model” IMF Working Paper
Faria, J. R. and Carneiro, F. G. (2001) “Does High Inflation Affect Growth in
the Long and Short Run?” Journal of Applied Economics, 4(1)
Fischer, S. (1993), “The Role of Macroeconomic Factors in Economic
Growth” Journal of Monetary Economics, 32: 485-512

CBN Journal of Applied Statistics Vol.3 No.2 123
Fischer, S. and Modigliani, F. (1978), “Towards an Understanding of the Real
Effects and Costs of Inflation”, NBER Working Papers, No. 0303
Friedman, M., (1973), Money and Economic Development, Toronto:
Lexington Books.
Gosh, A. and Phillips, S. (1998), “Warning: Inflation May Be harmful to your
Growth”, IMF Staff Papers, 45(4).
Hussain, S. and Malik, S. (2011) “Inflation and Economic Growth: Evidence
from Pakistan” International Journal of Economics and Finance, 3(5).
Johanson, H. G. (1967), Is Inflation a Retarding Factor in Economic Growth?
in Fiscal and Monetary Problems in Developing States, Proceedings of
the Third Rehoroth Conference, ed. By David Krivine
Khan, M. S. and Senhadji, A. S. (2001). “Threshold Effects in the
Relationship between Inflation and Growth”, IMF Staff Papers, 48.
Li, M. (2005), “Inflation and Economic Growth: Threshold Effects and
Transmission Mechanism” Department of Economics, University of
Alberta, Canada (Mimeograph)
Mallik, G. and Chowdhurry, A. (2001). “Inflation and Economic Growth:
Evidence from Four South Asian Countries”, Asia-Pacific
Development Journal, 8(1).
Malla, S. (1997). “Inflation and Economic Growth: Evidence from a Growth
Equation”. Mimeo, Department of Ecpnomics, University of Hawai’1
at Monoa, Honolulu. Available at www.hawaii.edu/~malla
Mohanty, D, Chakraborty, A. B., Das, A. and John, J. (2011). “Inflation
Threshold in India: An Empirical Investigation” Reserve bank of India
Working Paper Series, 18.
Mubarik, Y. A. (2005), “Inflation and Growth: An Estimate of the Threshold
Level of Inflation in Pakistan”, SPB-Research Bulletin, 1(1).
Paul, S. C., Kearney, C. and K. Chowdhurry (1997) “Inflation and Economic
Growth: A Multi-Country Empirical Analysis”, Journal of Applied
Economics, 29.
124 Inflation and Economic Growth in Nigeria:
Detecting the Threshold Level Doguwa
Salami, D. and I. Kelikume (2010), “An Estimation of Inflation Threshold for
Nigeria (1970-2008)”, International review of Business Research
papers, 6(5): 375 – 385.
Sarel, M. (1996). “Nonlinear Effects of Inflation on Economic Growth”, IMF
Staff Paper, 43(1): 199-215
Smyth, D. J. (1992), “Inflation and the Growth Rate in the United States’
Natural Output”, Journal of Applied Economics, 24.
Smyth, D. J. (1994), “Inflation and Growth”, Journal of Macroeconomics, 16.
Smyth, D. J. (1995), “Inflation and Total Factor Productivity in Germany”,
Weltwirtschaftliches Archiv 131: 403-405
Umaru, A. and A.A. Zubairu (2012) “Effect of Inflation on the Growth and
Development of the Nigerian Economy: An Empirical Analysis”,
International Journal of Business and Social Science, 3(10)
Wai, U. T. (1959), “The Relationship between Inflation and Economic
Development: A Statistical Inductive Study”, IMF Staff Papers, 7:
302-317.