Tinkering signaling pathways by gain and loss of protein isoforms ...
Upload
nguyennhanCategory
view
219download
1
1
INFERRING PATHWAYS FROM PROTEIN-PROTEIN
INTERACTION
NETWORKS AND GENE EXPRESSION DATA
FAH SATHIRAPONGSASUTI
Department of Mathematical and Computational Science, Stanford University
Stanford, CA 94305, USA
LILLIAN TO
Department of Bioengineering, Stanford University
Stanford, CA 94305, USA
Biomedical researchers have long studied biological pathways in hopes of further
understanding the effect of disease on critical events and interactions within these
pathways. In recent years, new bioinformatic approaches to pathway prediction have
been developed, taking advantage of the availability of vast amounts of microarray data
and efficient machine learning techniques. Recent years have also led to the large-scale
identification of protein-protein interaction (PPI) networks and transcription-factor-DNA
(TF-DNA) interaction datasets. These large datasets each provide unique information on
gene interactions, but when used alone can result in a high rate of false positive
predictions. To address this problem, we present a novel approach to pathway prediction
which integrates knockout microarray data with protein interaction networks by modeling
the two data sets as an electrical circuit. The Electric Circuit Model achieved 99%
specificity and up to 69% sensitivity in predicting the pheromone signaling pathway.
1. Introduction
Altered cellular signaling networks can give rise to the oncogenic properties of
cancer cells, increase the risk of heart disease, and are responsible for many
other diseases1,2
. The understanding of the exact mechanism of disease
pathogenesis often leads to the development of diagnostic methods and
pharmacological treatments. However, with hundreds of thousands of protein
interactions within even the simplest organisms and the inability to
experimentally deduce every pathway individually, our current knowledge of
pathways remains limited. This lack of knowledge is crippling the development
of treatments for many complex and currently incurable diseases. As a result,
scientists are looking to apply bioinformatic approaches to predict pathways.
These approaches can quickly analyze large amounts of data and
computationally predict signaling pathways for various disease-causing cells.
In the laboratory, targeted manipulation experiments either using knockouts
(i.e. siRNA or genetic knockout organisms) or pharmacological agents are a
primary method for uncovering new parts of a signaling network. These
methods are usually coupled with high-throughput technology such as
microarray analysis. The results of such experiments are in the form of genome-

2
wide expression profiles which represent the end results of the initial cellular
perturbations. Since this data does not give explicit information about the causal
model of the resulting expression profiles, scientists are faced with the challenge
of inferring pathways from the data. Different approaches to this challenge have been developed in recent years.
One such approach developed by Djebbari et al.3 proposed using Bayesian
Network analysis to elucidate pathways from gene expression data. However,
with expression data alone, the results showed a high rate of false positives and
false negatives. In response to this, Djebbari et al. incorporated a preliminary
network derived from protein-protein interaction (PPI) data as seeds for a
Bayesian network analysis of the microarray results. The addition of this data
greatly improved the performance of the algorithm considerably (see Figure 1).
We can see that integrating expression data with additional independent
information may significantly reduce the noise and improve the statistical power
of the analysis4. This method is promising since it provides a model of the
underlying regulatory pathways, enhancing our confidence in a predicted
relationship. In addition, assembly of protein interaction networks is a
burgeoning area in genomics and the amount and quality of protein interaction
data are rapidly improving. However, the final results of the Djebbari et al.
study still leaves room for significant improvements in sensitivity and
specificity.
Figure 1. A graph of the sensitivity and 1-specificity of results from the Djebbari et al. study. Red
represents results after including PPI data, blue represents expression data alone.
Several other groups have incorporated PPI and transcription-factor-DNA
(TF-DNA) interaction datasets into their computational analysis of genomic
data. In particular, groups have paired gene networks generated from these
datasets with expression quantitative trait loci (eQTL) data to finely map which
gene within a known set is the causal factor responsible for observed

3
downstream changes in expression. Both Tu et al.5 and Suthram et al.
6 overlaid
knockout microarray data onto these gene networks. Tu et al. used knockout
microarray data to determine edge scores of each network interaction, modeling
the network as a weighted graph and then applying a greedy random walk
algorithm. While this method is a significant improvement over methods relying
solely on expression data, it only achieves a 50% accuracy rate in predicting
causal and target gene pairs. Its high false positive rate significantly limits its
application to solving real biological problems. In response to this, Suthram et
al. proposed a new algorithm which integrates eQTLs with protein interaction
networks by modeling the two data sets as a wiring diagram of current sources
and resistors. This Electrical Circuit Model algorithm significantly outperformed
the stochastic greedy random walk, achieving 79% accuracy in predicting causal
genes.
There is a great parallel between the analysis of eQTL causal gene
prediction and pathway prediction. In particular, both methods by Tu et al. and
Suthram et al. involve the propagation of signals from causal gene to
downstream target genes. In the following paper, we explore the integration of
PPI, TF-DNA, and microarray data and the application of the Electric Circuit
Model algorithm to deduce biologically relevant pathways.
2. Methods
Our initial study was done on Saccharomyces cerevisiae. This organism was
chosen because of the vast availability of data, as well as the simplicity of its
relation between gene and protein. We represent each gene by its systematic
gene name and assume each protein corresponds to one or more genes.
The procedure can be logically divided into three parts: the generation of a
weighted graph model of the network, the application of the Electric Circuit
Model, and the verification of results.
2.1. Generating a Weighted Graph Model
A single protein interaction network was generated by combining TF-DNA and
PPI data. The PPI dataset was provided by Lee et al,7 consisting of only high-
confidence interactions (log-likelihood score ≥ 4.0). The dataset was then
reduced further based on two criteria: (1) any interaction with sole evidence
code CX (co-expression) was removed and (2) only genes annotated with GO
terms relating to regulation were included (see Appendix A). These PPI
relationships were modeled as undirected edges between two genes. The TF-
DNA data taken from Beyer et al.4 was appended to the network after the
conversion of all proteins into corresponding systematic gene name(s) using the

4
Saccharomyces Genome Database8 (SGD). The directionality of a relationship
was maintained (TF DNA) as a directed edge between two nodes and a TF-
DNA relationship overrode any existing PPI edge in the network. The network
was then assessed for its completeness and connectivity using Cytoscape9.
Knockout data was taken from a large gene knockout expression profiling
study done by Hughes et al.10
In the knockout data, the change in expression of a
gene u when gene x is knocked out is calculated as the log-ratio of expression,
where Ex(u) is the expression level of u when x is perturbed and E0(u) is the
unperturbed expression level of u:
∆𝐸𝑥 𝑢 = log𝐸𝑥 (𝑢)
𝐸0(𝑢) (1)
Missing data points were replaced by the root mean square of the log-ratio of
expression of all other genes in the experiment. We ranked the source gene
knockout microarray data by the absolute value of the log-ratio and choose the
top ranked gene to be our target. The network is then reduced to only the viable
paths between the starting node and a target gene by a breadth first traversal. We
also make the assumption that the expression of the target gene is modulated by
the causal gene through a TF of the target gene. Hence we filter the network
such that the target gene is connected to the rest of the network through TF–
DNA interactions only.
Edge scores, defined as conductance, are then assigned to each remaining
edge in the network. We define the conductance of an edge between two nodes u
and v as the root-mean-square of the log-ratios of each:
𝐶 𝑢, 𝑣 = ∆𝐸𝑥2 𝑢 −∆𝐸𝑥
2 𝑣
2 (2)
2.2. Application of the Electric Circuit Model
To find the predicted pathway in the model, we input a current at the source
gene and treat the target gene as a sink. The circuit is then solved using
Kirchhoff’s and Ohm’s Laws. Because we included directed TF-DNA edges in
our network, we must account for them when solving the circuit. Let D be the
set of all directed edges in our reduced network. Let 𝑑 𝑢, 𝑣 be a new variable
we define for each directed edge flowing from u to v such that if 𝑉 𝑢 > 𝑉 𝑣
then 𝑑 𝑢, 𝑣 = 𝑉 𝑢 − 𝑉 𝑣 , otherwise 𝑑 𝑢, 𝑣 = 0. Lastly, let 𝐼 𝑢, 𝑣 be the
current flowing from node u to v and let s be the source gene. Now the basic
laws can be defined as:
∀ 𝑢, 𝑣 ∉ 𝐷: 𝐼 𝑢, 𝑣 = 𝐶 𝑢, 𝑣 [𝑉 𝑢 − 𝑉 𝑣 ] (3)
∀(𝑢, 𝑣) ∈ 𝐷: 𝐼 𝑢, 𝑣 = 𝐶 𝑢, 𝑣 𝑑(𝑢, 𝑣) (4)
∀𝑣 ≠ 𝑠: 𝐼 𝑢, 𝑣 = 0𝑢 (5)

5
We see that Eq. 3 and 4 are essentially Ohm’s Law which states that the
current flowing through any two nodes is directly proportional to the voltage
difference and the conductance between them. Eq. 5 represents Kirchhoff’s Law
which states that the total sum of current through any node in the circuit m zero.
By defining 𝑑(𝑢, 𝑣) as above, we insure that a current for a directed edge is only
nonzero if it flows in the correct direction. To solve this with linear
programming, we define our objective to be:
𝑀𝑖𝑛 (𝑑 𝑢, 𝑣 − 𝑉 𝑢 − 𝑉 𝑣 )
(𝑢 ,𝑣)∈𝐷
We implemented this linear programming approach in Matlab11
using the
MOSEK12
package to optimize storage of the sparse matrices.
At this point, the predicted pathway can be found by implementing a
minimum cost shortest path algorithm. To do so, we redefine the score of each
edge to be [𝐶 𝑢, 𝑣 + 𝜀]−1, where ε = 1−100 to avoid division by zero. We run
the Dijkstra shortest path algorithm to define the maximum length l of any
predicted pathway. We then apply a depth first search for other minimum cost
paths of length l or shorter with total cost lower than 1, and combine these paths
into a non-linear pathway. This constitutes our prediction.
2.3. Verification and Analysis
In order to judge the performance of the Electric Circuit Model against other
existing algorithms, we implemented the greedy random walk proposed by Tu et
al.5 We use the same conductance calculated for the Electric Circuit Model as
the edge scores of the directed graph. The greedy random walk implemented as
a weighted random walk, where the probability of walking on an edge is
proportional to the edge score, with the key restriction of each walk being
acyclic. If a node is visited a twice, the walk is ended. We attempt 10,000 walks
and choose the path most travelled to be our predicted pathway.
To verify the accuracy of both the Electric Circuit Model and the greedy
random walk we compiled a list of seven gold standard pathways from the SGD
Pathway Database13
(see Appendix B). The pathways available on SGD have
been manually curated and corrected, based on published literature. Gold
standard pathways were chosen based on the availability of knockout data for
the source gene and the presence of the source gene in the protein interaction
network. We ran the seven gold standard pathways for both the Electrical
Circuit Model and the greedy random walk. For each prediction, we compared
the set of genes predicted to be in the pathway with the genes known to be in the
pathway and calculate specificity and sensitivity of the prediction.

6
3. Results
3.1. Network Analysis
The PPI dataset obtained from Lee et al.7 included 102,803 interactions
amongst 5,483 yeast proteins (expressed as systematic gene names), equivalent
to 95% of the validated proteome. After filtering, 2,612 proteins and 37,360
interactions remained. The TF-DNA dataset from Beyer et al.4 included 4,225
genes and 13,436 TF-DNA binding pairs. The final gene interaction network
was composed of 4,861 genes and 50,632 interactions. Network analysis showed
the average degree of the combined network to be 20.7 and the average shortest
path length to be 3.1, suggesting that the combined network is well connected
(see Table 1). Moreover, the combined network is composed of one connected
component.
Table 1. Network statistics for the PPI, TF-DNA datasets and the final network (PPI+TF-DNA).
PPI TF PPI + TF
# of nodes 2,612 4,225 4,861
# of edges 37,360 12,436 50,632
Average degree 28.6 6.34 20.7 Average shortest path length 2.9 4.9 3.1
# of nodes 2,612 4,225 4,861
3.2. Prediction Evaluation
In order to quantitatively measure the performance of our method, we
attempt to predict an experimentally verified pathway. The pheromone signaling
pathway14
(see Figure 2) is one of the most comprehensively studied pathways
in yeast.
We began with STE11 as our source gene. From the STE11 knockout data,
gene YOL014W was selected as the target based on highest absolute change in
expression. We found 85 top scoring pathways of length four linking STE11 to
YOL014W. These include 65 genes, 17 of which are known to be involved in
the pheromone response pathway. However, since the target gene, YOL014W, is
a putative gene whose function remains unknown and is not an established part
of the gold standard pathway, the predicted pathway from STE11 to YOL014W
would naturally include genes in biological processes other than pheromone
response. Particularly, since YOL014W is regulated solely by transcription
factor NRG1, the predicted pathways include genes shared among the
pheromone pathway and NRG1-related pathways such as TEC1 in glucose-
dependent repression of STA115
. Although it is possible that this correlation

7
between the two related pathways exists under the knockout event, it is difficult
to assess the validity of our prediction quantitatively.
Figure 2. Graphical representation of the pheromone response signaling pathway14, in the presence of pheromone simulation.
Since choosing target gene by the expression change alone may result in a
target gene unrelated to the pheromone pathway and using such a target gene
does not benefit us in verifying the predicted pathway, we restricted our set of
potential targets to be within the pheromone pathway in order to move forward
in our analysis. We choose our targets to be the gene in the pheromone pathway
ranked highest in absolute change in expression. In the STE20 knockout data,
gene STE2 has the fifth highest change in expression (log-ratio = 0.558). STE2
is regulated by transcription factor STE12 and is a receptor for alpha-factor
pheromone that initiates signaling response downstream14
. Predicted pathways
from STE12 to STE2 are of length four or less include 32 genes, 14 of which are
in the known pheromone pathway. The predicted pathways only differ at the
second component (see Table 2) and many of the genes are known to interact
with STE20 through PPIs.
Sensitivity and specificity analysis of the prediction also reveals the quality
of the prediction. Since the specificity is defined as (true negative)/(true negative
+ false positive), and our true negative is the number of genes in the combined
network that are not predicted to be in the pathway, the specificity of our
prediction is always high. However, as sensitivity is defined by the fraction of
gold standard genes correctly predicted, it better reflects the quality of our
prediction. For the predicted pathway from STE20 to STE2, the algorithm

8
achieves sensitivity of 99% and specificity of 42%. However, when we relax the
path length restriction and search for path of length five or less, we found 476
pathways, all with the same path cost. The prediction maintains sensitivity of
98% while achieve specificity of 69%. Theoretically we could relax the
restriction further and achieve higher specificity, but since searching for path in
a graph is NP-hard, the run time exponentially increases as we increase the path
length, creating a prohibitively long runtime.
Table 2. Predicted pathways from STE20 to STE2. The length of the
pathways is limited to 4 according to the shortest path found by
Dijkstra algorithm. The genes in bold are known to be in the
pheromone response pathway.
Path Cost Start Gene1 Gene2 (TF) Target
0.0009999999891 STE20 DFG5 STE12 STE2
0.0009999999891 STE20 STE50 STE12 STE2
0.0009999999891 STE20 GPA1 STE12 STE2
0.0009999999891 STE20 KIN31/KIN4/KIN3 STE12 STE2
0.0009999999891 STE20 STE7 STE12 STE2
0.0009999999891 STE20 RGA2 STE12 STE2
0.0009999999891 STE20 ZRG12/DFG16 STE12 STE2
0.0009999999891 STE20 DFG10 STE12 STE2
0.0009999999891 STE20 STE3/DAF2 STE12 STE2
0.0009999999891 STE20 - STE12 STE2
0.0009999999891 STE20 SHE5/BNI1/PPF3 STE12 STE2
0.0009999999891 STE20 KIC1/NRK1 STE12 STE2
0.0009999999891 STE20 CLN2 STE12 STE2
0.0009999999891 STE20 BEM3 STE12 STE2
0.0009999999891 STE20 ROC1/TEC1 STE12 STE2
0.0009999999891 STE20 CDC42 STE12 STE2
0.0009999999891 STE20 SPT12/HTB1 STE12 STE2
0.0009999999891 STE20 CTN5/RAS2/GLC5 STE12 STE2
0.0009999999891 STE20 MYO3 STE12 STE2
0.0009999999891 STE20 PEA2/DFG9/PPF2 STE12 STE2
0.0009999999891 STE20 CLN1 STE12 STE2
0.0009999999891 STE20 PMI/PMI40 STE12 STE2
0.0009999999891 STE20 DAC2/FUS3 STE12 STE2
0.0009999999891 STE20 WHI3 STE12 STE2
0.0009999999891 STE20 SPA2/PEA1/FUS6 STE12 STE2
0.0009999999891 STE20 STE5/NUL3 STE12 STE2
0.0009999999891 STE20 STE18 STE12 STE2
0.0009999999891 STE20 FUN10/DAF1 STE12 STE2
0.0009999999891 STE20 BYC2/SLT2/MPK1 STE12 STE2
0.0009999999891 STE20 STE6 STE12 STE2
Despite an overall good performance in the case of pheromone pathway,
tests against other gold standards reveals shortcomings of the algorithm. For
example, the ergosterol biosynthesis pathway involves 3 genes (ERG3 ERG5
ERG4). Under the ERG3 knockout event, the most significantly change in
expression is observed in YBR287W, an uncharacterized gene. The predicted

9
pathway from ERG3 to YBR287W appears to be unrelated to ergosterol
biosynthesis, ERG5, or ERG4. An inspection of the expression change of ERG5
and ERG4 reveals that the two genes show minimal change in expression, and
thus could not have been selected as a target gene. This provides a counter
example to our assumption that the target gene can be determined solely from
expression change. When we try to predict the pathway from ERG3 to ERG4,
the resulting pathway is a direct path from ERG3 to ERG4. A closer look
reveals that ERG5 could not possibly be predicted in the pathway because it has
been excluded from the network in the preprocessing step. This implies that our
preprocessing restrictions may have been too strict. However, loosening
requirements also resulted in the inclusion of unwanted edges.
In robust biological systems, a perturbation of one gene does not imply a
dramatic change in expression of downstream genes necessarily. In these
systems, our assumption that stronger correlation implies higher probability of
regulation may not hold. The case of arginine biosynthesis pathway involving
six genes illustrates this point. Among the five downstream genes, only ARG8
and ARG3 exhibit significance change in expression. The other three genes with
insignificance expression change cannot be distinguish from other unrelated
genes and are drowned in experimental noise as a result.
3.3. Comparison with the Greedy Random Walk
To define a baseline for the performance of the Electric Circuit algorithm, we
compare the results with the greedy random walk algorithm. One major
difference between the two algorithms is that greedy random walk, because of
its stochastic nature, does not guarantee a solution. Therefore, in cases where a
long pathway is needed to connect the starting gene and the target, greedy
random walk may not output any result or the result may be inconclusive (i.e. all
paths are found only once). In this sense, the electric circuit algorithm is
advantageous since it guarantees a predicted pathway.
Quantitatively, the greedy random walk performs worse than Electrical
Circuit algorithm. Specifically, we compare specificity and sensitivity in
predicting the pheromone pathway. For the pathway between STE20 and STE2,
the greedy random walk achieves an average 99% specificity and 16%
sensitivity while the Electrical Circuit achieves 99% specificity and up to 69%
sensitivity. In fact, the greedy random walk algorithm cannot achieve higher
than 21% sensitivity. This is because only a small percentage of all iterations of
the greedy random walk actually lead to a complete path from start to end due to
the enforcement of the acyclic walk requirement.

10
3.4. Common Go Terms
Some pathway predictions appear unexpected and drastically differ from the
gold standard pathway. For example, in the NAD salvage pathway, the predicted
six gene pathway from SIR2 to NMA1 shares no common genes with the known
pathway. However, because our prediction is based on the evident changes in
expression, our results may signify some mechanistic response to the knockout
event separate of the known pathway. To check if the predicted pathway is
indeed functional, we performed a GO enrichment test using DAVID16
. In the
case of the NAD salvage pathway, the predicted SIR2-NMA1 pathway seems to
be involved in an amino acid metabolic process based on the enrichment test.
Though seemingly unlikely, SIR2 is indeed known to function as a silencing
protein in NAD-dependent protein deacetylases17
. This can explain the change in
expression of amino acid metabolic pathway genes in response to the SIR2
knockout event, and with further experimental investigation our predicted
pathway may prove to be correct.
4. Discussion
Inspired by the work by Suthram et al.6, we developed a stochastic approach to
predict the regulatory pathway underlying a response to perturbation such as a
knockout event. Our methods rely on a network composed of high confidence
protein-protein interactions and known TF-DNA relationships. The advantage of
this is that the generated pathways are built on high confidence relationships
between genes. While the completeness and accuracy of both the TF-DNA and
PPI datasets have drastically improved over recent years, there is still room for
improvement in both. Therefore, in our predictions important pathways may be
missed due to incompleteness of the data and causal genes may be erroneously
inferred due to flaws in the data. We also note that many pathways involve
signal transduction by protein phosphorylation, which is not represented in our
interaction network. Incorporation of protein phosphorylation data may help
improve the accuracy of our prediction.
We also note that target choice has a large effect on the quality of the
prediction, and expression data alone may not be enough to identify a target
gene. We assume that genes on the pathway downstream of the source will have
higher expression changes upon perturbation. However, the biological system is
very sophisticated and we do not expect that such a simple assumption will hold
for all cases, as seen in the cases of ergosterol biosynthesis and arginine
biosynthesis. This seems to be a shortcoming of the algorithm, and much deeper
understanding of the biological regulatory mechanism is needed for a more
realistic modeling. To improve on target choice, we may have to incorporate

11
more information such as prior knowledge about biological processes in which
the desired pathway participates. This will help guide the prediction towards the
right direction.
As seen in the example of STE20-STE2 pathway prediction, specificity can
be improved as we expand the search space by relaxing the maximum path
length restriction. Longer pathway prediction not only improves the specificity
of the prediction but also captures a more complex interaction and regulation.
However, because of the limited computational power and the NP-hard
complexity of the problem, we are limited to the current restriction.
Gene expression level changes are found common to many diseases.
Therefore, it will be very interesting to explore the extension our methods to
disease causal gene identification. Once we identify genes whose expressions
change significantly between healthy individuals and patients, our approach can
be applied to find the genes responsible for these changes. Although the
predictions are hypothetical, they give scientists a plausible direction to begin
investigation.
Acknowledgments
We would like to thank Dr. Silpa Suthram of the Stanford Butte Lab for her
encouragement, mentorship, and expertise throughout this project. We would
also like to thank Dr. Russ Altman, Dr. Betty Cheng, and Dr. Teri Klein.
Appendix
Appendix A. List of GO terms relating to regulation and parents of
terms relating to regulation.
GO ID
0006091 energy conversion and regeneration (parent of regulation of energy
conversion / regeneration) 0006110 regulation of glycolysis and gluconeogenesis
0006118 electron transport and membrane-associated energy conservation
(parent of regulation of electron transport and membrane-associated energy conservation)
0006259 DNA processing (parent of regulation of DNA processing)
0006355 transcriptional control 0006445 translational control
0007067 mitotic cell cycle and cell cycle control
0019222 regulation of metabolic process 0030154 cell differentiation
0043457 regulation of cellular respiration
0043484 regulation of RNA splicing
0045165 cell fate commitment
12
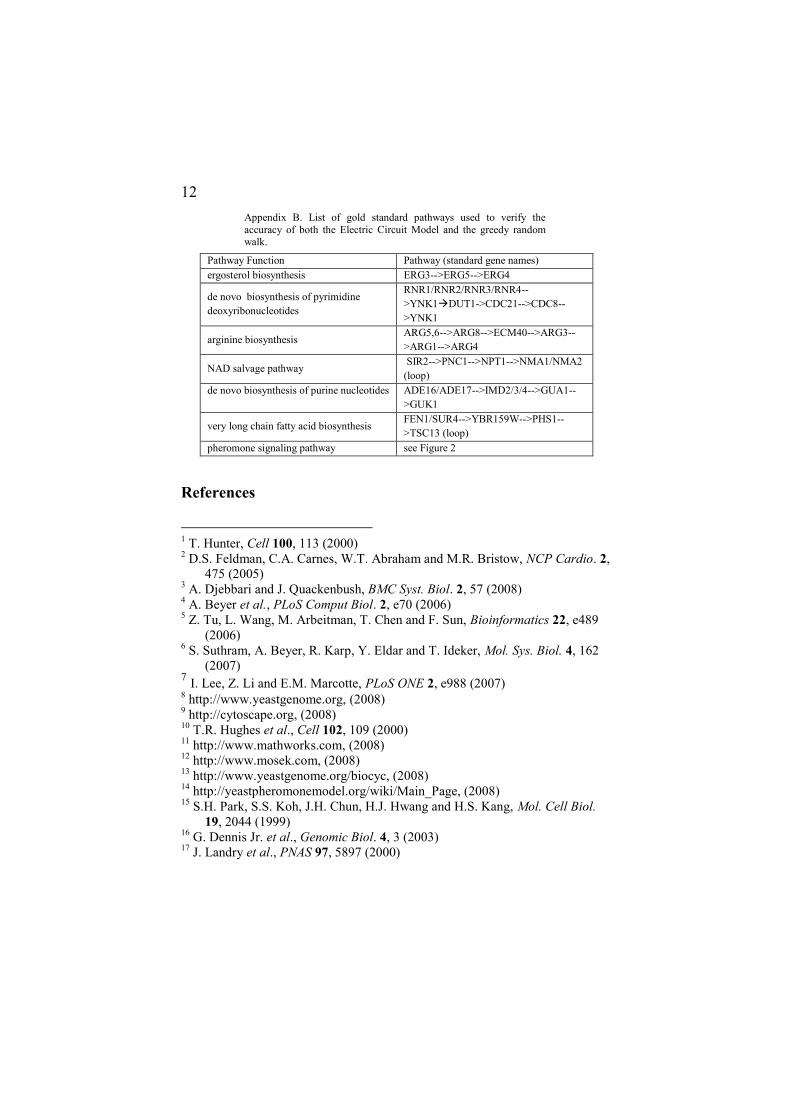
Appendix B. List of gold standard pathways used to verify the
accuracy of both the Electric Circuit Model and the greedy random walk.
Pathway Function Pathway (standard gene names)
ergosterol biosynthesis ERG3-->ERG5-->ERG4
de novo biosynthesis of pyrimidine
deoxyribonucleotides
RNR1/RNR2/RNR3/RNR4--
>YNK1DUT1->CDC21-->CDC8--
>YNK1
arginine biosynthesis ARG5,6-->ARG8-->ECM40-->ARG3--
>ARG1-->ARG4
NAD salvage pathway SIR2-->PNC1-->NPT1-->NMA1/NMA2
(loop)
de novo biosynthesis of purine nucleotides
ADE16/ADE17-->IMD2/3/4-->GUA1--
>GUK1
very long chain fatty acid biosynthesis FEN1/SUR4-->YBR159W-->PHS1--
>TSC13 (loop)
pheromone signaling pathway see Figure 2
References
1 T. Hunter, Cell 100, 113 (2000)
2 D.S. Feldman, C.A. Carnes, W.T. Abraham and M.R. Bristow, NCP Cardio. 2,
475 (2005) 3 A. Djebbari and J. Quackenbush, BMC Syst. Biol. 2, 57 (2008)
4 A. Beyer et al., PLoS Comput Biol. 2, e70 (2006)
5 Z. Tu, L. Wang, M. Arbeitman, T. Chen and F. Sun, Bioinformatics 22, e489
(2006) 6 S. Suthram, A. Beyer, R. Karp, Y. Eldar and T. Ideker, Mol. Sys. Biol. 4, 162
(2007) 7 I. Lee, Z. Li and E.M. Marcotte, PLoS ONE 2, e988 (2007)
8 http://www.yeastgenome.org, (2008)
9 http://cytoscape.org, (2008)
10 T.R. Hughes et al., Cell 102, 109 (2000)
11 http://www.mathworks.com, (2008)
12 http://www.mosek.com, (2008)
13 http://www.yeastgenome.org/biocyc, (2008)
14 http://yeastpheromonemodel.org/wiki/Main_Page, (2008)
15 S.H. Park, S.S. Koh, J.H. Chun, H.J. Hwang and H.S. Kang, Mol. Cell Biol.
19, 2044 (1999) 16
G. Dennis Jr. et al., Genomic Biol. 4, 3 (2003) 17
J. Landry et al., PNAS 97, 5897 (2000)