Inference for Categorical Data Chi-SquareCh.11. Facts about Chi-Square ► Takes only positive...
24
Inference for Inference for Categorical Data Categorical Data Chi-Square Chi-Square Ch.11 Ch.11
-
Upload
madlyn-mcdonald -
Category
Documents
-
view
218 -
download
0
Transcript of Inference for Categorical Data Chi-SquareCh.11. Facts about Chi-Square ► Takes only positive...

Inference for Inference for Categorical DataCategorical Data
Chi-SquareChi-Square
Ch.11Ch.11

Facts about Chi-Square Facts about Chi-Square
►Takes only positive values and the Takes only positive values and the graph is skewed to the rightgraph is skewed to the right
►Test Statistic ( on AP sheet)Test Statistic ( on AP sheet)►Conditions: Expected cells are at least Conditions: Expected cells are at least
5 and observations are based on a 5 and observations are based on a random sample.random sample.

3 types3 types
►Goodness of Fit TestGoodness of Fit Test►Test of IndependenceTest of Independence►HomogeneityHomogeneity

Goodness of Fit TestGoodness of Fit Test
►Is used to determine how Is used to determine how well a set of observed well a set of observed values matches a set of values matches a set of expected values.expected values.

Goodness of Fit TestGoodness of Fit Test
►1 Categorical Variable1 Categorical Variable►1 Population1 Population►df=n-1 (n is the number of categories)df=n-1 (n is the number of categories)►Expected counts is equal to proportion Expected counts is equal to proportion
of sample sizeof sample size►Large Test statistic means more Large Test statistic means more
evidence against the null hypothesisevidence against the null hypothesis

Chi-SquareChi-SquareGoodness of Fit Test (Example from Goodness of Fit Test (Example from
5 Book pg 279)5 Book pg 279)► The following are the approximate percentages for the The following are the approximate percentages for the
different blood types: different blood types: A: 40 %A: 40 %B:11%B:11%AB: 4%AB: 4%O: 45%O: 45%A random sample of 1000 black Americans yielded the A random sample of 1000 black Americans yielded the
following blood type data: following blood type data: A- 270, B-200, AB- 40 and O- 490. A- 270, B-200, AB- 40 and O- 490. Does this sample provide evidence that the distribution of Does this sample provide evidence that the distribution of
blood types among black Americans differs from that of blood types among black Americans differs from that of white Americans or could the sample values simply be white Americans or could the sample values simply be due to sampling variation?due to sampling variation?
One categorical variable- blood typeOne categorical variable- blood typeOne population- black Americans One population- black Americans

Example ContinueExample Continue
► We need to compare We need to compare the observed values the observed values in the sample with in the sample with the expected values the expected values we would get if the we would get if the sample of black sample of black Americans really had Americans really had the same distribution the same distribution of blood types as of blood types as white Americans. white Americans.
Blood Blood TypeType
ObservObserved ed ValuesValues
Expected Expected ValuesValues
AA 270270 .40(1000).40(1000)=400=400
BB 200200 110110
ABAB 4040 4040
OO 490490 450450

Another exampleAnother example(yellow workbook pg 145)(yellow workbook pg 145)
►A Philadelphia newspaper report claims A Philadelphia newspaper report claims that 24.1 % of 18-to 24-year-olds who that 24.1 % of 18-to 24-year-olds who attend a local college are from Delaware, attend a local college are from Delaware, 15.4% are from New Jersey, 50.7% are 15.4% are from New Jersey, 50.7% are from Pennsylvania, and the remaining from Pennsylvania, and the remaining 9.8% are from other states in the region. 9.8% are from other states in the region. Suppose that a random sample (size 150) Suppose that a random sample (size 150) of 18-to-24 year olds is taken at the of 18-to-24 year olds is taken at the college and the number from each college and the number from each state/region is recorded.state/region is recorded.

ContinueContinue
►Suppose that a random sample (size Suppose that a random sample (size 150) of 18-to-24 year olds is taken at 150) of 18-to-24 year olds is taken at the college and the number from each the college and the number from each state/region is recorded. The following state/region is recorded. The following is our observed valuesis our observed values
State Number of Students
Delaware 30
New Jersey 39
Pennsylvania 71
Other 10

ContinueContinue
►Do these data provide evidence at the Do these data provide evidence at the αα=.05 level that the newspaper report =.05 level that the newspaper report is correct?is correct?
►(Answer in workbook pg 146-147)(Answer in workbook pg 146-147)

Test of IndependenceTest of Independence
►1 Population1 Population►2 Categorical Variables2 Categorical Variables►df=( r-1)(c-1) Use matrixdf=( r-1)(c-1) Use matrix►Null hypothesis: Two variables are Null hypothesis: Two variables are
independent in the population (not independent in the population (not related)related)
►Alternate hypothesis: They are not Alternate hypothesis: They are not independent in the population ( are independent in the population ( are related)related)

Example of Test of Example of Test of IndependenceIndependence
(5 Book pg 284)(5 Book pg 284)►A random sample of 400 residents of A random sample of 400 residents of
large western city are polled to large western city are polled to determine their attitudes concerning the determine their attitudes concerning the affirmative action admissions policy of affirmative action admissions policy of the local university. The residents are the local university. The residents are classified according to ethnicity ( white, classified according to ethnicity ( white, black, Asian) and whether or not they black, Asian) and whether or not they favor the affirmative action policy. The favor the affirmative action policy. The results are presented in the following results are presented in the following table.table.
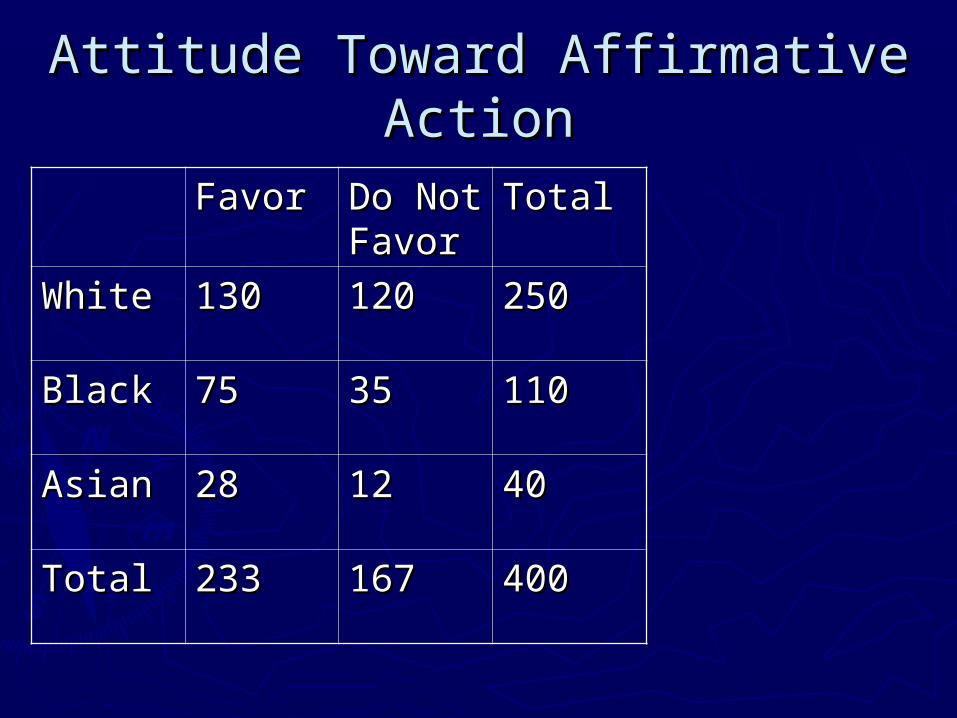
Attitude Toward Affirmative Attitude Toward Affirmative ActionAction
FavorFavor Do Not Do Not FavorFavor
TotalTotal
WhiteWhite 130130 120120 250250
BlackBlack 7575 3535 110110
AsianAsian 2828 1212 4040
TotalTotal 233233 167167 400400

Attitude towards Affirmative Attitude towards Affirmative ActionAction
►We are interested in whether or not, in We are interested in whether or not, in this population of 400 citizens, this population of 400 citizens, ethnicity and attitude towards ethnicity and attitude towards affirmative action are related ( we affirmative action are related ( we have 1 population and two categorical have 1 population and two categorical variables)variables)

Another Example Test of Another Example Test of Indep.Indep.
(yellow workbook pg 150)(yellow workbook pg 150)►A Survey was taken to determine if A Survey was taken to determine if
there is a relationship between there is a relationship between students having computers in their students having computers in their homes and in their school divisions homes and in their school divisions (elementary, middle, secondary). A (elementary, middle, secondary). A random sample of size 250 produced random sample of size 250 produced the following results:the following results:

Continue-Continue-Computer in HomeComputer in Home
Division Yes No
Elementary 14 61
Middle 50 25
Secondary 86 14

► Is there evidence that school division Is there evidence that school division and having a home computer are and having a home computer are independent?independent?
►Use a .05 level of significance.Use a .05 level of significance.

Test of Homogeneity of Test of Homogeneity of Proportion or PopulationsProportion or Populations
►1 Categorical Variable and 2 or more 1 Categorical Variable and 2 or more populationspopulations
►Degrees of freedom: (r-1)(c-1) same Degrees of freedom: (r-1)(c-1) same as independent test.as independent test.
►Null Hypothesis: p1=p2….Null Hypothesis: p1=p2….►Alternate Hypothesis: p1 does not Alternate Hypothesis: p1 does not
equal p2…equal p2…

Example of HomogeneityExample of Homogeneity(5 Book pg 288)(5 Book pg 288)
►We have a random sample of 20 males We have a random sample of 20 males from the population of males in the from the population of males in the school and another independent, school and another independent, random sample of 16 females from the random sample of 16 females from the population of females in the school. population of females in the school. Within each sample we classify the Within each sample we classify the students as Democrat, Republican, students as Democrat, Republican, and Independent. The results are and Independent. The results are presented in the following table.presented in the following table.

ContinueContinueDemocrDemocratat
RepublicRepublicanan
IndepeIndependentndent
TotalTotal
MaleMale 1111 77 22 2020
FemaleFemale 77 88 11 1616
TotalTotal 1818 1515 33 3636

ContinueContinue
►We are asking if the proportions of We are asking if the proportions of Democrats, Republicans, and Democrats, Republicans, and Independents are the same within the Independents are the same within the populations of Males and Females.populations of Males and Females.

Another example: Test of Another example: Test of Homogeneity (yellow wb pg Homogeneity (yellow wb pg
148)148)►The table shows the number of Central The table shows the number of Central
High School students who passed the High School students who passed the AP Calculus AB exam. Has the AP Calculus AB exam. Has the distribution of scores changed over the distribution of scores changed over the past 3 years? Give appropriate past 3 years? Give appropriate statistical evidence to support your statistical evidence to support your answer.answer.

Score Year 1 Year 2 Year 3
5 18 15 11
4 13 12 11
3 12 14 13

►Has there been a change in the Has there been a change in the distribution of passing grades on the distribution of passing grades on the AB Calculus exam over these three AB Calculus exam over these three years? years?