Infectious Disease in Africa: lessons learned and their application Michael Welsh, Ph.D.
42
Infectious Disease in Africa: Infectious Disease in Africa: lessons learned and their lessons learned and their application application Michael Welsh, Ph.D.
-
Upload
elijah-french -
Category
Documents
-
view
214 -
download
0
Transcript of Infectious Disease in Africa: lessons learned and their application Michael Welsh, Ph.D.

Infectious Disease in Africa:Infectious Disease in Africa:lessons learned and their application lessons learned and their application
Michael Welsh, Ph.D.

TopicsTopics
Population structure and public health challenges
Infectious disease
HIV Epidemiology
Lessons learned in HIV prevention

Population of Sub-Saharan Africa Population of Sub-Saharan Africa by Age and Sex: 2000 to 2005by Age and Sex: 2000 to 2005
Source: U.S. Bureau of Census.
MaleMale FemaleFemale
Age group < 15 represents 44%
of the total population

Fertility Decline in Selected World Fertility Decline in Selected World Regions, Early 1960s to 2005Regions, Early 1960s to 2005
6.7
5.8
6.7
6.0
2.7
2.5
2.5
1.6
5.4
3.0
2.74.6
0 1 2 3 4 5 6 7 8
Latin America
Asia
Sub-Saharan Africa
Developingcountries
Developedcountries
WorldEarly 1960s
2005
Children per woman*
* The average total number of children a woman will have given current birth rates.Source: US Bureau of the Census, International Data Base, September 23, 2002.

Use and Total Unmet Need* Use and Total Unmet Need* Women 15-49Women 15-49
0
10
20
30
40
50
60
Use Total Unmet Need
Source: Demographic and Health Surveys.
*All women 15-49, modern methods. **Currently married women 15-49, modern methods.

177.7166
155
142 142
125.2117
106 10498
52
185.9
102
6859
105102.3 99 95 91
66 64.467
59
0
20
40
60
80
100
120
140
160
180
200
Mal
i 19
96
Ethio
pia 2
000*
Mal
awi 2
000*
Burki
na Fas
o 199
9
Guinea
199
9
Togo 1
998
Uganda
2000
/01
Camer
oon 1
998
Ghana
1998
Niger
ia 1
999
Kenya
199
8
Seneg
al 1
997
Dea
ths
per
1,0
00 i
nfa
nts
un
der
ag
e o
ne
Less than two years At least 2 years
Infant Mortality by Birth Interval
On average, infants born after short birth intervals are twice as likely to die as those born after intervals of two or more years.
Source: Country DHS Reports.* Figures here are only for a 2 year birth interval instead of a 2-3 year interval.

Traditional Epidemiological Framework
Agent
Host
Env
iron
men
t
Disease
Source: Center for Health and the Global Environment, Harvard Medical School

LeadingLeading causes of death causes of death in Africa, 2000in Africa, 2000
Source: The World Health Report 2001, WHO
22.6
10.1 9.16.7
5.5 4.3 3.6 3.1 2.9 2.3
0.0
5.0
10.0
15.0
20.0
25.0
HIV/AIDS Malaria Perinatalconditions
Tuberculosis
Cerebrovascular disease
Diarrhoeal disease
Lowerrespiratory infections
Measles Ischaemic Heart
disease
Maternalconditions
% ofTotal

Infectious disease deaths as proportion of Infectious disease deaths as proportion of all deaths by region, 2001all deaths by region, 2001
62
31
11 105
0
10
20
30
40
50
60
70
Africa SE Asia Western Pacific Americas Europe

QuestionQuestion
Why do you think that Africa has such a serious problem
with ID?

Factors that contribute to infectious Factors that contribute to infectious disease in Africadisease in Africa
Poverty: root cause - poor most vulnerable
Demographics: children and women vulnerable
Poor nutrition/food supply: weakens immunity
Access to water ?
Urbanization/housing
Environmental factors
Public health systems
Risk behaviors

Per capita gross national income by regionPer capita gross national income by region(US $) (US $)
0
500
1000
1500
2000
2500
3000
3500
4000
SSA South Asia LatinAmerica
East Asiaand thePacific
MiddleEast and
NorthAfrica
Source: Sachs J. et al., Ending Africa’s Poverty Trap, Brookings Institution, 2004

Health Expenditures per CapitaHealth Expenditures per Capita
$19 $31 $10$230
$18 $36
$4,271
Ghana Kenya Rwanda South Africa Uganda Zimbabwe United States

Physicians per 100,000 people: 1990-2002Physicians per 100,000 people: 1990-2002
263 6 14 5 4
19 10
276
0
50
100
150
200
250
300
Source: Human Development Report 2003New York: Oxford University Press, 2003

Measles coverage at 1 yearMeasles coverage at 1 year
0102030405060708090
100
1980 1990 1999
World
SSA
China
India
World Development Indicators, World Bank, 2002

Nutritional DeficitsNutritional Deficits
Annual population increase 2.5 %
Population doubles in approximately 20 years
FAO estimate that 50 % already go “hungry”
Per capita food production has declined since the 70s
Little to no food surplus

Access to Improved Water SourcesAccess to Improved Water Sources
87 87
60
92
72
100 100
49
31
40
80
46
77
100
0
10
20
30
40
50
60
70
80
90
100
Ghana Kenya Rwanda SouthAfrica
Uganda Zimbabwe UnitedStates
Urban
Rural
Source: USAID (2002)

AIDS MortalityAIDS Mortality
Cumulative mortality in USthru Dec 2001
Mortality in sub-Saharan Africain a single year, 2002
0
500,000
1,000,000
1,500,000
2,000,000
2,500,000
3,000,000

15-35%3-7%1-5%0-0.1%
HETEROGENEITY OF HIV IN AFRICA
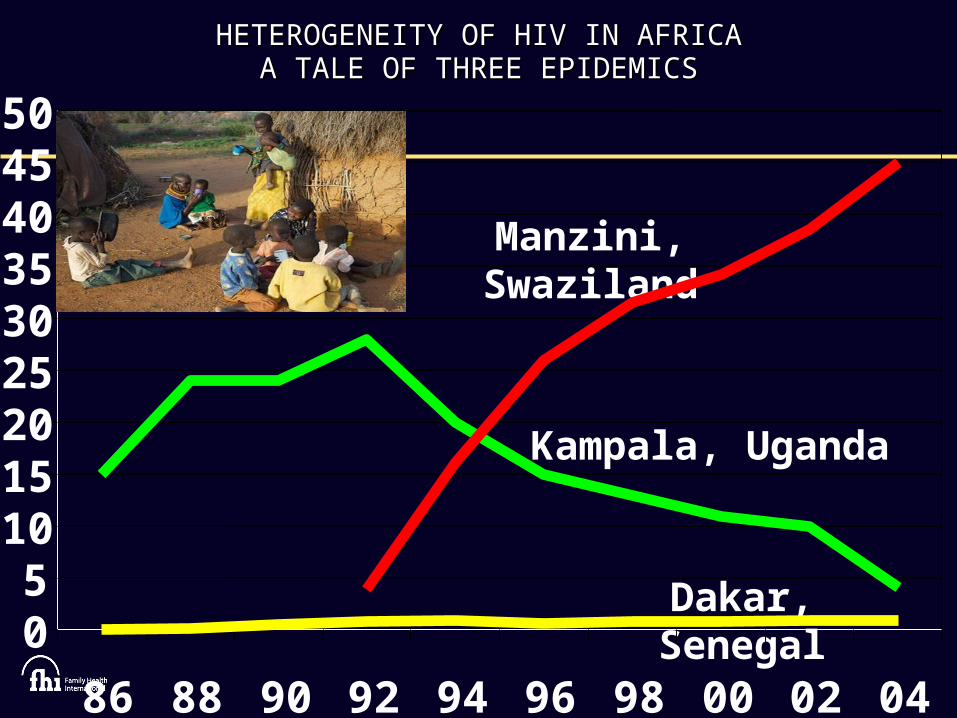
HETEROGENEITY OF HIV IN AFRICAHETEROGENEITY OF HIV IN AFRICAA TALE OF THREE EPIDEMICSA TALE OF THREE EPIDEMICS
Manzini, Swaziland
Kampala, Uganda
Dakar, Senegal05
101520253035404550
86 88 90 92 94 96 98 00 02 04

PREVENTION LESSONS FROM PREVENTION LESSONS FROM GENERALIZED EPIDEMICSGENERALIZED EPIDEMICS
StigmaConcurrent sexual partnershipsInter-generational sexSexual coercion – gender normsVulnerability of couples
Funding should track with transmissionMale circumcision

HOUSEHOLD HIV PREVALENCE IN FRANCISTOWN, HOUSEHOLD HIV PREVALENCE IN FRANCISTOWN, BOTSWANABOTSWANA
0
20
40
60
80
15-19 20-24 25-29 30-34 35-39 40-44 45-49
Male Female

PERCENTAGE WHO KNOW RELATIVE/FRIEND PERCENTAGE WHO KNOW RELATIVE/FRIEND WHO HAS DIED OF AIDSWHO HAS DIED OF AIDS
8574 71
66 61 57
3627
18 1811
0
20
40
60
80
100


SEXUAL NETWORKING IN LIKOMA,MALAWISEXUAL NETWORKING IN LIKOMA,MALAWI
Sourc
e:
Kohle
r H
and
Helle
ring
er
S. The S
truct
ure
of
Sexual N
etw
ork
s and
the S
pre
ad
of
HIV
in S
ub
-Sahara
n A
fric
a:
Evid
ence
fro
m L
ikom
a Isl
and
(M
ala
wi)
. PA
RC
Work
ing
Pap
er
Seri
es:
W
PS
06
-02
Fifth of population in mutually exclusive relationships
Two-thirds linked by single network over last three years
Networks not anchored by “high frequency transmitters”
Decentralized, complex, robust sexual chains

PROPORTION OF 15 - 19 YEAR OLDS IN SOUTH AFRICAWITH SEX PARTNERS 5 OR MORE YEARS OLDER
0
5
10
15
20
Male Female
HIV PREVALENCE AMONG 15 - 19 YEAR OLDS IN SOUTH AFRICA
WITH SEX PARTNERS 5 OR MORE YEARS OLDER
0
5
10
15
20
25
30
Sex partner 5 or more years older Sex partner less than 5 years older

SEXUAL PARTNERSHIPS IN SWAZILANDSEXUAL PARTNERSHIPS IN SWAZILAND
0%10%20%30%40%50%60%
Guards Drivers Soldiers Police SeasonalworkersSEXUAL PARTNERSHIPS IN LESOTHOSEXUAL PARTNERSHIPS IN LESOTHO
0%
20%
40%
60%
80%
Soldiers Miners Drivers
Casual sexCommercial sex

SEXUAL COERCION IN RAKAI, UGANDA
0
5
10
15
20
25
30
35
At firstsex
By 19 By 24 Allwomen
HIV INCIDENCE IN RAKAI, UGANDA
0
0.5
1
1.5
2
Coercivefirst sex
Coercivesubsequent
sex
Nevercoerced

HIV PREVALENCE AND TRANSMISSION SOURCES IN ZAMBIA, 2005HIV PREVALENCE AND TRANSMISSION SOURCES IN ZAMBIA, 2005
0
10
20
30
40
50
Adult HIV+ Sex worker HIV
Infections from sex work,clients, soldiers, truckers
Infections fromgeneral population
93%
7%
50%
14%

HIV PREVALENCE AND TRANSMISSION SOURCES IN ACCRA, HIV PREVALENCE AND TRANSMISSION SOURCES IN ACCRA, GHANA, 2005GHANA, 2005
0
20
40
60
80
Adult HIV+ Sex worker HIV Adult male infectionsfrom sex work
Adult male infectionsfrom general population
2%
78%
24%
76%

HIV PREVALENCE, TRANSMISSION SOURCES AND FUNDING IN HIV PREVALENCE, TRANSMISSION SOURCES AND FUNDING IN ACCRA, GHANAACCRA, GHANA
78%
2.2%
76%
24%
.08%
99.2%
0%
20%
40%
60%
80%
100%
Sex workers General population
HIV prevalence Transmission sources Funding

BEHAVIORAL AND HIV TRENDS IN KENYABEHAVIORAL AND HIV TRENDS IN KENYA
0
2
4
6
8
10
12
1445
3228
2523
38
28
20
107
1613 12
10
0
10
20
30
40
50
15-19 20-24 24-29 30-39 40-49
1993 1998 2003 2000 2006
13
5.9
Males reporting multiple partners
HIV prevalence

Percent reporting multiple partners
BEHAVIORAL AND HIV TRENDS IN UGANDABEHAVIORAL AND HIV TRENDS IN UGANDA
0
10
20
30
40
1989
1995
1989 35 16 15
1995 15 6 3
Men with one or more casual
partners in last year
Women with one or more casual
partners in last year
Men with three or more casual
partners in last year
0
2
4
6
8
10
12
14
16
1991 15
2003 4.1
Adult HIV prevalence
HIV prevalence

Circumcision and HIV PrevalenceCircumcision and HIV Prevalence

Impact on HIV incidence: Impact on HIV incidence: Evidence from observational studies and RCTsEvidence from observational studies and RCTs
Effect size .15 .2 .3 .4 .5 1 1.5
Study
Effect size
(95% CI)
Overall 0.42 ( 0.34, 0.52)
High-risk groups 0.29 ( 0.20, 0.42)
General Population 0.56 ( 0.44, 0.71)
South Africa 0.40 ( 0.24, 0.67)
Kenya 0.41 ( 0.24, 0.70)
Uganda 0.49 ( 0.28, 0.86)

Evidence from RCTsEvidence from RCTs
Site Population Effect
Orange Farm, SA 18 -24 60 %
Rakai, Uganda 15 – 49 48 %
Kisumu, Kenya 18 – 24 53 %

FP Complements Other Programs to Reduce FP Complements Other Programs to Reduce Infant Infections/DeathsInfant Infections/Deaths
Source: USAID, 2003.Source: USAID, 2003.
Benefits of integrating family planning and nevirapine programs – annual projection of infections and deaths averted
0
20,000
40,000
60,000
80,000
Nevirapine alone FP plus nevirapine
Child infections averted
Child deaths averted

HIV – AIDSPrevalence25.4 million
Incidence3.1 million
Mortality2.3 million
HAS HIV INCIDENCE PEAKED IN AFRICA? HAS HIV INCIDENCE PEAKED IN AFRICA?
HIV prevalence has fallen in several African countries – as the balance between HIV incidence, HIV prevalence and mortality shifts

Interventions that workInterventions that work
Male circumcision
ARVs!
Targeted interventions with BCC and condom promotion
ABCs
VCT
STI Rx and Dx
PMTCT and FP

Important New InitiativesImportant New Initiatives
PEPFAR
Gates Foundation (Buffett)
Global Fund for AIDS Malaria and TB

SummarySummary
Poor health effects women and children disproportionately
FP is a key intervention
ID extracts a huge burden on Africa and frustrates development
Generalized and concentrated HIV epidemics demand customized
responses
AIDS taking a toll; new knowledge and large investments fuels hope