
Infant and Maternal Mortality in the US - HRSA
65
Infant and Maternal Mortality in the US: Data from the National Vital Statistics System Marian MacDorman Ph.D., Donna Hoyert Ph.D., and T.J. Mathews M.S. Division of Vital Statistics National Center for Health Statistics Centers for Disease Control and Prevention
Transcript of Infant and Maternal Mortality in the US - HRSA

Infant and Maternal Mortality in the US:Data from the National Vital Statistics System
Marian MacDorman Ph.D., Donna Hoyert Ph.D., and T.J. Mathews M.S.
Division of Vital StatisticsNational Center for Health Statistics
Centers for Disease Control and Prevention

Outline• About the data• Fetal mortality (stillbirth)• Infant mortality
– Trends, selected variables, cause of death– Relationship to preterm birth– Race and ethnic differences– International comparisons
• Maternal mortality

National Vital Statistics System• Based on birth certificates, death certificates, and
reports of fetal death filed in state vital statistics offices, and transmitted to NCHS.
• National data files produced: – Birth (natality) data set– Main mortality file– Linked birth/infant death data set
• Links birth and death certificate data for all infant deaths.• Purpose: To use more detailed data from the birth certificate for
infant mortality analysis.
– Fetal death data reported by all US states • Most states report fetal deaths of 20 weeks of gestation or more.• Some variability in data completeness and quality.

National Vital Statistics System – Analytical Challenges
• Certificate revision in 2003, but not all states have adopted
• Some items not comparable between old and new versions of the certificates
• Timeliness of data file availability is highly variable– Preliminary birth and death certificate data now available
through 2009– Linked birth/infant death data through 2007– Fetal death data through 2005
• NCHS is working to catch up on data production in a limited resource climate.

Fetal Mortality

All pregnancies, US, 2005(n=6.4 million pregnancies)
65%
17%
19%
Source: Ventura SJ, Abma JC, Mosher WD. Estimated pregnancy rates for the United States, 1990-2005: An Update. National vital statistics reports vol 58 no 4. 2009.
1.2 millioninduced terminations
1.1 millionfetal deaths
4.1 million live births
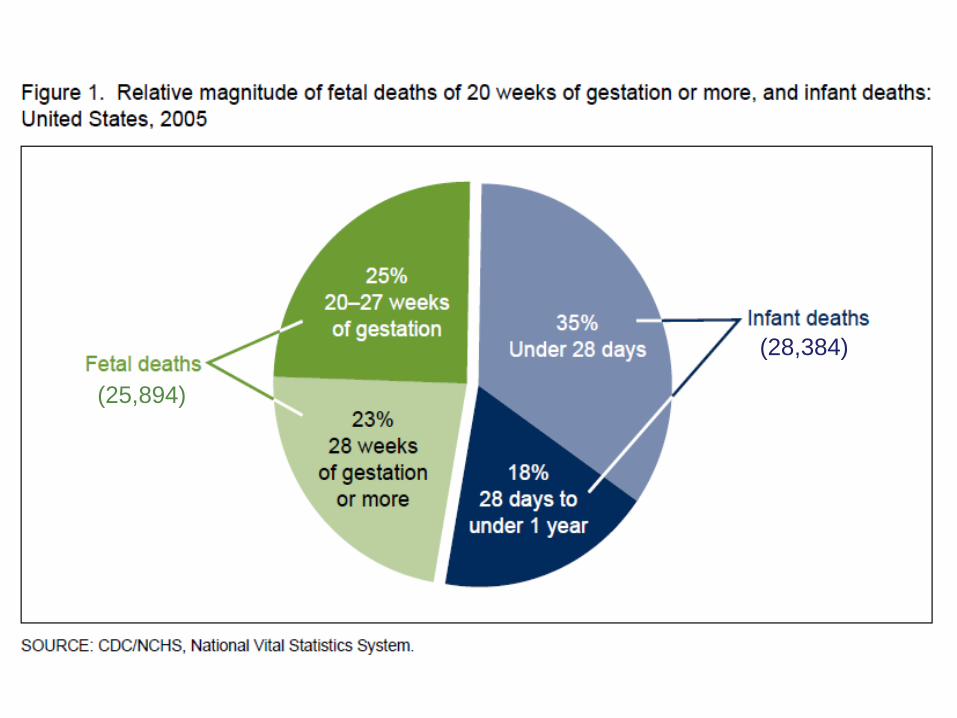
(28,384)
(25,894)
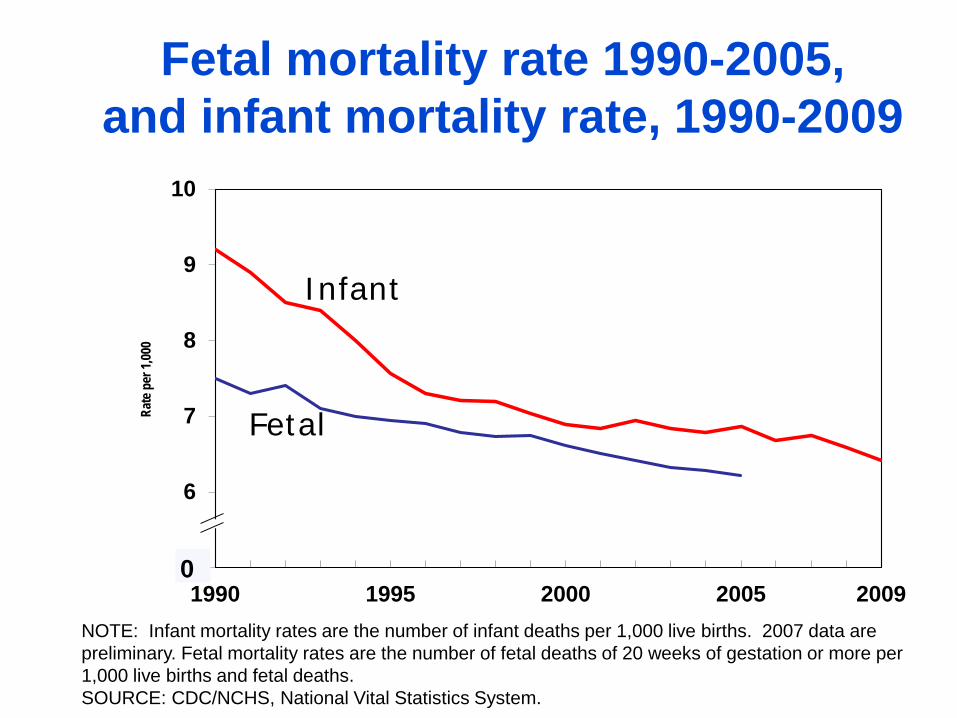
Fetal mortality rate 1990-2005, and infant mortality rate, 1990-2009
5
6
7
8
9
10
1990 1995 2000 2005 2009
Rate
per
1,00
0
0
Infant
Fetal
NOTE: Infant mortality rates are the number of infant deaths per 1,000 live births. 2007 data are preliminary. Fetal mortality rates are the number of fetal deaths of 20 weeks of gestation or more per 1,000 live births and fetal deaths. SOURCE: CDC/NCHS, National Vital Statistics System.

Fetal mortality rates by period of gestation: US, 1990-2005
2
3
4
5
1990 1995 2000 2005
Rate
per 1
,000 l
ive b
irths
and
fetal
death
s in
spec
ified
gro
up
28 weeks or more
20-27 weeks
SOURCE: MacDorman MF and Kirmeyer S. Fetal and perinatal mortality, US, 2005. National vital statisticsreports vol 57 no 8.
0
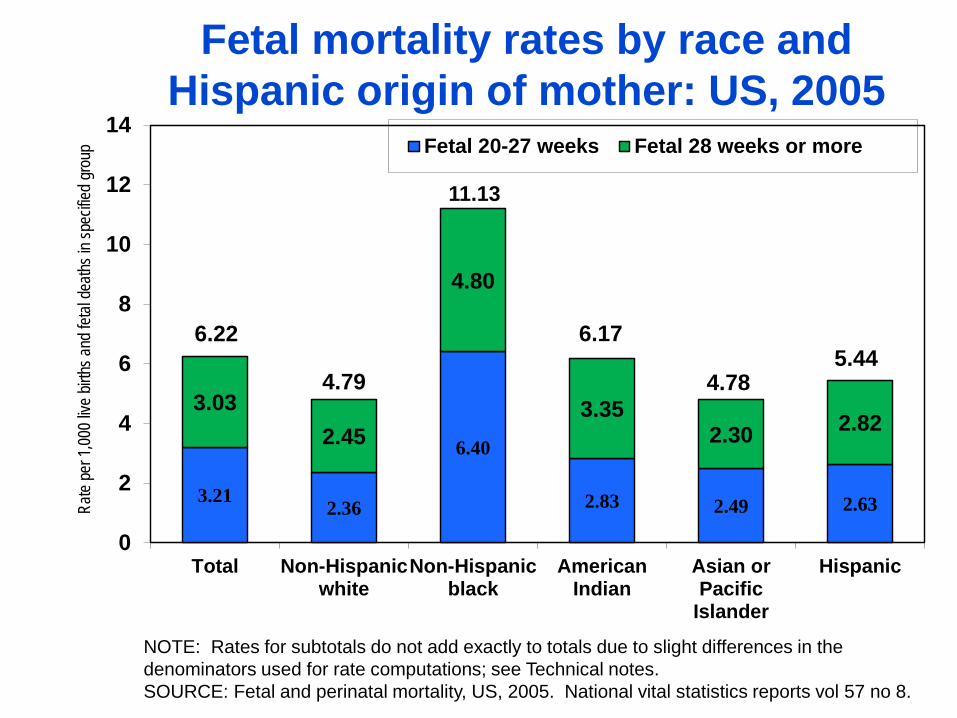
Fetal mortality rates by race and Hispanic origin of mother: US, 2005
3.21 2.36
6.40
2.83 2.49 2.63
3.032.45
4.80
3.352.30 2.82
6.22
4.79
6.17
4.785.44
0
2
4
6
8
10
12
14
Total Non-Hispanicwhite
Non-Hispanicblack
AmericanIndian
Asian orPacific
Islander
Hispanic
Rate
per 1
,000
live
births
and
fetal
death
s in s
pecif
ied g
roup Fetal 20-27 weeks Fetal 28 weeks or more
NOTE: Rates for subtotals do not add exactly to totals due to slight differences in the denominators used for rate computations; see Technical notes.SOURCE: Fetal and perinatal mortality, US, 2005. National vital statistics reports vol 57 no 8.
11.13

Prospective fetal mortality rate by single weeks of gestation: US, 2005
00.10.20.30.40.50.60.70.80.9
20 22 24 26 28 30 32 34 36 38 40 42Gestational age
Note: The prospective fetal mortality rate is the number of fetal deaths at a given gestational age per 1,000 live births and fetal deaths at that gestational age or greater.
Source: MacDorman MF, Kirmeyer S. Fetal and perinatal mortality, US, 2005. National vital statistics reports vol 57 no 8.
43

Infant Mortality:Trends and selected variables
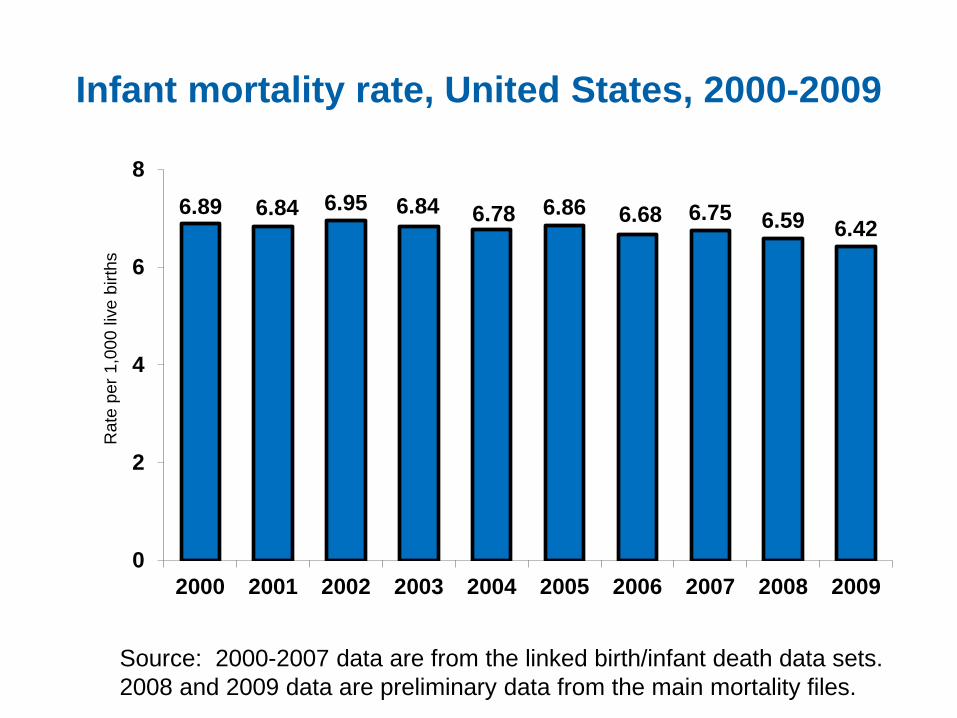
Infant mortality rate, United States, 2000-2009
6.89 6.84 6.95 6.84 6.78 6.86 6.68 6.75 6.59 6.42
0
2
4
6
8
2000 2001 2002 2003 2004 2005 2006 2007 2008 2009
Rat
e pe
r 1,0
00 li
ve b
irths
Source: 2000-2007 data are from the linked birth/infant death data sets. 2008 and 2009 data are preliminary data from the main mortality files.
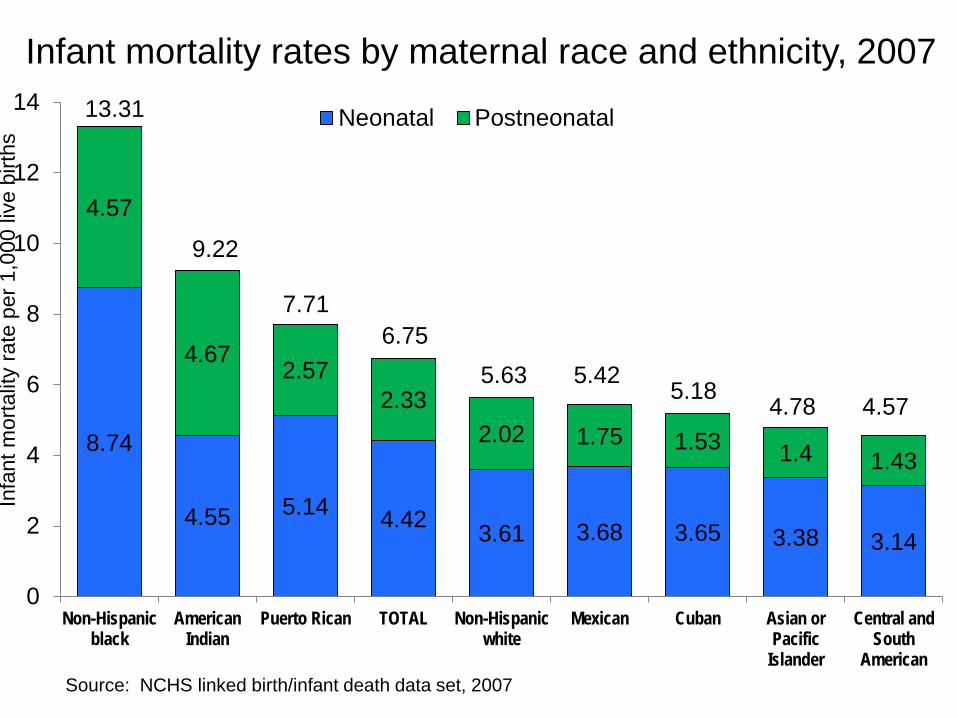
8.74
4.55 5.14 4.42 3.61 3.68 3.65 3.38 3.14
4.57
4.672.57
2.332.02 1.75 1.53 1.4 1.43
0
2
4
6
8
10
12
14
Non-Hispanicblack
AmericanIndian
Puerto Rican TOTAL Non-Hispanicwhite
Mexican Cuban Asian orPacific
Islander
Central andSouth
American
Infa
nt m
orta
lity
rate
per
1,0
00 li
ve b
irths
Neonatal Postneonatal13.31
9.22
7.716.75
5.63 5.42 4.78 4.575.18
Infant mortality rates by maternal race and ethnicity, 2007
Source: NCHS linked birth/infant death data set, 2007
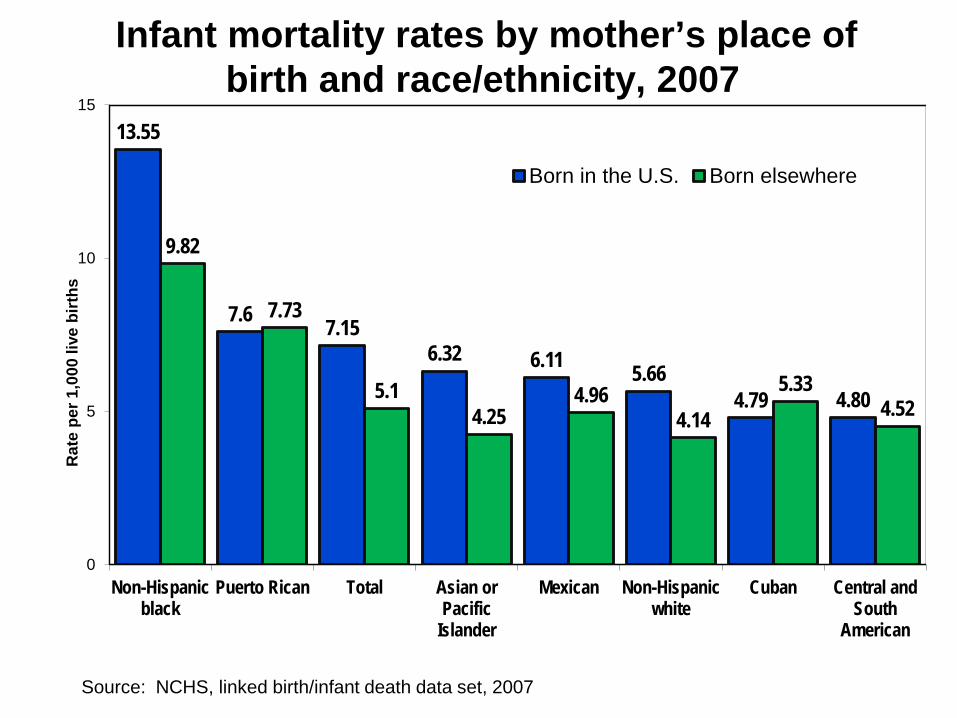
13.55
7.6 7.156.32 6.11 5.66
4.79 4.80
9.82
7.73
5.14.25
4.964.14
5.334.52
0
5
10
15
Non-Hispanicblack
Puerto Rican Total Asian orPacific
Islander
Mexican Non-Hispanicwhite
Cuban Central andSouth
American
Rat
e pe
r 1,0
00 li
ve b
irths
Born in the U.S. Born elsewhere
Infant mortality rates by mother’s place of birth and race/ethnicity, 2007
Source: NCHS, linked birth/infant death data set, 2007
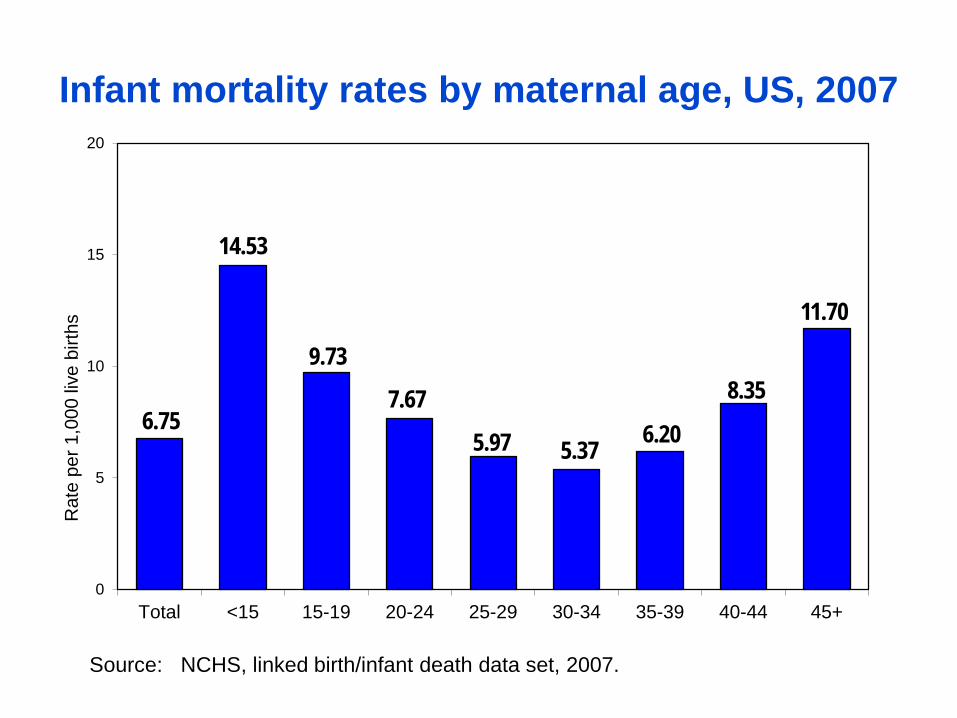
Infant mortality rates by maternal age, US, 2007
6.75
14.53
9.73
7.67
5.97 5.37 6.20
8.35
11.70
0
5
10
15
20
Total <15 15-19 20-24 25-29 30-34 35-39 40-44 45+
Rat
e pe
r 1,0
00 li
ve b
irths
Source: NCHS, linked birth/infant death data set, 2007.

Infant mortality rates by plurality, 2007
6.75 5.9328.39
64.69
140.92
296.70
0
50
100
150
200
250
300
350
Total Single Twin Triplet Quadruplet 5+
Rat
e pe
r 1,0
00 li
ve b
irths
Source: CDC/NCHS linked birth/infant death data set, 2007

Infant mortality rates by selected variables: 19 states, 2007
<HS HS Some BA/BScollege
Nonsmoker Smoker1st After 1st
Source: NCHS, linked birth/infant death data set
7.78
5.57 6.107.17
7.94
10.41
5.79
3.77
0
5
10
15
Trimester prenatal care began Maternal Smoking Maternal Education
Infa
nt d
eath
s pe
r 1,0
00 li
ve b
irths
+
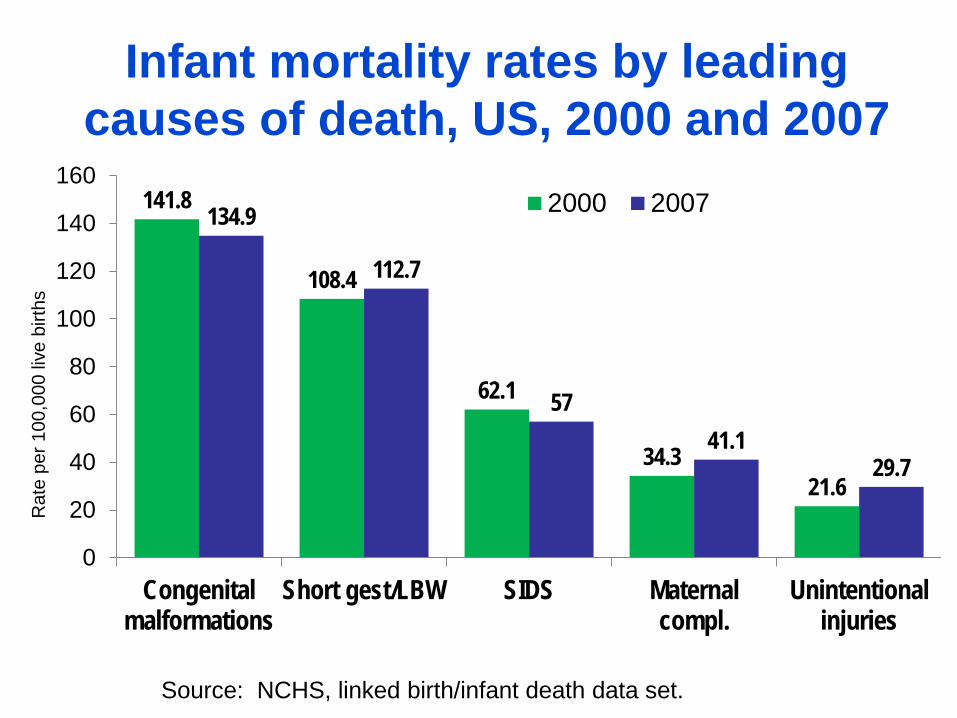
Infant mortality rates by leading causes of death, US, 2000 and 2007
141.8
108.4
62.1
34.321.6
134.9
112.7
5741.1
29.7
0
20
40
60
80
100
120
140
160
Congenitalmalformations
Short gest/LBW SIDS Maternalcompl.
Unintentionalinjuries
Rat
e pe
r 100
,000
live
birt
hs
2000 2007
Source: NCHS, linked birth/infant death data set.

Percentage of Infant Deaths from Preterm-Related Causes* by Race/Ethnicity, US, 2000 and 2007
43.739.6
34.632.3 30.5 30.8 29.4 27.7
45.0
39.436.0 34.6 35.4
31.6 32.6
24.3
0
5
10
15
20
25
30
35
40
45
50
Non-Hispanicblack
Puerto Rican TOTAL Central andSouth
American
Asian orPacific
Islander/1
Non-Hispanicwhite
Mexican AmericanIndian orAlaskanative/1
Per
cent
2000 2007
* Infants born at <37 weeks of gestation with cause of death that was a direct cause or consequence of preterm birth (ICD-10 codes K550, P000, P010, P011, P015, P020, P021, P027, P070-P073, P102, P220-P229, P250-279, P280, P281, P360-P369, P520-P523, P77).1/ Includes persons of Hispanic and non-Hispanic origin.SOURCE: NCHS, linked birth/infant death data set.

13.31
9.22
7.716.75
5.63 5.424.78 4.57
5.99
2.253.04
2.431.78 1.77 1.69 1.58
0
5
10
15
Non-Hispanic
black
AmericanIndian orAlaskanative^
Puerto Rican Total Non-Hispanic
white
Mexican Asian orPacific
Islander^
Central andSouth
American
Rat
e pe
r 1,0
00 li
ve b
irths
Total Preterm-related
Total and preterm-related* infant mortality rates by race and ethnicity of mother, US, 2007
* Preterm-related deaths are those where the infant was born preterm with the underlying cause of death assigned to one of the following ICD-10 categories: K550, P000, P010, P011, P015, P020, P021, P027, P070-P073, P102, P220-P229, P250-279, P280, P281, P360-P369, P520-P523, P77.^Includes persons of Hispanic and Non-Hispanic origin. SOURCE: NCHS linked birth/infant death data set, 2007

Infant Mortality and Preterm Birth

Infant mortality rates by gestational age ( in weeks), US, 2007
6.75
178.36
16.127.42 3.09 2.07 2.62
020406080
100120140160180200
Total <32 32-33 34-36 37-38 39-41 42+
Rat
e pe
r 1,0
00 li
ve b
irths
Source: NCHS, linked birth/infant death data set.

Percent of live births and infant deaths by weeks of gestation, US, 2007
<3254%
32-334%
34-3610%
37+32%
Infant Deaths<322% 32-33
2% 34-369%
37+87%
Births
Source: NCHS, linked birth/infant death data set

Components of preterm birth
“Indicated” preterm birth30-35%
PROM 25-30%
Spontaneous preterm labor40-45%
Source: Goldenberg et al. Lancet, 2008.
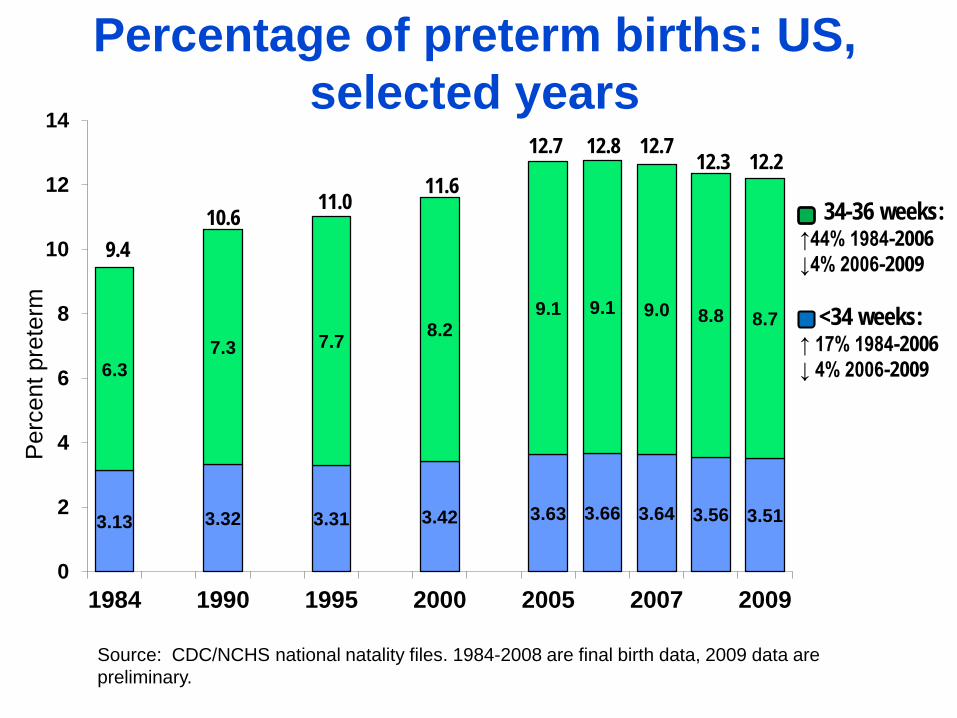
Percentage of preterm births: US, selected years
3.13 3.32 3.31 3.42 3.63 3.66 3.64 3.56 3.51
6.37.3 7.7 8.2
9.1 9.1 9.0 8.8 8.7
0
2
4
6
8
10
12
14
1984 1990 1995 2000 2005 2007 2009
Per
cent
pre
term
12.7 12.8 12.7 12.3 12.2
10.611.0
11.6
9.4
Source: CDC/NCHS national natality files. 1984-2008 are final birth data, 2009 data are preliminary.
34-36 weeks:↑44% 1984-2006↓4% 2006-2009
<34 weeks: ↑ 17% 1984-2006↓ 4% 2006-2009

Percent of preterm births by race and ethnicity, US, 1990 and 2006-2009
10.6
8.5
18.9
11.012.8
11.7
18.5
12.212.210.9
17.5
12.0
0
2
4
6
8
10
12
14
16
18
20
Total Non-Hispanicwhite
Non-Hispanicblack
Hispanic1990 2006 2007 2008 2009 1990 2006 2007 2008 2009 1990 2006 2007 2008 2009 1990 2006 2007 2008 2009
Source: CDC/NCHS national natality files. 1990-2008 data are final. 2009 data are preliminary.

Percent of singleton births delivered by cesarean by gestational age, US, selected years
2125
3128
2329
37
4742
34
05
101520253035404550
37+ weeks <37 weeks <32weeks
32-33weeks
34-36weeks
Perc
ent
1991199620012006
Source: MacDorman et al, AJPH, 2010.

Percent of singleton births with induction of labor, US, selected years
118
57 8
24
16
9
13
17
0
5
10
15
20
25
30
37+ weeks <37 weeks <32weeks
32-33weeks
34-36weeks
Perc
ent
1991199620012006
Source: MacDorman et al, AJPH, 2010.

Percent of singleton preterm (<37 weeks) births by method of delivery, US, 1991-2006
0
2
4
6
8
10
12
1991 1996 2001 2006
Perc
ent
Cesarean noinduction
Cesarean afterinduction attempt
Induced vaginal
Spontaneousvaginal
Note: Births with method of delivery and induction of labor not stated are excluded. Source: MacDorman et al, AJPH, 2010.


Infant Mortality:Race and ethnic differences

13.31
9.22
7.716.75
5.63 5.42 5.18 4.78 4.57
0
2
4
6
8
10
12
14
Non-Hispanicblack
AmericanIndian
Puerto Rican Total Non-Hispanicwhite
Mexican Cuban Asian orPacific
Islander
Central andSouth
American
Infa
nt m
orta
lity
rate
per
1,0
00 li
ve b
irths
Figure 1. Infant mortality rates by race and ethnicity of mother, US, 2007
Source: CDC/NCHS linked birth/infant death data set, 2007.

Infant mortality can be partitioned into two key components:
1. Gestational age-specific infant mortality rates (i.e. the mortality rate for infants at a given gestational age).
2. Distribution of births by gestational age.
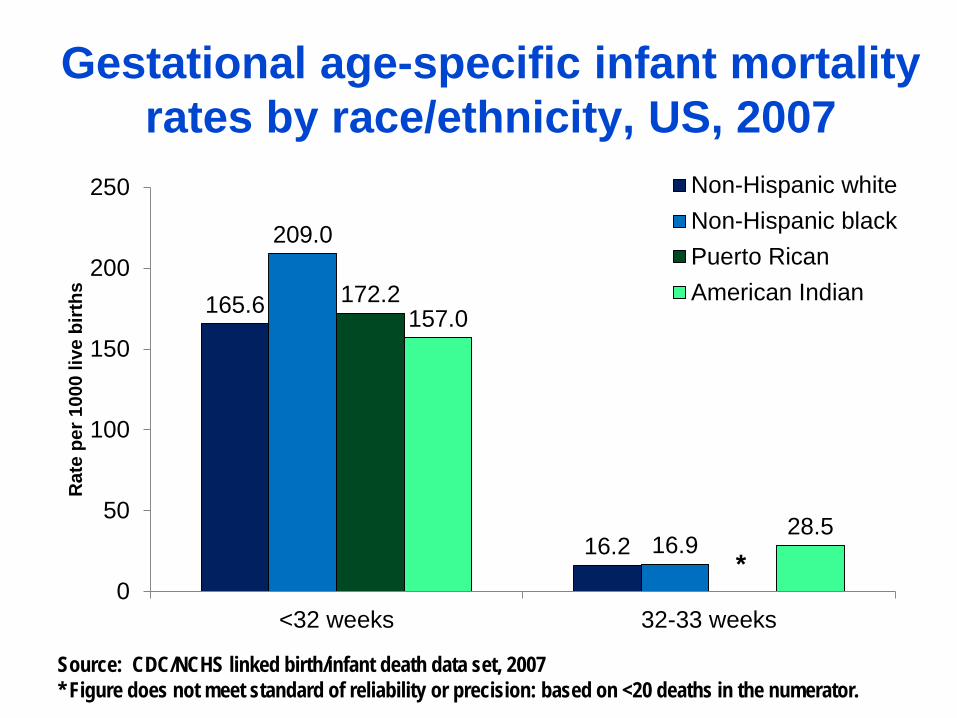
Gestational age-specific infant mortality rates by race/ethnicity, US, 2007
165.6
16.2
209.0
16.9
172.2157.0
28.5
0
50
100
150
200
250
<32 weeks 32-33 weeks
Rat
e pe
r 100
0 liv
e bi
rths
Non-Hispanic whiteNon-Hispanic blackPuerto RicanAmerican Indian
*
Source: CDC/NCHS linked birth/infant death data set, 2007* Figure does not meet standard of reliability or precision: based on <20 deaths in the numerator.

Gestational age-specific infant mortality rates by race/ethnicity, US, 2007
7.1
3.02.0
9.4
4.53.4
8.2
3.12.3
14.3
6.1
3.8
0
2
4
6
8
10
12
14
16
34-36 weeks 37-38 weeks 39-41 weeks
Rat
e pe
r 100
0 liv
e bi
rths
Non-Hispanic whiteNon-Hispanic blackPuerto RicanAmerican Indian
Source: CDC/NCHS, linked birth/infant death data set, 2007

0
2
4
6
8
10
12
14
16
18
20
Non-Hispanicwhite
Non-Hispanicblack
Puerto Rican AmericanIndian
moderately pretermvery preterm
18.3
11.5
14.5 13.9
Percent of preterm births by race and Hispanic origin of mother, United States, 2007
Note: Preterm: <37 weeks of gestation; very preterm: <32 weeks; moderately preterm: 32-36 weeksSource: CDC/NCHS linked birth/infant death data set, 2007

Percent contribution of gestational-age specific infant mortality rates and the distribution of births by gestational
age to race/ethnic differences in infant mortality rates
78
100
24
22
0
76
0%
20%
40%
60%
80%
100%
NHB/NHW infantmortality gap
PR/NHW infantmortality gap
AI/NHW infantmortality gap
Gestational age-specific infantmortality ratesDistribution ofbirths bygestational age
Note: NHW=non-Hispanic white, NHB=non-Hispanic black, PR=Puerto Rican, AI=American IndianSource: NCHS linked birth/infant death data set, 2007

Contribution of causes of death to the non-Hispanic black – non-Hispanic white infant mortality gap, 2007
599
165108
61
178124
58 300
100
200
300
400
500
600
Preterm-relatedcauses
Congenitalmalformations
SIDS Unintentionalinjuries
Infa
nt m
orta
lity r
ate p
er 10
0,000
live b
irths
Non-Hispanic black Non-Hispanic white
55% of difference
5% of difference
6% of difference 4% of
difference
Overall, 71% of the black-white infant mortality gap is due to these causes
Source: CDC/NCHS linked birth/infant death data set, 2007
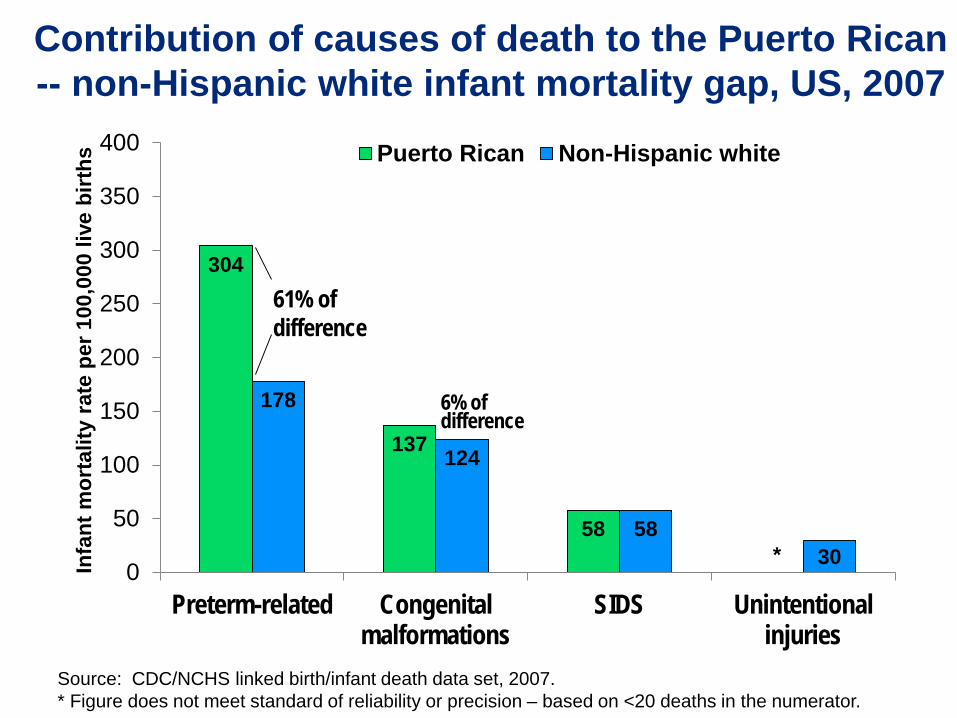
Contribution of causes of death to the Puerto Rican -- non-Hispanic white infant mortality gap, US, 2007
304
137
58*
178
124
5830
0
50
100
150
200
250
300
350
400
Preterm-related Congenitalmalformations
SIDS Unintentionalinjuries
Infa
nt m
orta
lity
rate
per
100
,000
live
birt
hs Puerto Rican Non-Hispanic white
61% of difference
6% of difference
Source: CDC/NCHS linked birth/infant death data set, 2007. * Figure does not meet standard of reliability or precision – based on <20 deaths in the numerator.
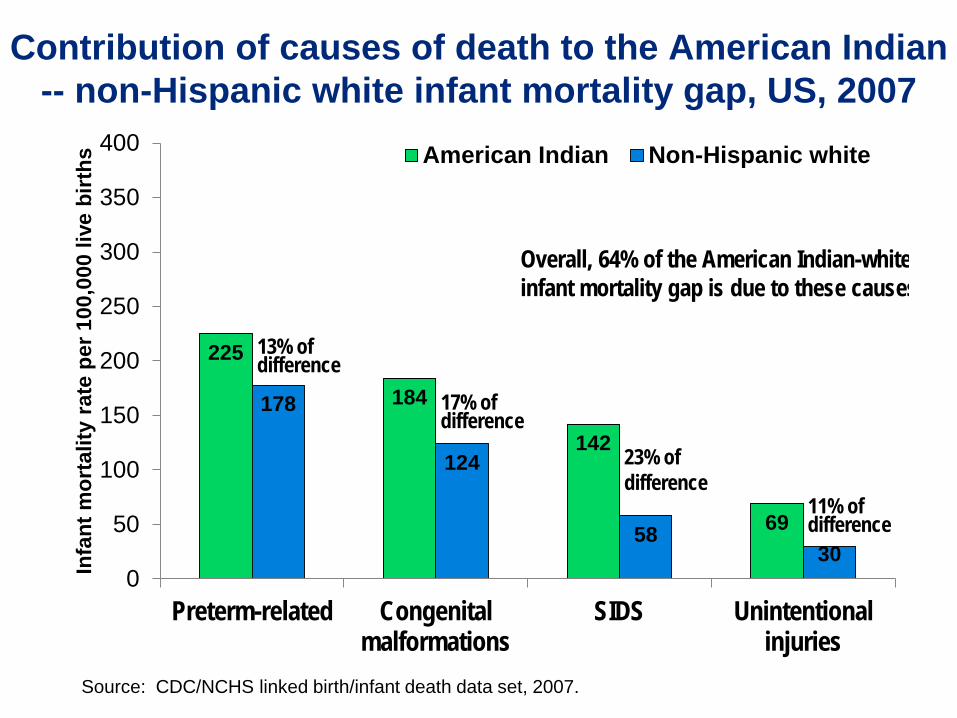
Contribution of causes of death to the American Indian -- non-Hispanic white infant mortality gap, US, 2007
225
184
142
69
178
124
5830
0
50
100
150
200
250
300
350
400
Preterm-related Congenitalmalformations
SIDS Unintentionalinjuries
Infa
nt m
orta
lity
rate
per
100
,000
live
birt
hs American Indian Non-Hispanic white
23% of difference
17% of difference
13% of difference
11% of difference
Overall, 64% of the American Indian-white infant mortality gap is due to these causes
Source: CDC/NCHS linked birth/infant death data set, 2007.

Infant Mortality:International comparisons


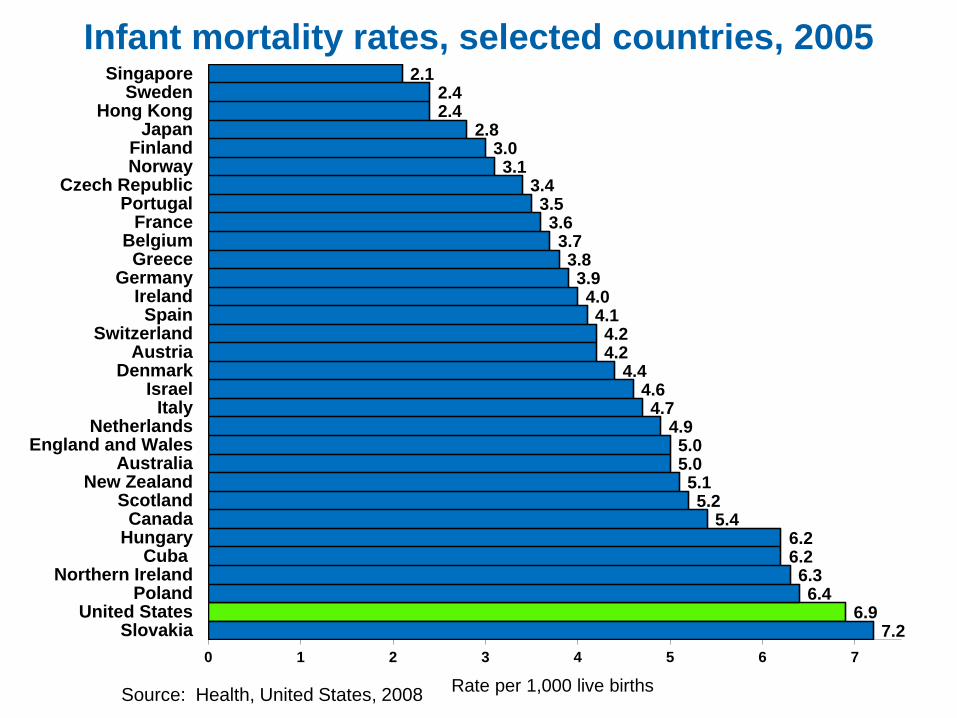
Infant mortality rates, selected countries, 2005
7.26.9
6.46.3
6.26.2
5.45.2
5.15.05.0
4.94.7
4.64.4
4.24.2
4.14.0
3.93.8
3.73.6
3.53.4
3.13.0
2.82.42.4
2.1
0 1 2 3 4 5 6 7
SlovakiaUnited States
PolandNorthern Ireland
CubaHungaryCanada
ScotlandNew Zealand
AustraliaEngland and Wales
NetherlandsItaly
IsraelDenmark
AustriaSwitzerland
SpainIreland
GermanyGreece
BelgiumFrance
PortugalCzech Republic
NorwayFinland
JapanHong Kong
SwedenSingapore
Rate per 1,000 live birthsSource: Health, United States, 2008


Infant mortality rates excluding births at <22 weeks of gestation, US and selected European countries, 2004
7.06.8
6.65.8
4.94.9
4.64.6
4.44.14.1
4.04.04.04.0
3.93.9
3.73.4
3.03.0
0.0 1.0 2.0 3.0 4.0 5.0 6.0 7.0
SlovakiaPoland
HungaryUnited States
ScotlandEngland and Wales
NetherlandsIreland
DenmarkGermany
AustriaSpain
Northern IrelandItaly
GreecePortugal
FranceCzech Republic
FinlandSwedenNorway
Rate per 1,000 live births
Source: NCHS linked birth/infant death data set (for US data), and European Perinatal Health Report (for European data).


Percentage of preterm births, United States and selected European countries, 2004
12.411.4
8.98.6
8.07.67.57.4
7.17.06.96.86.86.8
6.66.36.36.3
6.05.65.5
0 2 4 6 8 10 12 14
United StatesAustria
GermanyHungary
SpainScotland
England and WalesNetherlands
NorwayCzech Republic
DenmarkItaly
PolandPortugal
Northern IrelandFrance
SlovakiaSwedenGreeceFinlandIreland
Note: Excludes births at <22 weeks of gestation to promote comparability between countries. Preterm births are those from 22 to 36 weeks of gestation. Source: NCHS linked birth/infant death data set (for US data), and European Perinatal Health Report (for European data).
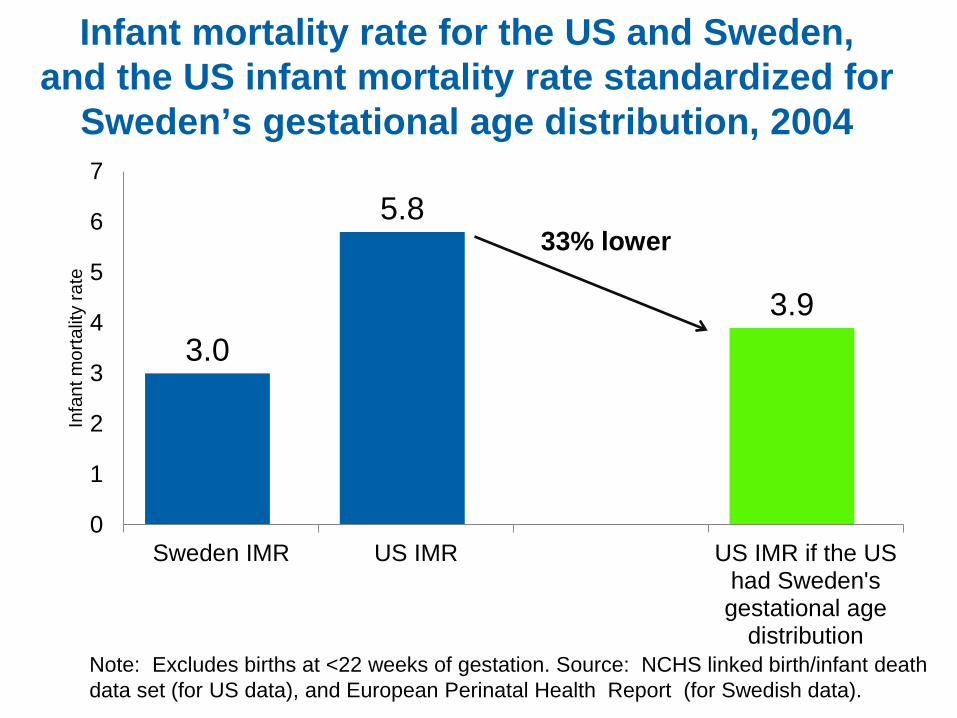
Infant mortality rate for the US and Sweden, and the US infant mortality rate standardized for
Sweden’s gestational age distribution, 2004
3.0
5.8
3.9
0
1
2
3
4
5
6
7
Sweden IMR US IMR US IMR if the UShad Sweden'sgestational age
distribution
Infa
nt m
orta
lity
rate
33% lower
Note: Excludes births at <22 weeks of gestation. Source: NCHS linked birth/infant death data set (for US data), and European Perinatal Health Report (for Swedish data).

Discussion – International Rankings• Although there are reporting differences between countries,
they are not the primary explanation for the United States’ relatively low international ranking.
• In 2005, 22 countries had infant mortality rates ≤5.0.
• One would have to assume that these countries did not report more than 1/3 of their infant deaths for their infant mortality rates to equal or exceed the US rate.
• This level of underreporting appears unlikely for most developed countries.
• The main cause of the US’ high infant mortality rate when compared to Europe is the very high percentage of preterm births in the US, the period when infant mortality is greatest.

Maternal Mortality:What’s the real story?

DefinitionsMaternal death: Death of a woman while pregnant or within 42 days of the end of pregnancy from any cause related to or aggravated by the pregnancy.
Late maternal death: Death of a woman from direct or indirect obstetric causes more than 42 days but less than one year after the end of the pregnancy.
Maternal mortality rate: Number of maternal deaths x 100,000(also known as maternal mortality ratio) Number of live births
Source: World Health Organization, International Classification of Diseases, 10th Revision.
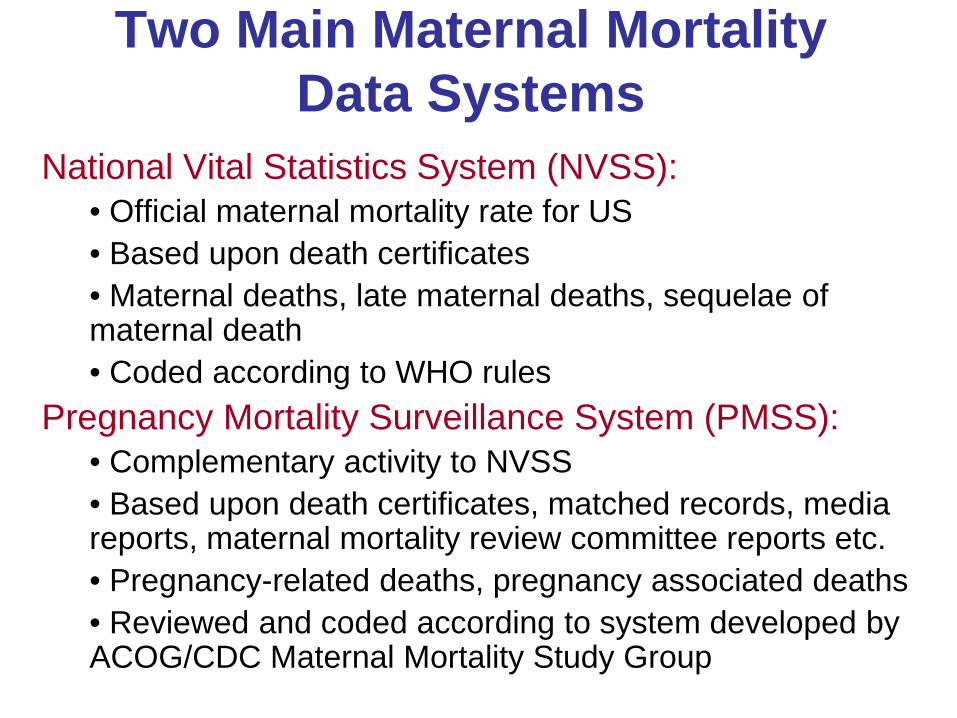
Two Main Maternal Mortality Data Systems
National Vital Statistics System (NVSS):• Official maternal mortality rate for US• Based upon death certificates• Maternal deaths, late maternal deaths, sequelae of maternal death• Coded according to WHO rules
Pregnancy Mortality Surveillance System (PMSS):• Complementary activity to NVSS• Based upon death certificates, matched records, media reports, maternal mortality review committee reports etc.• Pregnancy-related deaths, pregnancy associated deaths• Reviewed and coded according to system developed by ACOG/CDC Maternal Mortality Study Group

Maternal mortality rates from the National Vital Statistics System and the Pregnancy Mortality Surveillance System, US, 1980-2002
0
2
4
6
8
10
12
14
16
18
1980 1985 1990 1995 2000 2005
Rate
per
100
,000
live
birt
hs
PMSS
NVSS
Source: CDC/NCHS National Vital Statistics System, and CDC Pregnancy Mortality Surveillance System.

Recent change involving separate question
• Beginning with data for 2003, states have been adopting a separate question on their death certificates on whether a woman was pregnant at the time of death or within 42 days of death.
• Information from the question is used to supplement what is reported on the cause-of-death statement to improve ascertainment of maternal deaths
•The new question increases ascertainment of maternal deaths leading to higher maternal mortality rates.

Number of states with pregnancy question on the death certificate, 2003-2011
412
18 22 2431 31 35 38
05
101520253035404550
2003 2004 2005 2006 2007 2008 2009 2010 2011
Standard questionAnother questionNo question
Source: CDC/NCHS National Vital Statistics System.

Maternal mortality rates from the National Vital Statistics System and the Pregnancy Mortality Surveillance System, US, 1980-2007
0
2
4
6
8
10
12
14
16
18
1980 1985 1990 1995 2000 2005 2007
Rate
per
100
,000
live
birt
hs PMSS
NVSS
Source: CDC/NCHS National Vital Statistics System, and CDC Pregnancy Mortality Surveillance System.
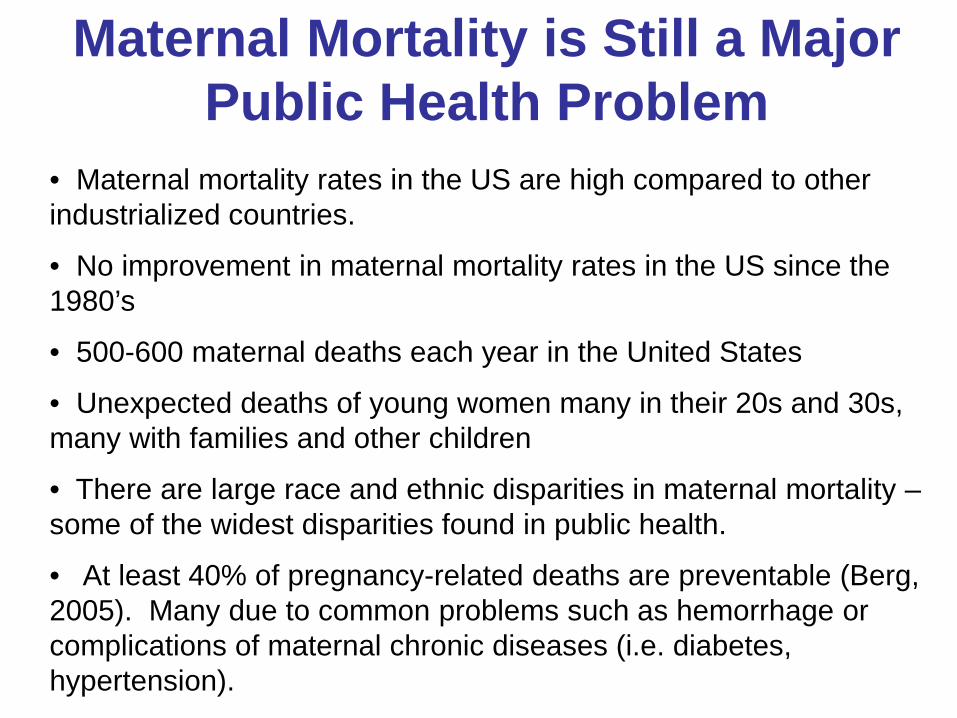
Maternal Mortality is Still a Major Public Health Problem
• Maternal mortality rates in the US are high compared to other industrialized countries.
• No improvement in maternal mortality rates in the US since the 1980’s
• 500-600 maternal deaths each year in the United States
• Unexpected deaths of young women many in their 20s and 30s, many with families and other children
• There are large race and ethnic disparities in maternal mortality –some of the widest disparities found in public health.
• At least 40% of pregnancy-related deaths are preventable (Berg, 2005). Many due to common problems such as hemorrhage or complications of maternal chronic diseases (i.e. diabetes, hypertension).

Maternal mortality rates, selected industrialized countries, 2003-2004 data
12.6
9.3
8.8
7.2
7.0
6.2
5.4
0 2 4 6 8 10 12 14
United States
Denmark
Netherlands
England and Wales
France
Canada
Germany
Source: European data from the European Perinatal Health Report; Canadian data from Statistics Canada, Canadian vital statistics, death database; US data from the National Vital Statistics System.

Maternal mortality rates by race and Hispanic origin, US, 2007
Total Hispanic Non-Hispanic white
Non-Hispanic black
0
5
10
15
20
25
30
35
Rat
e pe
r 100
,000
live
birt
hs
12.7
8.9 10.5
28.4
Source: CDC/NCHS, National Vital Statistics System, Mortality
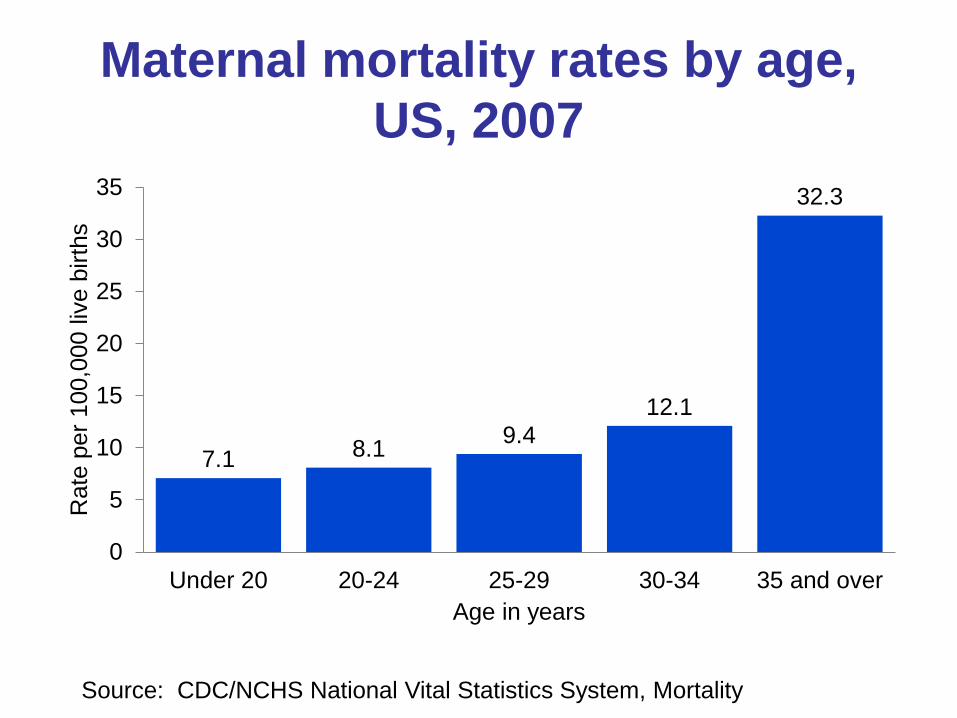
Maternal mortality rates by age, US, 2007
7.1 8.1 9.412.1
32.3
0
5
10
15
20
25
30
35
Under 20 20-24 25-29 30-34 35 and over
Rat
e pe
r 100
,000
live
birt
hs
Age in years
Source: CDC/NCHS National Vital Statistics System, Mortality

Summary• Stagnation in the rate of decline of both infant
(2000-2007) and fetal (2003-2005) mortality rates
• No detectible decline in maternal mortality rate since 1982
• Recent modest decline in preterm birth (2006-9) and infant mortality (2007-9)
• Still, preterm birth rates and infant mortality rates are much higher in the US than in most developed countries.

Summary (cont.)• Large race and ethnic disparities in fetal, infant and
maternal mortality suggest that not all race/ethnic groups have benefited equally from social and medical advances.
• Preterm birth is a primary cause of high infant mortality in the US, and contributes substantially to both race and ethnic disparities and the US’ poor international ranking.
• Interventions to address the nation’s high preterm birth rate must address prevention of both spontaneous preterm labor and iatrogenic preterm birth.

Questions?
Marian MacDorman, Ph.D.Statistician, Division of Vital StatisticsNational Center for Health Statistics(301) [email protected]
2007 linked file report available at : http://www.cdc.gov/nchs/data/nvsr/nvsr59/nvsr59_06.pdfSome copies in the back of the room.