Inerting of a Vented Aircraft Fuel Tank Test Article … · membrane technology is a promising...
29
DOT/FAA/AR-01/6 Office of Aviation Research Washington, D.C. 20591 Inerting of a Vented Aircraft Fuel Tank Test Article With Nitrogen- Enriched Air Michael Burns William M. Cavage Federal Aviation Administration FAA William J. Hughes Technical Center Airport and Aircraft Safety Research and Development Division Atlantic City International Airport, NJ 08405 April 2001 Final Report This document is available to the U.S. public Through the National Technical Information Service (NTIS), Springfield, Virginia 22161. U.S. Department of Transportation Federal Aviation Administration
Transcript of Inerting of a Vented Aircraft Fuel Tank Test Article … · membrane technology is a promising...

DOT/FAA/AR-01/6 Office of Aviation Research Washington, D.C. 20591
Inerting of a Vented Aircraft Fuel Tank Test Article With Nitrogen-Enriched Air Michael Burns William M. Cavage Federal Aviation Administration FAA William J. Hughes Technical Center Airport and Aircraft Safety Research and Development Division Atlantic City International Airport, NJ 08405 April 2001 Final Report This document is available to the U.S. public Through the National Technical Information Service (NTIS), Springfield, Virginia 22161.
U.S. Department of Transportation Federal Aviation Administration

NOTICE
This document is disseminated under the sponsorship of the U.S. Department of Transportation in the interest of information exchange. The United States Government assumes no liability for the contents or use thereof. The United States Government does not endorse products or manufacturers. Trade or manufacturer's names appear herein solely because they are considered essential to the objective of this report. This document does not constitute FAA certification policy. Consult your local FAA aircraft certification office as to its use. This report is available at the Federal Aviation Administration William J. Hughes Technical Center's Full-Text Technical Reports page: actlibrary.tc.faa.gov in Adobe Acrobat portable document format (PDF).

Technical Report Documentation Page 1. Report No. DOT/FAA/AR-01/6
2. Government Accession No. 3. Recipient's Catalog No.
4. Title and Subtitle
INERTING OF A VENTED AIRCRAFT FUEL TANK TEST ARTICLE WITH
5. Report Date April 2001
NITROGEN-ENRICHED AIR 6. Performing Organization Code AAR-422
7. Author(s) Michael Burns and William M. Cavage
8. Performing Organization Report No. DOT/FAA/AR-01/6
9. Performing Organization Name and Address Federal Aviation Administration William J. Hughes Technical Center
10. Work Unit No. (TRAIS)
Airport and Aircraft Safety Research and Development Division Fire Safety Section, AAR-422 Atlantic City International Airport, NJ 08405
11. Contract or Grant No.
12. Sponsoring Agency Name and Address U.S. Department of Transportation Federal Aviation Administration
13. Type of Report and Period Covered Final Report
Office of Aviation Research Washington, DC 20591
14. Sponsoring Agency Code
ANM-100 15. Supplementary Notes 16. Abstract This report documents a series of experiments designed to determine the quantity and purity of nitrogen-enriched air (NEA) required to inert a vented aircraft fuel tank. NEA, generated by a hollow fiber membrane gas separation system, was used to inert a laboratory fuel tank with a single vent on top designed to simulate a transport category airplane fuel tank. The tank ullage space could be heated as well as cooled and fuel could be heated in the bottom of the fuel tank to provide varying hydrocarbon concentrations within the ullage space. Several inerting runs were performed with varying NEA gas purities and flow rates. The data was nondimensionalized in terms of NEA purity, volume flow rate, and fuel tank size to provide one universal inerting curve. Changing temperatures and hydrocarbon concentrations appear to have little effect on the amount and purity of NEA needed to inert the test specimen. A model of ullage washing developed by the Federal Aviation Administration Chief Scientific and Technical Advisor for fuel systems design, based on the volume exchange of gases of different concentrations, was compared with data obtained from the test article. Also, an exact solution based on uniform and instantaneous mixing was derived and compared with the test data. Both the model and exact solution showed good agreement in both trend and magnitude with the data obtained during the testing. 17. Key Words Nitrogen-enriched air, Ullage washing, Volume flow rate, Fuel tank inerting, Oxygen concentration, Total hydrocarbon
18. Distribution Statement
This Document is available to the public through the National Technical Information Service (NTIS), Springfield, Virginia 22161
19. Security Classif. (of this report) Unclassified
20. Security Classif. (of this page) Unclassified
21. No. of Pages 29
22. Price
Form DOT F 1700.7 (8-72) Reproduction of completed page authorized
iii/iv
ACKNOWLEDGEMENT The author wishes to acknowledge the contribution of Ivor Thomas of the Federal Aviation Administration (FAA) Chief Scientific and Technical Advisor for fuel system design for development of the model of ullage washing used for comparison with measured results obtained during the course of this research. This model uses basic principals to quantify the amount of oxygen in a fuel tank during ullage washing, and then calculates oxygen concentration. The author also wishes to acknowledge the contributions of Dr. Richard Lyon for helping calculate the exact solution and determining the method of transformation to the existing nondimensional scheme. Dr. Lyon is a noted researcher in the fields of material science and fire safety and is presently the program manager for the FAA research and development fire-resistant materials program.

v
TABLE OF CONTENTS Page EXECUTIVE SUMMARY ix 1. INTRODUCTION 1
1.1 Background 1
1.1.1 Ullage Washing 1 1.1.2 Hollow Fiber Membrane Gas Separation 1
1.2 Scope 2
2. EQUIPMENT AND PROCEDURES 3
2.1 Equipment 3
2.1.1 Test Specimen 3 2.1.2 Instrumentation and Data Acquisition 4 2.1.3 Nitrogen-Enriched Air Generator 5
2.2 Test Procedures 5
2.2.1 Volume Flow Rate Comparison 6 2.2.2 Nitrogen-Enriched Air Oxygen Concentration Comparison 6 2.2.3 Ullage Temperature Comparison 6 2.2.4 Hydrocarbon Concentration Comparison 6
3. THEORY AND ANALYSIS 7
3.1 Nondimensional Analysis 7
3.1.1 Time 7 3.1.2 Nitrogen-Enriched Air Oxygen Concentration 7
3.2 Theoretical Solutions 8
3.2.1 Numerical Model 8 3.2.2 Exact Solution 8
4. DISCUSSION OF RESULTS 10
4.1 Volume Flow Rate Comparison 10 4.2 Purity Comparison 11 4.3 Ullage Temperature Comparison 14

vi
4.4 Hydrocarbon Comparison 15 4.5 Model Comparison 15
5. CONCLUSIONS AND RECOMMENDATIONS 17
6. REFERENCES 18
APPENDIX A—DERIVATION OF EXACT SOLUTION FOR ULLAGE WASHING
LIST OF FIGURES Figure Page 1 Hollow Fiber Membrane Bundle Diagram 2
2 Fuel Tank Test Article Diagram Illustrating Important Instrumentation 3
3 Photo of Fuel Tank Specimen in the Aircraft Components Fire Test Facility 4
4 Illustration of Inflow/Outflow Model With Perfect Mixing 9
5 Comparison of Tank Oxygen Concentration Over Time for Different Volume Flow Rates 10
6 Comparison of Tank Oxygen Concentration With Respect to Volumetric Tank Exchange for Different Volume Flow Rates 11
7 Comparison of Tank Oxygen Concentration Over Time for Different Inerting Gas Oxygen Concentrations 12
8 Comparison of Tank Oxygen Concentration With Respect to Volumetric Tank Exchange for Different NEA Oxygen Concentrations 12
9 Comparison of Tank Inerting Ratio With Respect to Volumetric Tank Exchange for Different NEA Oxygen Concentrations 13
10 Comparison of Tank Oxygen Concentration With Respect to Volumetric Tank Exchange for Different Ullage Temperatures 14
11 Comparison of Tank Oxygen Concentration With Volumetric Tank Exchange for Different Initial Ullage Total Hydrocarbon Concentrations 15
12 Comparison of Ullage-Washing Oxygen Concentration Model Data With Two Different Ullage-Washing Runs 16

vii/viii
13 Comparison of Nondimensional Ullage-Washing Oxygen Concentration Model and Exact Solution Data With Empirical Ullage-Washing Data 17
LIST OF TABLES
Table Page
1 Summary of Comparison Test Sets 6

ix/x
EXECUTIVE SUMMARY More emphasis has been placed on fuel tank safety since the TWA flight 800 accident in July 1996. Since the accident, the Federal Aviation Administration (FAA) has conducted a considerable amount of research into methods that could eliminate or significantly reduce the exposure of transport airplanes to flammable vapors. Fuel tank inerting could be more cost-effective if some system of ground-based fuel tank inerting were employed. Hollow fiber membrane technology is a promising method of generating nitrogen-enriched air (NEA) that could help improve the cost-effectiveness of on-site and on-aircraft nitrogen-enriched air generation. The purpose of this research effort is to more accurately quantify the amount and purity of NEA required to inert a simple vented rectangular tank with a single NEA nozzle. For the testing, a rectangular fuel tank with approximately 88 cubic feet of volume was employed, which was instrumented to allow for temperature, oxygen, and hydrocarbon concentration to be measured in the ullage space. The ullage space of the tank was heated or cooled as required and small portions of heated fuel provided for elevated hydrocarbon concentrations in the tank in accordance with the test plan. The tank was inerted with NEA from an industrial hollow fiber membrane gas generator which provided for both variable NEA oxygen concentration (or purity) and flow rate. All tests were performed at the William J. Hughes Technical Center in the Aircraft Components Fire Test Facility. Each series of tests was designed to determine a specific relationship or to highlight the ability to nondimensionalize the data in terms of a certain parameter. Each test consisted of a single inerting of a test article. Shop air was used to purge the tank to ensure a consistent initial oxygen concentration (approximately 20.9 percent oxygen by volume). At the start of each test, the data acquisition system was started and the NEA was directed into the tank. The tank was considered inert after the oxygen concentration was less then 8 percent by volume; however, all inerting runs did not necessarily end with the test article ullage space at 8 percent. Results were compared to a model developed by the FAA Chief Scientific and Technical Advisor for fuel system design and an exact solution based on the assumption of uniform and instantaneous mixing. Varying NEA oxygen concentration and flow rate had the expected effect. Reduction of tank oxygen concentration was faster with increased NEA purity (decreasing oxygen concentration) and flow rate. The data was nondimensionalized in terms of NEA oxygen concentration and flow rate to get one universal inerting curve. A polynomial curve fit was developed for the curve. This empirical data agreed well with both the aforementioned model and exact solution. The model and solution had excellent agreement, with the model tending to be more conservative in terms of predicting volumes of NEA required. Ullage temperature and hydrocarbon concentration tended to have little or no effect on the ability of the NEA to inert the tank.
1
1. INTRODUCTION.
1.1 BACKGROUND.
More emphasis has been placed on fuel tank safety since the TWA flight 800 accident in July 1996. Since the accident, the Federal Aviation Administration (FAA) has conducted a considerable amount of research into methods that could eliminate or significantly reduce the exposure of transport airplanes to flammable vapors. This has included fuel tank inerting, which is commonly used by the military. However, the systems weight and resource requirements, which were based on military design requirements, as well as perceived low dispatch reliability have indicated that fuel tank inerting may not be practical for application to transport airplanes. FAA research is evaluating state-of-the-art hollow fiber membrane (HFM) gas separation technology that provides for low-cost inert gas, as it applies to civil transport design criteria to allow for cost-effective onboard inert gas generation. Ground-based fuel tank inerting would also benefit from hollow fiber membrane gas separation technology. Ground-based fuel tank inerting was identified by the Aviation Rulemaking Advisory Committee (ARAC) fuel tank harmonization working group as a potentially cost-effective solution to reducing the overall fuel tank flammability of the commercial fleet [1]. Ground-based inerting (or GBI) is accomplished by inerting the fuel tank ullage space at the gate. This would provide a significant reduction in fuel tank flammability during ground operations and the initial phases of flight where exposure of the fuel tanks to flammable vapors is usually greatest [2]. A GBI system based on HFM gas separation technology would provide cost-effective inert gas production at all required terminals. Any type of commercial transport fuel tank inerting would require displacing the ullage gas with nitrogen or nitrogen-enriched air (NEA) in a process known as ullage washing. Very little data is available giving the amount of NEA required to render a vented fuel tank inert. It is desirable to optimize the amount of NEA in terms of volume and purity to inert a fuel tank. Moreover, the effects of a convectively heated ullage space on the ability to inert a fuel tank, as well as the effect of inerting an ullage space containing a relatively high concentration of hydrocarbon vapor were examined. These two fuel tank inerting scenarios are representative of normal operation of a commercial transport airplane. 1.1.1 Ullage Washing.
Ullage washing is a process that requires displacing the air in the fuel tank empty space, also known as ullage, with nitrogen gas or NEA. NEA is a term used to describe low-purity nitrogen (90%-98% pure), generally generated via a gas separation process. Ullage washing would be accomplished by providing the nitrogen or NEA to a supply line that feeds a simple fuel tank inert gas supply manifold. 1.1.2 Hollow Fiber Membrane Gas Separation.
HFM technology provides the industrial gas industry with a cost–effective and efficient method for gas separation. Membranes separate gases by the principle of selective permeation across the membrane wall. For polymeric membranes, the rate of permeation of each gas is determined by

2
its solubility in the membrane material, and the rate of diffusion through the molecular free volume in the membrane wall. Gases that exhibit high solubility in the membrane, and gases that are small in molecular size, permeate faster than larger, less soluble gases. Since “fast” gases permeate through the membrane wall more readily than “slow” gases, the original gas mixture can be separated into two streams. In the case of air, one stream would be NEA and the other oxygen-enriched air. HFM’s are very small (on the order of a human hair) and are typically manufactured by grouping large numbers into hollow tubes to allow as much surface area as possible to be packaged into the smallest volume. A schematic of a HFM module is shown in figure 1.
FIGURE 1. HOLLOW FIBER MEMBRANE BUNDLE DIAGRAM The purity of the NEA stream can be adjusted by changing the air flow rate, the feed air temperature, or the pressure. The ability of a membrane to separate two gases is determined by its selectivity, the ratio of permeabilities of the two gases. The higher the selectivity, the more efficient the separation and less energy is needed to run the system. HFM technology can be used to separate nitrogen (slow gas) from oxygen, carbon dioxide, and water vapor (fast gases). The primary benefit of HFM gas separation, when compared to the existing methods of gas separation, is simplicity of design. Large volumes of relatively pure NEA can be generated with no moving parts beyond those required to compress the air supply for the gas separation module. The primary draw back of HFM gas separation technology is the limitation on purity in nitrogen generation. Purity is generally limited to 99.9 percent nitrogen, with nitrogen purity higher than 99 percent becoming inefficient to obtain in terms of energy cost to generate the nitrogen. It should also be noted that systems using current HFM technology are capable of producing about 45 percent oxygen in the permeate, or fast gas stream. 1.2 SCOPE.
The purpose of this research effort is to more accurately quantify the amount and purity of nitrogen required to inert a vented rectangular fuel tank with a single NEA ejection nozzle. This report details experiments performed to determine the volume of NEA needed to inert this

3
representative transport airplane fuel tank. Nondimensional analysis was used to determine the gas volume exchange needed as well as the effect of different NEA oxygen concentrations (purities). The effects of heated ullage gases and high hydrocarbon vapor concentrations in the ullage space on the inerting process were also examined. 2. EQUIPMENT AND PROCEDURES.
2.1 EQUIPMENT.
2.1.1 Test Specimen.
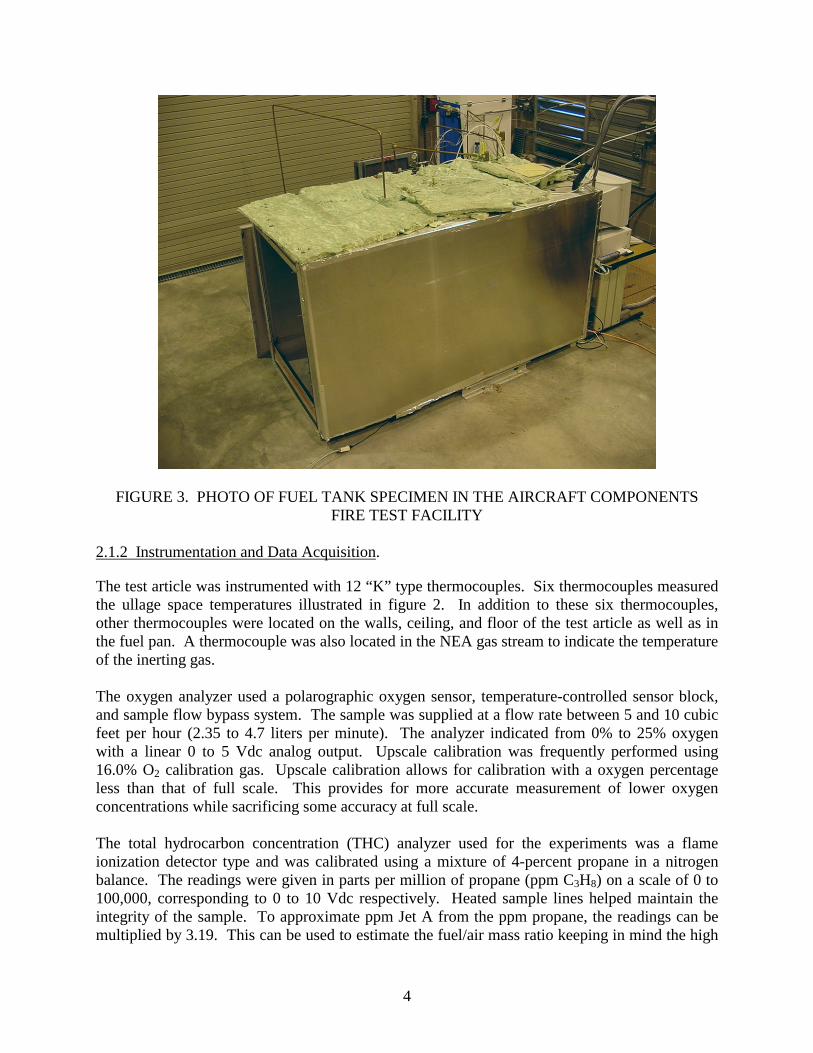
For the testing, a simple rectangular fuel tank with 88.21 cubic feet of volume was employed to simulate a fuel cell in a commercial transport airplane. The tank was inerted with a single NEA distribution nozzle and vented from a single vent. The tank ullage temperature was adjusted by either heating the bottom with a 150,000-Btu kerosene heater or by cooling the walls with a liquid CO2 supply plumbed through channels in the three sides of the tank. The tank was constructed of 1/4″ aluminum with dimensions as shown in figure 2. Fuel was placed in a pan in the bottom of the fuel tank and heated with a radiant heater exterior to the tank to allow for variation of the ullage space hydrocarbon concentration. This radiant heater is wired through a rheostat to allow for control of the fuel pan temperature. Figure 3 is a photo of the test specimen illustrating the placement of the tank in the test cell.
FIGURE 2. FUEL TANK TEST ARTICLE DIAGRAM ILLUSTRATING IMPORTANT INSTRUMENTATION
Door
87″″″″
48″ ″″″
4
FIGURE 3. PHOTO OF FUEL TANK SPECIMEN IN THE AIRCRAFT COMPONENTS FIRE TEST FACILITY
2.1.2 Instrumentation and Data Acquisition.
The test article was instrumented with 12 “K” type thermocouples. Six thermocouples measured the ullage space temperatures illustrated in figure 2. In addition to these six thermocouples, other thermocouples were located on the walls, ceiling, and floor of the test article as well as in the fuel pan. A thermocouple was also located in the NEA gas stream to indicate the temperature of the inerting gas. The oxygen analyzer used a polarographic oxygen sensor, temperature-controlled sensor block, and sample flow bypass system. The sample was supplied at a flow rate between 5 and 10 cubic feet per hour (2.35 to 4.7 liters per minute). The analyzer indicated from 0% to 25% oxygen with a linear 0 to 5 Vdc analog output. Upscale calibration was frequently performed using 16.0% O2 calibration gas. Upscale calibration allows for calibration with a oxygen percentage less than that of full scale. This provides for more accurate measurement of lower oxygen concentrations while sacrificing some accuracy at full scale. The total hydrocarbon concentration (THC) analyzer used for the experiments was a flame ionization detector type and was calibrated using a mixture of 4-percent propane in a nitrogen balance. The readings were given in parts per million of propane (ppm C3H8) on a scale of 0 to 100,000, corresponding to 0 to 10 Vdc respectively. Heated sample lines helped maintain the integrity of the sample. To approximate ppm Jet A from the ppm propane, the readings can be multiplied by 3.19. This can be used to estimate the fuel/air mass ratio keeping in mind the high

5
degree of uncertainty in estimating both the fuel density and the average carbon species for the fuel (estimated here to be 3.19) to make the conversion [3]. The flow meter used to measure the flow of NEA to the test article was temperature compensating and made of polysulfone with a capacity of 0.7 to 6.1 cubic feet per minute (CFM) of air. The float and housing of the unit were constructed of 316 stainless steel. The accuracy of the flow meter was given by the manufacturer to be ±3% of full scale. Data acquisition was accomplished via two A/D boards configured in a standard desktop PC. A computer program was written to acquire the signals and convert each to engineering units with a specified calibration file. Each test was saved as an ASCII file and imported into a spreadsheet where the data was manipulated and plotted. 2.1.3 Nitrogen-Enriched Air Generator.
The industrial gas generator used to provide NEA to the test article was a general purpose, off-the-shelf HFM gas separator with a skid-mounted compressor. The unit required 40 amps of 230 Vac, three-phase power and was equipped with an oxygen analyzer and purity alarm. The unit contained two gas separation modules each 2 inches in diameter allowing the unit to generate as much as 10 CFM of 95 percent NEA (5 percent oxygen by volume). The NEA was supplied through a flow meter mounted on the unit and could meter from 1- to 6-CFM flow rate with a bypass valve. The purity of the NEA gas (oxygen concentration) can be adjusted with the purity control valve to values between 15 percent oxygen by volume (NEA 85 percent) and 1 percent oxygen by volume (NEA 99 percent). 2.2 TEST PROCEDURES.
All tests were performed at the William J. Hughes Technical Center Aircraft Components Fire Test Facility. Each series of tests was designed to determine a specific relationship or to highlight the ability to nondimensionalize the data in terms of a certain parameter. Each test run consisted of inerting the test article to the desired oxygen concentration. Shop air was used to purge the tank to ensure a consistent initial oxygen concentration (approximately 20.9% oxygen by volume). At the start of each test, the data acquisition system was started and the NEA was directed into the tank. The tank was considered inert after the oxygen concentration was less then 8% by volume. Many tests fell short of this criterion and some far exceeded the target oxygen concentration. When attempting to exhibit relationships between parameters, it was often not practical to use the 8% target as a “hard” number. Also, some NEA purities did not allow for inerting the tank to 8% oxygen concentration (i.e., 90% NEA). A summary of each comparison test set is given in table 1.

6
TABLE 1. SUMMARY OF COMPARISON TEST SETS
Set Comparison Parameter Parameter Range Number of
Tests 1 NEA Volume Flow Rate 2 to 5.5 SCFM 4 2 NEA Oxygen Concentration 88% to 98 % O2 by volume 6 3 Average Ullage Temperature 45° to 131°F 3 4 Starting Ullage THC Concentration 0 to 15.6K ppm (C3H8) 3
2.2.1 Volume Flow Rate Comparison.
To compare the difference between inerting a fuel tank with different volume flow rates of NEA, a series of tests were performed with a constant purity of NEA with four different volume flow rates. The NEA generator was set to produce 96 percent NEA (4 percent oxygen by volume), and the test article was inerted four different times with 5.5-, 4-, 3-, and 2-CFM volume flow rates. 2.2.2 Nitrogen-Enriched Air Oxygen Concentration Comparison.
To compare the difference between inerting a fuel tank with different NEA oxygen concentrations, a series of tests were performed with a constant flow rate of NEA with six different NEA purities. The NEA generator was set to produce 88, 90, 92, 94, 96, and 98 percent NEA for six different inerting runs all with a 6-CFM volume flow rate. The oxygen concentration of the NEA is obtained by subtracting the NEA percent from 100 (NEA 96 is 100-96 = 4 percent oxygen by volume). 2.2.3 Ullage Temperature Comparison.
To compare the difference between inerting a fuel tank with different ullage temperatures, a series of tests were performed with a constant flow rate and purity of NEA with three different average ullage temperatures. The NEA generator was set to produce 96 percent NEA at 6 CFM for three different inerting runs with average ullage temperatures of 130°, 89°, and 45°F. A kerosene heater was used to heat the ullage from the bottom of the test article, while a liquid CO2 supply was used to cool the tank via the tank side walls. 2.2.4 Hydrocarbon Concentration Comparison.
To compare the difference between inerting a fuel tank with different hydrocarbon concentrations, a series of tests were performed with a constant flow rate and purity of NEA with three different average starting hydrocarbon concentrations. The hydrocarbon concentration was varied in the fuel tank by varying the heat flux on a pan of fuel in the bottom of the test article. The NEA generator was set to produce 96 percent NEA at 6 CFM for three different inerting runs with starting hydrocarbon concentrations of 0, 5,600, and 15,600 parts per million.

7
3. THEORY AND ANALYSIS.
Ullage washing can be described as an exchange of gases with different oxygen concentrations. The inerting gas is supplied to the fuel tank ullage space by means of a manifold, allowing for equal distribution of the NEA to each bay in the fuel tank. The inerting gas displaces the existing ullage space gases which consists of air (20.9% oxygen by volume) and fuel vapor. This acts to reduce the oxygen concentration of the tank to, but theoretically never reaching, the oxygen concentration of the inerting gas (i.e., NEA 95% is 5% oxygen by volume). 3.1 NONDIMENSIONAL ANALYSIS.
Much of the data is presented in a nondimensional format to allow for comparison of inerting experiments with different parameters, as well as giving numbers easily applied to any ullage-washing scenario. 3.1.1 Time.
It would be advantageous to present the data in a manner which is easily applied to all fuel tanks and all NEA flow rates. It can be hypothesized that the volume of NEA deposited within the tank dictates how quickly or slowly a vented fuel tank becomes inert given the assumption that the tank is homogenous and stores no gas (100% mixing, in flow = out flow). It also follows that this volume of gas divided by the total volume of the tank would be constant given a constant purity of gas deposited. To accomplish this, the time scale of the data was nondimensionalized by applying the flow rate and fuel tank volume, giving a ratio here named the volumetric tank exchange.
VolumeTankFuelRateFlowVolumeTimeExchangeTankVolumetric ∗=
This conversion allows for meaningful comparisons of data from different experiments with different tank sizes and flow rates. 3.1.2 Nitrogen-Enriched Air Oxygen Concentration.
In an effort to verify that the physical mechanisms at work do, in fact, largely dictate ullage washing of a vented fuel tank, it was desired to present the inerting data by nondimensionalizing the measured tank oxygen concentration in terms of inerting gas purity. The described theory states that the tank oxygen concentration is brought to the purity of the inerting gas over time by simply displacing the ullage space gas. This implies that the ratio of the difference between the oxygen concentration of air (ambient conditions) and the ullage in time, and air and the NEA gas purity being added to the tank have a constant relationship given a fixed volume of gas deposited. This can be described by the following relationship for the nondimensional factor referred to here as the tank inerting ratio:
][][
][][
22
22
NEAAmb
ullageAmb
OOOORatioInertingTank
−
−=

8
With: AmbO2 = Oxygen Concentration of Ambient Air
NEAO2 = Oxygen Concentration of Inerting Gas
UllageO2 = Oxygen Concentration of the Ullage (function of time) This relationship should allow for the creation of an empirical curve based on the inerting data for different purities of NEA with respect to volumetric tank exchange. This gives empirical relationship for volumetric tank exchange with respect to NEA purity and tank inerting level. 3.2 THEORETICAL SOLUTIONS.
3.2.1 Numerical Model.
A model was developed by the FAA Chief Scientific and Technical Advisor (CSTA) for fuel system design to calculate the oxygen concentration in a fuel tank by calculating the volume of oxygen supplied to and displaced from the tank over a given time interval and updating the oxygen concentration given the fuel tank volume. The volume of oxygen in the fuel tank at time t can be described by the following equation.
TankOOO VtVQIGOFQtVtV /)1()1()(222
−∗−∗+−= !!
Where: )(
2tVO
= Volume of oxygen in tank at time t
Q! = Flow rate of inerting gas (in terms of t) IGOF = Fraction of oxygen in inerting gas VTank = Volume of tank This equation makes the assumption that the contents of the tank are well mixed as illustrated by the third term, which states the outflow of oxygen at time t is the concentration of oxygen in the tank at time t-1. This allows for calculation of the fuel tank oxygen concentration at time t.
Tank
O
VtV
tOTank)(
)]([ 22 =
The model uses a spreadsheet to step through the calculations in time given an initial oxygen concentration of the fuel tank, as well as the flow rate and oxygen concentration of the inerting gas. 3.2.2 Exact Solution.
An exact solution was determined by using a perfect mixing model to develop an equation in terms of the rate of change of ullage oxygen concentration with respect to time. Figure 4
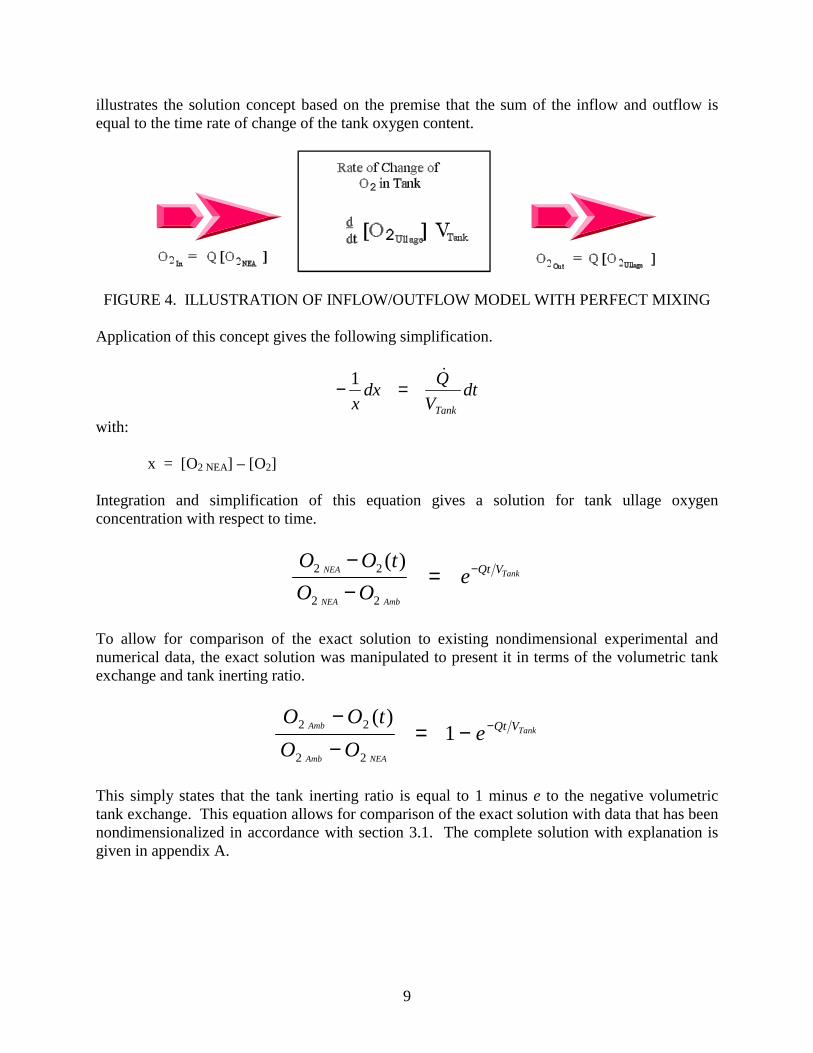
9
illustrates the solution concept based on the premise that the sum of the inflow and outflow is equal to the time rate of change of the tank oxygen content.
FIGURE 4. ILLUSTRATION OF INFLOW/OUTFLOW MODEL WITH PERFECT MIXING
Application of this concept gives the following simplification.
dtV
Qdxx Tank
!=− 1
with: x = [O2 NEA] – [O2] Integration and simplification of this equation gives a solution for tank ullage oxygen concentration with respect to time.
Tank
AmbNEA
NEA VQteOO
tOO −=−−
22
22 )(
To allow for comparison of the exact solution to existing nondimensional experimental and numerical data, the exact solution was manipulated to present it in terms of the volumetric tank exchange and tank inerting ratio.
Tank
NEAAmb
Amb VQteOO
tOO −−=−−
1)(
22
22
This simply states that the tank inerting ratio is equal to 1 minus e to the negative volumetric tank exchange. This equation allows for comparison of the exact solution with data that has been nondimensionalized in accordance with section 3.1. The complete solution with explanation is given in appendix A.

10
4. DISCUSSION OF RESULTS.
4.1 VOLUME FLOW RATE COMPARISON.
To examine the effect of varying flow rate of the inerting gas on the ability to inert a vented fuel tank, several inerting runs of different flow rates were compared. Figure 5 gives the fuel tank oxygen concentration over time for four different volume flow rates all using 96% NEA. The fuel tank contained no fuel (ullage total hydrocarbon concentration approximately zero), and the average ullage temperature was approximately 80°F. As expected, increasing the volume flow rate decreased the time required to inert the fuel tank. For example, it took a little over 1200 seconds (20 minutes) to reach 8 percent fuel tank oxygen concentration with the 5.5-CFM flow rate, while it took approximately 1800 seconds (30 minutes) to reach the same oxygen concentration with the 4-CFM flow rate.
0
5
10
15
20
25
0 200 400 600 800 1000 1200 1400 1600 1800 2000
Time (Seconds)
Tank
Oxy
gen
Con
cent
ratio
n (%
)
5.5 CFM
4 CFM
3 CFM
2 CFM
96% NEA
FIGURE 5. COMPARISON OF TANK OXYGEN CONCENTRATION OVER TIME FOR DIFFERENT VOLUME FLOW RATES
To present the data independent of time, figure 6 gives the same data plotted against volumetric tank exchange to nondimensionalize the data in terms of volume flow rate. As expected, the data is very similar, illustrating that all inerting runs with different flow rates for a single purity should collapse onto a single curve. This is a good indicator that the volume of gas displaced is in fact the critical factor in determining the amount of time required to inert a vented fuel tank by washing the ullage. The small observed differences can be accounted for by considering the accuracy of the volume flow meter.

11
0
5
10
15
20
25
0 0.2 0.4 0.6 0.8 1 1.2 1.4 1.6 1.8 2
Volumetric Tank Exchange
Tank
Oxy
gen
Conc
entra
tion
(%)
5.5 CFM
4 CFM
3 CFM
2 CFM
96% NEA
FIGURE 6. COMPARISON OF TANK OXYGEN CONCENTRATION WITH RESPECT TO VOLUMETRIC TANK EXCHANGE FOR DIFFERENT VOLUME FLOW RATES
4.2 PURITY COMPARISON.
To examine the effect of varying the inerting gas NEA purity on the ability to inert a vented fuel tank, several inerting runs of different oxygen concentrations (% NEA) were compared. Figure 7 gives the fuel tank oxygen concentration over time for six different NEA purities all using 6-CFM flow rate. The fuel tank contained no fuel (ullage total hydrocarbon concentration approximately zero), and the average ullage temperature was between 78° and 88°F. As expected, increasing the NEA purity (decreasing the inerting gas oxygen concentration) decreased the time required to inert the fuel tank. As an example, it took approximately 1200 seconds to inert the test specimen to 8 percent oxygen concentration using NEA 96 (4% oxygen by volume), while it took just over 1600 seconds to inert the specimen to the same level with NEA 94 (6% oxygen by volume). Figure 8 gives the same oxygen concentration data plotted against volumetric tank exchange. This data represents the ability of a particular NEA oxygen percentage to inert a fuel tank of any size with any inerting gas flow rate.

12
0
5
10
15
20
25
0 500 1000 1500 2000 2500 3000
Time (seconds)
Tank
Oxy
gen
Con
cent
ratio
n (%
)88% NEA90% NEA92% NEA94% NEA96% NEA98% NEA
6 CFM Flow Rate
FIGURE 7. COMPARISON OF TANK OXYGEN CONCENTRATION OVER TIME FOR DIFFERENT INERTING GAS OXYGEN CONCENTRATIONS
0
5
10
15
20
25
0 0.5 1 1.5 2 2.5 3
Volumetric Tank Exchage
Tank
Oxy
gen
Con
cent
ratio
n (%
)
88% NEA90% NEA92% NEA94% NEA96% NEA98% NEA
6 CFM Flow Rate
FIGURE 8. COMPARISON OF TANK OXYGEN CONCENTRATION WITH RESPECT TO VOLUMETRIC TANK EXCHANGE FOR DIFFERENT
NEA OXYGEN CONCENTRATIONS

13
Presenting the data independent of specific tank oxygen concentration should allow for comparison of inerting runs of different inerting gas oxygen concentration. Figure 9 gives the previously discussed data plotted against tank inerting ratio to nondimensionalize the data in terms of inerting gas oxygen percentage. As expected, the data is very similar, illustrating that all inerting runs with different NEA purities collapse onto a single curve. This universal curve for ullage washing allows for easy calculation of parameters given a specific inerting scenario.
0
0.2
0.4
0.6
0.8
1
1.2
0 0.5 1 1.5 2 2.5 3
Volumetric Tank Exchange
Tank
Iner
tion
Rat
io
88% NEA90% NEA92% NEA94% NEA96% NEA98% NEA
6 CFM Flow Rate
FIGURE 9. COMPARISON OF TANK INERTING RATIO WITH RESPECT TO VOLUMETRIC TANK EXCHANGE FOR DIFFERENT NEA OXYGEN
CONCENTRATIONS The data in figure 9 was averaged in terms of tank inerting ratio at each volumetric exchange to give a composite empirical data curve. This data was then fit with a fourth-order polynomial curve to obtain an empirical equation that describes ullage washing tank inerting ratio in terms of volumetric tank exchange. The polynomial equation is:
0.0121 -1.0873x + 0.5275x - 0.1345x + 0.0145x- = Ratio InertingTank 234 where: x = volumetric tank exchange The majority of polymeric membrane NEA generation systems tend to be most efficient (trade between purity, flow, and system efficiency) when producing 95 percent NEA [4]. To apply this equation, the tank inerting ratio was first calculated using 95 percent NEA and the 8 percent inerting target discussed in section 1. This gives a tank inerting ratio of 0.81132 with an ambient

14
air oxygen concentration of 20.9 percent. Solving the above stated polynomial backwards, a volume tank exchange of 1.49455 was calculated, or approximately 1.5. This means that to inert a fuel tank to an oxygen concentration of 8 percent by volume, it requires an amount of 95 percent NEA equal to 1.5 times the volume of the fuel tank ullage space to be washed through the tank. For example, an empty 500-cubic-foot tank requires approximately 750 normal cubic feet of 95 percent NEA to reach an oxygen concentration of 8 percent by ullage washing. 4.3 ULLAGE TEMPERATURE COMPARISON.
To examine the effect of different ullage temperatures on the ability to inert a vented fuel tank, three inerting runs of different average ullage temperatures were compared. Figure 10 gives the fuel tank oxygen concentration in terms of volumetric tank exchange for a hot, cold, and ambient average ullage temperature. The fuel tank contained no fuel (ullage total hydrocarbon concentration approximately zero). The average ullage temperature over the time period of the test varied by approximately ±5°F and was calculated as 131°F for the hot test and 45°F for the cold test. The average ullage temperature over time for the ambient temperature test was 89°F with very little variation. The average ullage temperature had very little effect on the overall time to inert the tank, although some anomalies can be observed for the hot ullage data at lower tank oxygen concentrations. This is probably due to the effects of fuel tank heating causing irregular mixing of the gases in the ullage space as the pattern of the curve inflection changes were observed to follow the cycling of the tank heater on and off.
0
5
10
15
20
25
0 0.5 1 1.5 2 2.5 3
Volumetric Tank Exchange
Tank
Oxy
gen
Con
cent
ratio
n (%
) Ambient (Average Ullage Temp = 89 F)
Hot Ullage (Average Ullage Temp = 131 F)
Cold Ullage (Average Ullage Temp = 45 F)
94% Pure; 6 CFM Flow Rate
FIGURE 10. COMPARISON OF TANK OXYGEN CONCENTRATION WITH RESPECT TO VOLUMETRIC TANK EXCHANGE FOR DIFFERENT
ULLAGE TEMPERATURES

15
4.4 HYDROCARBON COMPARISON.
To examine the effect of fuel vapor in the ullage space on the ability to inert a vented fuel tank, three inerting runs of different starting ullage hydrocarbon concentrations were compared. Figure 11 gives the fuel tank oxygen concentration in terms of volumetric tank exchange for no fuel (zero hydrocarbon concentration) as well as two different total hydrocarbon concentrations all with consistent average ullage temperatures. The hydrocarbon concentration at the start of inerting had very little effect on the overall time to inert the tank. This is consistent with the hypothesis that the inerting process is a simple volume exchange of gases of different oxygen concentrations. A change in the hydrocarbon concentration of the ullage gas has very little effect on the oxygen concentration and no effect on the volume of gas exchange during the process.
0
5
10
15
20
25
0 0.5 1 1.5 2 2.5 3
Volumetric Tank Exchange
Tank
Oxy
gen
Con
cent
ratio
n (%
) No Fuel (Approximate 0 [THC])5.6K PPM Propane Ullage [THC]15.6K PPM Propane Ullage [THC]
94% Pure; 6 CFM Flow Rate
FIGURE 11. COMPARISON OF TANK OXYGEN CONCENTRATION WITH
VOLUMETRIC TANK EXCHANGE FOR DIFFERENT INITIAL ULLAGE TOTAL HYDROCARBON CONCENTRATIONS
4.5 MODEL COMPARISON.
To validate the ability of the theoretical model developed by the FAA CSTA for fuel system design to predict oxygen concentration in a vented fuel tank inerted with NEA, two scenarios tested were modeled and the theoretical time versus oxygen concentration data were graphed and compared with the test data. Figure 12 illustrates the comparison of 94% and 96% NEA inerting runs with 6-CFM flow rates with the theoretical model. The good comparison implies the assumptions made by the model are valid, and the ullage-washing process is easily described by a simple exchange of gases of two different oxygen concentrations.

16
0
5
10
15
20
25
0 500 1000 1500 2000 2500
Time (seconds)
Oxy
gen
Con
cent
ratio
n (%
)
94% NEA Model94% NEA Data 96% NEA Model96% NEA Data
6 CFM Flow
FIGURE 12. COMPARISON OF ULLAGE-WASHING OXYGEN CONCENTRATION MODEL DATA WITH TWO DIFFERENT ULLAGE-WASHING RUNS
Nondimensionalizing the output of the model for any case results in precisely the same result. This model curve is the equivalent of the universal ullage-washing curve illustrated in figure 9. The nondimensional model curve was plotted with the empirical curve fit described in section 4.2. This comparison can be seen in figure 13. Although the comparison of curve magnitude and trends is good, the model value for inerting ratio is consistently biased low from 1.5 to 3 percent of the local empirical value for the equivalent volumetric tank exchange. Also plotted with this data is the exact solution calculated in section 3.2. The exact solution is very close to the model data. This makes sense in that they are based on the same principal. Both models assume perfect mixing, although the numerical model approximates by stepping through time, while the exact solution is precise for all times. Using the tank inerting ratio calculated in section 4.2 as 0.81132, the resulting model volumetric tank exchange can be obtained from the model universal ullage-washing curve. Linear interpolation of the model data gives a volumetric tank exchange of 1.610748 or a 7.7 percent difference than the local value predicted by the empirical equation. Note that the model is conservative in its estimation of volumetric tank exchange, giving a number larger than calculated with the empirical equation. This is most likely the result of imperfect mixing in the empirical data set. If mixing is not complete and instantaneous, small quantities of ullage space not mixed are being vented from the tank. These quantities would have the effect of creating better inerting, as less oxygen is being removed from the tank. The model assumes that all gases deposited at time t-1 are mixed by time t.

17
y = -0.0145x4 + 0.1345x3 - 0.5275x2 + 1.0873x - 0.0121
0
0.2
0.4
0.6
0.8
1
1.2
0 0.5 1 1.5 2 2.5 3 3.5Volumetric Tank Exchange
Tank
Iner
ting
Rat
io
Empirical CurveModel DataExact Solution
Empirical Curve Fit Equation
xey −−= 1Exact Solution
FIGURE 13. COMPARISON OF NONDIMENSIONAL ULLAGE-WASHING OXYGEN CONCENTRATION MODEL AND EXACT SOLUTION DATA WITH EMPIRICAL
ULLAGE-WASHING DATA 5. CONCLUSIONS AND RECOMMENDATIONS.
Recent research has indicated that inerting of fuel tanks could allow for a significant increase in the safety of fuel tanks in the existing fleet [1]. To help determine the cost of inerting a commercial transport class airplane fuel tank, the lab experiments attempted to quantify the nondimensional parameters that would be required to calculate the amount of NEA required to obtain a desired oxygen concentration in a specified vented fuel tank volume. The research indicated that a volumetric tank exchange of 1.5 is required to inert a vented fuel tank with 95 percent NEA to 8 percent oxygen concentration by volume via ullage washing. Ullage temperature had a small effect on the ability of ullage washing to inert the tank, while hydrocarbon concentration had no measurable effect. The model developed by the FAA CSTA for fuel system design showed good agreement with the empirical equation developed from the experimental data, with a 7.7 percent disagreement between the predicted volumetric tank exchange required and the empirical equation determination. The model is more conservative than the numerical estimation. An exact solution to the mixing problem is very close to the model data.

18
To quantify the effect of more complex geometries on the universal inerting curve and the model or exact solution, full-scale inerting experiments should be performed. A full-scale test article could be tested with various ullage-washing scenarios to verify the empirical curve and model/exact solution do provide a good representation of ullage washing of a large transport commercial airplane. 6. REFERENCES.
1. Aviation Rulemaking Advisory Committee, “Fuel Tank Harmonization Working Group Final Report,” July 1998.
2. “A Review of the Flammability Hazard of Jet A Fuel Vapor in Civil Transport Aircraft
Fuel Tanks,” Fuel Flammability Task Group, DOT/FAA/AR-98/26, June 1998. 3. Summer, Steven, M., “Cold Ambient Temperature Effects on Heated Fuel Tank Vapor
Concentrations,” DOT/FAA/AR-TN99/93, July 2000. 4. Cavage, William M., “The Cost of Implementing Ground-Based Fuel Tank Inerting in
the Commercial Fleet,” DOT/FAA/AR-00/19, May 2000.

A-1
APPENDIX A DERIVATION OF EXACT SOLUTION FOR ULLAGE WASHING
The exact solution is based on the assumption that the summation of the inflow and outflow is equal to the time rate of change of oxygen in the tank. Note that the volume of oxygen in the tank divided by the tank volume is, by definition, the oxygen concentration in the tank. The model assumed perfect mixing in that at any time t, the tank oxygen concentration is equal to the outflow.
][][][ 222 OOQOdtdV
NEATank −= !
dtV
QOO
Od
TankNEA
!=
− ][][][
22
2
Given: x = [O2 NEA] – [O2] Then: dx = -d[O2]
It follows that:
dtV
Qdxx Tank
!=− 1
(1)
∫∫ =−t
t Tank
x
x
dtV
Qdxx
""
!1
t
Tank
x
x tV
Qx0
)()ln(!
"=−
{ } )()ln()ln( tV
QxxTank
!" =−−

A-2
)()ln( tV
Qxx
Tank
!
"
=−
Where:
)(22
22
tOOx
OOx
NEA
AmbNEA
−=
−="
• Substituted back in
)()(
ln22
22 tV
QOO
tOOTank
AmbNEA
NEA
⋅
−=
−−
−
⋅
=−− Tank
AmbNEA
NEAV
tQ
eOO
tOO
22
22 )( (2)
• Rearrange to Match the Existing Nondimensional Scheme
( )
( )
−
−
−
−
⋅⋅
⋅
⋅
+−=
−−=
−=−
Tank
Amb
Tank
NEANEA
Tank
AmbNEANEA
Tank
AmbNEANEA
VtQ
VtQ
VtQ
VtQ
eOeOOtO
eOOOtO
eOOtOO
2222
2222
2222
)(
)(
)(

A-3/A-4
−
−
⋅⋅
+
−=Tank
Amb
Tank
NEA
VtQ
VtQ
eOeOtO 222 1)(
• Subtract O2Amb from both sides.
Amb
Tank
Amb
Tank
NEAAmbOeOeOOtO
VtQ
VtQ
22222 1)( −+
−=−
−
−
⋅⋅
• Multiply by –1 and rearrange
( )
−−=−
−−
−=−
−−−=−
−
−
−
−
−
⋅
⋅⋅
⋅⋅
Tank
NEAAmbAmb
Tank
NEA
Tank
AmbAmb
Tank
NEA
Tank
AmbAmbAmb
VtQ
VtQ
VtQ
VtQ
VtQ
eOOtOO
eOeOtOO
eOeOOtOO
1)(
11)(
1)(
2222
2222
22222
Or
−
⋅
−=−− Tank
NEAAmb
AmbVQt
eOO
tOO1
)(
22
22
(3)