Inequality, Income Growth, and Mobility: The Basic Facts ...
24
Inequality, Income Growth, and Mobility: The Basic Facts Peter Gottschalk The Journal of Economic Perspectives, Vol. 11, No. 2. (Spring, 1997), pp. 21-40. Stable URL: http://links.jstor.org/sici?sici=0895-3309%28199721%2911%3A2%3C21%3AIIGAMT%3E2.0.CO%3B2-L The Journal of Economic Perspectives is currently published by American Economic Association. Your use of the JSTOR archive indicates your acceptance of JSTOR's Terms and Conditions of Use, available at http://www.jstor.org/about/terms.html. JSTOR's Terms and Conditions of Use provides, in part, that unless you have obtained prior permission, you may not download an entire issue of a journal or multiple copies of articles, and you may use content in the JSTOR archive only for your personal, non-commercial use. Please contact the publisher regarding any further use of this work. Publisher contact information may be obtained at http://www.jstor.org/journals/aea.html. Each copy of any part of a JSTOR transmission must contain the same copyright notice that appears on the screen or printed page of such transmission. The JSTOR Archive is a trusted digital repository providing for long-term preservation and access to leading academic journals and scholarly literature from around the world. The Archive is supported by libraries, scholarly societies, publishers, and foundations. It is an initiative of JSTOR, a not-for-profit organization with a mission to help the scholarly community take advantage of advances in technology. For more information regarding JSTOR, please contact [email protected]. http://www.jstor.org Fri Jul 13 15:23:58 2007
Transcript of Inequality, Income Growth, and Mobility: The Basic Facts ...

Inequality, Income Growth, and Mobility: The Basic Facts
Peter Gottschalk
The Journal of Economic Perspectives, Vol. 11, No. 2. (Spring, 1997), pp. 21-40.
Stable URL:
http://links.jstor.org/sici?sici=0895-3309%28199721%2911%3A2%3C21%3AIIGAMT%3E2.0.CO%3B2-L
The Journal of Economic Perspectives is currently published by American Economic Association.
Your use of the JSTOR archive indicates your acceptance of JSTOR's Terms and Conditions of Use, available athttp://www.jstor.org/about/terms.html. JSTOR's Terms and Conditions of Use provides, in part, that unless you have obtainedprior permission, you may not download an entire issue of a journal or multiple copies of articles, and you may use content inthe JSTOR archive only for your personal, non-commercial use.
Please contact the publisher regarding any further use of this work. Publisher contact information may be obtained athttp://www.jstor.org/journals/aea.html.
Each copy of any part of a JSTOR transmission must contain the same copyright notice that appears on the screen or printedpage of such transmission.
The JSTOR Archive is a trusted digital repository providing for long-term preservation and access to leading academicjournals and scholarly literature from around the world. The Archive is supported by libraries, scholarly societies, publishers,and foundations. It is an initiative of JSTOR, a not-for-profit organization with a mission to help the scholarly community takeadvantage of advances in technology. For more information regarding JSTOR, please contact [email protected].
http://www.jstor.orgFri Jul 13 15:23:58 2007

Journal of Economic Perspectives-Volume 11, Number 2-Spring 1997-Pages 21-40
Inequality, Income Growth, and Mobility: The Basic Facts
Peter Gottschalk
uring the 1950sand 1960s,mean wages in the United States grew rapidly, and the dispersion around this growing mean changed very little. Starting in the 1970sand continuing into the 1980sand 1990s, these patterns were
reversed: mean wages grew slowly, and inequality increased rapidly. These changes in labor markets were reflected in changes in the distribution
of family income.' The mean of the distribution of family income did increase after 1973, in spite of the near constancy of mean real wages, as family members in-creased the number of hours they worked. However, the increase in inequality of wages was mirrored by an increase in the dispersion of family income. A large descriptive literature has documented the rise in inequality, while a smaller behav-ioral literature has sought to delineate the causes of this rise.'
These changes in the distribution of family income affected rates of poverty di-rectly. During the 1950s and 1960s, temporary increases in poverty during recessions were more than offset by declines in poverty during economic expansions. As long as the poor gained along with everyone else from the secular growth in the mean, one could be confident that poverty rates would ratchet down. This is exactly what h a p pened as poverty rates fell from 22.4 percent in 1959 to 11.1 percent in 1973.
' Changes in the distribution of family income reflected other changes as well, including demographic shifts and changes in the distribution of other sources of incomes such as transfer income and earnings of spouses.
For a review of this literature, see Levy and Murnane (1992) and Gottschalk and Smeeding (1997).For a discussion of patterns of inequality before the 1950%the interested reader might begin with Golden and Margo (1992). As one indicator of the profession's current interest in distributional issues, there were 16 invited sessions on inequality at the annual meetings of the American Economic Association between 1991 and 1995. In contrast, there had been only seven sessions on distributional issuesbetween 1975 and 1979, and almost all of these had focused on gender and race differences in average incomes. None had focused on the growth in overall inequality.
Peter Gottschalk is Professor ofEconomics, Boston College, Boston, Massachusetts.

22 Journal of Economic Perspectives
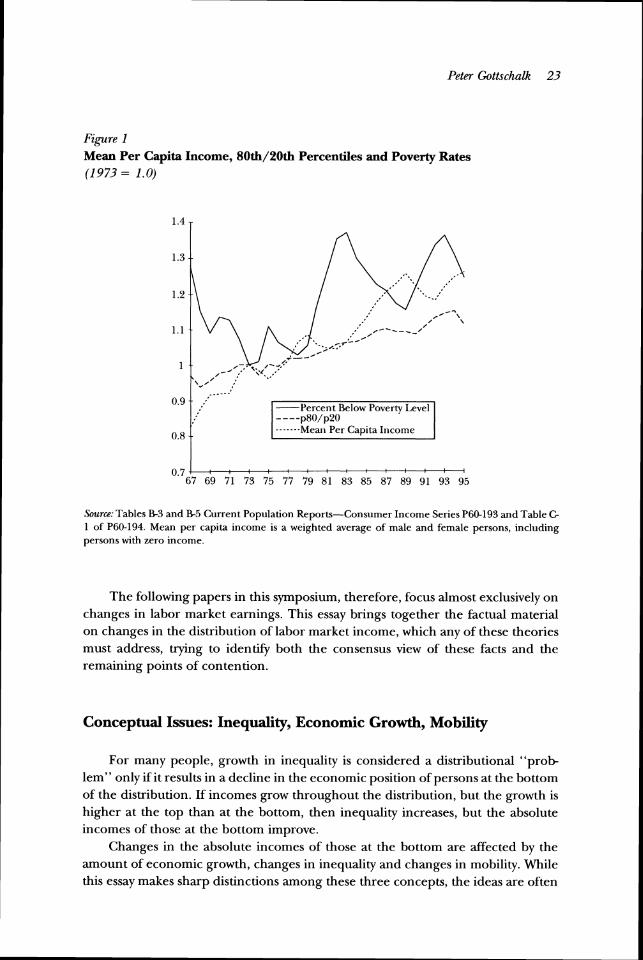
But these patterns in mean family income, poverty and inequality came to an end in the 1970s. Figure 1 plots real mean per capita income, the official poverty rate and the ratio of the income of the household at the 80th percentile to the income at the 20th percentile, which is a commonly used measure of inequality. Percentile ratios are often used as the overall measure of inequality, partly because they are not influenced by the problem that at the very top of the income distribution, most surveys report income higher than a certain amount as being "top-coded." Changes in percentile ratios avoid this problem of top-coding by only requiring knowledge of the income at the 80th or 90th percentile, which is below the top-coded values. But other measures and other ratios display largely similar patterns.
Over the last two decades, poverty rates have continued to increase during recessions and decline during expansions, just as they had in the 1960s. However, the declines in poverty during expansions have failed to offset the increases during recessions, and poverty rates ratcheted up 31 percent from 1973 to 1994 (that is, from 11.1 percent of the population to 14.5 percent) in spite of a 27 percent in- crease in mean per capita income. The coexistence of rising poverty and increases in mean incomes indicates that the poverty-reducing effects of growing mean in- come were being offset by the growth in inequality, as well as demographic changes. Changes in the demographic composition of the population, such as the increase in female-headed households, are also partially responsible for the rise in poverty rates. But these changes are no more important to the rise in poverty than the increase in wage inequality (Danzinger and Gottschalk, 1995).
The trends in poverty and household income inequality have been the driving force in what the popular press has dubbed the "fairness debate." However, the primary academic focus has been on changes in the distribution of earnings rather than on family income. This focus on labor market incomes partly reflects the fact that labor economists were the first to notice the recent rise in inequality and that labor economists have well-developed tools with which to analyze changes in the relative demand and supply of less skilled labor, as well as a more limited framework in which to analyze institutional constraints on these markets.
Less justifiably, the focus on labor market outcomes rather than on family incomes also reflects the fact that it is much more difficult to model the process leading to changes in the distribution of family income than to model changes in labor market earnings. To understand family income, one would have to un- derstand not only the process generating other private income sources (divi- dends, interest and rent) and public income sources, but also the joint decision-making process among family members who adjust their labor supply, human capital, household formation and childbearing decisions in reaction to changes in outside sources of income, as well as to changes in the earnings of other family members. While the accompanying papers in this symposium indicate that the labor economists' framework is far from complete, the gaps are small compared to the limited understanding of the processes that generate families and family income.
Peter Gottschalk 23
Figure 1 Mean Per Capita Income, 80th/20thPercentiles and Poverty Rates (1973= 1.0)
----p80/p20 .. . . .. . Mean Per Capita Income
Source..Tables B-3 and B-5 Current Population Reports-Consumer Income Series P60-193 and Table G 1 of P60-194. Mean per capita income is a weighted average of male and female persons, including persons with zero income.
The following papers in this symposium, therefore, focus almost exclusively on changes in labor market earnings. This essay brings together the factual material on changes in the distribution of labor market income, which any of these theories must address, trying to identify both the consensus view of these facts and the remaining points of contention.
Conceptual Issues: Inequality, Economic Growth, Mobility
For many people, growth in inequality is considered a distributional "prob lem" only if it results in a decline in the economic position of persons at the bottom of the distribution. If incomes grow throughout the distribution, but the growth is higher at the top than at the bottom, then inequality increases, but the absolute incomes of those at the bottom improve.
Changes in the absolute incomes of those at the bottom are affected by the amount of economic growth, changes in inequality and changes in mobility. While this essay makes sharp distinctions among these three concepts, the ideas are often

24 Journal of Economic Perspectives
confused, especially in the popular press. Increases in the mean, increases in in- equality and increases in mobility each describe a particular aspect of the joint distribution of income, Y,, over T periods: f(Y,, K, . . . Y , ) .Economic growth be- tween period t and t + k reflects differences in the means of the marginal distri- butions of Y in the two years. Increases in inequality reflect changes in the variance (and in higher level moments) of the marginal distributions. Changes in mobility reflect changes in the covariance of income across years.
Increases in mean income will reduce the proportion of people falling below a fixed poverty threshold as long as there are no other changes in the distribution. This insight lies at the heart of the proposition that economic growth can benefit everyone. However, if the mean and the variance of the distribution both increase, then there is no assurance that all will be better off. The U.S. experience of recent decades shows that increases in inequality of labor market income can fully offset the effects of increase in the mean, leading to a decline in absolute (as well as relative) earnings at the bottom of the distribution.
Measures of mobility capture how incomes are correlated across periods. Without information on mobility it is impossible to tell what proportion of low earners in one cross-section also had low earnings in a subsequent cross-section. If many low earners in one year have high earnings in other years, then the cross- sectional earnings distribution is not very informative. Only longitudinal data can yield that information. Likewise, cross-section data cannot reveal whether people with low earnings in one year are getting poorer, nor for that matter whether the rich are getting richer. Cross-sectional data can only be used to compare the characteristics and number of persons with low earnings in one year with those in another year.
There is one important situation where inequality in each period and mobility across periods can be combined into one overall measure of multiple period inequality. Suppose that people have sufficient assets or access to capital so that they can smooth consumption across periods. In this case, the relevant income concept for measuring inequality is average discounted earnings across these periods. A person might have temporarily low earnings in one period, but this would not indicate his or her position in the distribution of permanent earnings. If multiple-period earnings is the relevant concept, then inequality in each subperiod and mobility across subperiods would both impact inequality of permanent (or average) earnings.'
In keeping with the notion that economic growth, changes in inequality and changes in mobility are three distinct concepts that describe different aspects of
1 : If multiple-period average discounted income of person i is given by p,=-Z d,Y,, where d , is discount
T , factor, then
so individual year variances and cross year covariances affect the variance of average income.

Inequality, Income Growth, and Mobility: The Basic Facts 25
changes in the distribution of income, the following sections of this paper will take up each of these three elements in turn.
Changes in Mean and Median U.S. Earnings
The 1980s and early 1990s can be characterized as a period of slow growth and rising inequality of earnings. For both men and women, real wages were increasing steadily during the 1960s and into the early 1970s. For example, real weekly earnings grew by 2.9 percent per year for men and 2.8 percent per year for women between 1963 and 1973.%ut after 1973, the pattern of male and female wages diverges. Men's wages leveled off; the average real weekly wage for a male worker in 1994 was actually lower than was the average in 1973. Since the growing inequality pulled up the mean relative to the median, the median real wage for men decreased even more than the mean over this same period. In sharp contrast to the near constancy of mean wages for males since 1973, real wages for women grew at 2.7 percent per year from 1973 to 1993.
The lack of significant growth in mean or median real earnings for men turns out to be more controversial than the growth in inequality (documented in the next section). Three primary objections have been lodged against the claim that growth in earnings was close to zero during the 1970s and 1980s. The first two concerns focus on the measurement of real earnings.
It is by now well accepted that the Consumer Price Index (CPI) initially overstated inflation during the 1970s and, therefore, understated growth in mean real earnings by failing to account appropriately for the changes in the costs of housing. This concern is dealt with easily enough. The research com- munity adopted either the CPI-X, which adjusts the CPI properly for changes in the cost of housing, or the chain-weighted Personal Consumption Expenditures deflator (PCE), which better captures the increased cost of goods bought by consumer^.^ The figures given here are deflated by the PCE, so they are not subject to this criticism.
The second criticism concerning measurement of real earnings argues that the current inflation indexes are overstated for various reasons: for example, because they fail to capture fully improvements in quality, or because they do not capture the ability of consumers to substitute away from goods whose prices increase es- pecially quickly. While no consensus exists on the size of this bias, most point
These estimates are for mean real weekly wages for full-time, full-year workers based on data from the March Current Population Surveys (CPS). The sample used throughout this paper, which is similar to that used by Katz and Murphy (1992), includes full-time workers, 22 to 62, who were in the labor force at least 39 weeks, worked at least one week and did not work part-year due to school, retirement or militaly service. Those self-employed and working without pay were also excluded. The Personal Con- sumption Expenditure deflator (PCE) is used throughout. 'Note that the choice of deflator does not affect measures of inequality. Since inequality measures relative incomes of persons in different parts of the distribution, price levels cancel.

26 Journal of Economic Perspectives
estimates of the overstatement of inflation fall in the range of .5 to 1.5 percentage points."f adjustments of this magnitude were made, real mean earnings of males during the 1980s would have shown a modest increase instead of near constancy. The median wage would have increased rather than declined. But in no case would the growth rates of male wages after 1973 have approached the growth rates during the 1950s and 1960s.
The third measurement issue focuses on the fact that the CPS data used in most studies exclude nonwage compensation, such as employer contribu- tions to health insurance, retirement and other fringe benefits. While it is commonly assumed that these fringe benefits grew rapidly during the 1980s, the difference in the growth in wages and total compensation is surprisingly small. Bosworth and Perry (1994) find that the inclusion of nonwage compen- sation would have increased the growth in total compensation by 0.4 percent prior to 1973 and had no effect after 1983. This largely reflects the fact that the increases in employers' contributions to health insurance were offset by a lesser-known decrease in employer's contributions to retirement, as employers shifted to defined contribution plans. If anything, the contrast between the high wage growth before 1973 and the slow or negative wage growth during the 1980s and 1990s would be exacerbated by the inclusion of nonwage compensation.
Changes in U.S. Earnings Inequality
The changes in the mean of the earnings distribution for both men and women mask very different changes at other points in the distribution. Figure 2 illustrates this point by plotting the percentage change between 1973 and 1994 in the real weekly wages at each point in the distribution. Males at the 15th percentile had mean real weekly wages of $300 in 1994 and $393 in 1973. The resulting 24 percent decline at the 15th percentile is plotted in Figure 2. At the other extreme, males at the 90th percentile in 1994 earned 8 percent more than their counterparts in 1973. Between these two points, the relationship between percentile rank and growth in real earnings is nearly monotonic-the lower the rank, the smaller the increase (or the larger the decrease) in earnings. Thus, for men, the increase in inequal- ity reflects an absolute as well as a relative decline in the lower portion of the distribution.'
For women, the pattern is somewhat different. Again, the growth in earnings was highest at the higher deciles and lowest at the lower deciles, indicating growth in inequality of earnings among women as well as among men. However,
"ee Shapiro and Wilcox (1996) for a more extensive discussion of this issue. 'Since the function in Figure 2 is relatively flat near the crossover point, the exact decile point where earnings start to decline is sensitive to definitions and measures.

Peter Gottschalk 27
Figure 2 Percentage Change in Real Weekly Wages by Percentile, 1973- 1994
Z 0.5---z 0
* 0.4.-I
3 I
2- / I
0.3.-
$;O - -,-F~ I
0.2-3
2 -0.3-
Source.Author's tabulation of the March CPS.
the growth in inequality of earnings was being offset by a sufficiently large shift in the whole distribution, which resulted in small absolute increases in earnings for women at the bottom of the distribution, as well as much larger increases for those at the top.
Since unemployment rates were higher in 1994 than in 1973, some of this increase in equality may reflect cyclical rather than secular changes. Figure 3 shows the year-to-year changes in earnings inequality by plotting the percentage difference in earnings at the 90th percentile relative to the 10th percentile in each year. The increase in earnings inequality in these data clearly reflect a secular trend that dominates the relatively small cyclical fluctuations in inequal-ity. In retrospect, it appears that earnings inequality started to rise for males in the early 1970s and continues through the mid-1990s. For females, inequality declined through the mid-1970s, then began an upward trend that continued through the mid-1990s.
One striking point about Figure 3 is that the back-to-back recessions in the early 1980s do not particularly show up as periods where inequality is growing more rapidly. Inequality has increased both in years when unemployment was rising and when it was falling. Moreover, unemployment levels by the mid-1990s are comparable to those in the late 1980s and the late 1970s-yet inequality is substantially higher now than it was then. The steady increase in earnings

28 Journal of Economic Perspectives
Figure 3 Percentage Difference in Weekly Wages at 90th and 10th Percentiles, 1963-1994
F e m a l e
I1 63 65 67 69 71 73 75 77 79 81 83 85 87 89 91 93
Source:Author's tabulation of the March CPS.
inequality over a 20-year period clearly establishes that the changes are secular, not cyclical.
Changes in Between-Group Inequality The overall patterns in earnings inequality shown in Figures 2 and 3 reflect
changes both between groups and inequality within groups. To explore these differences, I start by focusing on race and gender differentials. As shown ear- lier in Figure 2, the earnings of women grew faster than did the earnings of men at each point in their respective distributions between 1973 and 1994. As a result, the gap between the mean weekly earnings of women and men de- clined. This was partially a result of changes in human capital of working women, which would be reflected in education and experience, but it also reflected an increase in the relative earnings of women, holding these char- acteristics constant.
Figure 4 plots the coefficients on a female dummy variable in a set of standard log weekly earnings regressions, where the other independent variables include a set of education dummies (less than high school, some college, college, more than college), a quadratic variable that captures experience levels, and three regional dummies (Midwest, South and West). This regression was estimated for each year from 1963 to 1994. The regression shows that the earnings gap between men and women closed steadily from almost 60 percent of mean female earnings in the mid- 1960s to less than 40 percent by the early 1990s. The coefficient on the dummy variable for race reveals that in contrast to the narrowing of the female gap, the

Inequality, Income Growth, and Mobility: The Basic Facts 29
Figure 4 Gender and Race Differentials, 1963- 1994
Source: Coefficient on variables for female and black in log earnings regression, estimated separately in each year from the March CPS.
earnings gap between blacks and non-blacks narrowed from more than 40 percent in the early 1960s to less than 15 percent in 1975, but progress ceased after this point.
Clearly, the narrowing of the female gap and the constancy of the black/non- black gap cannot explain the growing wage inequality already documented, since the mean incomes of these less advantaged groups were either catching up or re- maining in the same relation to the overall mean income.
However, changes in the mean differences between education and be- tween experience groups go a long way toward explaining the rise in inequality. The college premium is captured by the coefficient on the dummy college variable in a standard regression explaining (the log of) weekly earnings; es- sentially, that coefficient shows how much more a college graduate earns than does a high school graduate holding other factors, such as experience, con- stant."igure 5 plots the college premium, showing the coefficients on the college variable for each year. The solid line shows the college premium for all persons. The dashed line shows the premium for recent college graduates
More specifically, the coefficient or the college dummy will capture the difference in the log of earnings of a high school graduate (the excluded group) and a college graduate. The educational recoding in the 1992 CPS causes a discontinuity in the data but it does not result in a perceptible break in trend in estimated coefficients in this year. Returns to high school (over high school dropout) show much smaller increases.

30 Journal of Economic Perspectives
who have one to five years of labor market experience. The solid line shows that overall, the college premium declined during the 1970s, reaching a low of 31 percent in 1979. During this period, inequality between education groups was reducing overall income inequality, and thus the premium to education cannot help to explain why inequality rose in the early 1970s. The decline in the college premium was, however, quickly reversed in the early 1980s. By 1993, the college premium had reached a high of 53 percent.
This rapid increase in the college premium is widely interpreted as evi- dence that labor market forces were driving up the price of skills. This conclu- sion is reinforced by the even steeper rise in the college premium for recent graduates. Since recent college graduates have acquired the most recent skills and have had the least time for their marketable skills to deteriorate, one would expect that their wages would be most responsive to changes in market pres- sures. Alternatively, older high school graduates may be less insulated from market forces by seniority or union coverage, keeping their wages from declin- ing as fast as the wages of younger high school graduates. Either explanation is consistent with the more-than-doubling between 1973 and 1994 in the dif- ference between the earnings of college and high school graduates with 1 to 5 years of experience.
While changes in the relative price of college workers are crucial in under- standing changes in inequality, it is important to remember that increases in the college premium are being driven more by the decline in real earnings of high school graduates than by the increase in earnings of college workers. Between 1979 and 1994, the real weekly earnings of college graduates increased by 5 percent, and the earnings of high school graduates declined by 20 percent, which is what caused the college premium to more than double.
What is remarkable about the increase in the college premium is that it was accompanied by a 7 percentage point increase in the proportion of the labor force with a college degree, from 22 percent in 1979 to 29 percent in 1994. The fact that the college intensity increased while the college premium was also increasing is widely regarded as compelling evidence that demand for skilled labor was shifting faster than supply. Likewise, the decline in wages of high school graduates, who made up a decreasing proportion of the labor market, was clearly signaling that high school workers were having to compete for a declining pool of jobs, in spite of their rapidly falling relative cost to firms.
The increase in overall earnings inequality reflected not only an increase in the relative price of more educated workers, but also an increase in the relative wages of more experienced workers.%ile experienced workers have always re-
'' Experience is measured as age minus years of education, minus six. Separate regressions are estimated for men and women, since this measure is likely to be poor for women who do not remain in the labor market in all years. Since the experience premium changes along the quadratic in experience, the premium is evaluated at 10years of experience.

Peter Gottschalk 31
Figure 5 College Premium: All and New Entrants
Source: Coefficient on college education in log earnings regression, estimated separately in each year from the March CPS.
ceived higher pay than have recent labor market entrants, this "experience pre- mium" increased for both males and females in the 1970s. Figure 6 shows a very rapid increase in the experience premium for males during the early 1970s, which partially explains why overall inequality could increase in the early 1970s in spite of the decline in the education premium for males during this early period. This initial increase in the premium paid to more experienced male workers continued into the 1980s but then leveled off at a very high level. Increases in inequality during the 1990s, therefore, do not reflect further increases in the experience premium for men.
Increases in the experience premium for females also started in the early 1970s, but the largest increases came in the 1980s and 1990s. Whether this increase reflects changes in unobserved characteristics of older women who were entering the labor markets or an actual increase in the return to experi- ence is difficult to ascertain. In either case, the measured increase in the ex- perience premium served to increase further inequality among women in the 1980s and 1990s.
Changes in overall inequality clearly reflect the fact that the less educated lost relative to the more educated, and more experienced workers gained relative to younger workers. This, however, is only part of the story.
Changes in Witbin-Group Inequality Inequality increased not only among those with different observable traits,
such as gender, race, education and experience, but also within groups of

32 Journal of Economic Perspectives
Figure 6 Experience Premium
Source: Coefficients on experience squared in log earnings regression, estimated separately in each year from the March CPS. The coefficients on the quadratic experience profile are evaluated at 10 years of experience.
workers with the same gender, race, education and experience. In terms of the regression framework this paper has been using, the growth in within-group inequality can be seen as a change in the dispersion of the residuals of the regression, with a wider dispersion of the residuals showing greater inequality within groups.
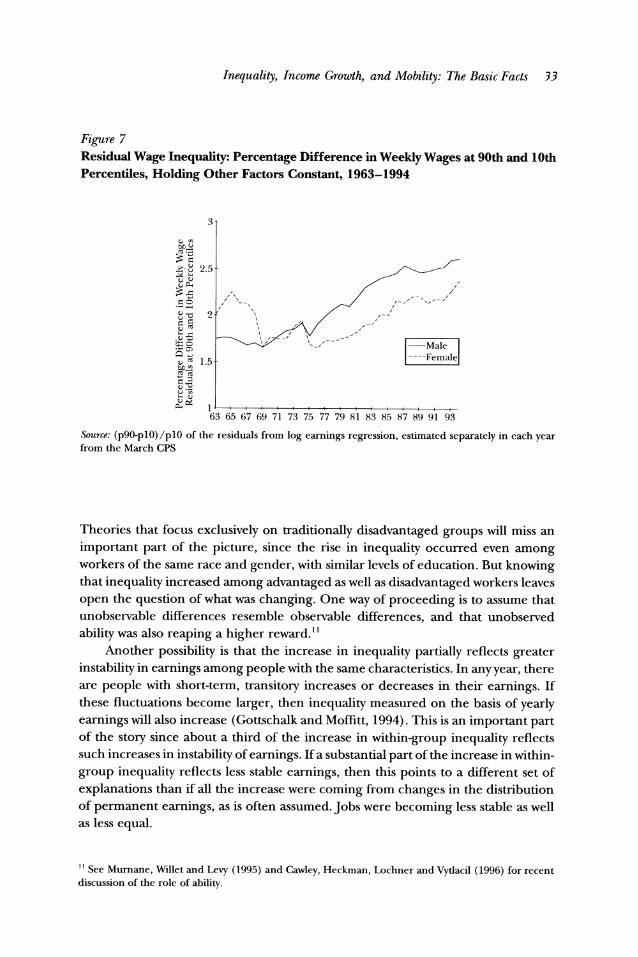
Figure 7 shows the change in within-group inequality, as measured by the re- sidual of the person of the 90th percentile compared to the one in the 10th per- centile. By this and other measures of within-group inequality, the increase is large.'" The overall change in the 90/10 differential among all males (shown in Figure 3), which includes both between-group differences and within-group differ- ences, was 38 percent between 1973 and 1994. More than half of the increase in earnings inequality occurred within groups using this measure. A standard decom- position of the variance of log weekly earnings (using the same data) shows that the increase in inequality within groups accounts for 50 percent of the total increase in inequality for men and 23 percent of the change for females.
The rise in inequality within groups of observationally similar workers poses a challenge for theories that try to explain the rise in overall earnings inequality.
"' The timing of the increase in withingroup inequality depends partially on the data used. The March CPS (used in this paper) shows within-group inequality rising throughout the 1970s. The May CPS data on usual hourly wage doesn't start increasing until the late 1970s and early 1980s.
Inequality, Income Growth, and Mobility: The Basic Facts 33
Figure 7 Residual Wage Inequality: Percentage Difference in Weekly Wages at 90th and 10th Percentiles, Holding Other Factors Constant, 1963-1994
Source: (p90-plO)/plO of the residuals from log earnings regression, estimated separately in each year from the March CPS
Theories that focus exclusively on traditionally disadvantaged groups will miss an important part of the picture, since the rise in inequality occurred even among workers of the same race and gender, with similar levels of education. But knowing that inequality increased among advantaged as well as disadvantaged workers leaves open the question of what was changing. One way of proceeding is to assume that unobservable differences resemble observable differences, and that unobserved ability was also reaping a higher reward."
Another possibility is that the increase in inequality partially reflects greater instability in earnings among people with the same characteristics. In any year, there are people with short-term, transitory increases or decreases in their earnings. If these fluctuations become larger, then inequality measured on the basis of yearly earnings will also increase (Gottschalk and Moffitt, 1994).This is an important part of the story since about a third of the increase in within-group inequality reflects such increases in instability of earnings. If a substantial part of the increase in within- group inequality reflects less stable earnings, then this points to a different set of explanations than if all the increase were coming from changes in the distribution of permanent earnings, as is often assumed. Jobs were becoming less stable as well as less equal.
See Murnane, Willet and L e y (1995) and Cawley, Heckman, Lochner and Vytlacil (1996) for recent discussion of the role of ability.

34 Journal of Economic Perspectives
Changes in Earnings and Income Inequality in Other OECD Countries
If the increase in earnings inequality was limited to the United States, then the search for causes should focus on factors specific to this country. If the increased inequality was widespread, such a pattern would suggest ubiquitous forces. The truth lies between these extremes."
While inequality increased in many other OECD countries over the last two decades, the United States does lie at one extreme. The only other country to experience as large an increase in earnings inequality is the United Kingdom, where income inequality rose quickly and continued well into the 1990s. How- ever, the U.K. increase started somewhat later than did the rise in the United States and was accompanied by a sufficiently large rise in mean earnings to result in a small increase in absolute earnings even at the bottom of the U.K. earnings distribution.
Other OECD countries can be divided into three broad groups according to the change in overall earnings inequality. The first group, which experienced s u b stantial increases in inequality, but less than the United States and the United King- dom, includes several Commonwealth countries-Canada, Australia, New Zea- land-and Israel. The second group experienced small but positive changes in inequality. This group includes the Nordic countries, the Netherlands, France, Italy and Japan. For several of these countries, the increases came in the late 1980s and 1990s, rather than in the mid-1970s as in the United States. The only country that seems to have avoided any increase in inequality during the 1970s, 1980s or 1990s is Germany.
When looking more deeply into the data, it appears that the United States has been the only country to experience increases in inequality both between education and experience groups and within groups. Other countries experienced increases in some of these dimensions, but not all. For example, the relatively small increase in inequality in the Netherlands reflects a decline in the college premium, which largely offset the substantial increase in inequality between experience groups and the increase in inequality within groups.
It is clear that the countries with the largest increases in inequality-the United States and United Kingdom-were also the countries with the most decentralized labor markets. Countries with more centralized wage-setting in- stitutions either escaped the trend toward greater inequality, like Germany, or experienced relatively mild increases, like Sweden and the Netherlands. This suggests that institutional constraints were at least partially responsible for the diversity of experiences across countries. Some countries with centralized labor markets, however, also experienced supply shifts that are consistent with the
l 2 See Freeman and Katz (1995), Gottschalk and Smeeding (1997) and OECD (1996) for further dis- cussion of these issues.
Peter Gottschalk 35
small increase in earnings inequality they experienced. For example, the large increase in the supply of college workers in the Netherlands is consistent with the large decline in their education premium. Thus, market forces of- fer a partial explanation for the lack of a sharp increase in wage inequal- ity in some of the countries with centralized wage-setting institutions. One of the key challenges is to sort out the relative importance of market and institutional factors in explaining the diversity of experiences across countries.
The United States clearly stands apart from all other countries, including the United Kingdom, when the focus shifts from trends in earnings inequality to household income inequality. The United States is the only country to have experienced a larger increase in the dispersion of family income than in earn- ings. Some other countries either could not or did not interfere directly in the labor market to prevent the increase in earnings inequality, but those that did experience an increase in earnings inequality then used the tax and transfer system to offset the changes in labor market outcomes. As a result, some coun- tries that experienced substantial increases in earnings inequality, such the United Kingdom and Canada, experienced only very moderate or no increase in family income inequality, once post-tax and transfer family income are taken into account.'"
Changes in the Distribution of Unemployment
Thus far, the focus has been on changes in the distribution of rewards to people who were working. Changes in labor markets, however, may also affect the distri- bution of employment. Did the same groups who were experiencing a decline in weekly wages when they worked also end up working fewer weeks per year? Did the distribution of unemployment or labor force participation also shift to those groups with lower wages?
Since discouraged workers may report being out of the labor force, it is better to focus on employment rates rather than on unemployment rates.I4 The patterns in employment rates by education and experience reflect similar declines in de- mand for the least skilled. Employment rates for male high school dropouts with more than 10 years experience declined from 78.5 percent in 1975 to 67.4 percent in 1994. In contrast, the employment rates of male college graduates with more than 10 years experience were roughly constant, and the rates for less experienced college graduates increased from 91.3 percent to 95.1 percent. Thus, the least
"'For alternative explanations of differences across countries, including the role of changes in the earn- ings of other household members and changes in unemployment, see Gottschalk and Smeeding (1997). l 4 The employment rate was tabulated by age and experience for the same sample of males used through- out this paper.

36 Journal of Economic Perspectives
skilled experienced both the largest declines in employment and in weekly wages when they did work.
Changes in Mobility
In the discussion to this point, I have been careful not to interpret any of the results as evidence that low earners in 1973 were the same people who had lower earnings 20 years later. After all, there is substantial mobility in earnings. A person in the bottom percentile in 1973 will not necessarily be in the same percentile in 1974, much less 20 years later. Based on the evidence from successive annual sur- veys, all that we know is that those people who were at the tenth percentile in 1973 had higher real earnings than the people who were at the tenth percentile 20 years later. To say more, it is necessary to use longitudinal data, which tracks the same people over time.
The University of Michigan's Panel Survey of Income Dynamics is such a data set, and Table 1 uses the PSID to document the extent of mobility. These data show that while earnings mobility is clearly evident, there is also substantial persistence. The table shows the probability that a person in a certain quintile in 1974 (the first year for which we have valid earnings data) was in a particular quintile in 1975 (top panel) and in 1991 (bottom panel) .'"f those in the lowest quintile in 1974, 68.7 percent were still in the lowest quintile one year later and fully 90.8 percent were in the two lowest quintiles.l"hus, while there is mobility out of the lowest quintile in one year, it is small and movement was not very far.
Mobility rates are naturally higher when persons have 17 years to climb out of the bottom of the distribution. But a substantial proportion still remain in the lowest quintile. Of those who started in the lowest quintile in 1974, 42.1 percent found themselves in the lowest quintile 17 years later. This degree of persistence is consistent with the well-documented finding that the transitory component of earnings dies off after roughly three years. Therefore, of those who experience a transitory increase in earnings in one year, many will tend to fall back a few years later. To put it another way, the probability of being out of the bottom quintile after 17 years is much lower than would be implied by a calculation that took the one-year transition rates and assumed that move- ment would occur independently for each of the next 17 years.17 Of those who
"The sample for the top panel consists of males 20 to 58 in 1974. The sample for the bottom panel is restricted to males 20 to 42, which insures that sample members are 59 or younger in 1991. I 0 Reported annual earnings includes measurement error, which tends to overstate the amount of in- equality and the amount of mobility. Averaging income over three years to reduce the measurement error reduces mobility out of the lowest quintile by about 10 percent. "If the probability of exiting in each period were (1-,687) and no one who exited from the lowest quintile returned, then the probability of remaining in the lowest quintile for 16 years would be ,687" instead of the observed ,421.

Inequality, Income Growth, and Mobility: The Basic Facts 37
Table 1 Earnings Mobility in the United States
One Year Mobility (1 974-1 975) I975 @intiles
1 2 3 4 5 Total
1 0.687 0.221 0.079 0.013 0.000 1.000
1974 Quintiles
2 3 4
0.215 0.065 0.033
0.491 0.236 0.049
0.222 0.497 0.159
0.069 0.176 0.584
0.003 0.026 0.175
1.000 1.000 1.000
5 0.000 0.005 0.040 0.158 0.798 1.000
Seuateen Year Mobility (1 974-1 991) 1991 Gintiles
I 2 3 4 5 Total 1 0.421 0.228 0.143 0.130 0.078 1.000
1974 Quintiles
2 3 4
0.287 0.147 0.097
0.360 0.206 0.120
0.193 0.321 0.242
0.092 0.205 0.324
0.067 0.120 0.217
1.000 1.000 1.000
5 0.031 0.073 0.102 0.254 0.539 1.000
Source: Author's tabulation of the PSID.
did exit the bottom quintile, most did not make large progress, with the largest group moving to the next quintile. Similarly, the probability of staying in the highest quintile was .539, with .793 staying in the two highest quin tiles.
Whether this mobility should be viewed as large or small depends on the ques- tion being asked. It is certainly high enough to make the point that people are not stuck at the bottom or the top of the earnings distribution; after all, most people's earnings increase as they gain labor market experience. Thus, one should be careful not to assume that those in a certain quintile in one year remained in that quintile the next year. However, mobility is too low to wash out the effects of yearly inequal- ity. Even when earnings are averaged over a 17-year period, inequality is only re- duced by roughly a third, as measured by the 90/10 ratio.'' Thus, even based on average earnings over 17 years, substantial inequality of "permanent" earnings would remain.'"
'' Based on author's tabulation of the 90/10 ratio based on 17-year average earnings, PSID. IqSince people with low permanent earnings are very likely to face borrowing constraints over this long a period, it is in no way obvious that this long an accounting period is more appropriate than a one-year accounting period. In fact, an accounting period shorter than a year might be most appropriate for people with very low earnings.

38 Journal of Economic Perspectives
Another basis on which to judge whether the United States has a lot or a little mobility is by comparisons with other industrialized countries for which we have longitudinal data. While the United States has substantially more in- equality than other OECD countries, it is not an outlier when it comes to mo- bility (Burkhauser, Holtz-Eakin and Rhody, forthcoming; OECD, 1996) ."' U.S. mobility rates resemble those of countries as different as France, Italy and Sweden. The fact that the United States has a more decentralized labor market than does the United Kingdom does not carry over into greater economic mo- bility. Likewise, the more centralized wage setting institutions in Germany and the Nordic countries do not translate into significantly less mobility in those countries than in the United States.
Of course, all countries have less inequality when a longer accounting period is used, and taking mobility into account reduces the amount of inequality when a multiple-year perspective is used. But since countries differ little in their amount of mobility, the rankings of countries in terms of inequality is not affected very much by such adjustments. From a perspective of multiple-year earnings, the United States and the United Kingdom remain the least equal, and the Nordic countries still have the most equal earnings distributions.
Thus far, the focus has been on the amount of mobility, not the trend in mobility. Even if the United States had a high level of mobility, this would reveal nothing about the trend in inequality of income measured over multiple periods. The existence of mobility reduces the level of inequality of income measured over multiple years. However, mobility reduces the trend toward greater inequal- ity only if mobility increases. If mobility were constant, then we would simply have two different measures of inequality: a one-year measure based on the evolving crosssection evidence and a permanent income measure based on multiple years. The amount of inequality will be lower, but both measures will display the same rising trend.
Has mobility increased? Measuring changes in mobility makes substantial demands on the data. Mobility itself can only be estimated with two or more years of data. Therefore, at a very minimum it takes three years of data to measure changes in mobility. Furthermore, one needs many years of data to estimate mobility patterns even in a world where mobility is not changing. The data requirements are further compounded when trying to measure changes in mobility. Only a few studies have looked at changes in earnings mobility. Some have found declines, most have found no change, and none has found any increase (Gottschalk and Moffitt, 1994; Buchinsky and Hunt, 1995). There- fore, taking mobility into account does nothing to reverse the trend toward greater inequality.
'LO The probability of changing quintiles is similar in the United States and in OECD countries for which we have data. However, since the United States has greater inequality, change between quintiles in the United States does require larger percentage changes in earnings.

Peter Gottschalk 39
Conclusion
There is little controversy over the basic facts presented here on how the dis- tribution of earnings and employment has shifted, although of course specific es- timates do vary somewhat. However, controversy does remain over the explanation of these patterns. Explanations for the change in inequality in the United States must be consistent with several facts. The relative price paid for more educated and more experienced workers clearly increased. The relative price of skill clearly rose at the same time that the relative skill intensity also increased. This implies an outward shift in the demand for skilled workers.
However, a story that focuses only on skilled workers would not be enough. The rise in the price of skill is a result of both an increase in the real wages paid to more skilled workers and also a sharp decline in the absolute real wages paid to less skilled workers. The increase in inequality, therefore, reflects an absolute as well as a relative decline in the earnings of less skilled workers. In fact, the decline in wages for less skilled workers canceled out the impact of the rising wages for more skilled worker, so little or no change in mean wages occurred.
Finally, appropriate explanations for the increase in earnings inequality should be applicable outside the U.S. borders. Among the industrialized nations, the rise in inequality was largest in the United States and the United Kingdom, but it was not limited to these two countries. While the Nordic and northern European countries experienced much smaller increases in earnings inequality, these countries seem to have been responding to the same under- lying forces.
References
Bosworth, Bany, and George L. Peny, "Pro- ner, and Edward Vytlacil, "Ability, Human C a p ductivity and Real Wages: Is There a Puzzle?," ital and Wages," working paper, University of Brookings Paper on Economic Activity, 1994, 1, 317- Chicago, September 1996. 35. Danziger, Sheldon, and Peter Gottschalk,
Buchinsky, Moshe, and Jennifer Hunt, "Wage America Unequal. Cambridge, Mass.: Harvard Uni- Mobility in the United States." NBER Working versity Press, 1995. Paper No. 5455, 1996. Freeman, Richard B., and Lawrence F. Katz,
Burkhauser, Richard V., Douglas Holtz-Eakin, eds., Dz;ffences and Changes in Wage Structures. and Stephen E. Rhody, "Mobility and Inequality Chicago: University of Chicago Press, 1995. in the 1980s: A Cross-National Comparison of the Goldin, Claudia, and Robert A. Margo, "The United States and Germany." ~ n ~ e n k i n s , Great Compression: The Wage Structure in the Ste-phen, Arie Kapteyn, and Bernard van Praag, eds., United States at Mid-Century," Quarterly Journal The Distribution of Welfare and Household Produc- ofEconomics, February 1992, 107, 1-34. tion: International Perspectives. Cambridge, Mass.: Gottschalk, Peter, and Robert Moffitt, "The Cambridge University Press, forthcoming. Growth of Earnings Instability in the U.S. Labor
Cawley, John, James Heckman, Lance Loch- Market," Brookings Papers on Economic Activity,

40 Journal of Economic Perspectiues
1994, 2, 217-72. Gottschalk, Peter, and Timothy M. Smeeding,
"Cross-National Comparisons of Earnings and Income Inequality," Journal ofEconomicLiterature, forthcoming, June 1997, 35.
Katz, Lawrence F., and Kevin M. Murphy, "Changes in Relative Wages, 1963-1987: Supply and Demand Factors," Quarterly Journal of Ec* nomics, February 1992, 107,35-78.
Levy, Frank, and Richard J. Murnane, "U.S. Earnings Levels and Earnings Inequality: A Re-view of Recent Trends and Proposed Explana-
tions," Journal of Economic Literature, September 1992, 30, 1333-81.
Mumane, Richard, John Willet, and Frank Levy, "The Growing Importance of Cognitive Skills in Wage Determination," Review ofEconom- ics and Statistics, 1995, 77:2, 251-66.
OECD, "Earnings Inequality, Low-Paid Em- ployment and Earnings Mobility," Employment Outlook,July 1996,59-108.
Shapiro, Matthew, and David Wdcox, "Mismea-suremint in the Consumer Price Index: An Evalu-ation." NBER Working Paper No. 5590, 1996.
You have printed the following article:
Inequality, Income Growth, and Mobility: The Basic FactsPeter GottschalkThe Journal of Economic Perspectives, Vol. 11, No. 2. (Spring, 1997), pp. 21-40.Stable URL:
http://links.jstor.org/sici?sici=0895-3309%28199721%2911%3A2%3C21%3AIIGAMT%3E2.0.CO%3B2-L
This article references the following linked citations. If you are trying to access articles from anoff-campus location, you may be required to first logon via your library web site to access JSTOR. Pleasevisit your library's website or contact a librarian to learn about options for remote access to JSTOR.
[Footnotes]
2 U.S. Earnings Levels and Earnings Inequality: A Review of Recent Trends and ProposedExplanationsFrank Levy; Richard J. MurnaneJournal of Economic Literature, Vol. 30, No. 3. (Sep., 1992), pp. 1333-1381.Stable URL:
http://links.jstor.org/sici?sici=0022-0515%28199209%2930%3A3%3C1333%3AUELAEI%3E2.0.CO%3B2-D
2 Cross-National Comparisons of Earnings and Income InequalityPeter Gottschalk; Timothy M. SmeedingJournal of Economic Literature, Vol. 35, No. 2. (Jun., 1997), pp. 633-687.Stable URL:
http://links.jstor.org/sici?sici=0022-0515%28199706%2935%3A2%3C633%3ACCOEAI%3E2.0.CO%3B2-G
4 Changes in Relative Wages, 1963-1987: Supply and Demand FactorsLawrence F. Katz; Kevin M. MurphyThe Quarterly Journal of Economics, Vol. 107, No. 1. (Feb., 1992), pp. 35-78.Stable URL:
http://links.jstor.org/sici?sici=0033-5533%28199202%29107%3A1%3C35%3ACIRW1S%3E2.0.CO%3B2-O
11 The Growing Importance of Cognitive Skills in Wage DeterminationRichard J. Murnane; John B. Willett; Frank LevyThe Review of Economics and Statistics, Vol. 77, No. 2. (May, 1995), pp. 251-266.Stable URL:
http://links.jstor.org/sici?sici=0034-6535%28199505%2977%3A2%3C251%3ATGIOCS%3E2.0.CO%3B2-6
http://www.jstor.org
LINKED CITATIONS- Page 1 of 3 -
NOTE: The reference numbering from the original has been maintained in this citation list.

12 Cross-National Comparisons of Earnings and Income InequalityPeter Gottschalk; Timothy M. SmeedingJournal of Economic Literature, Vol. 35, No. 2. (Jun., 1997), pp. 633-687.Stable URL:
http://links.jstor.org/sici?sici=0022-0515%28199706%2935%3A2%3C633%3ACCOEAI%3E2.0.CO%3B2-G
13 Cross-National Comparisons of Earnings and Income InequalityPeter Gottschalk; Timothy M. SmeedingJournal of Economic Literature, Vol. 35, No. 2. (Jun., 1997), pp. 633-687.Stable URL:
http://links.jstor.org/sici?sici=0022-0515%28199706%2935%3A2%3C633%3ACCOEAI%3E2.0.CO%3B2-G
References
The Great Compression: The Wage Structure in the United States at Mid- CenturyClaudia Goldin; Robert A. MargoThe Quarterly Journal of Economics, Vol. 107, No. 1. (Feb., 1992), pp. 1-34.Stable URL:
http://links.jstor.org/sici?sici=0033-5533%28199202%29107%3A1%3C1%3ATGCTWS%3E2.0.CO%3B2-C
The Growth of Earnings Instability in the U.S. Labor MarketPeter Gottschalk; Robert Moffitt; Lawrence F. Katz; William T. DickensBrookings Papers on Economic Activity, Vol. 1994, No. 2. (1994), pp. 217-272.Stable URL:
http://links.jstor.org/sici?sici=0007-2303%281994%291994%3A2%3C217%3ATGOEII%3E2.0.CO%3B2-8
Cross-National Comparisons of Earnings and Income InequalityPeter Gottschalk; Timothy M. SmeedingJournal of Economic Literature, Vol. 35, No. 2. (Jun., 1997), pp. 633-687.Stable URL:
http://links.jstor.org/sici?sici=0022-0515%28199706%2935%3A2%3C633%3ACCOEAI%3E2.0.CO%3B2-G
http://www.jstor.org
LINKED CITATIONS- Page 2 of 3 -
NOTE: The reference numbering from the original has been maintained in this citation list.

Changes in Relative Wages, 1963-1987: Supply and Demand FactorsLawrence F. Katz; Kevin M. MurphyThe Quarterly Journal of Economics, Vol. 107, No. 1. (Feb., 1992), pp. 35-78.Stable URL:
http://links.jstor.org/sici?sici=0033-5533%28199202%29107%3A1%3C35%3ACIRW1S%3E2.0.CO%3B2-O
U.S. Earnings Levels and Earnings Inequality: A Review of Recent Trends and ProposedExplanationsFrank Levy; Richard J. MurnaneJournal of Economic Literature, Vol. 30, No. 3. (Sep., 1992), pp. 1333-1381.Stable URL:
http://links.jstor.org/sici?sici=0022-0515%28199209%2930%3A3%3C1333%3AUELAEI%3E2.0.CO%3B2-D
The Growing Importance of Cognitive Skills in Wage DeterminationRichard J. Murnane; John B. Willett; Frank LevyThe Review of Economics and Statistics, Vol. 77, No. 2. (May, 1995), pp. 251-266.Stable URL:
http://links.jstor.org/sici?sici=0034-6535%28199505%2977%3A2%3C251%3ATGIOCS%3E2.0.CO%3B2-6
http://www.jstor.org
LINKED CITATIONS- Page 3 of 3 -
NOTE: The reference numbering from the original has been maintained in this citation list.