Inequality in EU Crisis Countries: Identifying the Impact...
15
1 Inequality in EU Crisis Countries: Identifying the Impact of Automatic Stabilisers and Discretionary Policy 1 Tim Callan, Karina Doorley, Michael Savage 2 Economic and Social Research Institute (ESRI) Preliminary draft. Please do not cite or distribute. This version: May 2017 Abstract The advent of the Great Recession and the widespread adoption of fiscal austerity policies have heightened concern about inequality and its effects. We examine how the distribution of income in the EU countries which were hardest hit during the Great Recession evolved between 2007 and 2013. Using a recently developed framework (Savage et al., 2017, which extends the approach of Bargain and Callan, 2010) the overall change in the Gini coefficient is decomposed into parts attributable to the change in market income inequality, automatic stabilisation effects, and changes in discretionary policy. We implement this approach using the microsimulation software, EUROMOD, linked to EU-SILC survey data, to produce the relevant counterfactual ("no reform") scenarios. Automatic stabilisation effects are found to play an important role in reducing inequality in all of the crisis countries. During the Great Recession, discretionary policy changes –relative to a neutral, indexed policy – also contributed to reductions in the Gini coefficients for disposable income, but to a much lesser extent than the automatic stabilisation effects. Keywords: Inequality, Decomposition, Great Recession, Discretionary Policy, Automatic Stabilisation JEL Subject Codes: H24, D31, D63 1 The results presented here are based on EUROMOD version G4.0+. EUROMOD is maintained, developed and managed by the Institute for Social and Economic Research (ISER) at the University of Essex, in collaboration with national teams from the EU member states. We are indebted to the many people who have contributed to the development of EUROMOD. The process of extending and updating EUROMOD is financially supported by the European Union Programme for Employment and Social Innovation ‘Easi’ (2014 -2020). The results and their interpretation are the authors’ responsibility. 2 Callan, Doorley and Savage are affiliated to the Economic and Social Research Institute (ESRI) and Trinity College Dublin (TCD). Callan and Doorley are also affiliated to the Institute of Labor Economics (IZA). Corresponding author: Michael Savage, [email protected]
Transcript of Inequality in EU Crisis Countries: Identifying the Impact...

1
Inequality in EU Crisis Countries:
Identifying the Impact of Automatic Stabilisers and Discretionary Policy1
Tim Callan, Karina Doorley, Michael Savage2
Economic and Social Research Institute (ESRI)
Preliminary draft. Please do not cite or distribute.
This version: May 2017
Abstract
The advent of the Great Recession and the widespread adoption of fiscal austerity policies have heightened concern about inequality and its effects. We examine how the distribution of income in the EU countries which were hardest hit during the Great Recession evolved between 2007 and 2013. Using a recently developed framework (Savage et al., 2017, which extends the approach of Bargain and Callan, 2010) the overall change in the Gini coefficient is decomposed into parts attributable to the change in market income inequality, automatic stabilisation effects, and changes in discretionary policy. We implement this approach using the microsimulation software, EUROMOD, linked to EU-SILC survey data, to produce the relevant counterfactual ("no reform") scenarios. Automatic stabilisation effects are found to play an important role in reducing inequality in all of the crisis countries. During the Great Recession, discretionary policy changes –relative to a neutral, indexed policy – also contributed to reductions in the Gini coefficients for disposable income, but to a much lesser extent than the automatic stabilisation effects.
Keywords:
Inequality, Decomposition, Great Recession, Discretionary Policy, Automatic Stabilisation
JEL Subject Codes:
H24, D31, D63
1 The results presented here are based on EUROMOD version G4.0+. EUROMOD is maintained, developed and
managed by the Institute for Social and Economic Research (ISER) at the University of Essex, in collaboration
with national teams from the EU member states. We are indebted to the many people who have contributed to
the development of EUROMOD. The process of extending and updating EUROMOD is financially supported
by the European Union Programme for Employment and Social Innovation ‘Easi’ (2014-2020). The results and
their interpretation are the authors’ responsibility. 2 Callan, Doorley and Savage are affiliated to the Economic and Social Research Institute (ESRI) and Trinity
College Dublin (TCD). Callan and Doorley are also affiliated to the Institute of Labor Economics (IZA).
Corresponding author: Michael Savage, [email protected]

2
1. Introduction
Income inequality has been rising in most, thought not all, OECD countries since well before the
onset of the Great Recession. With the advent of the Great Recession and the widespread
subsequent adoption of fiscal austerity policies, concern has heightened about inequality and its
effects not only on social outcomes but also in potentially undermining growth in the medium to
longer-term. Against that background, it is now important to look beyond the initial impact of the
Great Recession to explore how income inequality has evolved as policy has responded to the
challenges posed by the crisis, both in terms of the specifics of how tax and welfare systems have
been changed and the adoption, to a greater or lesser extent, of macro-fiscal austerity policies to
cope with ballooning fiscal deficits. This has been most stark in the four European countries that
were unable to continue to finance their debt in the financial markets after the financial crash and
had to avail of formal ‘bail-out’ arrangements with the European Union and IMF, namely Ireland,
Portugal, Greece and Cyprus. Spain was also particularly hard-hit and had to receive assistance from
the European Stability Mechanism in recapitalising its banks. The experience of these countries has
been very varied. Greece at one end of the spectrum remains in crisis mode. Ireland at the other end
of the spectrum has successfully completed a stringent bail-out programme, with growth now
returned, and the fiscal deficit having come down to the point where debt can be financed at very
low interest rates.
The distributional impact of tax-transfer systems can change due to explicit discretionary changes in
tax-benefit policies (e.g., higher tax rates or lower welfare payment rates). The distributional impact
may also be substantially affected by changes in the underlying population and distribution of
income (e.g., a higher proportion of pensioners, or increased unemployment)3. Dolls et al. (2012,
2017) concentrate on this latter component, and examine the degree of “automatic stabilisation” of
aggregate income inherent in the systems of EU countries and the US, under either an income or an
unemployment shock. Their focus is therefore on the redistributive properties of a given tax-transfer
system on alternative distributions of market income. A separate literature, initiated by Bargain and
Callan (2010) and followed up by Bargain et al (2017) and Paulus and Tasseva (2017) among others,
focuses on identifying, for a given population and income distribution, the impact of discretionary
changes in tax-transfer policy on measures of income inequality and poverty. In their approach
“automatic” responses of existing policies to income or unemployment shocks are not separately
identified but included with other factors, such as changes in unemployment or the distribution of
market incomes. In this paper we apply an approach which draws on both of these perspectives to
identify the impact of tax and benefit policy on the Gini coefficient changes over time in a selection
of EU countries, and the breakdown of this change between discretionary and automatic
components.
We apply a technique, developed by Savage et al. (2017), which extends the approach of Bargain
and Callan (2010) to decompose the change in inequality during the Great Recession into
components attributable to changes in market income, changes in discretionary policy, and the
automatic stabilisation properties of the pre-existing tax-transfer systems. We study a selection of
EU countries who were hard hit by the Great Recession: Cyprus, Portugal, Ireland, Greece and Spain.
We use EU-SILC data on incomes and the EUROMOD tax-benefit model to construct appropriate

3
counterfactuals for the decomposition. Our results give a better understanding of how changes in
inequality were generated in a number of European countries.
This paper makes a number a significant contributions to the literature on the impact of the Great
Recession and austerity policies. We contribute new evidence on how income distributions changed
in a selection of countries most severely affected by the Great Recession. Our methodology is novel
in that it allows us to disentangle discretionary policy effects from automatic stabilisation in an ex
post context, allowing us to comment on how existing tax-benefit systems as well as new fiscal
policies helped to cushion the impact of the Great Recession in the five EU countries which were
hardest hit by the Great Recession.
A previous application of this method (Savage et al., 2017), examined how the Gini coefficient in
Ireland – a country which experienced one of the most severe economic contractions during the
Great Recession – evolved over the years 2008 to 2013. Analysis of the income distribution showed
broad stability in the Gini coefficient, largely due to a strong increase in the extent of redistribution
through taxes and transfers. Results from a decomposition exercise suggested that over three-
quarters of the inequality reduction was due to automatic stabilisation effects, and just under a
quarter due to changes in discretionary policy.
2. Data and Method
2.1 Microsimulation and Data
We use the tax-benefit microsimulation software, EUROMOD, linked to household surveys to
simulate disposable income distributions and inequality indices for a base year at the onset of the
crisis (2007) and for an end year for which microsimulation models (with the relevant data) are
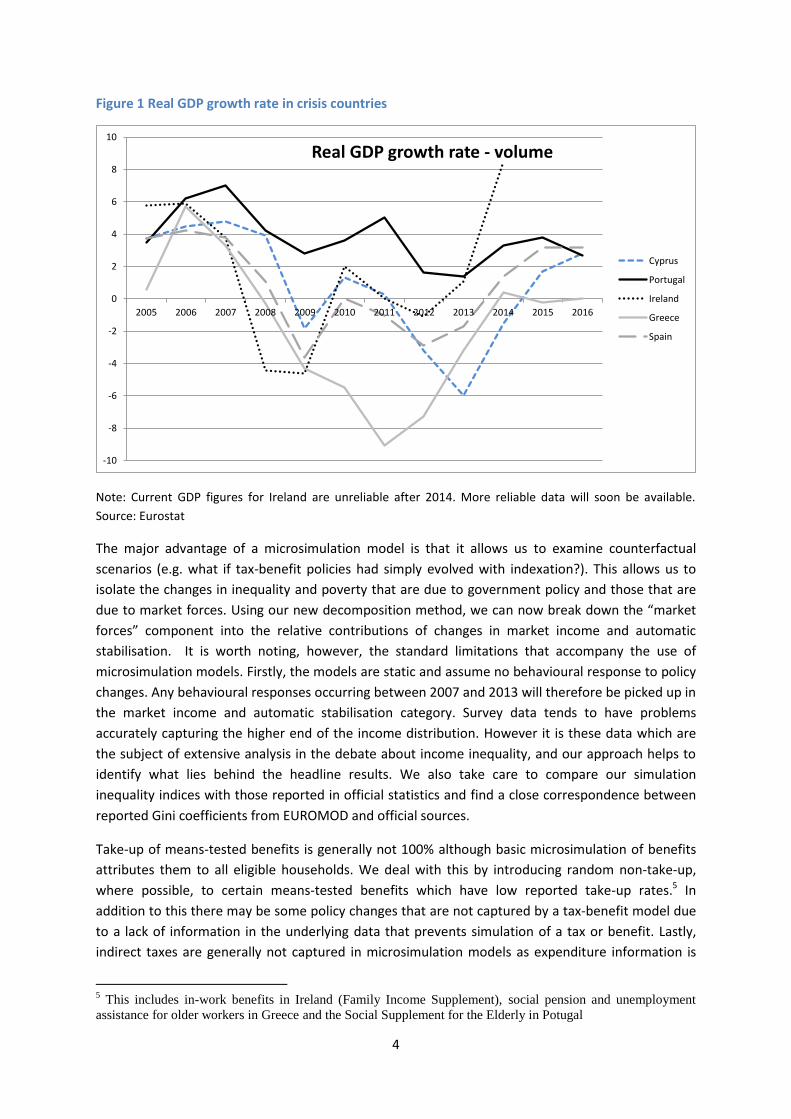
available (usually 2013). Figure 1 shows that this period encompases all periods of negative GDP
growth in the countries concerned (except for Cyprus, which registered slightly negative GDP growth
in 2014). We also simulate some counterfactual scenarios, described below. EUROMOD numerically
simulates tax-benefit rules, allowing the computation of all social contributions, direct taxes and
transfers to yield household disposable income. It is linked to the EU-SILC data for years 2008 (2007
incomes) and 2014 (2013 incomes).4 One exception is Ireland, for which 2014 data is not yet
available in EUROMOD. Therefore, our end year in the Irish case is 2011 which is simulated using
2011 policies linked to 2012 data (2011 incomes). However, we are able to complement the
EUROMOD-based analysis for Ireland of 2007-2011 with an analysis of 2008 to 2013, based on the
national microsimulation model SWITCH (See Savage et al. 2017).
4 Started in 2003 for 6 member states (Belgium, Denmark, Greece, Ireland, Luxemburg and Austria), as well as
Norway, EU-SILC has been extended to other EU countries in 2004-2005, followed by Bulgaria, Romania,
Turkey and Swizerland from 2007. It gathers annual cross-sectional information on European individuals and
households (incomes, socio-demographics, social exclusion, life condition). It was originally created to provide
the material for structural indices of social cohesion in Europe (Laeken indices). EU-SILC (statistics on income
and life conditions) constitute the most recent and important source of microdata for comparative studies on
income distribution in Europe.
4
Figure 1 Real GDP growth rate in crisis countries
Note: Current GDP figures for Ireland are unreliable after 2014. More reliable data will soon be available.
Source: Eurostat
The major advantage of a microsimulation model is that it allows us to examine counterfactual
scenarios (e.g. what if tax-benefit policies had simply evolved with indexation?). This allows us to
isolate the changes in inequality and poverty that are due to government policy and those that are
due to market forces. Using our new decomposition method, we can now break down the “market
forces” component into the relative contributions of changes in market income and automatic
stabilisation. It is worth noting, however, the standard limitations that accompany the use of
microsimulation models. Firstly, the models are static and assume no behavioural response to policy
changes. Any behavioural responses occurring between 2007 and 2013 will therefore be picked up in
the market income and automatic stabilisation category. Survey data tends to have problems
accurately capturing the higher end of the income distribution. However it is these data which are
the subject of extensive analysis in the debate about income inequality, and our approach helps to
identify what lies behind the headline results. We also take care to compare our simulation
inequality indices with those reported in official statistics and find a close correspondence between
reported Gini coefficients from EUROMOD and official sources.
Take-up of means-tested benefits is generally not 100% although basic microsimulation of benefits
attributes them to all eligible households. We deal with this by introducing random non-take-up,
where possible, to certain means-tested benefits which have low reported take-up rates.5 In
addition to this there may be some policy changes that are not captured by a tax-benefit model due
to a lack of information in the underlying data that prevents simulation of a tax or benefit. Lastly,
indirect taxes are generally not captured in microsimulation models as expenditure information is
5 This includes in-work benefits in Ireland (Family Income Supplement), social pension and unemployment
assistance for older workers in Greece and the Social Supplement for the Elderly in Potugal
-10
-8
-6
-4
-2
0
2
4
6
8
10
2005 2006 2007 2008 2009 2010 2011 2012 2013 2014 2015 2016
Real GDP growth rate - volume
Cyprus
Portugal
Ireland
Greece
Spain

5
often not present in the income surveys used to build a database for the tax-benefit model. See
Pestel and Sommer (2016), Decoster et al. (2014), and Savage (2017) for analysis based on
imputation of expenditure data into a tax-benefit microsimulation database.
2.2 Decomposition Method
In this section, we outline the methods used to decompose the change in the inequality index into a
market income effect, an automatic stabilisation effect, and a discretionary policy effect. We also
show how the methods used here relate to the decomposition proposed by Bargain-Callan (2010),
BC hereafter.
We start by defining the change in the Gini coefficient6 based on disposable income7, as the change
in the Gini based on market incomes, 𝐺(𝑀1) − 𝐺(𝑀0), minus the change in the Reynolds-
Smolensky (RS) index, 𝑅1 − 𝑅0.8 This starting point makes clear that the change in G(D) over any
time period is determined by the degree to which any change in the distribution of market incomes
is offset by a change in the amount of redistribution done by the tax-benefit system. It is the second
component of the equation that we are particularly interested in. 𝑅1 − 𝑅0 is a combination of the
impact of automatic stabilisation and the impact of discretionary changes to the tax-benefit system.
𝐺(𝐷1) − 𝐺(𝐷0) = 𝐺(𝑀1) − 𝐺(𝑀0) − [𝑅1 − 𝑅0] (1)
= [𝐺(𝑀1) − 𝐺(𝑀0)] − [[𝐺(𝑀1) − 𝐺(𝐷1)] − [𝐺(𝑀0 ) − 𝐺(𝐷0)]]
Using notation common with BC, we can define G(D) as the product of a tax-benefit function d(.),
which transforms market incomes M into disposable incomes D, based on monetary tax-benefit
paramters p (benefit payments, tax thresholds etc.).
We can therefore define the change in the G(D), as:
∆𝐺(𝐷) = [𝐺(𝑀1) − 𝐺(𝑀0)] − [𝐺(𝑀1) − 𝐺(𝑑1(𝑝1, 𝑀1)) − {𝐺(𝑀0) − 𝐺(𝑑0(𝑝0, 𝑀0))}] (2)
To isolate the impact of the discretionary changes in tax-benefit policy from the impact of automatic
stabilisation, we introduce a Gini based on a counterfactual distribution of income 𝐺 (𝑑0(𝛼, 𝑝0, 𝑀1)).
This index summarises income inequality in a distribution of disposable incomes calculated using
end-year market incomes transformed into disposable incomes under the start-year tax-benefit
6 The decomposition can be applied to any inequality index defined over the full range of incomes. For clarity,
in this section we discuss the decomposition applied to the Gini index, one of the most commonly used indices
of income inequality. 7 Equivalised household disposable income, where the OECD equivalence scale is used to equivalise incomes (1
for the first adult, 0.7 for subsequent adults, 0.5 for children). 8 The RS index is simply defined as the difference between the Gini based on market incomes and the Gini
based on disposable incomes. It is therefore a measure of how much redistribution is done by the tax-benefit
system in a given year.

6
system, where the parameter 𝛼 indexes monetary tax-benefit parameters 𝑝0 to common end year
values9. In other words, 𝑑0(𝛼, 𝑝0, 𝑀1) is the distribution of disposable incomes in the end-year if the
only changes made to the tax-benefit system throughout the period of analysis was to index
parameters in line with the chosen indexation factor.
To equation (2) we add and subtract [𝐺(𝑀1) − 𝐺(𝑑0(𝛼, 𝑝0, 𝑀1))], giving:
∆𝐺(𝐷) = [𝐺(𝑀1) − 𝐺(𝑀0)] − [𝐺(𝑀1) − 𝐺(𝑑1(𝑝1, 𝑀1)) − {𝐺(𝑀0) − 𝐺(𝑑0(𝑝0, 𝑀0))}] +
[𝐺(𝑀1) − 𝐺(𝑑0(𝛼, 𝑝0, 𝑀1))] − [𝐺(𝑀1) − 𝐺(𝑑0(𝛼, 𝑝0, 𝑀1))] (3)
The comparison with the BC decomposition can be made clear at this point. Rearranging terms in
equation (3), and cancelling all G(Mt) gives us the BC decomposition. With all G(Yt) cancelled, market
income changes are captured in what BC term the “other” effect:
𝐺(𝐷1) − 𝐺(𝐷0) =
𝐺(𝑑1(𝑝1, 𝑀1)) − 𝐺(𝑑0(𝛼, 𝑝0, 𝑀1)) (4a) “policy” effect10
+ 𝐺(𝑑0(𝛼, 𝑝0, 𝑀1)) − 𝐺(𝑑0(𝑝0, 𝑀0)) (4b) “other” effect
However, by rearranging equation (3) as follows, we can decompose the overall impact of the tax-
benefit system into the impact of the change in the distribution of market income (equation 5a), the
impact of discretionary changes to tax-benefit policies (equation 5b), and the impact of automatic
stabilistaion (equation 5c):
𝐺(𝐷1) − 𝐺(𝐷0) =
[𝐺(𝑀1) − 𝐺(𝑀0)] (5a) Market income effect
− [𝐺(𝑀1) − 𝐺(𝑑1(𝑝1
, 𝑀1)) − 𝐺(𝑀1) + 𝐺 (𝑑0(𝛼, 𝑝0, 𝑀1)) (5b) Discretionary policy
+ [𝐺(𝑀1) − 𝐺 (𝑑0(𝛼, 𝑝0, 𝑀1)) − 𝐺(𝑀0) + 𝐺 (𝑑0(𝑝
0, 𝑀0))] (5c) Auto Stabilisation
These expressions can be simplified by moving to the use of notation based on the fact that the
Reynolds Smolensky index ( R ) is simply the difference between G(Mt) and G(Dt):
𝐺(𝐷1) − 𝐺(𝐷0) =
[𝐺(𝑀1) − 𝐺(𝑀0)] (6a) Market income effect
−[ 𝑅[𝑀1, 𝑑1(𝑝1, 𝑀1)] − 𝑅[𝑀1, 𝑑𝑜(𝛼, 𝑝𝑜, 𝑀1)] (6b) Discretionary policy
+𝑅[𝑀1, 𝑑𝑜(𝛼, 𝑝𝑜, 𝑀1)] − 𝑅[𝑀0, 𝑑𝑜(𝑝𝑜, 𝑀0)]} ] (6c) Auto Stabilisation
9 See discussion below for choices on the value of 𝛼.
10 What BC define as the “policy” effect captures only the impact of discretionary policy changes.

7
The discretionary policy effect above is estimated on final year data. Equally, this effect can also be
estimated based on initial-year data, giving the decomposition:
𝐺(𝐷1) − 𝐺(𝐷0) =
[𝐺(𝑀1) − 𝐺(𝑀0)] (7a) Market income effect
−[ 𝑅[𝑀1, 𝑑1(𝑝1, 𝑀1)] − 𝑅[𝛼𝑀0, 𝑑1(𝑝1, 𝛼𝑀0)] (7b) Auto Stabilisation
+𝑅[𝛼𝑀0, 𝑑1(𝑝1, 𝛼𝑀0)] − 𝑅[𝑀0, 𝑑𝑜(𝑝𝑜, 𝑀0)]} ] (7c) Discretionary policy
Results of the decomposition are shown for both initial-year and end-year data, as well as a Shapley
value, which is simply the average of the two.
In this analysis, we allow 𝛼, the indexation parameter, to take three possible values. The first is the
change in average market income between the base and end periods, i.e. it measures each
component against a scenario where tax-benefit policy parameters are indexed in line with
developments in market income. The second is wage growth, i.e., we index policy parameters in line
with average annual wage growth. The third is CPI whereby tax-benefit policies are assumed to
evolve in line with the consumer price index. These approaches allow us to account for three
different types of indexation, which seem most relevant to make tax-benefit policy parameters in
monetary units comparable over time. (These are also the most common indexation types used by
governments in practice.) The relevant figures for each indexation assumption are displayed in Table
1. CPI and wage growth are generally positive and well aligned (except for Greece where CPI grew by
14% but wages declined by 22%). Market income growth, by contrast, has been negative in every
country except for Spain where market income registered no growth over the period concerned. In
what follows, we present results using the wage growth indexing assumption. However, despite the
divergence across the three measures, results are not sensitive to this parameter.
Table 1 Measures of price and income growth between 2007 and 2013 (2011 for Ireland)
Market income
growth CPI Wage growth
Greece -37% 14% -11%
Spain 0% 14% 17%
Ireland -9% 1% 5%
Portugal -10% 10% 6%
Cyprus -14% 15% 9%
Market income growth is calculated using EU-SILC data for the base
(2007) and end (2011/2013) periods. CPI figures come from Eurostat.
Annual wage growth statistics come from the OECD (except for Cyprus, for
which it is calculated using EU-SILC data for the base and end periods)

8
3 The Evolution of Income Inequality over the Great Recession
This section outlines the changes in inequality observed in our selection of countries during the
Great Recession. We look at the change in the market income Gini coefficient and the change in the
disposable income Gini coefficient to gauge the extent of changes in inequality in market income
and in take-home income. We then look at how the Reynolds-Smolensky index, which measures the
reduction in the Gini coefficient brought about by the tax and transfer system, has evolved over the
Great Recession. This gives us an indication of whether tax-benefit systems are engaging in more or
less redistribution since the beginning of the crisis. More detailed indices are reported in the
Appendix.
Figure 2 The evolution of the Gini coefficient of market income in EU crisis countries
Note: OECD figures compared to own calculations from base year income data (2007 for all countries) and end
year income data (2013 for all countries except Ireland, for which the end year is 2011). Official statistics on
the market income Gini for Cyprus are not available from the OECD.
Figure 2 shows how the market income Gini has evolved between 2007 and 2013. Simulated
changes in EUROMOD are compared to those reported in official OECD statistics. Without exception,
this index has increased in all of the countries studied, indicating that inequality in market income
increased substantially in the countries studied over the period in question. The largest increases are
recorded in Cyprus and Spain, where the market income Gini increased by around 8 points. This
increase is followed closely by Greece (recording an increase of 6 points) and then by Ireland and
Portugal (around a 4 point increase). In all cases, our simulated changes to the market income Gini
are similar to official OECD records.
0.00
0.01
0.02
0.03
0.04
0.05
0.06
0.07
0.08
0.09
Cyprus Ireland Portugal Greece Spain
Ch
ange
in G
ini
Change in Market Income Gini 2007-2013
Euromod
OECD
N/A

9
Figure 3 shows how the disposable income Gini coefficient has evolved over the period in question
in Portugal, Ireland, Greece, Spain and Cyprus. Simulated changes in EUROMOD are compared to
those reported in official Eurostat statistics. Similar to the case of market income inequality, we find
that the largest increases in disposable income inequality over the Great Recession are to be found
in Cyprus and Spain. The Gini coefficient increases by 2-3 points in these countries. Greece also
suffered an increase in disposable income inequality with the Gini coefficient increasing by 1.5
points between 2007 and 2011. Income inequality in Ireland was stable over the period examined
while income inequality in Portugal decreased, as evidenced by the 1 point decrease in the Gini
coefficient.
Figure 3 The evolution of the Gini coefficient of disposable income in EU crisis countries
Note: Eurostat figures compared to own calculations from base year EUROMOD policies and income data
(2007 for all countries) and end year EUROMOD policies and income data (2013 for all countries except
Ireland, for which the end year is 2011).
Finally, Figure 4 shows how the Reynolds-Smolensky index changed between the beginning and the
end of the Great Recession. Recall that the Reynolds-Smolensky index measures the redistributive
effect of the tax-benefit system. An increase in this index indicates that the tax-benefit system is
redistributing more. This is, indeed, what we find in each of the countries studied. By the end of the
Great Recession, each country’s tax-benefit system was engaged in more redistribution than at the
beginning. The largest increase is observed in Portugal, where the Reynolds-Smolensky index
increased by 6 points. At the other end of the spectrum is Cyprus which registers an increase of just
1 point.
-0.03
-0.02
-0.01
0.00
0.01
0.02
0.03
0.04
0.05
0.06
0.07
0.08
Portugal Ireland Greece Spain Cyprus
Ch
ange
in G
ini
Change in Disposable Income Gini 2007-2013
Euromod
Eurostat

10
Figure 4 The evolution of the Reynolds-Smolensky index in EU crisis countries
Note: Eurostat/OECD figures compared to own calculations from base year EUROMOD policies and income
data (2007 for all countries) and end year EUROMOD policies and income data (2013 for all countries except
Ireland, for which the end year is 2011).
4 The Role of market income, discretionary policy and automatic stabilisation
Cyprus, Portugal, Ireland, Greece and Spain all experienced a significant rise in market income
inequality during the Great Recession. However, while Spain and Cyprus also registered large
increases in disposable income inequality, Greece, Ireland and Portugal experienced relatively stable
or falling disposable income inequality. Clearly, the tax-benefit systems of the latter countries were
more effective in cushioning the effects of rising market inequality during the Great Recession. The
question of whether this was due to the automatic stabilisation capacities of these systems or due to
discretionary policies implemented over the course of the Great Recession is tackled in this section.
The distributional impact of tax-transfer systems can change due to explicit discretionary changes in
tax-benefit policies (e.g., higher tax rates or lower welfare payment rates). But the distributional
impact may also be substantially affected by how the tax-benefit system responds to changes in the
underlying population and distribution of income (e.g., an increased expenditure on state transfers
due to a higher proportion of pensioners, or increased unemployment)11. We use the decomposition
11
This has long been recognised in the literature on tax progressivity; see, for example, Lambert and Thoresen
(2009).
0.00
0.01
0.02
0.03
0.04
0.05
0.06
0.07
CY ES IE EL PT
Ch
ange
in G
ini
Change in Reynolds-Smolensky 2007-2013
Euromod
Eurostat/OECD statistics
N/A

11
elaborated in Section 2 to decompose the change in disposable income inequality (measured by the
Gini coefficient) intro the relative contributions of market income changes, discretionary policy
changes and automatic stabilisation. Results are displayed in Figure 5. Immediately evident is the
fact that changes in market income account for a large proportion of the change in inequality
observed over the Great Recession. This is particularly true in Spain and Cyprus. In all countries,
changes in market income increase inequality. Turning next to discretionary policy, we find that it
was inequality reducing in all countries except Greece, where it has no discernible effect on
inequality. Each country in our sample implemented discretionary policies which counteracted some
of the increased market income inequality. The effect ranges from a 2 point decrease in the Gini in
Portugal to a negligible effect in Greece.
Looking next at automatic stabilisation, we find that this aspect of the tax-benefit system made a
more substantial contribution to decreasing inequality in Greece, Portugal, Ireland and Spain. to the
In each case, the effect of automatic stabilisation is larger than that of discretionary policy and, in
some countries, its magnitude is comparable to that of market income changes. The Irish results
presented here (which are for 2007-2011) mirror closely those in Savage et al. (2017), which show
that 75-80 per cent of the overall increase in inequality reduction attributable to the tax-benefit
system was due ot the automatic stabilisation componenet. For Cyprus, the automatic stabilisation
effect is small, despite the very large rise in market income inequality, suggesting that there may be
distinctive features of the Cypriot tax/transfer system which merit further investigation. Comparing
Figure 5 to Figure 3, we notice that the countries in which disposable income inequality changed
little over the course of the crisis are those in which automatic stabilisation played the largest role in
cushioning the disposable income distribution. This highlights the importance of the automatic
stabilisation properties of tax-benefit systems in these countries in alleviating market income
shocks. It is noteworthy that this finding applies both to countries which have been characterised as
having a distinctive Southern European variant of the welfare state, and to Ireland, which is often
seen as closer to the liberal model of the UK.

12
Figure 5 Decomposition of the change in the Gini coefficient of disposable income over the crisis period
Note: Own calculations from base year EUROMOD policies and income data (2007 for all countries) and end
year EUROMOD policies and income data (2013 for all countries except Ireland, for which the end year is
2011).
5 Conclusions
The impact of the Great Recession and associated austerity policies on poverty and inequality in
OECD countries is of central interest, not least in light of the political turmoil and rise of populism to
which it may be contributing. Much of the emphasis in research and debate about inequality and
fiscal adjustment focuses on discretionary changes in tax and transfer system parameters, explored
via tax-benefit simulation models. However, the ‘automatic’ stabiliser effects as the tax and transfer
systems respond to changes in household incomes and employment levels also play a central role.
Applying a new approach developed by Savage et al. (2017), we show that automatic stabilisation
played a large role in shaping income distributions over the course of the Great Recession. Results
for Greece, Portugal and Ireland suggest that automatic stabilisation almost completely
counteracted the increased inequality brought about by market income changes. The existing tax-
benefit systems in Spain and Cyprus also cushioned market income inequality, albeit to a lesser
extent. With the exception of Cyprus, automatic stabilisation played a larger role than discretionary
policy in reducing inequality, highlighting the importance of a well-designed tax-benefit system in
dealing with unexpected market shocks.
-0.08
-0.06
-0.04
-0.02
0.00
0.02
0.04
0.06
0.08
0.10
EL PT IE ES CY
Ch
ange
in G
ini
Decomposition of change in Gini 2007-2013
Marketincome
Discretionarypolicy
Automaticstabilisation

13
References
Avram, S., F. Figari, C. Leventi, H. Levy, J. Navicke, M. Matsaganis, E. Militaru, A. Paulus, O. Rastrigina,
H. Sutherland, “The distributional effects of fiscal consolidation in nine EU countries” EUROMOD
Working Paper Series EM2/13, 2013
Bargain, O. and T. Callan, “Analysing the effects of tax-benefit reforms on income distribution: a
decomposition approach,” Journal of Economic Inequality, vol. 8(1), 1-21, 2010.
Bargain, O., Callan, T., Doorley, K. and Keane, C., “Changes in Income Distributions and the Role of
Tax-benefit Policy During the Great Recession: An International Perspective”, Fiscal Studies,2017
forthcoming.
De Agostini, P., A. Paulus and I. Tasseva “ The effect of changes in tax-benefit policies on the income
distribution in 2008-2015” Euromod Working Paper Series EM 6/16, 2016
Decoster, A., R. Ochmann, and K. Spiritus “Integrating VAT into Euromod. Documentation and
Results for Belgium” EUORMOD Working Paper Series 12/14, 2014
Dolls, M., C. Fuest and A. Peichl “Automatic stablizers and economic crisis: US vs Europe”, Journal of
Public Economics, Vol. 96, pp.279-294, 2012
Dolls, M., C. Fuest, A. Peichl and C. Wittneben, “Crisis, Austerity and Automatic Stabilization”,
unpublished manuscript, 2016
Fields, G. “Does income mobility equalize longer-term incomes? New measures of an old concept”
Journal of Economic Inequality, 8: 409, 2010
Grimm, M. “Removing the anonymity axiom in assessing pro-poor growth” Journal of Economic
Inequality 5 (2), 179-197, 2007
Herault, N. and F. Azpitarte, “Understanding Changes in the Distribution and Redistribution of
Income: A Unifying Decomposition Framework”, Review of Income and Wealth,
DOI: 10.1111/roiw.12160, 2014.
Jenkins, S. P., “svylorenz: Stata module to derive distribution-free variance estimates from complex
survey data, of quantile group shares of a total, cumulative quantile group shares”, SSC Archive
S456602, http://ideas.repec.org/c/boc/bocode/s456602.html., 2006.
Jenkins S.P., A. Brandolini, J. Micklewright, B. Nolan (eds.) The Great Recession and the Distribution
of Household Income Oxford University Press, Oxford, UK, 2013
Jenkins, S. and P. Van Kerm “Trends in Income Inequality, Pro-Poor Income Growth, and Income
Mobility” Oxford Economic Papers 58 (3), 531-548, 2006
Jenkins, S. and P. Van Kerm, “The Relationship Between EU Indicators of Persistent and Current
Poverty”, Social Indicators Research 116 (2), 611-638, 2014.
Jenkins, S. and P. Van Kerm “Assessing Individual Income Growth” Economica 83, 679–703, 2016

14
Kaplanoglou, G. and V.T. Rapanos., “Evolutions in Consumption Inequality and Poverty in Greece:
The Impact of the Crisis and Austerity Policies” Review of Income and Wealth.
doi:10.1111/roiw.12287, 2016
Kovaevic, M.S. and D.A. Binder, “Variance estimation for measures of income inequality and
polarization” Journal of Official Statistics, 13(1), 41-58, 1997.
Lambert, P., and T. Thoresen, "Base independence in the analysis of tax policy effects: with an
application to Norway 1992–2004," International Tax and Public Finance, Springer;International
Institute of Public Finance, 16(2), 219-252, 2009
Matsaganis, M. and C. Leventi “The Distributional Impact of the Greek Crisis in 2010” Fiscal Studies,
34: 83–108, 2013
OECD. Society at a Glance 2014, OECD, Paris 2014a.
OECD, “Rising inequality: youth and poor fall further behind”, Income Inequality Update, June,
OECD, Paris, 2014b.
Palmisano, F. and V. Peragine “The Distributional Incidence of Growth: A Social Welfare Approach”
Review of Income and Wealth 61 (3), 440-464, 2015
Palmisano, F. “Evaluating patterns of income growth when status matters: a robust approach”
Review of Income and Wealth, forthcoming DOI: 10.1111/roiw.12272, 2016
Paulus, Alari & Tasseva, Iva Valentinova, 2017. " Decomposition of changes in the EU income
distribution in 2007-2011," EUROMOD Working Papers EM9/17, EUROMOD at the Institute for Social
and Economic Research.
Pestel, N. and E. Sommer, “Shifting taxes from labor to consumption: More employment and more
inequality,” Review of Income and Wealth forthcoming DOI: 10.1111/roiw.12232, 2016
Savage, M. “Modelling the Impact of Direct and Indirect Taxes Using Complementary Datasets”, The
Economic and Social Review, forthcoming, 2017
Savage, M. & Callan, T. & Nolan, B. & Colgan, B., 2017. "The Great Recession, Austerity and
Inequality: Evidence from Ireland," conditionally accepted, Review of Income and Wealth.

15
Appendix
Table 2 The evolution of inequality between 2007 and 2013 (2011 for Ireland)
base end change base end change base end change
Greece 0.51 0.58 0.06 0.33 0.34 0.01 0.18 0.24 0.06
Spain 0.45 0.53 0.08 0.30 0.34 0.04 0.16 0.19 0.03
Ireland 0.50 0.54 0.04 0.28 0.27 -0.01 0.21 0.26 0.05
Portugal 0.53 0.57 0.04 0.35 0.33 -0.02 0.17 0.24 0.06
Cyprus 0.38 0.46 0.08 0.27 0.34 0.07 0.11 0.12 0.01
Disposable Income Gini Reynolds-Smolensky Market Income Gini
Indices are calculated using 2007 EUROMOD policies linked to 2008 data (base period) and 2013 (2011 for Ireland)
EUROMOD policies linked to 2014 (2012 for Ireland) data (end period). Incomes are equivalised using the OECD
equivalence scale. The Reynolds-Smolensky index is the difference between the market income Gini and the
disposable income Gini.