Inequality does cause underdevelopment: Insights from a ... · guided the inequality and growth...
22
Inequality does cause underdevelopment: Insights from a new instrument ☆ William Easterly New York University, United States Received 24 December 2005; received in revised form 23 October 2006; accepted 1 November 2006 Abstract Consistent with the provocative hypothesis of Engerman and Sokoloff [Engermann, Stanley and Kenneth Sokoloff (1997), “Factor Endowments, Institutions, and Differential Paths of Growth Among New World Economies: A View from Economic Historians of the United States,” in Stephen Haber, ed. How Latin America Fell Behind, Stanford CA: Stanford University Press., Sokoloff, Kenneth L. and Stanley L. Engerman (2000), Institutions, Factor Endowments, and Paths of Development in the New World, Journal of Economic Perspectives v14, n3, 217–32.], this paper confirms with cross-country data that agricultural endowments predict inequality and inequality predicts development. The use of agricultural endowments – specifically the abundance of land suitable for growing wheat relative to that suitable for growing sugarcane – as an instrument for inequality is this paper's approach to problems of measurement and endogeneity of inequality. The paper finds inequality also affects other development outcomes – institutions and schooling – which the literature has emphasized as mechanisms by which higher inequality lowers per capita income. It tests the inequality hypothesis for development, institutional quality and schooling against other recent hypotheses in the literature. While finding some evidence consistent with other development fundamentals, the paper finds high inequality to independently be a large and statistically significant barrier to prosperity, good quality institutions, and high schooling. © 2006 Elsevier B.V. All rights reserved. JEL classification: O10; O57; D31; 12; N10 Keywords: inequality; institutions; schooling; growth Journal of Development Economics 84 (2007) 755 – 776 www.elsevier.com/locate/econbase ☆ I am grateful to Sergio Kurlat and Julia Schwenkenberg for research assistance and to the editor, an anonymous referee, Daron Acemoglu, Michael Kremer, Ross Levine, Martin Ravallion, and participants in the NBER Summer Institute Workshop on Income Distribution, New York University, the University of Maryland, Boston University, Cornell University, the University of Texas, Stanford University and Johns Hopkins University for helpful comments. E-mail address: [email protected]. 0304-3878/$ - see front matter © 2006 Elsevier B.V. All rights reserved. doi:10.1016/j.jdeveco.2006.11.002
-
Upload
nguyenduong -
Category
Documents
-
view
217 -
download
0
Transcript of Inequality does cause underdevelopment: Insights from a ... · guided the inequality and growth...
r.com/locate/econbase
Journal of Development Economics 84 (2007) 755–776www.elsevie
Inequality does cause underdevelopment: Insightsfrom a new instrument☆
William Easterly
New York University, United States
Received 24 December 2005; received in revised form 23 October 2006; accepted 1 November 2006
Abstract
Consistent with the provocative hypothesis of Engerman and Sokoloff [Engermann, Stanley and KennethSokoloff (1997), “Factor Endowments, Institutions, and Differential Paths of Growth Among New WorldEconomies: A View from Economic Historians of the United States,” in Stephen Haber, ed. How LatinAmerica Fell Behind, Stanford CA: Stanford University Press., Sokoloff, Kenneth L. and Stanley L.Engerman (2000), Institutions, Factor Endowments, and Paths of Development in the NewWorld, Journal ofEconomic Perspectives v14, n3, 217–32.], this paper confirms with cross-country data that agriculturalendowments predict inequality and inequality predicts development. The use of agricultural endowments –specifically the abundance of land suitable for growing wheat relative to that suitable for growing sugarcane –as an instrument for inequality is this paper's approach to problems of measurement and endogeneity ofinequality. The paper finds inequality also affects other development outcomes – institutions and schooling –which the literature has emphasized as mechanisms by which higher inequality lowers per capita income. Ittests the inequality hypothesis for development, institutional quality and schooling against other recenthypotheses in the literature. While finding some evidence consistent with other development fundamentals,the paper finds high inequality to independently be a large and statistically significant barrier to prosperity,good quality institutions, and high schooling.© 2006 Elsevier B.V. All rights reserved.
JEL classification: O10; O57; D31; 12; N10Keywords: inequality; institutions; schooling; growth
☆ I am grateful to Sergio Kurlat and Julia Schwenkenberg for research assistance and to the editor, an anonymousreferee, Daron Acemoglu, Michael Kremer, Ross Levine, Martin Ravallion, and participants in the NBER SummerInstitute Workshop on Income Distribution, New York University, the University of Maryland, Boston University, CornellUniversity, the University of Texas, Stanford University and Johns Hopkins University for helpful comments.
E-mail address: [email protected].
0304-3878/$ - see front matter © 2006 Elsevier B.V. All rights reserved.doi:10.1016/j.jdeveco.2006.11.002

756 W. Easterly / Journal of Development Economics 84 (2007) 755–776
“No society can surely be flourishing and happy, of which the far greater part of the
1 Thedistingthe keyhavingoutcomto this
members are poor and miserable.” Adam Smith, The Wealth of Nations, p. 79, 1776.
The World Bank (2005) World Development Report says in its introduction: “We now haveconsiderable evidence that equity is also instrumental to the pursuit of long-term prosperity inaggregate terms for society as a whole.” Despite this claim, the effect of inequality oneconomic development continues to be hotly debated. A first wave of the developmentliterature argued that high inequality could help growth by directing more income to high-saving capitalists (Lewis, 1954, Kaldor, 1956, 1961). The new growth literature reversed thisprediction with a set of theoretical models and empirical studies arguing that inequalityharmed growth through political economy channels or through constraints on human capitaaccumulation or occupational choice (Galor and Zeira, 1993; Banerjee and Newman, 1993;Alesina and Rodrik, 1994; Persson and Tabellini, 1994, followed by many other authors). Thisin turn has brought forth a challenge from Forbes (2000), Barro (2000), and Banerjee andDuflo (2003), who either confirm the original development notion that inequality has apositive relationship with growth, or argue that the relationship can take either sign (and in thecase of Banerjee and Duflo that it is changes rather than levels of inequality that matter). Sowhich is it?
One confusion in the theoretical and empirical analysis of inequality is between what wecould call structural inequality and market inequality. Structural inequality reflects suchhistorical events as conquest, colonization, slavery, and land distribution by the state orcolonial power; it creates an elite by means of these non-market mechanisms. Market forcesalso lead to inequality, but just because success in free markets is always very uneven acrossdifferent individuals, cities, regions, firms, and industries. So the recent rise in inequality inChina is clearly market-based, while high inequality in Brazil or South Africa is just asclearly structural. Only structural inequality is unambiguously bad for subsequentdevelopment in theory; market inequality has ambiguous effects — it could have some ofthe adverse effects cited in the above models, but eliminating it would obviously havenegative incentive effects.1
A vast empirical literature already exists on competing hypotheses on inequality, so anynew empirical paper has to pass a high threshold. This paper follows an empirical strategyinspired by a hypothesis due to economic historians Engermann and Sokoloff (1997) andSokoloff and Engerman (2000) (henceforth ES) (followed by a continuing stream of paperssuch as Engermann and Sokoloff, 2005; Engerman et al., 2002; Khan and Sokoloff, 2004;Sokoloff and Zolt, 2005). They suggest factor endowments are a central determinant ofinequality (what this paper calls structural inequality), and (structural) inequality in turn is adeterminant of bad institutions, low human capital investment, and underdevelopment.Hence this paper will use measures of factor endowments as instruments that can be used toassess the causal inequality and development relationship. ES argues that the land endowmentsof Latin America lent themselves to commodities featuring economies of scale and the use of
World Development Report (World Bank, 2005) attempted to make some distinction along these lines byuishing “inequality of opportunities” from “inequality of outcomes.” However, it’s not clear that this really gets atissue. They give the example of “inequality of opportunities” as exemplified by a child born in a poor region asless opportunity than one born in a rich region. However, since market-based growth typically leads to unevenes across regions (or across almost any other unit of analysis), market inequality inevitably and unavoidably leadskind of “inequality of opportunities.”

Fig. 1. Per capita income and inequality.
757W. Easterly / Journal of Development Economics 84 (2007) 755–776
slave labor (sugar cane is their premier example) and thus were historically associated withhigh inequality.2 In contrast, the endowments of North America lent themselves tocommodities grown on family farms (wheat being exhibit A) and thus promoted the growthof a large middle class. The ES work suggests a natural instrument for inequality: theexogenous suitability of land for wheat versus sugarcane. This instrument is particularlyattractive because it picks out the variation due to structural inequality rather than that due tomarket inequality.
With this instrument, one can address one important piece of evidence that has been under-emphasized in this debate. There is a strong association between inequality (measured here bythe Gini coefficient averaged over the last 3 decades) and the level of per capita income today(Fig. 1). The association is highly significant (correlation=− .37, t-statistic=5.6).3
If this link is causal from inequality to income, it provides further evidence that there is along-run negative association between growth (of which log income is of course the cumu-lative sum) and inequality. Inequality is highly persistent over time, so the last 3 decades'average inequality likely reflects cross-sectional differences that have been present for sometime (as this paper will document). The causality could be the reverse — maybe rich societiescan afford redistribution. The use of the ES instrument allows us to address the causalityissue. A first look at the data suggests that the log of the ratio of land suitable for wheat to
2 Sugarcane is a labor-intensive crop requiring cheap labor to be economical. The sugarcane stalks are also very bulkyto transport long distances and must be ground within days of the harvest. This led to economies of scale and led thetypical sugar holding historically to be a plantation that was large enough to produce enough sugarcane to cover the fixedcosts of a sugar mill right on the plantation. See the discussion in Abbott (1990 pp. 61–62, 75).3 The cross-country relationship between inequality and development has already been the subject of a vast empirical
literature with a focus on the reverse relationship— the Kuznets curve between income and inequality. I do not attempt toaddress the question of the existence of the Kuznets curve here and I restrict attention to the possible linear relationshipfrom inequality to income. For some of the classic references to this earlier literature, see Anand and Kanbur (1993) andRavallion (1997).

Fig. 2. Log of wheat–sugar suitability ratio and inequality.
758 W. Easterly / Journal of Development Economics 84 (2007) 755–776
that for sugarcane (data and definition to be discussed in more detail below) has considerablepredictive power for inequality (Fig. 2, correlation=− .41, t-statistic=−5.6).
The ES hypothesis has predictions for some of the intermediating mechanisms thatpromote development. ES suggest that the elite in Latin America opposed democracy andmass investment in human capital because they were afraid of the poor majority gainingpower (people with more human capital are more politically active). The elite feared inparticular that the majority would use power to redistribute income and rents away from theelite towards the majority. ES note that even when Latin American nations were nominaldemocracies, they imposed literacy or wealth requirements for voting that sharply restrictedthe franchise well into the 20th century. And ES point out that Latin America trailed wellbehind North America in establishing universal free schooling and raising literacy. Banerjeeand Iyer (2005) have similar evidence from another region: historically landlord-dominateddistricts of West Bengal in India fare worse on agricultural productivity and schooling thansmall-holder districts.
The ES hypothesis has been influential in the literature, and has already attracted critics(for a summary of some criticisms, see Przeworski, 2004), but has received little econometrictesting. The ES story provides a set of sharp but simple hypotheses that can be taken to thecross-country data and tested against competing hypotheses. Having the empirical designguided by the ES story may lead to over-simplification, but it has the more than compensatingvirtue of avoiding open-ended cross-country regressions that have weak credibility due to thepotential for data mining.
1. Literature review
Whether a high initial level of inequality hinders economic development is one of the mosthighly contested questions in the recent literature on economic growth and development.Unlike much empirical growth research, theory and a priori testable mechanisms have in part

759W. Easterly / Journal of Development Economics 84 (2007) 755–776
guided the inequality and growth literature. The three principal mechanisms that researchershave proposed have been redistributive policies, quality of institutions, and human capital.The first wave of the recent literature saw high inequality lowering growth because the poormajority would vote for redistributive rather than growth-enhancing policies (Alesina andRodrik, 1994; Persson and Tabellini, 1994).
Other authors besides ES have also proposed an institutional mechanism in which a richelite will suppress democracy and equal rights before the law so as to preserve their privilegedposition. (e.g. Bourguignon and Verdier, 2000). Acemoglu (2005) also has a model in whichthe oligarchy blocks democracy to preserve its privileges.
Rajan and Zingales (2006) have a more general argument: that the elite and the educatedmiddle class will form a coalition against education for the poor so as to prevent both large-scale reform and erosion of the rents accruing to the already educated. Like this paper, theseauthors argue that factor endowments are the underlying determinant, in their case affecting“constituencies” for and against different policy changes. However, Rajan and Zingales(2006) do not pursue the empirical line of inquiry in this paper.
Inequality could also lead to politically unstable institutions as power swings back andforth between redistributive populist factions and oligarchy-protecting conservative factions(Perotti, 1996; Benabou, 1996), and political instability itself lowers growth (Alesina et al.,1996). The human capital mechanism is that imperfect capital markets will prevent humancapital accumulation by the poor majority (Galor and Zeira, 1993; Perotti, 1996; Galor and Moav,2006; Galor et al. 2006). Assortative matching between marriage partners or other sorting willmake this problem worse (Fernandez et al., 2005; Fernandez and Rogerson, 2001).
Whether in fact a negative relationship holds between inequality and growth has beenhotly contested. The first studies in the recent wave of literature did find a relationship(Alesina and Rodrik, 1994; Persson and Tabellini, 1994; Clarke, 1995). These findingsoffered a partial explanation for the stylized fact that growth had been high in egalitarianEast Asia and low in unequal Africa and Latin America (Birdsall et al., 1995; World Bank,1993). Perotti (1996) challenged some of the mechanisms allegedly at work in these findings(e.g. he found no evidence for higher tax rates in more unequal societies), but did find arelationship between inequality and growth through political instability and human capital. Achallenge to this literature came from researchers who exploited the panel dimensions of thedata (Forbes, 2000; Barro, 2000; Banerjee and Duflo, 2003). These authors found a zero,nonlinear, or even positive relationship between inequality and growth. The positiverelationship of Forbes (2000) would seem to confirm a long tradition in economic thought ofbeneficent inequality that concentrates income among the rich who save more and increasesthe incentive to work hard to move up the ladder. However, there is some question as towhether panel methods using relatively high frequency data are the appropriate test of arelationship whose mechanisms seem to be long run characteristics that are fairly stable overtime.
Another criticism of the literature has been the poor quality of the data on inequality. Thefirst wave of results was challenged on these grounds of poor data quality by Deininger andSquire (1996, 1998), who offered a new expanded and higher quality dataset. More recently,the Deininger and Squire data themselves have come under attack (Atkinson and Brandolini,2001). Using a smaller dataset mainly applying to rich countries (the Luxembourg IncomeSurvey (LIS), Atkinson and Brandolini pointed out that the Deininger and Squire inequalitydata are derived from several different methodologies, including individual vs. household,income vs. expenditure, and pretax vs. post-tax. In response to these criticisms, the UN's
760 W. Easterly / Journal of Development Economics 84 (2007) 755–776
World Institute for Development Economics Research (WIDER) produced a new internationaldatabasewith emphasis on cross-country comparability (WIDER2000), drawing on both the LIS andDeininger and Squire. The issue of data quality in international inequality data is far from resolved.Another advantage of the instrumentation strategy in this paper could be that the econometricproblems of measurement error in inequality will be alleviated by instrumental variables.
The specification of mechanisms by the inequality literature is helpful because it allows us to testthe inequality hypothesis against other determinants of economic development that have beenproposed in the literature. Schooling and institutions have both been proposed as central determinantsof economic development, with these in turn depending on exogenous country characteristics.
Acemoglu et al. (2001, 2002, 2005a,b) (AJR) suggest institutional quality as a fundamentaldeterminant of economic development, instrumenting for institutions with mortality rates facingEuropean settlers in the colonial era. AJR characterized settler colonies as producing institutionsthat facilitated broad-based development, while non-settler colonies adopted extractiveinstitutions that were designed to capture the rents for the colonizers. The literature started byAJR is currently in a state of flux due to serious questions about the underlying data on mortalityrates raised by Albouy (2006). Easterly and Levine (1997a,b) and Mauro (1995) have acompeting hypothesis, suggesting that ethnic fractionalization led to poor institutional outcomes.4
Finally, formal schooling is argued to be a fundamental determinant of output per worker in aliterature that began with Schultz (1963), Krueger (1968), Easterlin (1981) and continued withMankiw, Romer, andWeil (1992) andMankiw (1995). Glaeser et al. (2004) argue that human capitalcrowds out institutions as a determinant of development. Easterly and Levine (1997a,b) and Alesinaet al. (1999) argue that schooling is affected by ethnic fractionalization because of the difficulty ofdifferent ethnic groups agreeing on the type and quality of public services.
Some other papers relate level of development or growth directly to exogenous countrycharacteristics. Easterly and Levine (1997a,b) relate growth and per capita income directly toethnolinguistic fractionalization. Bloom and Sachs (1998) and Sachs and Warner (1997) suggestthat tropical location, landlocked location, and natural resource exporting directly inhibitdevelopment or growth. Other scholars have failed to confirm the independent importance oftropical location, suggesting that its effects go through institutions (Easterly and Levine, 2003;Rodrik, Subramian, and Trebbi 2004; Acemoglu, Johnson, and Robinson 2002).
Another branch of the literature stresses legal origin as a fundamental underpinningdevelopment. La Porta et al. (1999) alternatively link the quality of government institutions tolegal origins, with French legal origin having a negative effect on institutions. La Porta et al.(1998) find that legal origin influenced financial institutions. Levine (1999, 2005) found that legalorigin helped explain financial intermediary development. Levine, Loayza, and Beck (2000) andBeck, Levine, and Loayza (2000) found that using legal origin as an instrument for finance helpedidentify the causal effect of financial development on GDP growth, investment, and productivitygrowth.
This paper continues work started in an earlier paper, which focused on the share of the middleclass (Easterly, 2001). That earlier paper also tested the effect of inequality of development with asystem predicting commodity exporting by tropical location and predicting middle class sharewith commodity exporting, then estimating an equation for income and growth as a function ofmiddle class share and ethnic fractionalization (the “middle class consensus”). The present paper
4 Woolcock et al. (2001) and Isham et al. (2005) found that institutions are worse in resource-rich than in resource-pooreconomies, and that “point-source” and coffee and cocoa resources were associated with worse institutions compared to“diffuse” resource economies. I will discuss these results more below.
761W. Easterly / Journal of Development Economics 84 (2007) 755–776
takes these results further by specifying an instrument that is more specific to a rich historicalliterature that has identified it a priori, by estimating the intermediating mechanisms as a functionof inequality, and by running a “horse race” with other competing determinants hypothesized bythe previous literature.
In sum, there are at least four plausible alternatives to the inequality hypothesis for deve-lopment, institutions, and schooling: (1) settler mortality, (2) ethnic fractionalization, (3) tropicallocation, and (4) legal origin. Inequality could simply be proxying for one of these other variables.Given the unresolved debate about the settler mortality data, I will combine hypotheses (1) and(3), since high settler mortality is strongly associated with tropical location. I will thus testwhether the inequality relationship holds up when we also control for exogenous measures ofethnic fractionalization, tropical location, and legal origin.5
2. Empirical results
2.1. The data
International inequality datasets are deeply flawed, as mentioned above, so any use of the datain research has to make the best of some bad choices. One could conclude the flaws are so seriousas to disqualify the data altogether, but this study explores whether the data contain some signal aswell as noise to test the inequality and development hypotheses. I use the WIDER (2000) dataset.This dataset helps address comparability of surveys across countries by classifying the type ofsurvey each inequality observation is based on along the following dimensions (1) earningsversus total income, (2) income versus expenditure, (3) gross versus net income (after taxes andtransfers), (4) household versus individual units. I use two measures of inequality from thedataset: (1) the Gini coefficient, and (2) the share of income accruing to the top quintile. I regressboth measures on dummy variables capturing the dimensions above, all of which potentially biasthe inequality measure— for example, inequality of expenditure is generally less than inequalityof income, and of course post-tax income has less inequality than pretax income. The householdversus individual unit distinction was not significant and I omitted this dimension in adjusting thedata. The shift coefficients on the dummies were then used to adjust the inequality measures so asto remove average differences that could be traced to different survey definitions. This procedureis far from perfect, as it leaves some idiosyncratic noise across countries based on the degree towhich survey differences matter, but the procedure at least removes the average bias due to surveymethodology. These corrections are in the same spirit as the original Deininger and Squire (1996)exercise.
There is also the problem that the household surveys on which inequality measures are basedare intrinsically noisy and can imply abrupt and implausible changes from one survey to the next.This study reduces this noise problem by taking the average for each country of all inequalitymeasures (adjusted as described) over 1960–98.
On the crop endowments measure, I have data from the FAO about the percent of nationalarable land area suitable for different crops, taking into account such factors as soil, rainfall,temperature, and elevation.6 Harlan (1992 pp. 53–60) discusses the botanical mechanisms by
5 Levine (2005) has a careful related analysis of tropical location and legal origin as affecting legal outcomes andfinancial development.6 Food and Agriculture Organization, Global Agro-Ecological Zones 2000, Web site http://www.fao.org/ag/AGL/agll/
gaez/index.htm.

Fig. 3. Log of wheat–sugar ratio and percent of land in tropics.
762 W. Easterly / Journal of Development Economics 84 (2007) 755–776
which different ecological zones are compatible with some types of crops and not with others. Forexample, sugarcane does not grow below 15–16 °C, needs an average of about 1200–1500 mmrainfall a year, and favors level rather than steeply elevated lands (Blume, 1985, pp. 44–46). Incontrast, wheat photosynthesizes at low temperatures (15 to 20 °C) and cannot be grown in thewarm tropics (FAO, 2005). These characteristics have thus plausibly remained constant over time,thus reflecting historical conditions for inequality.
The variable I will use and call the “wheat–sugar ratio” is defined as LWHEATSUGAR=log[(1+share of arable land suitable for wheat) / (1+share of arable land suitable for sugarcane)].
Given the forgoing discussion, the wheat–sugar ratio could simply be proxying forwhether the country is in the tropics. There is certainly a strong correlation (correlation=− .66,t-statistic=−10.75), but Fig. 3 shows that there is still considerable variation in the wheat–sugar ratio both in tropical and non-tropical areas.
While LWHEATSUGAR is a less precise measure than production data on whether differentcrops are actually grown, since it is a technical guess as to whether certain land areas are“suitable,” it is exogenous while crop production is endogenous. In any case, the measure of landsuitability does predict crops actually grown. I have data from Mitchell's (2003) historicalstatistics on acreage devoted to wheat and sugarcane in 1920 in various countries. For both 1920sugarcane and wheat acreage, the relationship to the corresponding FAO data on share of arableland suitable for the respective crop is highly significant. Using FAO production statistics onwhether wheat and sugar are grown in 1999, I also find a strong association with the FAOsuitability measure (results available on request).
Another important dataset is on the share of agricultural land occupied by family farmsfrom 1858 to 1998, assembled from a large array of sources by Vanhanen (in press).7 Evengiven the high uncertainty and many methodological problems involved in using data from
7 I am grateful to Adam Przeworski for calling this data to my attention.

Table 1Share of family farms in different decades regressed on wheat–sugar endowment
Dependent variable Coefficient on lwheatsugar t-stat Observations R-squared
FF1998 15.85 −1.29 117 0.02FF1988 28.10 (2.07)⁎ 102 0.05FF1978 45.25 (3.19)⁎⁎ 95 0.13FF1968 49.66 (3.53)⁎⁎ 94 0.15FF1958 64.73 (5.31)⁎⁎ 72 0.27FF1948 50.35 (4.80)⁎⁎ 63 0.23FF1938 52.91 (4.91)⁎⁎ 54 0.25FF1928 45.98 (5.13)⁎⁎ 54 0.26FF1918 40.49 (4.49)⁎⁎ 47 0.21FF1908 38.77 (4.35)⁎⁎ 44 0.21FF1898 36.50 (4.22)⁎⁎ 40 0.22FF1888 36.06 (4.19)⁎⁎ 40 0.22FF1878 33.13 (3.65)⁎⁎ 39 0.18FF1868 25.62 (2.70)⁎ 37 0.11FF1858 26.70 (2.77)⁎⁎ 35 0.14
Robust t statistics in parentheses. ⁎ significant at 5%; ⁎⁎ significant at 1%.FFxxxx is share of family farms in agricultural land in year xxxx; source: Vanhanen (in press).
763W. Easterly / Journal of Development Economics 84 (2007) 755–776
many different sources, this data is valuable to test whether the ES story about a highendowment of wheat land relative to sugarcane land predicts landowning dominated byfamily farms. The share of family farms is itself a measure of inequality, and hence we canalso get some idea if today's inequality is correlated with that from the past.
I first test the link between the wheat–sugar ratio and share of family farms in Table 1.The wheat–sugar endowment ratio is significantly correlated with the share of family farmsin the 19th century, as well with all dates except for the most recent: 1988 and 1998. Thestrength of the relationship peaks in about 1958, when the size of the sample grows toinclude many developing countries. These patterns are plausible — the increased variationassociated with adding more developing countries strengthens the relationship from the 19thcentury to the mid-20th century, while changes in agricultural technology and the fallingrelative importance of agriculture in recent years may account for the disappearance of therelationship.
I next use the family farm data to discuss whether current inequality reflects historicalinequality. Previous literature has tended to affirm that it does. Lindert and Williamson(2003) argue in a broad survey that there is no systematic tendency for within-countryinequality to change over the last two centuries. Lindert (2000) finds that sketchy datasuggest that the Gini for income inequality in England in the 17th and 18th centuries wasroughly the same as in 1995, although it fluctuated in between. Likewise, he finds the wealthinequality Gini in the US was about the same order of magnitude in 1983 as in 1776.8 Iconfirm here that the family farm measure from earlier dates since 1858 is a good predictorof inequality today (Table 2).
8 There is also a big debate in the literature about recent trends in inequality in rich countries. One of the most recententries in this literature is Brandolini and Smeeding (2005), who conclude that there is no common trend upward ordownward in inequality in rich democracies over the past quarter century.

Table 2Inequality measure regressed on share of family farms in different decades
Dependent variable: share of top quintile, 1960–98
Right-hand side variable: Coefficient on share of family farms Observations R-squared
FF1998 −0.08 121 0.05(2.48)⁎
FF1988 −0.067 107 0.03−1.76
FF1978 −0.099 95 0.1(3.36)⁎⁎
FF1968 −0.111 94 0.13(4.10)⁎⁎
FF1958 −0.191 71 0.4(7.59)⁎⁎
FF1948 −0.242 62 0.43(7.43)⁎⁎
FF1938 −0.266 53 0.52(7.65)⁎⁎
FF1928 −0.283 53 0.51(6.64)⁎⁎
FF1918 −0.278 47 0.47(5.77)⁎⁎
FF1908 −0.258 44 0.41(5.50)⁎⁎
FF1898 −0.265 40 0.39(5.03)⁎⁎
FF1888 −0.264 40 0.38(5.29)⁎⁎
FF1878 −0.237 39 0.37(5.19)⁎⁎
FF1868 −0.215 37 0.3(4.95)⁎⁎
FF1858 −0.222 35 0.28(4.39)⁎⁎
Robust t statistics in parentheses, ⁎ significant at 5%; ⁎⁎ significant at 1%.FFxxxx is share of family farms in agricultural land in year xxxx; source: Vanhanen (in press).
764 W. Easterly / Journal of Development Economics 84 (2007) 755–776
The relationship weakens again in the more recent data, probably for the same reasons asthe weaker relationship with the wheat–sugar endowments.
2.2. Basic results on inequality and development outcomes
With these preliminaries, the next step is to assess the effect of inequality on developmentoutcomes using the wheat–sugar ratio as an instrument for inequality. The first stageregression shows a highly significant relationship between the wheat–sugar endowment ratioand the two measures of inequality.
The F-statistics for the first stage regressions are well above the critical values identifiedby Stock and Yogo (2002) as indicating a problem with weak instruments. It is also above theearlier rule of thumb suggested by Staiger and Stock (1997): that the F-statistic in the firststage regression exceed 10 (Table 3).

Table 3First stage regression for inequality on wheat–sugar ratio
Dependent variables Average adjusted Gini,1960–98
Average adjusted share of incomeaccruing to top quintile, 1960–98
lwheatsugar −18.328 −19.133(5.59)⁎⁎ (6.39)⁎⁎
Constant 44.555 49.275(48.26)⁎⁎ (61.75)⁎⁎
Observations 118 114F-statistic 23.64 30.86R-squared 0.17 0.22
Robust t statistics in parentheses.⁎⁎ significant at 1%.
765W. Easterly / Journal of Development Economics 84 (2007) 755–776
Next is the estimation of the direct relationship between inequality and income,institutions, and schooling. The measure of institutions is the comprehensive indicatordeveloped by Kaufmann, Kraay, and Zoido-Lobaton 2003 (KKZ). This measure summarizesthe information contained in more than 300 indicators of institutional quality using aparticular method of unobserved components, correcting for selection bias. They derive sixindicators of institutional quality: government efficiency, corruption, political instability,regulatory burden, rule of law, and democracy. I average over their six measures to derive asingle indicator of institutional quality (KKZ2002), although I will also test each com-ponent separately. The measure of schooling comes from secondary enrollment rates aver-aged over 1998–2003 from the World Bank World Development Indicators (SEC9803). Themeasure of level of development is per capita income in 2002 from Summers and Heston,1991, updated to 2002 using World Bank World Development Indicator growth rates(lgpdppc).
Table 4 shows that inequality predicts a lower level of development, worse institutions, anda lower level of schooling. The magnitude of the relationships is higher in instrumentalvariables than in OLS, suggesting that the causal effect of inequality on development outcomesis actually understated by the OLS relationship.
Table 4 further expands on the basic result by adding two quick robustness checks. Thefirst excludes the Western Hemisphere, to which Engerman and Sokoloff's original casestudy was limited. The prediction that inequality inhibits development with the wheat–sugarratio as an instrument holds “out of sample” for the rest of the world.
Second, I include regional dummy variables. This requires a little care about how regionsare defined. The conventional choice for regional dummies – the World Bank's regionalclassifications – is endogenous because the regions themselves are defined on the basis of percapita income. First, of course, rich countries are excluded from the regions of the WorldBank's “developing countries”. I correct this by including Japan, Australia, and New Zealandback into East Asia and Pacific, Western Europe back into the Europe and Central Asiaregion, the US and Canada back into the Latin America and Caribbean region, etc. Second,some breakdowns of regions by the World Bank are done by per capita income: low incomeSouth Asia is separated from middle-income East Asia and Pacific, and middle-income NorthAfrica (also including the Middle East in the World Bank) is delineated from low-incomesub-Saharan Africa. I address this by combining those regions that were split because ofincome. So I have 4 regions: (1) East/South Asia and Pacific, (2) Western Hemisphere, (3)

Table 4Basic results for development outcomes and inequality: Ordinary least squares and instrumental variables
Regression Dependent variable: log per capita income, 2002 (lgdppc)
Inequality measure: Gini coefficient, 1960–98 Inequality measure: share of top quintile, 1960–98
OLS IV IV excludingAmericas
IV OLS IV IV excludingAmericas
IV
Inequality measure −0.040 −0.121 −0.15 −0.126 −0.043 −0.127 −0.157 −0.143(4.27)⁎⁎ (4.45)⁎⁎ (3.60)⁎⁎ (2.43)⁎ (4.56)⁎⁎ (4.30)⁎⁎ (3.53)⁎⁎ (2.37)⁎
East and South Asiaand Pacific
12.54 14.068(6.28)⁎⁎ (5.24)⁎⁎
Americas 13.926 15.428(5.83)⁎⁎ (4.98)⁎⁎
Europe and Central Asia 13.349 14.677(7.03)⁎⁎ (5.86)⁎⁎
Middle East and Africa 13.053 14.499(5.44)⁎⁎ (4.74)⁎⁎
Observations 107 97 74 97 106 96 73 96R-squared 0.13 0.14F-statistics from first stage 21.2 15.4 8.8 25.6 18.9 9.1
Dependent variable: Kaufmann, Kraay, and Zoido-Lobaton Institutions Index, 2002 (kkz2002)
Inequality measure −0.031 −0.091 −0.109 −0.123 −0.037 −0.098 −0.113 −0.148(4.92)⁎⁎ (4.53)⁎⁎ (3.68)⁎⁎ (2.77)⁎⁎ (5.87)⁎⁎ (4.84)⁎⁎ (4.00)⁎⁎ (2.58)⁎
East and South Asiaand Pacific
4.652 6.517(2.72)⁎⁎ (2.56)⁎
Americas 5.811 7.652(2.80)⁎⁎ (2.59)⁎
Europe and Central Asia 5.04 6.614(3.03)⁎⁎ (2.81)⁎⁎
Middle East and Africa 5.487 7.316(2.62)⁎⁎ (2.48)⁎
Constant 1.406 3.91 4.544 1.834 4.658 5.281(4.65)⁎⁎ (4.58)⁎⁎ (3.77)⁎⁎ (5.71)⁎⁎ (4.86)⁎⁎ (4.06)⁎⁎
Observations 128 118 95 118 124 114 91 114R-squared 0.13 0.17F-statistics from first stage 23.6 16.4 10.4 30.9 22.8 9.9
Dependent variable: secondary enrollment rate, average 1998–2002 (sec9802)
Inequality measure −1.474 −4.891 −6.259 −4.428 −1.721 −4.795 −6.005 −5.349(5.05)⁎⁎ (5.05)⁎⁎ (4.08)⁎⁎ (2.78)⁎⁎ (5.55)⁎⁎ (5.43)⁎⁎ (4.49)⁎⁎ (2.55)⁎
East and South Asiaand Pacific
236.66 305.335(3.83)⁎⁎ (3.25)⁎⁎
Americas 280.382 348.398(3.84)⁎⁎ (3.25)⁎⁎
Europe and Central Asia 266.006 321.505(4.44)⁎⁎ (3.72)⁎⁎
Middle East and Africa 250.896 318.545(3.37)⁎⁎ (2.96)⁎⁎
Observations 120 113 91 113 117 110 88 110R-squared 0.14 0.16F-statistics from first stage 21.7 15.5 9.6 28.3 21.0 8.2
Robust t statistics in parentheses (⁎ significant at 5%; ⁎⁎ significant at 1%). Constants (not shown) included in allregressions except for those with regional dummies.
766 W. Easterly / Journal of Development Economics 84 (2007) 755–776

Table 5Magnitude of effect on development of change in inequality
Dependent variable: Coefficient on Gini in IVregression (for whole sample,without regional dummies)
Change in dependent variablein response to 1 standarddeviation change in Gini
Ratio to 1 standard deviationdependent variable
Log incomeper capita, 2002
−0.121 −1.09 −1.09
Kaufmann–Kraayindex ofinstitutions, 2002
−0.091 −0.82 −1.04
Secondary enrollmentrate, average1998–2002
−4.891 −44.03 −1.27
767W. Easterly / Journal of Development Economics 84 (2007) 755–776
Europe and Central Asia, and (4) Middle East and Africa. Although the F-statistics on thefirst-stage regression on the excluded instrument are a little weak, the results on inequality arerobust to including dummies for these 4 regions (Table 4).
How much does inequality matter as a determinant of development? A one standarddeviation increase in the Gini (9 percentage points) reduces income by 1.1 standard deviations,institutional quality by 1.0 standard deviations, and schooling by 1.3 standard deviations(Table 5). The amount by which inequality hinders development is economically meaningful aswell as statistically significant.
The previous literature stressed institutions as an important channel that affects both level ofdevelopment and schooling. Engerman and Sokoloff stressed suffrage and democracy as affectingboth of the other outcomes. Hence, I look into the institutional quality variable in more detail.Analogously to the exercise performed by Kaufmann et al. (1999a,b), I estimate the equationsfrom Table 4 using the six different measures of institutional quality one at a time (IV resultsshown). Note that Kaufmann et al. (1999a,b) formulate these six measures in such a way that theyall are distributed Normal (0,1), so the coefficients on institutions are directly comparable.
The results (Table 6) do not showmuch discrimination in how inequality affects different types ofinstitutions. This may be because democracy is the fundamental that affects all the other institutionalvariables, because a dominant elite worsens institutions on all dimensions, or conceivably becausethe KKZ measures are unsuccessful in separating out different characteristics of institutions.
2.3. Robustness checks for omitted variables
As suggested in the introduction, some plausible competing alternatives (not necessarilyexclusive) to the inequality hypothesis are ethnic fractionalization, legal origins, and tropicallocation. The approach here is to control for each of these in turn, taking each one as exogenous,while continuing to run an IV regression of development outcomes on the inequality measureswith the wheat–sugar endowment ratio as an instrument.
Ethnic fractionalization (taken from Alesina et al., 2003, where it is a measure of both race andlanguage in recent years) is often a significant determinant of development outcomes (Table 7).The coefficient on inequality drops modestly when controlling for ethnic fractionalization, but itis still highly significant. The first stage results on the differential explanatory power of theinstrument are more than satisfactory (see F-statistics in Table 7). Comparing the results to aregression where ethnic fractionalization is the only right-hand-side variable, we see that

Table 6Institutions IV results on inequality by kind of institution (measured in 2002 by Kaufmann, Kraay, and Zoido-Lobaton)
Dependentvariables →
Voice andaccountability
Rule oflaw
Freedom fromcorruption
Political stabilityand violence
Regulatoryquality
Governmenteffectiveness
Gini coefficient −0.107 −0.123 −0.121 −0.099 −0.103 −0.122(4.21)⁎⁎ (4.56)⁎⁎ (4.40)⁎⁎ (4.33)⁎⁎ (3.99)⁎⁎ (4.56)⁎⁎
Constant 4.587 5.208 5.105 4.112 4.435 5.206(4.30)⁎⁎ (4.53)⁎⁎ (4.34)⁎⁎ (4.35)⁎⁎ (4.04)⁎⁎ (4.54)⁎⁎
Observations 118 118 118 118 118 118
Share of top quintile −0.111 −0.132 −0.128 −0.107 −0.111 −0.131(4.45)⁎⁎ (4.87)⁎⁎ (4.57)⁎⁎ (4.82)⁎⁎ (4.34)⁎⁎ (4.82)⁎⁎
Constant 5.292 6.257 6.063 5.009 5.35 6.233(4.49)⁎⁎ (4.81)⁎⁎ (4.48)⁎⁎ (4.86)⁎⁎ (4.38)⁎⁎ (4.78)⁎⁎
Observations 114 114 114 114 114 114
Robust t statistics in parentheses.⁎ significant at 5%; ⁎⁎ significant at 1%.
768 W. Easterly / Journal of Development Economics 84 (2007) 755–776
controlling for inequality reduces by about half the magnitude of the relationship between ethnicfractionalization and development.
Introducing dummies for British (leg_british), French (leg_french), and Socialist legal origin(leg_socialist) (where German or Scandinavian legal origin are the omitted categories) also leavesthe significance of inequality unchanged. In fact, the magnitude of the inequality effect increasescontrolling for legal origin. Compared to a regression that features only the legal origin dummies,the introduction of inequality (instrumenting for inequality as earlier) renders British and Frenchlegal origin insignificant (both the coefficient and standard error change considerably). I do nottake these results as a major commentary on the large legal origin literature, which would clearlyrequire more exploration, but they do show that the inequality hypothesis survives whencompared to the alternative legal origin hypothesis. Socialist legal origin remains significant inthe regression including inequality, but inequality also remains significant. The F-statistics on the
Table 7Robustness checks: effect of inequality on development outcomes controlling for ethnic fractionalization
Dependentvariables →
Inequality measure: Gini,1960–98
Inequality measure: shareof top quintile, 1960–98
Ordinary least squaresomitting inequality measures
lgdppc kkz2002 sec9802 lgdppc kkz2002 sec9802 lgdppc kkz2002 sec9802
Inequality measure −0.10 −0.08 −3.89 −0.10 −0.08 −3.42(3.10)⁎⁎ (3.36)⁎⁎ (3.81)⁎⁎ (3.00)⁎⁎ (3.62)⁎⁎ (4.05)⁎⁎
Ethnicfractionalization
−0.78 −0.61 −37.71 −1.13 −0.78 −51.07 −2.02 −1.43 −74.86−1.31 −1.55 (1.98)⁎ (2.34)⁎ (2.37)⁎ (3.45)⁎⁎ (6.56)⁎⁎ (6.35)⁎⁎ (6.86)⁎⁎
Constant 12.52 3.55 251.98 12.89 4.04 253.45 8.79 0.69 103.67(10.29)⁎⁎ (4.06)⁎⁎ (6.62)⁎⁎ (9.19)⁎⁎ (4.26)⁎⁎ (6.97)⁎⁎ (56.20)⁎⁎ (5.34)⁎⁎ (18.92)⁎⁎
Obser vations 97 118 113 96 114 110 106 127 120R-squared 0.26 0.20 0.28F-statistics for
first-stage onexcluded instrument
14.5 20.47 17.75 19.28 29.42 27.21
Robust t statistics in parentheses.⁎ significant at 5%; ⁎⁎ significant at 1%.
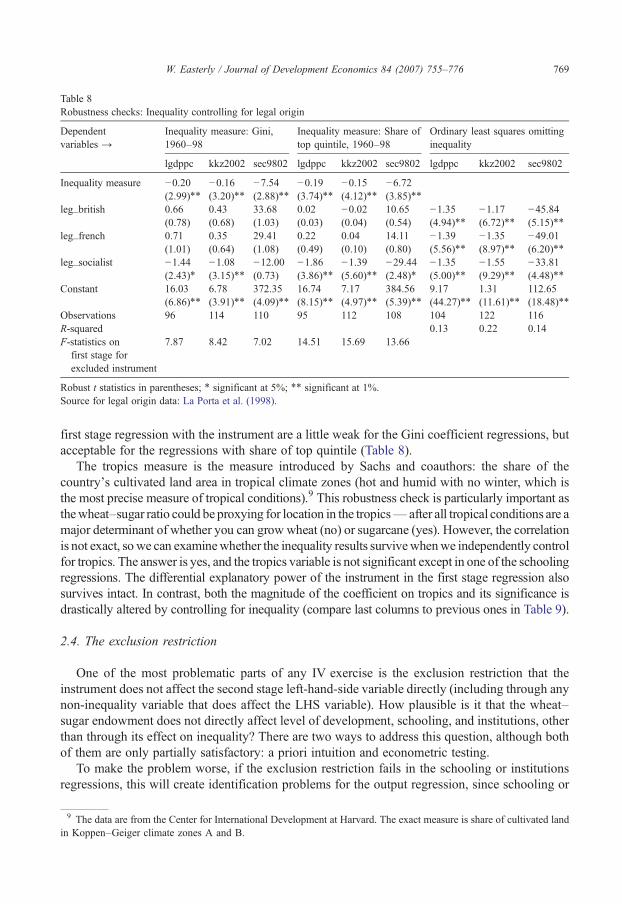
Table 8Robustness checks: Inequality controlling for legal origin
Dependentvariables →
Inequality measure: Gini,1960–98
Inequality measure: Share oftop quintile, 1960–98
Ordinary least squares omittinginequality
lgdppc kkz2002 sec9802 lgdppc kkz2002 sec9802 lgdppc kkz2002 sec9802
Inequality measure −0.20 −0.16 −7.54 −0.19 −0.15 −6.72(2.99)⁎⁎ (3.20)⁎⁎ (2.88)⁎⁎ (3.74)⁎⁎ (4.12)⁎⁎ (3.85)⁎⁎
leg_british 0.66 0.43 33.68 0.02 −0.02 10.65 −1.35 −1.17 −45.84(0.78) (0.68) (1.03) (0.03) (0.04) (0.54) (4.94)⁎⁎ (6.72)⁎⁎ (5.15)⁎⁎
leg_french 0.71 0.35 29.41 0.22 0.04 14.11 −1.39 −1.35 −49.01(1.01) (0.64) (1.08) (0.49) (0.10) (0.80) (5.56)⁎⁎ (8.97)⁎⁎ (6.20)⁎⁎
leg_socialist −1.44 −1.08 −12.00 −1.86 −1.39 −29.44 −1.35 −1.55 −33.81(2.43)⁎ (3.15)⁎⁎ (0.73) (3.86)⁎⁎ (5.60)⁎⁎ (2.48)⁎ (5.00)⁎⁎ (9.29)⁎⁎ (4.48)⁎⁎
Constant 16.03 6.78 372.35 16.74 7.17 384.56 9.17 1.31 112.65(6.86)⁎⁎ (3.91)⁎⁎ (4.09)⁎⁎ (8.15)⁎⁎ (4.97)⁎⁎ (5.39)⁎⁎ (44.27)⁎⁎ (11.61)⁎⁎ (18.48)⁎⁎
Observations 96 114 110 95 112 108 104 122 116R-squared 0.13 0.22 0.14F-statistics on
first stage forexcluded instrument
7.87 8.42 7.02 14.51 15.69 13.66
Robust t statistics in parentheses; ⁎ significant at 5%; ⁎⁎ significant at 1%.Source for legal origin data: La Porta et al. (1998).
769W. Easterly / Journal of Development Economics 84 (2007) 755–776
first stage regression with the instrument are a little weak for the Gini coefficient regressions, butacceptable for the regressions with share of top quintile (Table 8).
The tropics measure is the measure introduced by Sachs and coauthors: the share of thecountry's cultivated land area in tropical climate zones (hot and humid with no winter, which isthe most precise measure of tropical conditions).9 This robustness check is particularly important asthewheat–sugar ratio could be proxying for location in the tropics— after all tropical conditions are amajor determinant of whether you can grow wheat (no) or sugarcane (yes). However, the correlationis not exact, so we can examinewhether the inequality results survivewhenwe independently controlfor tropics. The answer is yes, and the tropics variable is not significant except in one of the schoolingregressions. The differential explanatory power of the instrument in the first stage regression alsosurvives intact. In contrast, both the magnitude of the coefficient on tropics and its significance isdrastically altered by controlling for inequality (compare last columns to previous ones in Table 9).
2.4. The exclusion restriction
One of the most problematic parts of any IV exercise is the exclusion restriction that theinstrument does not affect the second stage left-hand-side variable directly (including through anynon-inequality variable that does affect the LHS variable). How plausible is it that the wheat–sugar endowment does not directly affect level of development, schooling, and institutions, otherthan through its effect on inequality? There are two ways to address this question, although bothof them are only partially satisfactory: a priori intuition and econometric testing.
To make the problem worse, if the exclusion restriction fails in the schooling or institutionsregressions, this will create identification problems for the output regression, since schooling or
9 The data are from the Center for International Development at Harvard. The exact measure is share of cultivated landin Koppen–Geiger climate zones A and B.

Table 9Robustness checks: Effect of inequality on development outcomes controlling for share of tropical land
Dependentvariables →
Inequality measure: Gini,1960–98
Inequality measure: Share oftop quintile, 1960–98
Ordinary least squares omittinginequality measures
lgdppc kkz2002 sec9802 lgdppc kkz2002 sec9802 lgdppc kkz2002 sec9802
Inequality measure −0.11 −0.08 −3.58 −0.10 −0.08 −3.29(2.38)⁎ (2.68)⁎⁎ (2.76)⁎⁎ (2.58)⁎ (3.07)⁎⁎ (3.02)⁎⁎
Share of tropical land −0.24 −0.18 −19.12 −0.42 −0.29 −22.44 −0.94 −0.69 −39.36−0.54 −0.60 −1.61 −1.18 −1.17 (2.19)⁎ (4.37)⁎⁎ (4.63)⁎⁎ (5.66)⁎⁎
Constant 12.42 3.60 228.04 12.66 3.86 232.52 8.20 0.27 83.10(6.93)⁎⁎ (2.86)⁎⁎ (4.33)⁎⁎ (7.26)⁎⁎ (3.30)⁎⁎ (4.68)⁎⁎ (62.29)⁎⁎ (2.82)⁎⁎ (21.89)⁎⁎
Observations 95 116 111 95 113 109 100 121 114R-squared 0.15 0.13 0.20F-statistics on
first stage forexcluded instrument
10.5 10.5 14.51 16.74 22.81 23.09
Absolute value of t statistics in parentheses, ⁎ significant at 5%; ⁎⁎ significant at 1%.Source for share of tropical land: Sachs and Warner, 1997.
770 W. Easterly / Journal of Development Economics 84 (2007) 755–776
institutions affect output. One way of dealing with this at least for schooling is to test the effect ofinequality on total factor productivity (as reported for 1988 by Hall and Jones, 1999), whichpurges the effect of human capital on output. Table 10 below shows that inequality continues to besignificant in the productivity regressions.
Another a priori problem that must be addressed is that wheat and sugar might have direct incomeeffects through production. The theory of comparative advantage only partially mitigates thisconcern— it should not matter whether you have an advantage at producing one good or the other,because you can always specialize in what you are good at and trade for the other good. However,there may be wealth effects of good wheat land or good sugar land, and one type might be morevaluable than the other at whatever the world price turns out to be. Having said this, relative wheat–sugar wealth effects would seem fairly minor compared to the vast range of products that countriescan potentially produce.
Another bit of intuition and previous empirics thatmaymake the exclusion restriction problematicis the widespread idea of the “resource curse.” According to the resource curse idea, commoditywindfalls create bad political economy. Isham et al. (2005) provide the most recent survey of theliterature. They also make a new empirical contribution that echoes the finding of this paper —
Table 10Effect of inequality on log productivity in 1988 (log A) (from Hall and Jones, 1999)
Inequality measure Gini, 1960–98 Share of top quintile, 1960–98
Dependent variable Log A Log A
Coefficient on Inequality measure −0.06 −0.07(3.77)⁎⁎ (3.55)⁎⁎
Constant 10.72 11.32(14.62)⁎⁎ (11.88)⁎⁎
Observations 91 90F-statistics on first stage for excluded instrument 31.18 32.02
Robust t statistics in parentheses.⁎ significant at 5%; ⁎⁎ significant at 1%.

Table 11Robustness checks: effect of inequality on development outcomes controlling for commodity exporting dummy
Dependentvariables →
Inequality measure: Gini,1960–98
Inequality measure: Shareof top quintile, 1960–98
Ordinary least squares omittinginequality measures
lgdppc kkz2002 sec9802 lgdppc kkz2002 sec9802 lgdppc kkz2002 sec9802
Inequality measure −0.10 −0.08 −3.60 −0.10 −0.09 −3.71(4.09)⁎⁎ (4.24)⁎⁎ (5.08)⁎⁎ (3.83)⁎⁎ (4.37)⁎⁎ (5.06)⁎⁎
Dummy forcommodity exporter
−0.78 −0.31 −32.83 −0.73 −0.24 −28.61 −1.08 −0.50 −37.54(2.98)⁎⁎ (−1.51) (3.61)⁎⁎ (2.83)⁎⁎ (−1.2) (3.30)⁎⁎ (5.92)⁎⁎ (3.46)⁎⁎ (5.56)⁎⁎
Constant 12.12 3.48 231.50 12.88 4.30 252.40 8.18 0.19 80.52(12.37)⁎⁎ (4.37)⁎⁎ (7.88)⁎⁎ (10.25)⁎⁎ (4.50)⁎⁎ (7.45)⁎⁎ (78.92)⁎⁎ (2.45)⁎ (24.88)⁎⁎
Observations 97 118 113 96 114 110 107 128 120R-squared 0.21 0.07 0.21F-statistics on first
stage for excludedinstrument
24.91⁎⁎ 29.95⁎⁎ 28.11⁎⁎ 25.64⁎⁎ 33.57⁎⁎ 31.04⁎⁎
Robust t statistics in parentheses ⁎ significant at 5%; ⁎⁎ significant at 1%.Source for Commodity Exporter dummy: Easterly 2001.
771W. Easterly / Journal of Development Economics 84 (2007) 755–776
“point-source” commodity exports (such as sugarcane grown on plantations) are associated withworse institutions, and with worse recent growth, than “diffuse” commodity exports (such as wheatgrown on family farms). They argue that income from point-source commodities is more easilycaptured by the state and elites than diffuse commodities, which leads to worse institutions (theymention inequality as one of the mechanisms, although they are not trying to test different mecha-nisms against each other). Isham et al. focus on recent experience and note that they are not testing thelong run mechanisms; this paper complements theirs by focusing on the long run.
As long as the “resource curse” goes through inequality, then it is consistent with the approachof this paper. However, if it affects institutions and income directly through some other channel,then there is a problem with the exclusion restriction. Most of the political economy stories aboutthe resource curse do stress the (mis)behavior of a rich elite (including an elite that got rich fromappropriating commodity income either economically or politically), however, which makes onethink the inequality and resource curse stories are consistent.
Despite these arguments, it is certainly conceivable that the resource curse operates through otherchannels than through inequality. Oneway to address this is to introduce amore general measure of theresource curse than thewheat–sugar ratio and see if thewheat–sugar instrument has enoughdifferentialexplanatory power to discern an effect of inequality after controlling for thismore generalmeasure. Themeasure I choose is the dummy for commodity exporting from Easterly (2001). The wheat–sugarmeasure doesmuch better than thismeasure at explaining inequality in the first stage regression (see theF-statistic in Table 11).10 The commodity dummy is significant for income and schooling (although notfor institutions) in the second-stage regression, but inequality remains significant (Table 11).
The usual econometric approach to identification questions is to run a test of overidentification.These tests are far from definitive, as “passing the test” just means failure to reject the exclusionrestriction and the tests may have weak power. To run the test, we need an alternative instrument forinequality. The tropical variable described above is a good candidate, as used by this author in aprevious paper. There is considerable consensus in the literature that the tropics variable affects
10 In the earlier work I found the commodity dummy to be a good instrument, but here the wheat–sugar ration seems todo even better.

Table 12Overidentification tests: two-stage least squares regressions of development outcomes on inequality with tropicsinstrument in addition to lwheatsugar
lgdppc kkz2002 sec9802
IV regressions on Gini coefficientInequality −0.123 −0.096 −4.933
(3.91)⁎⁎ (4.11)⁎⁎ (4.15)⁎⁎
Constant 13.119 4.117 279.786(9.65)⁎⁎ (4.12)⁎⁎ (5.53)⁎⁎
Observations 95 116 111overidentification tests p-values:Sargan N*R-squared 0.6142 0.5734 0.1815Basmann test 0.6194 0.5778 0.184
IV Regressions on share of top quintileInequality −0.128 −0.098 −4.695
(3.99)⁎⁎ (4.50)⁎⁎ (4.47)⁎⁎
Constant 13.944 4.687 291.731(9.05)⁎⁎ (4.52)⁎⁎ (5.88)⁎⁎
Observations 95 113 109P-value of overid testSargan N*R-squared 0.2936 0.2886 0.0639Basmann test 0.2985 0.2926 0.0634
Absolute value of t statistics in parentheses.⁎ significant at 5%; ⁎⁎ significant at 1%.
772 W. Easterly / Journal of Development Economics 84 (2007) 755–776
income through social and political institutions rather than directly (this paper also failed to find anydirect significant effect of tropics on income above).11 For the tropical variable to be of use here, itseffects on institutions alsomust go through inequality rather than through any othermechanism. Thisis potentially problematic, but it is consistent with most stories in the literature that stress it is the richelites who are adopting “extractive strategies” in tropical places.
The results on the over-identification tests do fail to reject the exclusion restriction, by aconsiderable margin in all of the regressions except one (Table 12). The problematic one is theequation for schooling using the top quintile measure for inequality: the test would reject theexclusion restriction at the 10% level, which makes for a weak spot in the results on human capitaland inequality. Asmentioned before, this could also imply problems for the output regression (whichis a function of schooling); however, recall that the productivity regression still found a causal effectof inequality (and easily passes overidentification tests analogous to those discussed here). In all theother regressions, the margin by which the test fails to reject is large. So, subject to the usual seriouscaveats, the data provide no evidence in five out of the six regressions that the wheat–sugarendowment affects development outcomes by any other channel than through inequality.
3. Conclusions
This paper suggests that the conflicting results in the literature on inequality and growth aremissing the big picture on inequality and long-run economic development. Consistent with theprovocative hypothesis of Engermann and Sokoloff (1997) and Sokoloff and Engerman (2000),this paper supports the prediction that agricultural endowments – specifically the relative
11 See for example Acemoglu et al. (2005a,b), Easterly and Levine (2003), and Rodrik et al. (2004).

773W. Easterly / Journal of Development Economics 84 (2007) 755–776
abundance land suitable for wheat to that suitable for sugarcane – predict structural inequality andthat structural inequality predicts development outcomes. The failure to reject the overidentifyingrestrictions in the system is subject to considerable caveats about the power of such tests and isproblematic in one regression. However, it otherwise fails to find evidence that the wheat–sugarland ratio has any other effect on underdevelopment other than through inequality. The iden-tification problem of establishing causality from inequality to development outcomes is unlikelyto be regarded as completely resolved in any cross-country data exercise, including this one, butthe results in this paper support a well-defined a priori hypothesis in which inequality causedunderdevelopment.
This paper thus confirms the ES hypothesis on the mechanisms – institutions and schooling –by which higher inequality hinders development. While also finding evidence consistent withother development fundamentals, the paper finds high structural inequality to be a large andstatistically significant hindrance to developing the mechanisms by which economic developmentis achieved. This paper argues that the previous literature has missed the big picture— inequalitydoes cause underdevelopment.
Appendix A. LWHEATSUGAR by country
Algeria
0.0404 Greece 0.2231 Norway(continued on n
0.0535
Argentina 0.2895 Guatemala −0.3314 Pakistan 0.1462 Armenia 0.1120 Guinea −0.0035 Panama −0.1036 Australia 0.1347 Guyana −0.0997 Papua New Guinea −0.0431 Austria 0.4380 Honduras −0.1246 Paraguay −0.1519 Azerbaijan 0.0877 Hungary 0.4383 Peru −0.0979 Bangladesh 0.1280 India −0.0045 Philippines −0.2045 Belarus 0.4833 Indonesia −0.0454 Poland 0.3491 Belgium 0.4392 Iraq 0.1628 Portugal 0.3409 Bolivia −0.1195 Ireland 0.1005 Romania 0.3268 Bosnia-Herzegovina 0.5281 Israel 0.2877 Russia 0.3002 Botswana 0.0088 Italy 0.3287 Rwanda −0.0027 Brazil −0.0491 Ivory Coast −0.0428 Senegal 0.0000 Bulgaria 0.4086 Jamaica −0.3926 Serbia 0.3944 Burkina Faso 0.0000 Japan 0.2908 Sierra Leone −0.0096 Burundi 0.0110 Jordan 0.0071 Slovenia 0.4173 Cambodia −0.0201 Kazakhstan 0.0129 South Africa 0.1088 Canada 0.1019 Kenya 0.1298 Spain 0.0649 Cent. Afr. Rep. −0.0407 Korea, South 0.2493 Sri Lanka −0.0565 Chad 0.0000 Kyrgyzstan 0.0104 Sudan −0.0025 Chile 0.2481 Laos −0.0497 Suriname −0.1921 China 0.0850 Latvia 0.4253 Swaziland 0.0719 Colombia −0.0946 Lebanon 0.1190 Sweden 0.1777 Costa Rica −0.1385 Lesotho 0.1342 Switzerland 0.5439 Czech Republic 0.4749 Lithuania 0.4986 Tanzania 0.0671 Denmark 0.4419 Macedonia 0.1828 Thailand −0.0054 Dominican Republic −0.2175 Madagascar −0.0544 Tunisia 0.1173 Ecuador −0.0257 Malaysia −0.0889 Turkey 0.1601 Egypt 0.0000 Mali 0.0000 Turkmenistan 0.0000 El Salvador −0.0138 Mauritania 0.0000 Uganda −0.1508 Estonia 0.3529 Mexico 0.0047 Ukraine 0.3094 Ethiopia 0.1664 Moldova 0.1976 United Kingdom 0.3385 Fiji −0.0961 Mongolia 0.0000 United States 0.3830ext page)
Appendix A (continued)
774 W. Easterly / Journal of Development Economics 84 (2007) 755–776
Finland
0.0206 Myanmar 0.0212 Uruguay 0.5775 France 0.4375 Nepal 0.0776 Venezuela −0.0544 Gabon −0.2017 Netherlands 0.3398 Vietnam −0.0786 Gambia 0.0000 New Zealand 0.1234 Zambia 0.0508 Georgia 0.3854 Nicaragua −0.1593 Zimbabwe 0.0084 Germany 0.4452 Niger 0.0000 Ghana −0.0078 Nigeria −0.0048References
Abbott, George C., 1990. Sugar. Routledge, New York.Acemoglu, Daron, 2005. The Form of Property Rights: Oligarchic vs. Democratic Societies, MIT Mimeo, April 2005.Acemoglu, Daron, Johnson, Simon, Robinson, James, 2001. The colonial origins of comparative development. American
Economic Review 91 (5), 1369–1401.Acemoglu, Daron, Johnson, Simon, Robinson, James, 2002. Reversal of Fortune: Geography and Institutions in the
Making of the Modern World Income Distribution. Quarterly Journal of Economics, Vol. 117, 1231–1294.Acemoglu, Daron, Johnson, Simon, Robinson, James, 2005a. Institutions as the fundamental determinant of long term
growth. In: Aghion, Philippe, Durlauf, Steven (Eds.), Handbook of Economic Growth. Elsevier.Acemoglu, Daron, Johnson, Simon, Robinson, James A., 2005b. “A Response to Albouy's ‘A Reexamination Based on
Improved Settler Mortality Data’,” MIT (Economics Department), mimeo.Albouy, David, 2006. The Colonial Origins of Comparative Development: A Reexamination Based on Improved Settler
Mortality Data, mimeo, Berkeley, May 2006.Alesina, Alberto, Rodrik, Dani, 1994. Distributive politics and economic growth. Quarterly Journal of Economics 108, 465–490.Alesina, Alberto, Ozler, Sule, Roubini, Nouriel, Swagel, Phillip, 1996. Political instability and economic growth. Journal
of Economic Growth 1 (2), 189–211 (June).Alesina, Alberto, Baqir, Reza, Easterly, William, 1999. Public goods and ethnic divisons. Quarterly Journal of Economics
CXIV (4), 1243–1284 (November).Alesina, Alberto, Devleeschauwer, Arnaud, Easterly, William, Kurlat, Sergio, Wacziarg, Romain, 2003. Fractionalization.
Journal of Economic Growth 8, 155–194.Anand, Sudhir, Kanbur, S.M.R., 1993. Inequality and development: a critique. Journal of Development Economics 41,
19–43 (June).Atkinson, A.B., Brandolini, A., 2001. Promises and pitfalls in the use of secondary data-sets: income inequality in OECD
countries as a case study. Journal of Economic Literature 39 (3), 771–800.Banerjee, Abhijit V.,Duflo, Esther, 2003. Inequality and growth:what can the data say? Journal of EconomicGrowth 8 (3 Sep),
267–299.Banerjee, Abhijit, Iyer, Lakshmi, 2005. History institutions and economic performance: the legacy of colonial land tenure
systems in India. American Economic Review 95 (4), 1190–1213.Banerjee, Abhijit V., Newman, Andrew F., 1993. Occupational choice and the process of development. Journal of Political
Economy 101 (2), 274–298.Barro, R.J., 2000. Inequality and Growth in a Panel of Countries. Journal of Economic Growth 5, 5–32.Beck, Thorsten, Levine, Ross, Loayza, Norman, 2000. Finance and the sources of growth. Journal of Financial Economics
58, 261–300 (October).Benabou, Roland, 1996. Inequality and Growth, NBERMacroeconomics Annual 1996. In: Bernanke, Ben S., Rotemberg,
Julio (Eds.), MIT Press, Cambridge, pp. 11–74.Birdsall, Nancy, Ross, David, Sabot, Richard, 1995. Inequality and growth reconsidered: lessons from east Asia. World
Bank Economic Review 9 (3), 477–508 (September).Bloom, David E., Sachs, Jeffrey D., 1998. Geography, demography, and economic growth in Africa. Brookings Papers on
Economic Activity 2.Blume, Helmut, 1985. Geography of Sugar Cane: Environmental, Structural, and Economical Aspects of Cane Sugar
Production. Verlag Dr. Albert Bartens, Berlin.Bourguignon, François, Verdier, Thierry, 2000. Oligarchy, democracy, inequality and growth. Journal of Development
Economics 2 (62), 285–313.

775W. Easterly / Journal of Development Economics 84 (2007) 755–776
Brandolini, Andrea, Smeeding, Timothy M., 2005. Patterns of Economic Inequality in Western Democracies: Some Factson Levels and Trends, Bank of Italy and Syracuse University mimeo.
Clarke, George, 1995. More evidence on income distribution and growth. Journal of Development Economics 47, 403–427.Deininger, Klaus, Squire, Lyn, 1996. A new data set measuring income inequality. World Bank Economic Review 10 (3),
565–591.Deininger, Klaus, Squire, Lyn, 1998. New ways of looking at old issues: inequality and growth. Journal of Development
Economics 57 (2), 259–287.Easterlin, Richard A., 1981. Why isn't the whole world developed? Journal of Economic History 41 (1), 1–19 (March).Easterly, William, 2001. The middle class consensus and economic development. Journal of Economic Growth 6 (4),
317–336 (December).Easterly, William, Levine, Ross, 1997a. Africa's growth tragedy: policies and ethnic divisions. Quarterly Journal of
Economics CXII (4), 1203–1250.Easterly, William, Levine, Ross, 1997b. Tropics, germs, and crops: the role of endowments in economic development.
Journal of Monetary Economics 50 (1) (January 2003).Engermann, Stanley, Sokoloff, Kenneth, 1997. Factor endowments, institutions, and differential paths of growth among
new world economies: a view from economic historians of the United States. In: Haber, Stephen (Ed.), How LatinAmerica Fell Behind. Stanford University Press, Stanford CA.
Engerman, Stanley L., Sokoloff, Kenneth L, 2005. “The evolution of suffrage institutions in the Americas,” Journal ofEconomic History 65 (4), 891–921.
Engerman, Stanley L., Mariscal, Elisa V., Sokoloff, Kenneth L., 2002. The Evolution of Schooling Institutions in theAmericas, 1800–1925. Working Paper. University of California, Los Angeles.
Fernandez, Raquel, Rogerson, R., 2001. Sorting and long-run inequality. Quarterly Journal of Economics 116 (4),1305–1341.
Fernandez, Raquel, Guner, Nezih, Knowles, John, 2005. Love and Money: A Theoretical and Empirical Analysis ofHousehold Sorting and Inequality. Quarterly Journal of Economics 120 (1), 273–344.
Food and Agriculture Organization (FAO) of the United Nations, 2005. How Good the Earth? Quantifying land resourcesin developing countries-FAO's agro-ecological zones studies. Rome http://www.fao.org/documents/show_cdr.asp?url_file=/docrep/T8300E/T8300E00.htm.
Forbes, Kristin, 2000. A reassessment of the relationship between inequality and growth. American Economic Review 90(4), 869–887.
Galor, E., Moav, O., 2006. Das Human Kapital: a theory of the demise of the class structure. Review of Economic Studies73 (1), 85–117.
Galor, Oded, Zeira, Joseph, 1993. Income distribution and macroeconomics. Review of Economic Studies 60, 35–52.Galor, E., Moav, O., Vollrath, D., 2006. Land inequality and the emergence of human capital promoting institutions.
Brown University Working Paper.Glaeser, Edward, LaPorta, Rafael, Lopes-de-Silanes, Florencio, Shleifer, Andrei, 2004. Do institutions cause growth?
Journal of Economic Growth 9 (3), 271–303.Hall, Robert E., Jones, Charles L., 1999. Why do some countries produce so much more output per worker than others?
Quarterly Journal of Economics 114 (1), 83–116.Harlan, Jack R., 1992. Crops and Man. American Society of Agronomy, Madison WI.Isham, Jonathan, Woolcock, Michael, Pritchett, Lant, Busby, Gwen, 2005. The varieties of resource experience: natural
resource export structures and the political economy of economic growth. The World Bank Economic Review 19,141–174.
Kaldor, Nicholas, 1956. Alternative theories of distribution. Review of Economic Studies 23, 94–100.Kaldor, Nicholas, 1961. Capital accumulation and economic growth. In: Lutz, F.A., Hague, D.C. (Eds.), The Theory of
Capital. St. Martin's Press, New York.Kaufmann, Daniel, Kraay, Aart, Zoido-Lobatón, Pablo, 1999a. Aggregating governance indicators. World Bank Research
Working Paper 2195.Kaufmann, Daniel, Kraay, Aart, Zoido-Lobatón, Pablo, 1999b. Governance matters. World Bank Research Working Paper
2196.Khan, B. Zorina, Sokoloff, Kenneth L., 2004. The innovation of patent systems in the nineteenth century: a comparative
perspective, National Bureau of Economic Research, Working Paper.Krueger, Anne O., 1968. Factor endowments and per capita income differences among countries. The Economic Journal
641–659.La Porta, Rafael, Lopez-de-Silanes, Florencio, Shleifer, Andrei, Vishny, Robert W., 1998. Law and finance. Journal of
Political Economy 106 (6), 1113–1155 (December).
776 W. Easterly / Journal of Development Economics 84 (2007) 755–776
La Porta, Rafael, Lopez-de-Silanes, Florencio, Shleifer, Andrei, Vishny, Robert, 1999. The quality of government. Journalof Law, Economics, and Organization 15, 222–279.
Levine, Ross, 1999. Law, finance, and economic growth. Journal of Financial Intermediation 8 (1/2), 36–67.Levine, Ross, 2005. Law, endowments, and property rights. Journal of Economic Perspectives 19 (3), 61–88 (Summer).Levine, Ross, Loayza, Norman, Beck, Thorsten, 2000. Financial intermediation and growth: causality and causes. Journal
of Monetary Economics 46 (1), 31–77 (August).Lindert, Peter, 2000. Three centuries of inequality in Britain and America. In: Atkinson, Anthony, Bourguignon, Francois
(Eds.), Handbook of Income Distribution, vol. 1. Elsevier, Amsterdam.Lindert, Peter, Williamson, Jeffrey, 2003. Does globalization make the world more unequal? In: Bordo, Michael D.,
Taylor, Alan M., Williamson, Jeffrey G. (Eds.), Globalization in Historical Perspective. University of Chicago Pressfor the NBER, Chicago, pp. 227–270.
Mankiw, Gregory N., 1995. The Growth of Nations. Brookings Papers on Economic Activity, Vol 1, 273–326.Mankiw, N. Gregory, David Romer, David Weil, 1992. A Contribution to the Empirics of Economic Growth. The
Quarterly Journal of Economics, Vol 107, No.2, 407–437.Mauro, Paolo, 1995. Corruption and growth. Quarterly Journal of Economics 110 (3), 681–712.Mitchell, Brian (Ed.), 2003. International Historical Statistics 1750–2000, 3 Volumes Covering Europe, The Americas,
Africa, Asia and Oceania. Palgrave MacMillan, London.Perotti, Roberto, 1996. Growth, income distribution, and democracy: what the data say. Journal of Economic Growth 1,
149–188.Persson, Torsten, Tabellini, Guido, 1994. Is inequality harmful for growth? American Economic Review 84, 600–621.Przeworski, Adam 2004. Institutions matter? Government and Opposition 39 (4), 527–540 (Autumn 2004).Raghuram, Rajan, Zingales, G. Luigi, 2006. The Persistence of Underdevelopment: Institutions, Human Capital, or
Constituencies? NBER Working Paper No. 12093 Issued in March 2006.Ravallion, Martin, 1997. A note on Rati Ram's Test of the Kuznets hypothesis. Economic Development and Cultural
Change 46 (1), 187–190 (October).Rodrik, Dani, Subramanian, Arvind, Trebbi, Francesco, 2004. Institutions rule: the primacy of institutions over geography
and integration in economic development. Journal of Economic Growth 9 (2), 131–165.Sachs, Jeffrey, Warner, Andrew, 1997. Fundamental sources of long-run growth. American Economic Review Papers and
Proceedings 87 (2), 184–188 (May).Schultz, Theodore W., 1963. The Economic Value of Education. Columbia University Press, New York.Sokoloff, Kenneth L., Engerman, Stanley L., 2000. Institutions, factor endowments, and paths of development in the New
World. Journal of Economic Perspectives 14 (3), 217–232.Sokoloff, Kenneth L., Zolt, Eric M., 2005. Inequality and the evolution of institutions of taxation: evidence from the
economic history of the Americas, paper presented at NBER Workshop on Political Economy. November.Staiger, D., Stock, J.H., 1997. Instrumental variables regression with weak instruments. Econometrica 65, 557–586.Stock, James H., Yogo, Motohiro, 2002. Testing for weak instruments in linear IV Regression. Technical Working Paper
284. October (Revised 2004).Summers, Robert, Heston, Alan, 1991. The Penn World Table (Mark 5): An Expanded Set of International Comparisons,
1950–1988, Quarterly Journal of Economics, May 1991, vol. 106, iss. 2, pp. 327–368.Vanhanen, Tatu, in press. Democratization: A Comparative Analysis of 170 Countries. London: Routledge. Data and
documentation available at http://www.fsd.uta.fi/english/data/catalogue/FSD1216/.Woolcock, Michael, Pritchett, Lant, Isham, Jonathan, 2001. The social foundations of poor economic growth in resource-
rich economies. In: Auty, R.M. (Ed.), Resource Abundance and Economic Development. UNU/WIDER Studies inEconomic Development Economics. Oxford University Press.
World Bank, 1993. The East Asia Miracle. Oxford University Press.World Bank, 2005. World Development Report 2006: Equity and Development. World Bank and Oxford University Press,
Washington DC.World Institute for Development Economics Research (WIDER), 2000, World Income Inequality Database, Version 1.0,
User Guide and Data Sources.

![Finance and Inequality - Berkeley-Haasfaculty.haas.berkeley.edu/ross_levine/Papers/finance and inequality... · Researchers have compiled measures of income inequality for [5] many](https://static.fdocuments.in/doc/165x107/5ae047507f8b9a1c248cfe8a/finance-and-inequality-berkeley-and-inequalityresearchers-have-compiled-measures.jpg)