Inequalities in health outcomes in rural areas
86
1 Inequalities in health outcomes in rural areas
Transcript of Inequalities in health outcomes in rural areas

1
Inequalities in health outcomes in rural areas

2
Table of Contents 1. Introduction ................................................................................................................................................ 6 1. Introduction ................................................................................................................................................ 6
1.1 Background .......................................................................................................................................... 6 1.2 Aims of Project .................................................................................................................................... 7
2. Literature Review ...................................................................................................................................... 8 2.1 What is rural? ....................................................................................................................................... 8 2.2 Rural life .............................................................................................................................................. 9 2.3 Deprivation ........................................................................................................................................ 10 2.4 Provision and access to health services in rural areas ....................................................................... 12 2.5 Mortality ............................................................................................................................................ 15 2.6 Life expectancy .................................................................................................................................. 16
3. General Methods ...................................................................................................................................... 17 3.1 Rural and urban classification ........................................................................................................... 17 3.2 Deprivation ........................................................................................................................................ 19 3.3 National Statistics Socio-economic Classification (NS-SEC) ........................................................... 21
4. Variations in mortality between rural and urban areas in England, 2001-07 .......................................... 22 4.1 Introduction ........................................................................................................................................ 22 4.2 Methods ............................................................................................................................................. 22
Data Sources ........................................................................................................................................ 22 Analysis ............................................................................................................................................... 23
4.3 Results ................................................................................................................................................ 23 Age-standardised mortality rates for all-causes of death ..................................................................... 23 Age-standardised mortality rates for specific causes of death ............................................................. 25 Logistic regression analysis ................................................................................................................. 28
4.4 Limitations ......................................................................................................................................... 30 4.5 Key Findings ...................................................................................................................................... 30 4.6 Conclusion ......................................................................................................................................... 31
5. Mortality and access to emergency services between rural and urban areas ........................................... 32 5.1 Introduction ........................................................................................................................................ 32 5.2 Methods ............................................................................................................................................. 32
Mortality .............................................................................................................................................. 32 Fatality ................................................................................................................................................. 33 Distance ............................................................................................................................................... 33 Logistic regression ............................................................................................................................... 33
5.3 Results ................................................................................................................................................ 35 Mortality .............................................................................................................................................. 35 Fatality ................................................................................................................................................. 35 Distance ............................................................................................................................................... 36 Fatality and distance ............................................................................................................................ 38 Logistic regression ............................................................................................................................... 40
5.4 Limitations ......................................................................................................................................... 42 5.5 Key Findings ...................................................................................................................................... 43 5.6 Conclusions ........................................................................................................................................ 44
6. Self-reported health perception and migration in rural areas .................................................................. 45 6.1 Introduction ........................................................................................................................................ 45 6.2 Methods ............................................................................................................................................. 46

3
Data sources ......................................................................................................................................... 46 Analysis ............................................................................................................................................... 46
6.3 Results ................................................................................................................................................ 47 A. Largely working age household heads (aged 25 – 64) ................................................................... 47 B. Analysis of those aged 65 and over ................................................................................................ 54 C. Analysis of those aged under 25 ..................................................................................................... 55
6.4 Limitations ......................................................................................................................................... 57 6.5 Key Findings ...................................................................................................................................... 58 6.6 Conclusions ........................................................................................................................................ 58
7. Variations in life expectancy at birth between rural and urban areas of England, 2001-07 .................... 59 7.1 Introduction ........................................................................................................................................ 59
Life expectancy .................................................................................................................................... 59 7.2 Methods ............................................................................................................................................. 60
Data Sources ........................................................................................................................................ 60 Calculation of period life expectancy .................................................................................................. 60 Meaning of period life expectancy ...................................................................................................... 60
7.3 Results ................................................................................................................................................ 61 Life expectancy in rural and urban areas ............................................................................................. 61 Life expectancy in rural and urban settlement types ........................................................................... 62 Life expectancy in rural and urban sparsity contexts .......................................................................... 65
7.4 Limitations ......................................................................................................................................... 68 7.5 Key Findings ...................................................................................................................................... 69 7.6 Conclusion ......................................................................................................................................... 69
8. List of References .................................................................................................................................... 71 Appendix A – Glossary ............................................................................................................................... 195H76 71HAppendix B – Extra Tables/Maps ................................................................................................................ 196H81
Tables, Figures and Boxes 72HBox 2.1 Search terms ..................................................................................................................................... 197H8 73HBox 2.2 Indices of deprivation ..................................................................................................................... 198H11 74HBox 3.1 Rural Urban Area Classification 2004 ........................................................................................... 199H18 75HBox 3.2 Index of Multiple Deprivation domains and weights 2004 and 2007 ............................................ 200H20 76HTable 3.4 Number of LSOAs in England by RUAC 2004 and IMD 2007 quintile, 2001-07 ..................... 201H20 77HBox 4.1: Causes of death investigated, with corresponding percentage of all deaths and International
Classification Diseases, Tenth Revision (ICD-10) codes .................................................................... 202H23 78HTable 4.2: Age-standardised mortality rates (all-cause) by sex and rural and urban class, England, 2001-
07 ......................................................................................................................................................... 203H24 79HFigure 4.3: Age-standardised mortality rates (all-cause) by sex and rural and urban class, England, 2001-
07 ......................................................................................................................................................... 204H25 80HTable 4.4 Age-standardised mortality rates for selected causes of death by sex and rural/urban class,
England, 2001-07 ................................................................................................................................. 205H26 81HFigure 4.6 Coronary Heart Diseases: Age standardised rates by sex and urban/rural class, England, 2001-
07 ......................................................................................................................................................... 206H27

4
Figure 4.7 Stroke and related diseases: Age standardised rates by sex and urban/rural class, England, 2001-07 ................................................................................................................................................ 27
Figure 4.8 All cancers: Age standardised rates by sex and urban/rural class, England, 2001-07 ............... 28 Figure 4.9 Suicide: Age standardised rates by sex and urban/rural class, England, 2001-07 ..................... 28 Table 4.10 Odds ratios for mortality in rural areas relative to urban areas, before and after adjustment for
deprivation, England, 2001-2007 ........................................................................................................ 29 Figure 5.2 Age-standardised mortality rates per 100,000 population, where acute myocardial infarction
was the underlying cause of death, by RUAC 2004 settlement types and IMD 2004 deprivation quintiles, England, 2008 ...................................................................................................................... 35
Figure 5.3 Age-standardised fatality rate per 1,000 population, where acute myocardial infarction was the underlying cause of death, by RUAC 2004 settlement types and IMD 2004 deprivation quintiles, England, 2008 ...................................................................................................................................... 36
Figure 5.4 Mean distance to nearest Accident and Emergency unit for persons who died where the underlying cause of death was acute myocardial infarction, by RUAC 2004 settlement types and IMD 2004 deprivation quintiles, England, 2008 ................................................................................. 37
Table 5.5 Age-standardised fatality rates per 1,000 population, where acute myocardial infarction was the underlying cause of death, by the urban settlement type of the RUAC 2004 and IMD 2004 deprivation quintile, England, 2008 ..................................................................................................... 38
Figure 5.6 Age-standardised fatality rates per 1,000 population and mean distance to nearest accident and emergency unit, where acute myocardial infarction was the underlying cause of death, by the urban settlement type of the RUAC 2004 and IMD 2004 deprivation quintiles, England, 2008 .................. 39
Figure 6.2 Age distribution of household heads aged 25 to 64, by settlement type, England, Census 2001 ............................................................................................................................................................. 47
Figure 6.3 Composition of household heads aged 25 to 64, by settlement type, England, Census 2001 ... 48 Figure 6.4 Presence of LLTI in 2001, for Household Reference Persons aged 25 to 64, by settlement type
in 2001, England .................................................................................................................................. 49 Table 6.5 – Percentage of population reporting an LLTI in 2001, household heads aged 25 to 64, by
settlement type, England ...................................................................................................................... 49 Table 6.6 – Percentage of household heads aged 25 to 64 who moved from a rural to an urban area
between 2000 and 2001, by age, England ........................................................................................... 50 Table 6.7 – Percentage of household heads aged 25 to 64 who moved from a rural to an urban area
between 2000 and 2001, by household composition, England ............................................................ 51 Table 6.8 – Percentage of household heads aged 25 to 64 who moved from a rural to an urban area
between 2000 and 2001, by presence of LLTI, England ..................................................................... 51 Table 6.9 Odds ratios of moving from a rural to an urban area between 2000 and 2001, for Household
Reference Persons aged 25 to 64, having reported an LLTI (relative to no reported LLTI), in 2001, England ................................................................................................................................................ 52
Table 6.12 Odds ratios of moving from a rural to an urban area between 2000 and 2001, for Household Reference Persons aged 25 to 64, having reported an LLTI (relative to no reported LLTI), 2001, adjusted by NS-SEC, England ............................................................................................................. 53
Table 6.13 – Percentage of household heads aged 65 and over who moved from a rural to an urban area between 2000 and 2001, by presence of LLTI, England ..................................................................... 54
Table 6.14 Odds ratios of moving from a rural to an urban area between 2000 and 2001, having reported an LLTI (relative to no reported LLTI), 2001, England ...................................................................... 54
Table 6.16 Odds ratios of moving from a rural to an urban area between 2000 and 2001, having reported an LLTI (relative to no LLTI), 2001, adjusted by NS-SEC, England ................................................. 55
Figure 6.17 Household composition of individuals aged under 25, England, Census 2001 ....................... 55

5
Table 6.18 Percentage of individuals aged under 25 who moved from a rural to an urban area between 2000 and 2001, by presence of LLTI, England ................................................................................... 56
Table 6.19 Odds ratios of moving from a rural to an urban area between 2000 and 2001, having reported an LLTI (relative to no reported LLTI), persons aged under 25, in 2001, England ............................ 56
Figure 7.1 Period life expectancy at birth by sex and rural/urban dichotomy of the RUAC 2004 and IMD 2007 quintile, England, 2001-07 ......................................................................................................... 62
Figure 7.2 Period life expectancy at birth by sex and settlement type of the RUAC 2004, England, 2001-07 ......................................................................................................................................................... 63
Table 7.3 Period life expectancy at birth by sex and rural/urban settlement type of the RUAC 2004 and IMD 2007 quintile, England, 2001-07 ................................................................................................. 64
Figure 7.4 Period life expectancy at birth by sex and rural/urban settlement type of the RUAC 2004 and IMD 2007 quintile, England, 2001-07 ................................................................................................. 65
Figure 7.5 Period life expectancy at birth by sex and rural/urban sparsity context of the RUAC 2004, England, 2001-07 ................................................................................................................................. 66
Table 7.6 Period life expectancy at birth by sex and rural/urban sparsity context of the RUAC 2004 and IMD 2007 quintile, England, 2001-07 ................................................................................................. 67
Figure 3.2 Lower Super Output Areas in England by the Rural Urban Area Classification 2004 .............. 81 Figure 3.3 Lower Super Output Areas in England by the Index of Multiple Deprivation 2007 ................. 82 Table 6.10 Percentage of household heads, aged between 55 and 64, living in a couple family who moved
from a rural to an urban area between 2000 and 2001, by presence of limiting long-term illness, England ................................................................................................................................................ 85
Table 6.11 Percentage of household heads, aged between 55 and 64, not living in a family but a pensioner household who moved from a rural to an urban area between 2000 and 2001, by presence of limiting long-term illness, England ................................................................................................................... 85
Table 6.15 Percentage of household heads, aged between 65 and 74, living in a couple family who moved from a rural to an urban area between 2000 and 2001, by presence of limiting long-term illness, England ................................................................................................................................................ 85
Table 6.20 Percentage of individuals, aged between 16 and 24, who were non-dependent children who moved from a rural to an urban area between 2000 and 2001, by presence of LLTI, England .......... 86
Table 6.21 Percentage of individuals, aged between 16 and 24, who were living in a couple who moved from a rural to an urban area between 2000 and 2001, by presence of limiting long-term illness, England ................................................................................................................................................ 86
Table 6.22 Percentage of individuals, aged between 16 and 24, who were not in a family who moved from a rural to an urban area between 2000 and 2001, by presence of limiting long-term illness, England ............................................................................................................................................................. 86
6
1. Introduction
1.1 Background
There is a common notion of a ‘rural idyll’ and associated beliefs that rural populations are healthier than their urban counterparts. Various environmental, social and economic factors are often thought to contribute to better rural health. For instance, the availability of clean air, green space and the opportunity for healthy exercise is widely considered to have significant health advantages.
Only 2 per cent of rural lower super output areas are classified as being the most deprived deprivation quintile compared with 24 per cent of urban areas (page 20) and there is increasing evidence of gentrification (whereby better-off people migrate to the countryside and displace those who are less affluent) in rural settlements (Commission for Rural Communities 2008; Joseph Rowntree Foundation 2000). However, these observations may mask important differences within rural areas, which mean that inequalities are sometimes hidden by favourable averages (Haynes and Gayle 2000).
Rural populations tend to be older than those in urban areas. Ageing is strongly associated with greater healthcare needs, although it has been suggested that rural communities receive relatively less funding than urban areas, meaning that rural health needs may be unmet (Commission for Rural Communities 2008). Rural dwellers are also affected by issues such as the centralisation of services in urban localities, meaning that the distance and length of time to access to health and social care may be greater for those living in rural areas. Suppositions that people in rural areas experience better health advantages are therefore frequently challenged (Asthana et al 2002).
Past research into geographical health inequalities in the UK has often focused on variations between administrative areas, sometimes incorporating measures of socio-economic circumstances. There has been relatively little analysis into health inequalities between rural and urban areas, or particularly within rural areas.
The main aim of this project was to examine certain health advantages and disadvantages in different types of rural areas. This was done by investigating a number of health indicators (including access to services for 2008, mortality for 2001 to 2007 and life expectancy for 2006/08 ) to produce results which provide evidence of the needs of rural communities, which can then help to inform understanding of public policy and delivery.

7
1.2 Aims of Project This project carries out analysis designed to answer the following questions:
• Do differences in mortality rates that exist between rural and urban areas mask much larger differences in these rates between more specific types of rural and urban areas?
• Is there an association between the numbers of deaths linked to poor access to
emergency services - Acute Myocardial Infarction/Heart Attack (AMI) – and are those living in particular rural areas at higher risk of death than others?
• Do people’s perceptions of their own health differ with degree of rurality, is there
evidence that people are more likely to have moved out of rural areas if they report their health to be poor, and what is the influence of socio-economic status?
• Does deprivation in a rural areas have a greater, lesser or similar effect on life
expectancy than deprivation in an urban area?

8
2. Literature Review The purpose of this literature review is to provide an overview and critical assessment of previous work relating to inequalities in health outcomes in rural areas, focusing on definitions and conceptualisations of rurality, rural life, deprivation, provision and access to health services in rural areas, mortality, and life expectancy. Implications for the ONS research programme are also discussed. The literature search was primarily conducted using bibliographical databases and combinations of the key terms listed in Box 1. The search was restricted to work based on the United Kingdom (UK) and its constituent countries published between 1997 and 2009. With the exception of literature included to provide historical context, articles produced prior to these years were excluded since definitional terms and the relevance of data are limited, making comparative interpretations problematic. A number of ‘grey literature’ reports were secondarily identified and are included in the review where appropriate to provide broader perspectives. In total, the literature search yielded hundreds of papers that met the inclusion criteria; of these 50 papers most relevant to the project were included in the literature review. Box 2.1 Search terms
2.1 What is rural? There are numerous definitions and conceptualisations in the literature of what constitutes ‘rural’ and ‘urban’. The way in which these concepts are defined and understood influences the approach taken to research (Higgs, 1999). Until the early 1990s, work on health inequalities and geographical variations focused predominantly on urban matters (Phillimore and Reading, 1992; Higgs, 1999). However, more recently there has been increasing attention towards rural health, which is the primary focus of this research. Definitions and measures used in the literature to distinguish rural and urban areas relate to settlement size, population density, distance to nearest neighbour and accessibility of facilities, land-use, and multivariate area classifications (Asthana et al., 2002; Martin et al., 2000). Rurality has also been conceptualised in terms of area descriptions, socio-cultural characteristics, economic and population structural features, and personal constructions (Farmer et al., 2001). However, it has been argued that ‘no univariate measure of rurality can hope adequately to capture such a complex multidimensional concept’ (Martin et al. 2000:739). The establishment of an encompassing and effective measure of rurality is therefore a challenging task for researchers.
Rural Outcomes Distance decay Urban Mortality Migration Health Life expectancy Perceptions Deprivation Service provision Self-report Disadvantage Service proximity England Inequality Service access/ibility Great Britain Socio-economic status Distance to services United Kingdom
9
Official classifications of rurality have been produced periodically by UK government departments (e.g. Wallace et al., 1995; ODPM, 2002). Most recently, the Rural and Urban Area Classification (RUAC) was developed and has since been adopted as a national standard measure (Bibby & Shepherd, 2004). This divides urban and rural areas into six categories according to their sparsity and settlement type, with two urban classes and four rural classes. It is a detailed and flexible classification that enables results to be produced for a simple rural/urban dichotomy as well as for the six individual classes. The RUAC has been used effectively in previous studies to report on the health profile of Wales (Gartner et al., 2007) and to measure differences in mortality between rural and urban areas in England and Wales (Gartner et al., 2008). It improves previous studies by incorporating a strong rural element, which will constitute the primary analysis in this research.
2.2 Rural life There is a commonly held belief that rural populations are inherently happier, healthier and more satisfied with life than their urban counterparts. A Scottish study reported that while most people are satisfied with health services, those living in remote rural locations are particularly so (Farmer et al., 2005). Rural life is often constructed as idyllic, tranquil and homogeneous. However, rather than a single notion of an idyll, there are many discourses, both academic and lay, of pluralistic idylls that highlight the ways in which people in the countryside live their lives differently (Cloke et al., 1997; Watkins and Jacoby, 2007, British Medical Association, 2005). There is arguably more variation within rural populations than between them. Indeed, Haynes and Gayle observe that ‘wealthy and poor live next door to each other in rural England’ (2000:284). Some literature has focused upon the views of people living in rural areas, which reveals both positive and negative elements of rural life. Findings from a study of rural residents’ perceptions demonstrate various themes that are associated with their lifestyles, which include issues of variable housing availability and gentrification, limited employment opportunities, contrasts between high and low income statuses, issues of isolation, but also feelings of well-being (Cloke et al., 1997). In a study of elderly perspectives, there were positive findings relating to the sociability and support networks that develop in rural areas; however, problems such as a lack of affordable accommodation, decline and centralisation of services and accessibility were also raised (Manthorpe et al., 2008). Results from another study showed that villagers perceive many benefits of rural life in terms of health and social relations, which support the authors’ notion of a rural idyll (Watkins and Jacoby, 2007). In reality, many individuals experience stigma and social exclusion in the English countryside, which has a potential negative effect on their health (Watkins and Jacoby, 2007). An ethnographic study of a village in the South East of England reported that although residents were generally positive, informal comments and behaviour revealed that there were feelings of exclusion associated with aspects of rural life that prevented people from participating in society effectively (Watkins and Jacoby, 2007). Traditional perceptions of rural life as idyllic are therefore often refuted in the literature, and are regarded as romanticised portrayals, particularly those represented in the media (Watkins and Jacoby, 2007; Wenger, 2001). In the literature, there is evidence to suggest that people living in rural areas report better levels of health than those in urban areas. Self-reported health data is collected during the decennial

10
census and as part of other surveys. It can be used as an indicator of health inequalities and can be compared with health outcomes. However, although it is a useful measure, this variable is limited because individual health perceptions vary, often due to social and cultural differences (Levin, 2003). Nonetheless, it has been employed in previous studies to examine health differences between rural and urban areas. In Scotland, Levin (2003) used self-reported limiting long-term illness (LLTI) as a health indicator and reported that urban areas have the highest rates of illness and the largest variations, while rural areas have lower rates and smaller differences. In another study, self-reported health data from the 2001 census was used to examine associations between health and the amount of green space in an area (Mitchell and Popham, 2007). The results suggested that there was a relationship between better health and larger proportions of green space, although this was dependent on levels of urbanity and income deprivation in the area. In a further study, the relationship between self-reported health and mortality in the UK was shown to vary substantially across different regions, with the best heath and lowest mortality observed in southern England (O’Reilly et al., 2005). A recent study conducted by Riva et al. (2009) utilised data from the Health Survey for England. Individual responses were available for a representative sample of the national population. Based on the findings, it was reported that rural residents were less likely than those in cities to report their health as fair or poor, although significant health inequalities within small rural areas were identified which could not be explained by the characteristics of the local populations. In terms of internal migration within the UK, it has been claimed that people are more likely to move from urban to rural localities than from rural to urban (Commission for Rural Communities, 2008). In particular, while younger people are more likely to move to urban areas to study or seek employment, those aged over 35 are more likely to relocate to rural settlements for a perceived better quality of health or for retirement purposes (Commission for Rural Communities, 2008). Research into migration patterns suggests that the population in rural areas is older than populations in urban areas and this is a difference that needs to be reflected in the service provision for these communities (British Medical Association, 2005; Manthorpe et al., 2008).
2.3 Deprivation Like the concepts of ‘rural’ and ‘urban’, ‘deprivation’ has been defined and measured in a variety of ways. Other terms such as disadvantage, inequality, poverty and social exclusion are also frequently used in the literature to refer to this issue (Asthana et al., 2002). Broadly, there are two different types of deprivation; economic and social, which manifest themselves through numerous indicators. Several indices have been developed and employed in previous studies to quantify indicators of deprivation. These are summarised in Box 2.2. Using the indices, a total deprivation score or rank can be used for a specific geographic type or for individual index components, such as income or health.

11
Box 2.2 Indices of deprivation Index Measurement Geography Units Jarman (1983) Single parents
Single elderly Migrants Ethnic minorities Overcrowding Unemployment Unskilled manual workers Children aged under 5 years
UK Ward
Townsend (1986/8) Unemployment Car-ownership Home-ownership Over-crowding
UK Ward
Carstairs-Morris (1989)
Unemployment (males only?) Overcrowding Car-ownership Semi-skilled and unskilled social class
UK Ward
Index of Multiple Deprivation (IMD) (2000, 2004, 2007)
Income Employment Health and disability Education, skills and training Housing Geographical access to services Crime (2004)
England Lower Super Output Area
Welsh Index of Multiple Deprivation (WIMD) (2005)
Income Employment Health Education, skills and training Housing Physical environment Geographical access to services
Wales Lower Super Output Area
The relationships between rurality, deprivation and health have been frequently explored in previous studies. For example, Haynes and Gayle (2000) investigated the relationship between ill health and social deprivation in rural and urban areas, comparing results using the Jarman, Townsend and Carstairs-Morris measures. Illness and death rates were reported to be lower in rural wards and the worst deprivation scores were found in the larger urban centres. These patterns were observed irrespective of the deprivation index used and there was little variation reported between rural areas. Rather, differences were found within rural areas. While the Jarman, Townsend and Carstairs-Morris indices have been widely utilised, various criticisms have been raised against them in the literature. For example, the Townsend index has been criticised because it is insensitive to differences between rural and urban areas, which may misrepresent the extent of rural deprivation (Gilthorpe and Wilson, 2003; Gartner et al., 2007; Martin et al., 2000). The apparent urban bias in indices such as the Townsend index

12
means that rural issues can be overlooked, which has potential implications for resource allocation and service planning (Martin et al., 2000).
The most notable criticisms levelled against the Townsend and Carstairs-Morris indices concern the car-ownership indicator. It is argued that rural residents are more reliant on cars than urban dwellers (Gilthorpe and Wilson, 2003). Although car-ownership may be a good indicator of wealth in cities, high levels of ownership in rural areas may misrepresent the socio-economic conditions because it is often due to a lack of public transport provision rather than wealth (Haynes and Gayle, 2000). In a study of deprivation in Welsh rural areas, Townsend scores with and without the car-ownership indicator were compared, showing that the inclusion of this variable was less valid for use in rural areas (Christie and Fone, 2003). The Index of Multiple Deprivation (IMD) was introduced in 2000. The car-ownership variable was excluded as a deprivation measure due to the criticisms outlined above. Uniquely, it included geographical access to services as a measure of deprivation, which is an element that has been previously overlooked (Jordan et al., 2004a). A study that investigated premature LLTI and premature mortality using both the IMD 2000 and Townsend indices reported stronger correlations between the IMD and LLTI in rural areas than the Townsend index, although the indices produced similar results for premature mortality, showing poor correlations in rural areas but stronger in urban areas (Jordan et al., 2004a). The more recent IMD 2004 contained an additional indicator of crime. This index was used in a study to determine whether differences between rural and urban mortality are evident once area deprivation is taken into account (Gartner et al., 2008). Results for England indicated that urban areas were fairly evenly distributed in terms of deprivation quintiles, although there were more in the most deprived category. Conversely, most rural areas fell into the three least deprived categories. When adjustments were made for deprivation, differences between mortality in rural and urban areas were significantly reduced in males, but not in females. These studies demonstrate the importance of making adjustments for deprivation when examining differences between rural and urban areas. In the current research, the IMD 2007 will be used to measure deprivation.
2.4 Provision and access to health services in rural areas The founding principles of the National Health Service (NHS) state that services should be available to all (Bevan, 1952). The population distribution of urban and rural residents presents particular challenges for health policy-makers (Asthana et al., 2004; Jordan et al., 2004b). Asthana et al. (2003) state that there are cost variations associated with providing services for urban and rural areas and particular problems relating to economies of scale, travel cost, unproductive time and staffing issues. In terms of resource allocation, it is argued that adjustments need to be made to take account of differing needs in rural areas (Asthana et al., 2003). ‘Patient choice’ is a policy that was introduced in the NHS Plan (Department of Health, 2000) which relates to the geographical provision and accessibility of health services debate. For the year prior to its introduction, Propper et al. (2006) conducted a study which established that

13
rural residents travel longer distances for in-patient treatment and that those who are the most deprived travel shorter distances. In a later study, Haynes et al. (2003) used patient registration data at GP practices to analyse journey times to the nearest surgery and the surgery actually used by people in rural and urban areas. It was reported that although more choice was exercised in larger urban areas, public transport is an important factor that helps to increase the choice of those living in rural areas. It has been argued that rural patients are less likely to exercise choice in accessing health and the centralisation of services has a worsening effect (Baird, 2006). A distinction can be made between potential and realised (or effective) access to services (Gulliford et al., 2002; Asthana et al., 2002; Langford and Higgs, 2006). These terms refer to the physical availability and opportunities available to people, and the actual utilisation of services respectively. Due to a limited availability of realisation data and for pragmatic reasons, most studies and policies have focused on potential accessibility (Asthana et al., 2004; Langford and Higgs, 2006). One method of determining this is by calculating the number of doctors or hospital beds per capita (Gulliford et al., 2002). Further distinctions can be made here between the measurement of services that are delivered to the client and those that clients travel to, and between predictable (e.g. GP consultations) and unpredictable (e.g. emergency cases) provision (Asthana et al., 2002). In terms of realisation, it is difficult to measure utilisation and there are various personal, financial and organisational barriers that may prevent users from accessing care (Gulliford et al., 2002). Various methods have been employed in previous studies to measure distances and access to health services. Martin et al. (2002) make a distinction between direct and indirect measures; direct measures include physical distances and travel times, and indirect measures include elements such as population density and distance to nearest neighbour. Common techniques reported in the literature to measure access include straight-line distances, travel times, and the use of journey-planning software. Geographic Information Systems (GIS) that can be used to illustrate the distribution of services and calculate straight-line distances are frequently highlighted (Higgs and White, 1997). The Bartholomew digital road network has also been widely employed to calculate average travel speeds (Jordan et al., 2004b; Martin et al., 2002). These methods can be combined with indicators of deprivation, for example, to map distances to selected types of services (Higgs and White, 1997). In a study of health service accessibility in the South West of England, straight-line distances and drive times to primary and secondary care facilities were compared (Jordan et al., 2004b). Overall, it was found that these were closely correlated. However, there were low correlations in peripheral areas. In such cases, travel distances are underestimated by straight-line distances, which are explained by sparse road networks and geographical barriers such as hills, rivers and coastline. In terms of health outcomes, it was reported that the highest rates of morbidity and mortality were found in the areas closest to hospitals, although there was some evidence of increasing rates in more remote areas. The authors concluded that drive time was a more accurate measure of access for peripheral and rural areas than straight-line distances. However, the extrapolation of these findings to other areas may be limited because the study focused only on one relatively affluent area of England that has a peninsular geography. In a study involving cancer patients in Northern England, GIS was used to estimate distances to services and travel times by car and public transport (Jones et al., 2008). Geographical
14
accessibility to primary care appeared to be more important for early diagnosis and survival than access to hospital, and long car journeys did not appear to have a serious impact on survival. In another study relating to the accessibility of services, ambulance service data was used to investigate the relationship between distance to hospital and patient mortality in emergencies (Nicholl et al., 2007). Using a sample of high priority 999 calls and incident grid references, straight-line distances to the hospital were calculated instead of journey times, as the researchers decided that journey times could be affected by the condition of the patient. Documentation was also obtained to determine the outcome of the emergency (survival or death). Longer distances were found to be associated with higher rates of mortality. However, the generalisation of this study to a wider context may be limited because it was observational and purposely selected high risk mortality cases were included. In addition, the data are now fairly dated and changes to ambulance services may have been implemented since. However, as a result of this study the authors argued that the closure of local hospitals could affect those with life-threatening conditions who have to travel further as a result. An additional study that analysed the availability of health care in English health authorities reported an association between higher numbers of GP’s and lower mortality (Gulliford et al., 2004). Lower utilisation rates were found after adjustments had been made for deprivation, social class and ethnicity, suggesting higher provision increases accessibility, and vice versa. Also, health authorities with a high proportion of rural patients were reported as having more favourable outcomes for population health and service utilisation, which the authors claimed was consistent with the inverse care law (that the availability of good medical care varies inversely with the need of the population). However, a similar study by Adams and White (2005) did not support the inverse care thesis. This study investigated access to general practices in the North East of England using the ‘access to services’ element of the IMD 2000. Deprived wards, particularly in rural areas, were reported to have a closer proximity to general practices. This analysis was restricted to one geographical area and the results may not be applicable for other areas with different populations and levels of service provision. Many writers are critical of the measures of accessibility used in previous studies. In terms of straight-line analyses, Jones et al. (2008) argue that roads rarely run directly from point A to point B, average travel speeds vary, and the availability of public transport varies significantly across different routes. In addition, Asthana et al. (2002) argue that this measurement is misrepresentative of access due to geographical barriers. Further, when measuring access, assumptions are often made that patients attend the nearest health facility and do not cross organisational boundaries (Langford and Higgs, 2006). Two issues concerning the interpretation of accessibility analyses are raised in the literature. Firstly, low utilisation rates could be indicative of either high levels of health or poor accessibility (Asthana et al., 2002). Secondly, access to services is only one aspect of the provision of health care; it does not ensure a high standard of care or that the services will be appropriately utilised (Adams and White, 2005).

15
2.5 Mortality Mortality is a strong indicator of health outcomes and inequalities. A mortality rate is a measure of the frequency of occurrence of deaths in a defined population during a specified time interval. Historically, variations in mortality between rural and urban areas have been observed by many commentators. In the seventeenth century, John Graunt documented higher mortality in London than in the countryside, which he attributed to urban environmental pollution (O’Reilly et al., 2007). Later, in the early twentieth century, high mortality was a major characteristic of all Western cities, arguably as a consequence of severe demographic crises such as disease epidemics (Woods, 2003). More recently, there are numerous studies in the UK that have investigated mortality in rural and urban areas, which have also taken deprivation into account. It is often assumed that death rates are highest in deprived urban localities, although notable differences can be observed across varying areas and groups. Previous studies in the UK report higher levels of all-cause mortality in urban areas than in rural areas. Using the RUAC 2004 and IMD 2004/WIMD 2005, Gartner et al. (2008) investigated differences in mortality across urban and rural areas of England and Wales. The results showed lower all-cause mortality rates in rural areas for males and females, although the rural rates were higher in Wales than in England. Geographically, mortality is reported to be higher in northern areas of England and Wales than in southern areas (Law and Morris, 1998). In Scotland, Levin and Leyland (2006) found that male mortality rates are higher in urban areas. Similar results were reported for females, although between 1998 and 2001, there were greater inequalities of mortality in remote rural areas than in urban areas. In Northern Ireland, mortality was reported to be lower in rural areas among adults; however, for children under the age of 15 and those aged 20-24, death rates were lower in urban areas (O’Reilly et al., 2007). For specific causes of death, differences have been observed between rural and urban areas. Many studies report higher suicide rates and deaths from external causes such as road traffic accidents in rural areas (Barnett et al., 2002; Riva et al., 2009; Gartner et al., 2007; O’Reilly et al., 2007; Levin and Leyland, 2005). However, it should be noted that such figures are often based on the usual residence of the deceased rather than the actual place in which the death occurred (Gartner et al., 2007). In urban areas, conditions such as circulatory and respiratory disease and cancer are often reported to be higher (O’Reilly et al., 2007; Gartner et al., 2007; Gartner et al., 2008). It is suggested that these findings could be explained by higher levels of pollution and internal migration (O’Reilly et al., 2007). Many studies incorporate area deprivation indicators into the analyses of mortality variations. In an investigation of wards in the Trent NHS Region, a positive correlation between higher levels of deprivation and poorer health status in urban and rural areas was reported for all-cause mortality (Huff et al., 1999). In another study conducted in Wales, it was found that mortality is higher and inequalities are wider in urban areas, although the tendency for lower mortality in rural areas was largely reduced when differences were controlled using deprivation measures (Senior et al., 2000). In a recent study, Gartner et al. (2008) also found that mortality rates were significantly reduced when adjustments were made for deprivation. For instance, all-cause mortality of males in rural areas of England was 15 per cent lower than in urban areas, although after adjustment this difference was reduced to 3 per cent. For specific causes, the largest differences between rural and urban areas were observed in lung cancer and respiratory disease, both before and after adjustments. However, deprivation does not account for all of the

16
differences observed. For suicides, only the differences in males in England were statistically significant. Suicide rates for this group were 10 per cent lower in rural areas before adjustment for deprivation, but 11 per cent higher after adjustment. The findings revealed in the literature therefore indicate that the inclusion of deprivation indicators in the analyses of mortality in rural and urban areas is important.
2.6 Life expectancy Life expectancy at birth has been used as a measure of the health status of the population in England and Wales since the 1840s. It was employed in some of the earliest reports of the Registrar General to illustrate the great differences in mortality experienced by populations in different parts of the country. Although life expectancy is a useful indicator of health outcomes, there are relatively few studies that have focused upon variations across rural and urban areas and between areas with different levels of deprivation. In a study by Woods et al. (2005), life expectancy at birth was calculated for each government office region in England and Wales and by quintiles of deprivation using the IMD 2000. The results showed a north-south gradient, with higher life expectancy in the south, which was most evident in males. Life expectancy was lower in the most deprived quintiles and vice versa. Linear regression was used to disentangle the effects of geography and deprivation on life expectancy, which indicated that the distribution of deprivation explained more of the geographical variation between the north and the south and different regions. A limited amount of research has focused on life expectancy in rural and urban localities. Citing Roderick (1999), Wenger (2001) states that although little evidence has been found of health differences between these areas, lower life expectancy is reported in urban areas. In Wales, between 1999 and 2003, urban wards had lower life expectancies at birth than rural wards, although in rural areas, there were more wards which were less sparse in the lowest life expectancy category than sparse wards (Gartner et al., 2007). Although the data used in these studies are dated, they illustrate general trends that have been observed across the UK. Similar analyses will be conducted in the current research to ascertain the differences in life expectancy across rural and urban areas, making adjustments for deprivation.

17
3. General Methods
3.1 Rural and urban classification
There are numerous definitions and conceptualisations in the literature of what constitutes rural and urban. The way in which these concepts are defined and understood influences the methods and findings of research (Higgs 1999). For statistical and analytical purposes, various classifications have been developed in past research to categorise urban and rural areas. For example, Haynes and Gayle (2000) constructed 4 urban and rural typologies based on ward population sizes and distance to a district general hospital. In another example, Huff et al (1999) developed a classification based on the grouping of enumeration districts into urban areas and their subsequent total population sizes. However, such classifications are often devised for individual studies and are therefore limited in the extent to which they can be compared. Further, they are often biased towards urban areas (Barnett et al 2002).
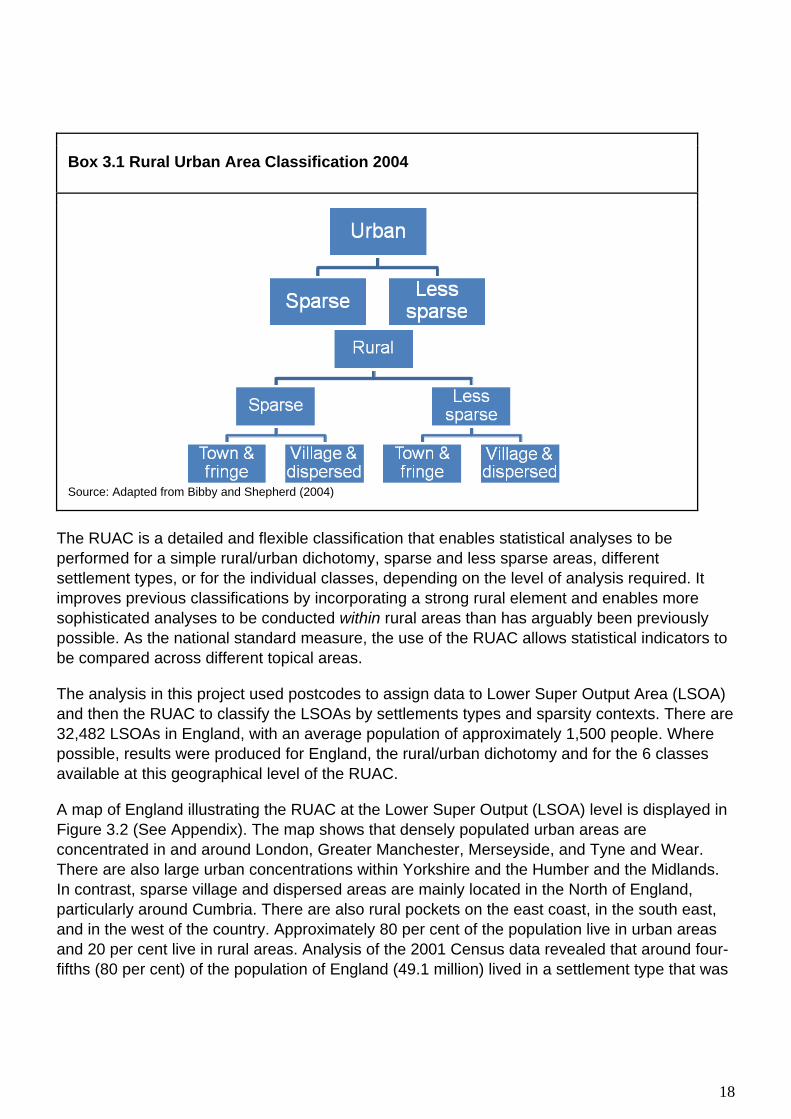
Throughout this report the Rural and Urban Area Classification (RUAC) 2004 for England and Wales was used. The RUAC was sponsored and developed by various agencies (including Defra, ONS and The Countryside Agency) to overcome the weaknesses identified in previous rural and urban definitions. In the RUAC, areas with a population of 10,000 or more were categorised as urban, whereas rural settlements were identified according to household and residential land use and densities (Bibby and Shepherd 2004). Areas were then defined according to settlement types and context (sparsity). The smallest geography which areas were classified at was 2001 Census Output Areas, which can then be aggregated to larger geographies. Output area boundaries remained stable over the 2001-07 period. Based on sparsity and settlement types, a 2-tiered classification can then be structured for rural areas (Box 3.1)
18
Box 3.1 Rural Urban Area Classification 2004
Source: Adapted from Bibby and Shepherd (2004)
The RUAC is a detailed and flexible classification that enables statistical analyses to be performed for a simple rural/urban dichotomy, sparse and less sparse areas, different settlement types, or for the individual classes, depending on the level of analysis required. It improves previous classifications by incorporating a strong rural element and enables more sophisticated analyses to be conducted within rural areas than has arguably been previously possible. As the national standard measure, the use of the RUAC allows statistical indicators to be compared across different topical areas.
The analysis in this project used postcodes to assign data to Lower Super Output Area (LSOA) and then the RUAC to classify the LSOAs by settlements types and sparsity contexts. There are 32,482 LSOAs in England, with an average population of approximately 1,500 people. Where possible, results were produced for England, the rural/urban dichotomy and for the 6 classes available at this geographical level of the RUAC.
A map of England illustrating the RUAC at the Lower Super Output (LSOA) level is displayed in Figure 3.2 (See Appendix). The map shows that densely populated urban areas are concentrated in and around London, Greater Manchester, Merseyside, and Tyne and Wear. There are also large urban concentrations within Yorkshire and the Humber and the Midlands. In contrast, sparse village and dispersed areas are mainly located in the North of England, particularly around Cumbria. There are also rural pockets on the east coast, in the south east, and in the west of the country. Approximately 80 per cent of the population live in urban areas and 20 per cent live in rural areas. Analysis of the 2001 Census data revealed that around four-fifths (80 per cent) of the population of England (49.1 million) lived in a settlement type that was

19
Urban with a less sparse context. More recent estimates, mid 2005, suggest that this has remained largely stable with 81 per cent of the English population living in an ‘Urban – less sparse’ area.
3.2 Deprivation
To understand health variations between rural and urban areas further, analyses of deprivation permit a more in-depth exploration of inequalities within specific area types, which may be hidden by favourable averages of health (Haynes and Gayle 2000). Like the concepts of ‘rural’ and ‘urban’, ‘deprivation’ has been defined and measured in a variety of ways. The term is often used interchangeably with others such as disadvantage, inequality, poverty and social exclusion (Asthana et al 2002). Broadly, there are 2 types of deprivation: economic and social, which manifest through numerous indicators such as income, education and health.
Throughout this report the Index of Multiple Deprivation (IMD) is used to classify LSOAs into deprivation quintiles. The Index of Multiple Deprivation was introduced in 2000. The car-ownership variable was excluded as a deprivation measure and it includes geographical access to services as a measure of deprivation (Jordan et al 2004). The IMD identifies areas of multiple deprivation at the small area level, it is based on the concept that distinct dimensions of deprivation such as income, employment, education and health can be identified and measured separately. These dimensions are referred to as domains and they are then weighted and aggregated to provide an overall measure of deprivation and each area is allocated a deprivation rank and score.
The analyses in this report use the more recent IMD 2004 and IMD 2007; both contain an additional domain of crime. The methodology underpinning the IMD 2004 and IMD 2007 are largely the same. Information on the separate indicators has been updated where possible; the biggest change between the updates is in the income domain where as a result of major changes in the area of tax credits mean that some indicators have ceased to exist. Where possible, indicators were selected for the IMD 2007 that map closely to those used in the IMD 2004. Comparison between the two Indices is therefore acceptable. The IMD 2007 brings together 38 different indicators which fall within 7 domains. The domains each have an associated weight and they are combined to create the overall deprivation index. The domains and weights for IMD 2004 and 2007 are shown in Box 3.2.

20
Box 3.2 Index of Multiple Deprivation domains and weights 2004 and 2007
Domain Domain Weight Income deprivation 22.5% Employment deprivation 22.5% Health deprivation and disability 13.5% Education, skills and training deprivation 13.5% Barriers to housing and services 9.3% Crime 9.3% Living environment deprivation 9.3%
Source: Communities and Local Government
A map of England illustrating the IMD 2007 at LSOA level is displayed in Figure 3.3 (see Appendix). It shows that the least deprived areas are mainly located in the southern and eastern regions, while the most deprived areas are located in and around urban concentrations. There are also a lot of deprived localities in eastern and southern coastal areas, which are often associated with older and sea-change populations. Table 3.4 shows the number of LSOAs in each of the 6 RUAC classes for 2001-07. For rural areas, there are more LSOAs in the least deprived quintiles and fewer in the most deprived areas. The urban LSOAs are distributed more evenly across the deprivation quintiles. Where possible figures have be calculated for all subsets of LSOAs by RUAC, however in some cases categories were excluded from the calculations for methodological reasons because they have small populations.
Table 3.4 Number of LSOAs in England by RUAC 2004 and IMD 2007 quintile, 2001-07
RUAC 2004 IMD 2007
Dichotomy Context Settlement Least 2 3 4 Most Total
Urban Sparse >10,000 population 2 12 18 27 11 70
Less sparse <10,000 population 4704 4471 4996 5873 6341 26385
Rural
Sparse
Town & fringe 17 40 56 38 1 152
Village & dispersed 5 36 128 57 1 227
Less Sparse
Town & fringe 1118 799 571 317 124 2929
Village & dispersed 652 1139 727 184 17 2719
Total 6498 6497 6496 6496 6495 32482
21
3.3 National Statistics Socio-economic Classification (NS-SEC) Using individual level Census 2001 data for the analysis of self-reported health perception and migration in rural areas (Chapter 6) allows the use of the National Statistics Socio-economic Classification (NS-SEC) of the individual to adjust for socio-economic factors rather than the area based measure of deprivation (IMD) used in the other chapters. The NS-SEC was developed in order to replace the Registrar General’s Social Class, which had been criticised as lacking a coherent theoretical basis and becoming increasing irrelevant to the changing patterns of industry and employment in modern economics (Goldthorpe, 2000). The conceptual basis of the NS-SEC is the structure of employment relations operating in modern developed economics (Rose and Pevalin, 2003). Occupations are differentiated in terms of reward mechanisms, promotion prospects, autonomy and job security. The most advantaged NS-SEC groups (higher managerial and professional occupations), typically exhibit personalised reward structures, have good opportunities for advancement, have relatively high levels of autonomy within the job, and are relatively secure. These attributes tend to be reversed for the least advantaged group (routine occupations). Box 3.5 in the appendix shows the NS-SEC analytical class breakdowns used and also provides example of the occupations included in each class.

22
4. Variations in mortality between rural and urban areas in England, 2001-07
4.1 Introduction This chapter develops previous work by Gartner et al. (2008), which examined differences in age standardised mortality rates between rural and urban areas in England and Wales for 2002-04. A mortality rate is a measure of the frequency of occurrence of deaths in a defined population during a specified time interval. In its simplest form the crude mortality rate is defined as the total number of deaths in a given year divided by the total population. Using area and deprivation measures, Gartner found that all-cause mortality in rural areas was lower than in urban areas for both males and females. However, after adjusting for deprivation, the differences were greatly reduced. In England, mortality rates for lung cancer and respiratory diseases were substantially higher in urban areas, whereas rates for accidents were considerably higher in rural areas (after adjustment only). For suicide, the results were less clear. For males, rates were lower in rural areas before adjustment for deprivation and higher after adjustment. In this analysis, the Rural and Urban Area Classification (RUAC) 2004 and the Index of Multiple Deprivation (IMD) 2007 were employed to conduct more detailed analyses into mortality from all-causes, cancer, coronary heart disease, stroke and related diseases, and suicide and undetermined injuries. The causes of death selected are specific to Defra’s Strategic Objectives (Defra 2008). Data for the 2001-07 period was aggregated to provide large enough numbers to ensure that the results calculated were sufficiently robust.
4.2 Methods
Data Sources
The population data used were unpublished, experimental mid-year LSOA population estimates split by sex and 5-year age group, produced by the Office for National Statistics (ONS).
Mortality data by sex and 5-year age group for persons whose place of usual residence was in England were used, except in the analysis of suicide where only persons aged 15 years and over were included. Deaths were coded by ONS using the International Classification of Diseases, Tenth Revision (ICD-10) and selected using the original underlying cause of death. A list of the causes investigated and their ICD-10 codes is presented in Box 4.1.
The data were combined for the calendar years 2001 to 2007 to ensure that the numbers of deaths were large enough, particularly in areas with fewer LSOAs, to ensure that the results calculated were sufficiently robust. For the mortality data, figures are based on deaths registered in each year.

23
Box 4.1: Causes of death investigated, with corresponding percentage of all deaths and International Classification Diseases, Tenth Revision (ICD-10) codes
Cause of death ICD-10 Percentage of all deaths All-causes - 100 Coronary Heart Disease I20-I25 15 Stroke and related diseases I60-I69 9 All cancers C00-C97 28 Suicides and undetermined injuries X60-X84, Y10-Y34 excluding Y33.9
where the verdict was pending 1
Analysis
Age-standardised mortality rates per 100,000 population, standardised to the European Standard Population, were calculated for males and females separately for the 2001-07 period, with 95 per cent confidence intervals. Mortality rates were produced for all-causes and specific causes of death for the rural/urban dichotomy and the 6 classes of the RUAC. Logistic regression analyses were performed using SPSS software to investigate the differences in mortality risk between rural and urban areas for all-causes and each selected cause of death. Separate regression analyses were carried out for males and females. Both 5-year age group and the rural/urban dichotomy were factors in the model, with the urban category as the baseline. The results for each logistic regression gave an estimated odds ratio, 95 per cent confidence interval and a p-value for each factor. The odds ratio for the rural/urban factor describes the rural/urban mortality difference. For example, an odds ratio of 0.85 can be interpreted as mortality being 15 per cent lower in rural compared to urban areas. Confidence intervals are a measure of the statistical precision of an estimate and show the range of uncertainty around the estimated figure. The p-value associated with the odds ratio is a measure of how significant the factor is in describing the rural/urban mortality difference, a p-value of less than 0.05 is considered to be statistically significant. To take account of area deprivation, these analyses were repeated to include the deprivation quintiles in the model. The effect of adjustment for deprivation on the odds ratios from these analyses was then examined.
4.3 Results
Age-standardised mortality rates for all-causes of death
Table 4.2 shows the age-standardised mortality rates per 100,000 population for all-causes of death, by sex and the 6 RUAC classes for 2001-07, with 95 per cent confidence intervals. For England, the male mortality rate over the 2001-07 period was 756.4 per 100,000 and the female rate was 526.1 per 100,000. All-cause mortality rates for both males and females were lower in rural areas compared to urban areas. The rate for males was 783.5 per 100,000 in urban areas and 664.6 per 100,000 in rural areas. For females, the rate was 539.9 per 100,000 in urban

24
areas and 476.4 per 100,000 in rural areas. This shows that there was less inequality among women. The results for all-cause mortality were all statistically significant.
Table 4.2: Age-standardised mortality rates (all-cause) by sex and rural and urban class, England, 2001-07
Rate per 100,000
Males Females Rates Lower CI Upper CI Rates Lower CI Upper CI
Urban - sparse 799.5 777.1 821.8 535.9 522.3 549.6
Urban - less sparse 783.5 782.1 784.8 539.9 539.0 540.8
Town and Fringe - sparse 712.2 698.8 725.6 492.9 484.4 501.4 Town and Fringe - less sparse 690.6 687.2 694.1 486.4 484.1 488.7 Village and dispersed – sparse 633.0 622.4 643.6 434.0 426.5 441.5 Village and dispersed - less sparse 639.8 636.5 643.1 470.4 468.0 472.8
All 756.4 755.2 757.5 526.1 525.3 526.8 Source: Death registrations 2001-07, Office for National Statistics Lower Super Output Area population estimates (unpublished)
Figure 4.3 shows the pattern of all-cause mortality across the 6 RUAC classes for males and females. For both sexes, urban areas had the highest mortality rates. Rates were highest in urban sparse areas for males (799.5 per 100,000) and in urban less sparse areas for females (539.9 per 100,000). The lowest rates were in sparse village and dispersed areas (633.0 per 100,000 for males and 434.0 per 100,000 for females). There were wider differences across the 6 area types in men than in women.

25
Figure 4.3: Age-standardised mortality rates (all-cause) by sex and rural and urban class, England, 2001-07
0
100
200
300
400
500
600
700
800
900
Males Females
Rat
e pe
r 100
,000
Village and dispersed - sparse
Village and dispersed - less sparse
Tow n and Fringe - sparse
Tow n and Fringe - less sparse
Urban - sparse
Urban - less sparse
Age-standardised mortality rates for specific causes of death
Table 4.4 shows the age-standardised mortality rates per 100,000 population for specific causes of death (all cancers, coronary heart disease, stroke and related diseases, and suicide and undetermined injuries), by sex and the 6 RUAC classes for 2001-07. In all area types, the highest mortality rates (within the studied cause list) were due to all cancers and the lowest were due to suicide and undetermined injuries.
In both males and females, mortality rates for all cancers, coronary heart disease (CHD), and stroke and related diseases were highest in urban areas and lowest in village and dispersed areas. However, for suicide, rates were highest in sparse town and fringe areas for both sexes. Suicide rates were lowest in less sparse town and fringe areas for men and less sparse village and dispersed areas for women. Figures 4.6 to 4.9 show the age-standardised mortality rates for each specific cause of death by sex and the 6 RUAC classes.

26
Table 4.4 Age-standardised mortality rates for selected causes of death by sex and rural/urban class, England, 2001-07
Rate per 100,000 population
Males Rates of selected causes of death
Cancer CHD Stroke Suicide All-cause
Urban - sparse 218.8 168 65 17.9 799.5
Urban - less sparse 224.4 160.8 60.6 16.6 783.5
Town and Fringe - sparse 207.6 150.7 59.2 19.7 712.2
Town and Fringe - less sparse 205.5 142.6 55.5 13.9 690.6
Village and dispersed - sparse 185 137.4 51.3 15.7 633
Village and dispersed - less sparse 187.7 129.3 53.6 14.6 639.8
All areas 217.8 155.1 59.2 16.2 756.4
Females
Urban - sparse 152.4 75.3 64.5 6.1 535.9
Urban - less sparse 158 75.3 54.9 5.3 539.9
Town and Fringe - sparse 146.6 72.8 56 6.2 492.9
Town and Fringe - less sparse 146.3 67.5 51.7 4.5 486.4
Village and dispersed - sparse 135.8 63.4 50.5 4.8 434
Village and dispersed - less sparse 139.7 61.2 55.2 4.4 470.4
All areas 154.6 73 54.5 5.2 526.1

27
Figure 4.6 Coronary Heart Diseases: Age standardised rates by sex and urban/rural class, England, 2001-07
020406080
100120140160180200
Males Females
Rat
e pe
r 100
,000
Village and dispersed - sparse
Village and dispersed - lesssparse
Tow n and Fringe - sparse
Tow n and Fringe - less sparse
Urban - sparse
Urban - less sparse
Figure 4.7 Stroke and related diseases: Age standardised rates by sex and urban/rural class, England, 2001-07
0
10
20
30
40
50
60
70
80
Males Females
Rat
e pe
r 100
,000
Village and dispersed - sparse
Village and dispersed - lesssparse
Tow n and Fringe - sparse
Tow n and Fringe - less sparse
Urban - sparse
Urban - less sparse

28
Figure 4.8 All cancers: Age standardised rates by sex and urban/rural class, England, 2001-07
0
50
100
150
200
250
Males Females
Rat
e pe
r 100
,000
Village and dispersed - sparse
Village and dispersed - lesssparse
Tow n and Fringe - sparse
Tow n and Fringe - less sparse
Urban - sparse
Urban - less sparse
Figure 4.9 Suicide: Age standardised rates by sex and urban/rural class, England, 2001-07
0
5
10
15
20
25
Males Females
Rat
e pe
r 100
,000
Village and dispersed - sparse
Village and dispersed - lesssparse
Tow n and Fringe - sparse
Tow n and Fringe - less sparse
Urban - sparse
Urban - less sparse
Logistic regression analysis
Table 4.10 shows the odds ratios and 95 per cent confidence intervals for rural and urban areas of England, for all-causes and the specific causes of death. The results are given with and without adjustment for deprivation. For all-causes, the risk of death for males in rural areas was 0.85 that of males in urban areas (15 per cent lower) before adjustment for deprivation, and 0.97 that of males in urban areas (3 per cent lower) after adjustment. The difference between rural and urban areas was statistically significant in both cases.
For females, the unadjusted all-cause mortality rate was 9 per cent lower in rural areas compared to urban areas, which was reduced to only 1 per cent after adjustment. Both results were statistically significant.

29
Table 4.10 Odds ratios for mortality in rural areas relative to urban areas, before and after adjustment for deprivation, England, 2001-2007
Cause of death Males Females Before adjustment After adjustment Before adjustment After adjustment
Odds ratios
Lower limit
Upper limit
Odds ratios
Lower limit
Upper limit
Odds ratios
Lower limit
Upper limit
Odds ratios
Lower limit
Upper limit
All causes 0.85* 0.84 0.86 0.97* 0.96 0.98 0.91* 0.90 0.92 0.99* 0.98 1.00
Coronary heart disease 0.86* 0.84 0.88 0.98 0.96 1.01 0.91* 0.88 0.93 1.01 0.99 1.04
Stroke and related diseases 0.91* 0.88 0.94 0.99 0.95 1.03 1.01 0.99 1.04 1.04* 1.01 1.07 All cancers 0.88* 0.86 0.90 0.96* 0.94 0.98 0.92* 0.90 0.94 0.98 0.96 1.00
Suicides and undetermined injuries 0.87* 0.80 0.96 1.10 1.00 1.21 0.88 0.75 1.02 1.00 0.85 1.18
* Statistically significant (p-value <0.05)
In general, the risk of mortality from the specific causes (which accounted for 53 per cent of all deaths) was lower for those living in rural areas before adjustment for deprivation. After the adjustment was made, the differences in mortality were reduced.
The results for cancer were broadly similar to those for all-causes. For males, the risk of death in rural areas was 0.88 (12 per cent lower) that of males in urban areas before adjustment for deprivation and 0.96 (4 per cent lower) after adjustment. The risk for females in rural areas was 0.92 (8 per cent lower) before adjustment and 0.98 after adjustment for deprivation. All of these results were statistically significant, apart from the latter.
For coronary heart disease and stroke and related diseases, the risk of death for males in rural areas was 0.86 (14 per cent lower) and 0.91 (9 per cent lower) respectively that of males in urban areas before deprivation was adjusted for. These results were both statistically significant. After adjustment, the odds ratios were reduced to 0.98 (2 per cent lower) and 0.99 (1 per cent lower) respectively, which were not statistically significant results.
In females, the risk of death from coronary heart disease in rural areas was 0.91 (9 per cent) lower than that of females in urban areas before adjustment for deprivation, which was statistically significant. However, the risk was 1.01 (1 per cent higher) for females in rural areas after adjustment. Similarly, for deaths from stroke and related diseases, the risk was higher for females in rural areas than those in urban areas, both before (1 per cent higher) and after (4 per cent higher) deprivation was adjusted for. The latter result was statistically significant.
The biggest differences in mortality between rural and urban areas were found in the suicide figures. In males, the risk of death in rural areas was 0.87 (13 per cent lower) that of males in urban areas before adjustment for deprivation, which was a statistically significant result. However, after adjustment, the risk was 1.10 (10 per cent higher) for males in rural areas. In females, the odds ratio before deprivation was adjusted for was similar to males (0.88),

30
although it was not statistically significant. However, after adjustment, no difference was found between rural and urban areas.
4.4 Limitations
The analysis was based on an ecological study design and is susceptible to the ecological fallacy, whereby inferences about the population do not necessarily reflect individual experiences (Bryman, 2008). Whilst sex, age and area of usual residence are recorded in the mortality data, deprivation measures are area-based and are not linked to individuals. Findings from this type of study cannot be directly related to individual people, but can give indications of average outcomes for individuals within small areas (Haynes and Gayle 2000).
Some authors argue that selective migration of healthy and less healthy people contributes to the spatial distribution of health in rural and urban areas, referring to a tendency of healthier people to migrate and the less healthy to remain at home (O’Reilly et al., 2007). People may also migrate to gain better access to health or social care services. It is not possible to account for migration using death registration data alone as it is the area of usual residence of the deceased that is recorded on death certificates rather than any previous addresses.
The analysis was based on the RUAC 2004 on the assumption that the classification of areas is accurate and appropriate. Some others have discussed the shortcomings of previous classifications and the methodological problems of rurality as a concept (Martin et al. 2000). For all-causes and specific causes of death, mortality rates were calculated for each of the 6 classes of the RUAC. However, the logistic regression analysis was based only on the rural/urban dichotomy, so was arguably limited. Although for areas with smaller numbers of LSOAs, such aggregation ensured that the calculations were more robust.
It is important to note that premature death may be experienced in any area of England: rural or urban, deprived or not deprived, and in areas with high or low average mortality. Rural areas are considered to be more heterogeneous than urban areas, with people of different social and economic backgrounds living side-by-side (Haynes and Gayle, 2000; Watkins and Jackoby, 2007). Small area analysis was undertaken in this research, which is a significant improvement compared to previous studies. However, geographical aggregates, even in such small area units, may not adequately capture all of the intricacies of diversity at the local level. The results of this study should not therefore be seen as contradicting findings of a pattern of poor health that may exist in some sections of rural and urban populations, which could be investigated if individual data relating to social and economic circumstances were readily available.
4.5 Key Findings
Mortality rates for all-causes of death were higher in urban areas than in rural areas for both males and females. Within rural areas the mortality rates were higher in town and fringe than in village and dispersed settlement types. The relationship between mortality and sparsity of an area was unclear but those living in the sparser areas of the town and fringe settlement types appeared to have higher mortality rates.

31
For all cancers, coronary heart disease, and stroke and related diseases mortality rates were lowest in the most rural village and dispersed areas and highest in the urban areas. For stroke and CHD rates were higher in sparse areas – males living in sparse town and fringe areas had equivalent mortality rates to males living in less sparse urban areas for these causes.
The suicide results were less clear, rates were highest for both men and women in the town and fringe sparse areas; however the confidence intervals were wide so it is difficult to draw any firm conclusions. All-cause mortality of males in rural areas of England was 15 per cent lower than in urban areas, although after adjustment for deprivation the difference was reduced to 3 per cent. For females in England, all-cause mortality in rural areas was 9 per cent lower than in urban areas; after adjustment the difference was reduced to 1 per cent. Adjusting for deprivation removed the statistically significant differences between rural and urban mortality from CHD and stroke. After accounting for deprivation there remained some significant differences in cancer mortality for males but not females. Mortality rates from suicide after adjusting for deprivation were 10 percent higher for males living in rural areas compared to those living in urban areas; however as to the total number of suicides is relatively small compared to other causes of death this result was not statistically significant.
4.6 Conclusion The results of this analysis show that while mortality rates were higher in urban areas compared to rural areas, within rural areas those living in the town and fringe settlement types had higher mortality rates than those living in village and dispersed areas. This pattern persisted when looking at mortality by cause with the exception of suicide where the rates were highest for both sexes in town and fringe areas. However after adjustment for deprivation the differences in mortality observed between rural and urban areas were significantly reduced. There was weak evidence to suggest that just considering the urban-rural dichotomy masked mortality rates in town and fringe areas that were similar to those in urban areas. While mortality rates for all causes of death were higher in urban areas when compared with rural areas adjusting for deprivation largely removed this difference. This could suggest that pockets of deprivation in rural areas may be masked by larger amounts of more advantaged areas or that poor health may be more related to individual social and economic circumstances.

32
5. Mortality and access to emergency services between rural and urban areas
5.1 Introduction This chapter examines the differences and links between mortality (all deaths), fatality (deaths following admission to hospital), and distance to accident and emergency services within rural and urban areas of England. The impact of deprivation is also assessed. The analysis focuses specifically on hospital admissions and deaths from acute myocardial infarction/heart attack (AMI). This is due to the emergency nature of this condition, which is one where the outcome is likely to be affected by speed of access to medical services. For the purpose of this analysis, the majority of AMI cases were easily traceable as most result in a hospital admittance or death. Mortality and fatality rates for England, the urban-rural dichotomy and rural settlement types of the RUAC 2004, were calculated for 2008, with and without the inclusion of IMD 2004 deprivation quintiles. They were calculated separately to provide data on the rates of death from AMIs in the population as a whole (mortality) and the rate of death for all persons who suffered an AMI (fatality). The mean distance of each individual who died in 2008 as a result of an AMI from the nearest accident and emergency unit was also derived. These distances were averaged according to the area and deprivation measures. Associations between fatality and access to services were then examined. Finally, a logistic regression analysis was performed to assess the significance of fatality relative to age, deprivation and distance. This focused on differences within rural areas only to ensure that results for urban areas did not mask the effects of rural factors.
5.2 Methods
Mortality The number of deaths where AMI (ICD-10 code I21) was the underlying cause of death, and experimental mid-year population estimates, split by quinary age group, RUAC 2004 categories and IMD 2004 quintiles at the LSOA-level for 2008, were used to calculate mortality rates, standardised to the European Standard Population (per 100,000 population). Both sets of data were produced by the Office of National Statistics (ONS). In the mortality data, the postcode of usual residence of the deceased was used to assign individuals to each RUAC 2004 and IMD 2004 category. Rates were calculated for England, the urban-rural dichotomy, and the rural settlement types of the RUAC 2004. They were also calculated for each of the IMD 2004 deprivation quintiles within each category. Confidence intervals were calculated to assess statistical significance.
33
Fatality To calculate AMI-specific fatality rates, both hospital admissions and mortality data were used. Hospital Episodes Statistics (HES) data for persons admitted to an accident and emergency unit with an AMI during the 2007-08 financial year, split by broad age groups (0-69, 70-74, 75-79, 80-84 and 85+), RUAC 2004 and IMD 2004 were obtained from the NHS Information Centre. Mortality data as described above was also used, split by broad age groups, and according to whether the deaths occurred in hospital (NHS or non-NHS) or elsewhere. For the purpose of this analysis, fatality rates were calculated as follows: Total AMI deaths ______________________________________________ x 1,000 Total AMI emergency admissions + AMI deaths outside of hospital The rates were standardised to the European Standard Population and are expressed per 1,000 population. This calculation is based on the assumption that the denominator represents the total population of people experiencing an AMI. It is assumed that deaths which occur in hospital will be counted in the total emergency admissions data. However, it is recognised that people who are admitted with a condition other than AMI who subsequently experience it and die will not be included in this figure. Further limitations of this method are discussed below. Again, rates were calculated for England, the urban-rural dichotomy, and the rural settlement types of the RUAC 2004. They were also calculated for the IMD 2004 deprivation quintiles and confidence intervals were produced to assess statistical significance.
Distance Easting and northing grid reference co-ordinates were obtained for each accident and emergency unit in England and for each individual who died from an AMI in 2008, based on the postcode of usual residence of the deceased. Map 5.1 in the appendix shows the allocation of postcode centroids to the nearest accident and emergency hospital. Geographical Information Systems (GIS) software was used to join the two sets of data together and calculate straight-line or ‘crow fly’ distances from individuals to their nearest accident and emergency unit. Mean distances for individuals within England, the urban-rural dichotomy and settlement types of the RUAC 2004, and each IMD 2004 quintile were calculated to examine area and deprivation effects on access to emergency medical services. Confidence intervals were also calculated to assess whether differences were statistically significant. Limitations of this analysis are discussed below.
Logistic regression A grouped logistic regression was used, producing maximum likelihood estimates of logit coefficients that were then reported as odds ratios. The groups were defined by specific combinations of five age-groups, five deprivation categories and four categories of urban/rural

34
classification i.e. town and village, sparse and less sparse. The total number of responses in a group was taken to be defined as the total number of hospital admissions for AMI plus the number of deaths outside hospital; this is assumed to be a approximation to the total number of AMI incidents. The distance allocated to each group was the average distance of all the deaths in the group, as this could be calculated from information held on the death registers. Size of the groups varied considerably, but restricting the regression to groups where the distance indicator was calculated for at least 25 deaths did not materially affect the conclusions. The effect of deprivation, the town/village classification, and distance was investigated by constructing three models, each including age and one of the three variables of interest. Statistical significance of additional factors was assessed using likelihood ratio tests, setting significance at the 5% level. The results gave an estimated odds ratio, 95 per cent confidence intervals and a p-value for each factor. To assess the effect of age on fatality in rural areas, for example, an odds ratio of 2.48 for the 70-74 age group category means that the probability of dying from an AMI was almost 2 and a half times higher for persons aged 70-74 than those aged 0-69 (Table 5.8).

35
5.3 Results
Mortality In 2008, the AMI mortality rate in England was 33 per 100,000 population. In urban areas, the rate was 34 per 100,000. The mortality rate was lower in rural areas at 27 per 100,000. Within rural settlement types, the rate differed from 29 per 100,000 in town and fringe areas to 26 per 100,000 in village and dispersed areas. Variation in mortality rates was evident when deprivation was taken into account. For England, the rates ranged from 23 per 100,000 population in the least deprived quintile to 51 per 100,000 in the most deprived quintile. Figure 5.2 shows the age-standardised mortality rate per 100,000 population by RUAC 2004 settlement types and IMD 2004 deprivation quintiles. The variation across the deprivation quintiles was greatest in urban areas, which had the lowest mortality rates in the least deprived quintiles and the highest mortality rates in the most deprived quintile. Within each settlement type, there was a large difference between quintiles 4 and 5 (most deprived). The greatest inequality was in village and dispersed areas, where rates increased by 17 per 100,000 between quintile 4 (32 per 100,000) and quintile 5 (49 per 100,000). However, due to the small number of areas in the most deprived rural classification this result was not statistically significant. Figure 5.2 Age-standardised mortality rates per 100,000 population, where acute myocardial infarction was the underlying cause of death, by RUAC 2004 settlement types and IMD 2004 deprivation quintiles, England, 2008
0
10
20
30
40
50
60
Least 2 3 4 MostIMD 2004
Mor
talit
y ra
te p
er 1
00,0
00 p
opul
atio
n
Urban
Town & Fringe
Village &Dispersed
Fatality

36
Of those who suffered an AMI in England in 2008, the fatality rate was 242 per 1,000 population. The rate was 303 per 1,000 in urban areas and 203 per 1,000 in rural areas. Fatality rates within rural settlement types varied from 301 per 1,000 in town and fringe areas to 190 per 100,000 (19.0 per cent) in village and dispersed areas. When the impact of deprivation was assessed, it was found that fatality rates in England varied from 194 per 1,000 in the least deprived quintile to 302 in the most deprived quintile, showing that deprivation has a considerable effect on the outcome of AMIs. Figure 5.3 shows the age-standardised fatality rates per 1,000 population by RUAC 2004 settlement types and IMD 2004 deprivation quintiles. In urban areas, fatality rates increased in each quintile from the least (195 per 1,000) to the most deprived (303 per 1,000). However, the pattern was less clear within rural settlements. In town and fringe areas, the fatality rate in quintile 4 was similar to the rate in quintiles 1 and 2, and, as in urban areas, there was a large difference between the two quintiles with the highest rates. The highest fatality rate in village and dispersed settlements was in quintile 2. This result was statistically significant compared with quintile 1 (least deprived) but not compared with the other quintiles. There was little variation in fatality rates across the deprivation quintiles, ranging from 173 per 1,000 in the least deprived quintile to 205 per 1,000 in quintile 2. Figure 5.3 Age-standardised fatality rate per 1,000 population, where acute myocardial infarction was the underlying cause of death, by RUAC 2004 settlement types and IMD 2004 deprivation quintiles, England, 2008
0
50
100
150
200
250
300
350
Least 2 3 4 MostIMD 2004
Fata
lity
rate
per
1,0
00 p
opul
atio
n
Urban
Town & Fringe
Village &Dispersed
Distance The mean distance between the postcode of usual residence of individuals who died from an AMI and the nearest accident and emergency unit in England in 2008 was 7.4km. As expected, the distance was shorter in urban areas (5.8km) than in rural areas (14.0km). Within rural settlements, the average distances between individuals in town and fringe areas and village and dispersed areas to the nearest emergency medical unit was 13.7km and 14.4km respectively.

37
As these figures are based on straight line estimates in real terms these distances for rural areas are likely to be even greater. In terms of deprivation, the mean distance was generally shorter in the most deprived areas and longer in the least deprived areas. In England, the mean distance for individuals living in the least deprived quintile was 9.1km, although it was slightly higher in quintile 2 at 9.3km. For those in the most deprived quintile, the mean distance was 4.1 km. Figure 5.4 shows the mean distance to the nearest accident and emergency unit for people who died as a result of an AMI, by RUAC 2004 settlement types and IMD 2004 deprivation quintiles. In urban areas, the average distance was highest in the least deprived quintile (7.6km) and lowest in the most deprived quintile (3.9km). The patterns were less clear in rural settlements. As in urban areas, the shortest distances were for individuals in the most deprived quintiles. The furthest distances were in quintile 3 in town and fringe settlements (15.7km) and in quintile 4 for village and dispersed areas (16.9km), the longest distance across all categories.
Figure 5.4 Mean distance to nearest Accident and Emergency unit for persons who died where the underlying cause of death was acute myocardial infarction, by RUAC 2004 settlement types and IMD 2004 deprivation quintiles, England, 2008
02468
1012141618
Least 2 3 4 MostIMD 2004
Mea
n di
stan
ce (k
m)
Urban
Tow n & fringe
Village &dispersed

38
Fatality and distance To address the initial research question, the associations between fatality rates and distance to the nearest accident and emergency unit were examined for each settlement type of the RUAC 2004 and IMD quintile (Table 5.5 and Figure 5.6). Table 5.5 Age-standardised fatality rates per 1,000 population, where acute myocardial infarction was the underlying cause of death, by the urban settlement type of the RUAC 2004 and IMD 2004 deprivation quintile, England, 2008
RUAC IMD 2004 Quintile
Mean distance (km)
Rate per 1,000
95% Confidence interval
Lower Limit Upper Limit England 1 9.1 194.2 188.5 199.9 2 9.3 212.9 207.2 218.6 3 8.7 229.8 223.7 235.8 4 6.6 247.9 241.4 254.4 5 4.1 302.3 294.8 309.7 All 7.4 242.4 239.5 245.3 Urban 1 7.6 195.1 188.3 202.0 2 6.9 216.7 209.5 223.9 3 6.4 241.8 234.5 249.1 4 5.5 255.0 248.0 262.1 5 3.9 302.9 295.3 310.5 All 5.8 252.6 249.3 256.0 Rural 1 12.6 192.2 181.8 202.6 2 13.7 206.1 196.7 215.5 3 15.8 198.8 188.2 209.3 4 14.8 198.5 182.8 214.1 5 10.9 283.5 241.6 325.4 All 14.0 202.8 197.4 208.3 Town and Fringe 1 12.4 206.1 192.2 220.1 2 13.9 207.4 193.2 221.6 3 15.7 219.7 202.7 236.8 4 13.6 208.2 187.5 228.8 5 11.0 301.2 254.2 348.2 All 13.7 216.0 208.1 224.0 Village and dispersed 1 12.9 173.3 157.8 188.7 2 13.5 205.1 192.5 217.6 3 15.8 184.2 170.9 197.5 4 16.9 185.1 161.0 209.1 5 10.4 203.6 109.6 297.7 All 14.4 190.4 182.9 197.9
In England the most deprived quintile had the highest fatality rate and also the shortest mean distance to emergency services. This pattern remains clear in urban areas where the highest fatality rates were for areas closest to emergency services implying that area deprivation is a
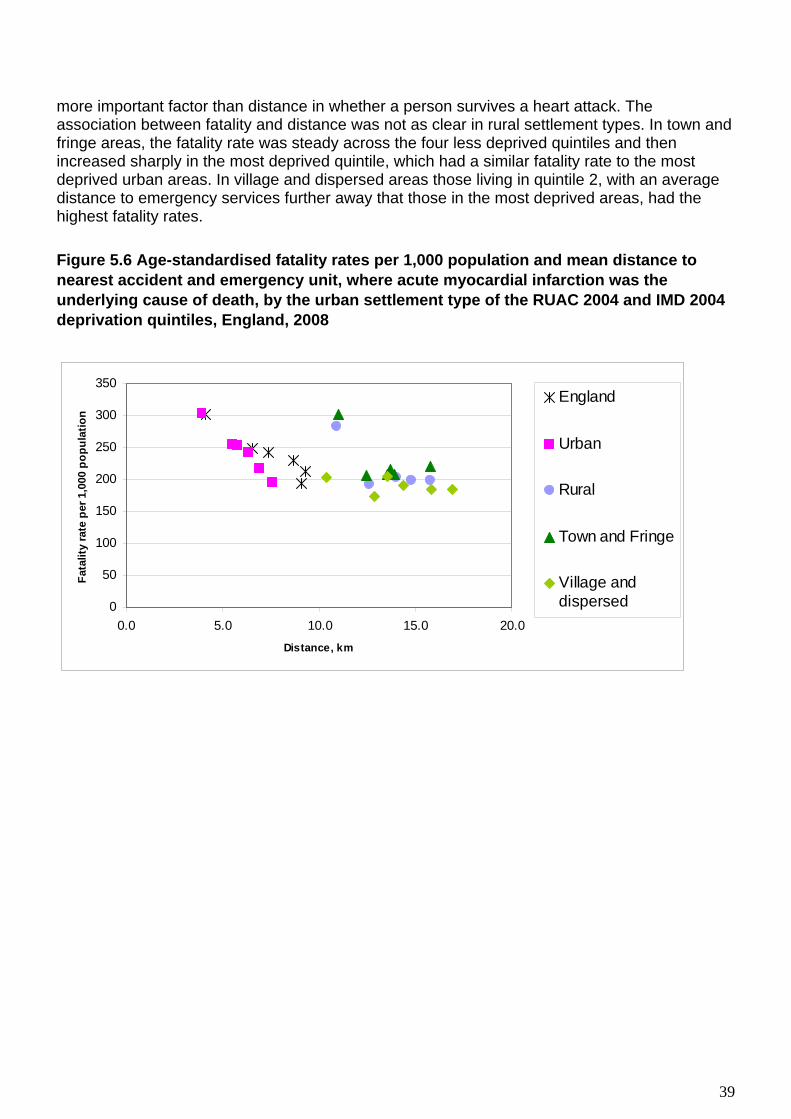
39
more important factor than distance in whether a person survives a heart attack. The association between fatality and distance was not as clear in rural settlement types. In town and fringe areas, the fatality rate was steady across the four less deprived quintiles and then increased sharply in the most deprived quintile, which had a similar fatality rate to the most deprived urban areas. In village and dispersed areas those living in quintile 2, with an average distance to emergency services further away that those in the most deprived areas, had the highest fatality rates. Figure 5.6 Age-standardised fatality rates per 1,000 population and mean distance to nearest accident and emergency unit, where acute myocardial infarction was the underlying cause of death, by the urban settlement type of the RUAC 2004 and IMD 2004 deprivation quintiles, England, 2008
0
50
100
150
200
250
300
350
0.0 5.0 10.0 15.0 20.0Distance, km
Fata
lity
rate
per
1,0
00 p
opul
atio
n
England
Urban
Rural
Town and Fringe
Village anddispersed
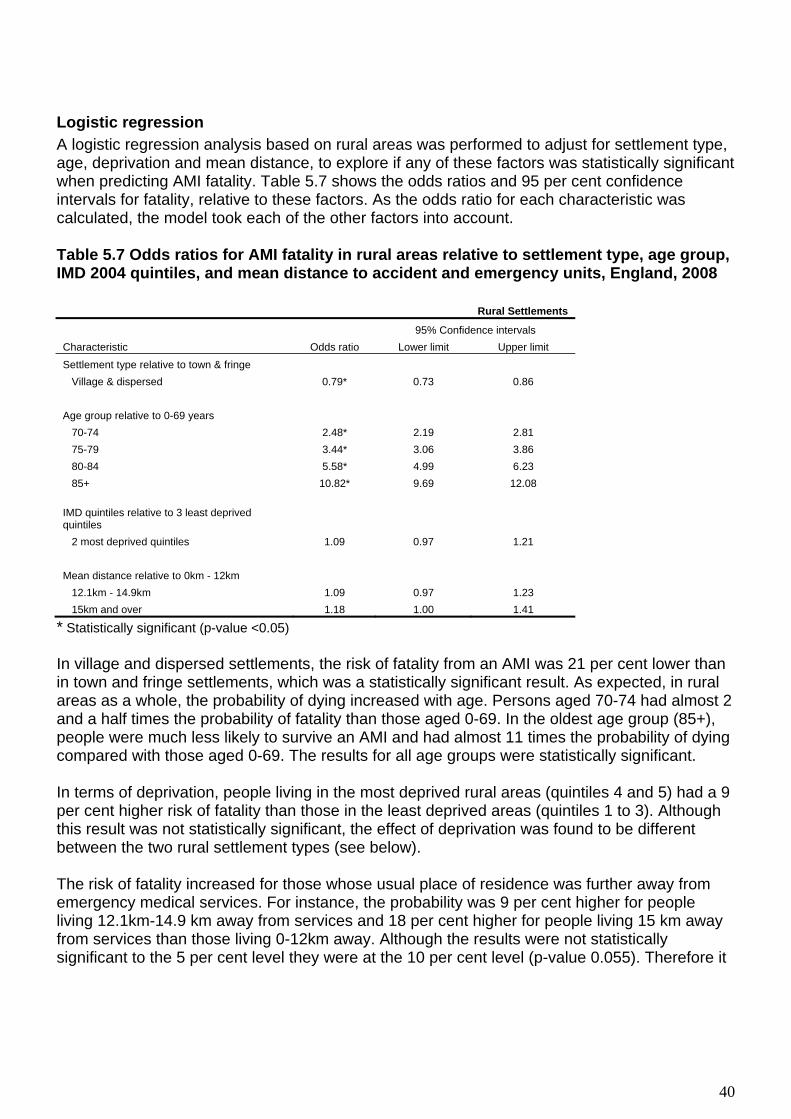
40
Logistic regression A logistic regression analysis based on rural areas was performed to adjust for settlement type, age, deprivation and mean distance, to explore if any of these factors was statistically significant when predicting AMI fatality. Table 5.7 shows the odds ratios and 95 per cent confidence intervals for fatality, relative to these factors. As the odds ratio for each characteristic was calculated, the model took each of the other factors into account. Table 5.7 Odds ratios for AMI fatality in rural areas relative to settlement type, age group, IMD 2004 quintiles, and mean distance to accident and emergency units, England, 2008
Rural Settlements
95% Confidence intervals Characteristic Odds ratio Lower limit Upper limit Settlement type relative to town & fringe Village & dispersed 0.79* 0.73 0.86 Age group relative to 0-69 years 70-74 2.48* 2.19 2.81 75-79 3.44* 3.06 3.86 80-84 5.58* 4.99 6.23 85+ 10.82* 9.69 12.08 IMD quintiles relative to 3 least deprived quintiles 2 most deprived quintiles 1.09 0.97 1.21 Mean distance relative to 0km - 12km 12.1km - 14.9km 1.09 0.97 1.23 15km and over 1.18 1.00 1.41
* Statistically significant (p-value <0.05) In village and dispersed settlements, the risk of fatality from an AMI was 21 per cent lower than in town and fringe settlements, which was a statistically significant result. As expected, in rural areas as a whole, the probability of dying increased with age. Persons aged 70-74 had almost 2 and a half times the probability of fatality than those aged 0-69. In the oldest age group (85+), people were much less likely to survive an AMI and had almost 11 times the probability of dying compared with those aged 0-69. The results for all age groups were statistically significant. In terms of deprivation, people living in the most deprived rural areas (quintiles 4 and 5) had a 9 per cent higher risk of fatality than those in the least deprived areas (quintiles 1 to 3). Although this result was not statistically significant, the effect of deprivation was found to be different between the two rural settlement types (see below). The risk of fatality increased for those whose usual place of residence was further away from emergency medical services. For instance, the probability was 9 per cent higher for people living 12.1km-14.9 km away from services and 18 per cent higher for people living 15 km away from services than those living 0-12km away. Although the results were not statistically significant to the 5 per cent level they were at the 10 per cent level (p-value 0.055). Therefore it

41
can be said that there was weak evidence of a distance effect on fatality in rural areas for people with a mean distance to the nearest accident and emergency unit of 15km and over (those who live the further away from services in the most rural areas) relative to 0-12km. By definition data for people living in the most rural areas the furthest away from emergency services are sparse and therefore hard to test for statistical significance (see 5.4 Limitations). To provide more detail of the effect of factors within rural settlement types, further logistic regression analyses were conducted. Table 5.8 shows the odds ratios for AMI fatality relative to age group, deprivation and distance for town and fringe areas and village and dispersed areas. Table 5.8 Odds ratios for AMI fatality in rural settlement types relative to age group, IMD 2004 quintiles, and mean distance to accident and emergency units, England, 2008 Town and fringe Village and dispersed
95% Confidence
intervals 95% Confidence
intervals
Characteristic Odds ratio
Lower limit
Upper limit
Odds ratio
Lower limit
Upper limit
Age group relative to 0-69 years 70-74 2.36* 1.97 2.82 2.60* 2.17 3.10 75-79 3.58* 3.04 4.20 3.27* 2.76 3.88 80-84 5.92* 5.07 6.92 5.21* 4.44 6.12 85+ 11.82* 10.05 13.89 9.95* 8.55 11.58 IMD quintiles relative to 3 least deprived quintiles 2 most deprived quintiles 1.17* 1.02 1.34 0.94 0.78 1.14 Mean distance relative to 0km - 12km 12.1km - 14.9km 1.12 0.98 1.27 1.02 0.77 1.33 15km and over 1.18 0.92 1.51 1.16 0.85 1.58
* Statistically significant (p-value <0.05) In both settlement types, the probability of dying from an AMI increased with age and the results were all statistically significant. Apart from those aged 70-74, the highest probability was observed for older people living in town and fringe areas, relative to those aged 0-69. Deprivation in the most deprived areas relative to the least deprived areas in town and fringe settlements was a statistically significant factor in the regression model. People living in the two most deprived quintiles had a 17 per cent higher risk of fatality than those in the three least deprived quintiles. This result contrasts with the non-statistically significant result in village and dispersed areas, which shows that the risk of death was actually 6 per cent lower in more deprived areas than in the least deprived areas. The risk of fatality increased with further distances from accident and emergency services in both settlement types, although distance was not a statistically significant factor in the model. This indicates that the increase may not be statistically reliable, most likely because the areas are sparsely populated and therefore have relatively few deaths in comparison to densely populated areas.

42
5.4 Limitations The calculation of straight-line distances using GIS was used to work out mean distances (in kilometres) between the postcode of people who died as a result of an AMI and the nearest accident and emergency facility. This technique does not account for (and often underestimates) journey times, which are arguably more crucial in emergency cases, or for sparse road networks, the use of emergency helicopters in very rural/very urban areas or geographical barriers such as hills, rivers and coastline (Jordan et al 2004b). This analysis utilised secondary data to explore the links between mortality, fatality and access to emergency medical services. As such, it is not possible to infer causation from the results. Further, there are numerous other factors which may have influenced the outcome of AMI cases, such as service provision/availability, timeliness and quality of care. The mortality and population data used in the mortality and fatality analyses were based on the 2008 calendar year. However, the hospital admissions data were only available for the 2007-08 financial year, which means that the fatality analysis was not wholly based on the same time period. The mortality and distance data used in this analysis were based on aggregated data to provide area- and deprivation-based results but there are likely to be large variations within the groups used for the regression analysis, particularly within sparse area types. This method is therefore subject to the ecological fallacy, which means that assumptions about individuals cannot be made from results relating to aggregate data (Bryman 2008). Data for the most recent year available was selected for this study to avoid double-counting people who may be admitted to hospital with an AMI on more than one occasion over several years. Although it is possible that an individual could be admitted numerous times within a one-year period, it was considered that the results will be more accurate than if they were combined for a number of years. In the hospital admissions data, there were 242 out of 54,069 cases which were not assigned to a deprivation quintile within each RUAC 2004 area type. No adjustments were made for this in the fatality analysis. To calculate fatality rates, the number of patients admitted plus the number who died from an AMI outside of hospital was used as the population denominator on the assumption that persons who die in hospital will be included in the admissions data. However, this was only an estimate of the total number of AMI incidents in 2008 based on known cases, and may therefore be an underestimate. For instance, people who were already admitted to hospital with a different condition and then subsequently experienced an AMI will not be included in the figures. The distance analysis focused on accident and emergency units in England which were open as at June 2009. No account was taken for new hospitals which may not have existed during 2008 or for those which may have closed during that year and therefore no longer appear in current records.

43
Another issue in the distance analysis concerned people living near the borders of Scotland and Wales. Although the nearest hospital for some may have been outside of England, they were allocated to the nearest hospital inside of England for the purpose of this analysis. In the distance analysis, it was assumed that people suffer AMIs at home and the mean distances were calculated from their postcode of usual residence. This took no account of people who experienced an AMI away from their home. However, this type of data was not available.
5.5 Key Findings
In 2008, age-standardised mortality rates, where the underlying cause of death was acute myocardial infarction, were higher in urban areas (34 per 100,000) than in rural areas (27 per 100,000). Rates were lowest in village and dispersed settlements (26 per 100,000). In all settlement types, broad variation in mortality rates was evident between the deprivation quintiles, rates between the least and most deprived quintiles varied from 23 to 51 per 100,000 respectively. Large differences between quintiles 4 and 5 (most deprived) were observed within each area. Without adjusting for deprivation fatality rates were similar in urban and in town and fringe settlements at 303 and 301 per 1,000 respectively. Rates were much lower in village and dispersed settlements at 190 per 1,000. In terms of deprivation, fatality rates consistently increased from the least to the most deprived quintiles in urban areas. However, deprivation had little effect on fatality within rural areas, apart from between quintiles 4 and 5 (most deprived) in town and fringe settlements. The mean distance to the nearest accident and emergency unit for persons who died as a result of an AMI in 2008 was shorter in urban areas (5.8km) than in rural areas (14.0km). In urban areas, people in the most deprived quintile lived closest to emergency medical services and vice versa. There was no clear pattern of mean distances across deprivation quintiles in rural settlement types, although those living in the most deprived areas still have the shortest mean distance to the nearest accident and emergency unit. Within rural settlement types, the risk of fatality was 21 per cent higher in town and fringe areas than in village and dispersed settlements. The logistic regression analysis showed that the probability of fatality in rural areas increased with each of the following factors: age, deprivation and distance from emergency medical services, with age being the most significant In both types of settlement of rural settlement, the probability of fatality increased with increasing age (statistically significant) and distance (not statistically significant). It is likely that distance was not a significant factor as the numbers of deaths in sparsely populated areas were not large enough for robust calculations.

44
Deprivation was a significant factor in town and fringe areas, where the risk of fatality was 17 per cent higher in more deprived areas than in less deprived areas. However, deprivation was not significant in village and dispersed areas.
5.6 Conclusions The results from this analysis showed no conclusive links between the rates of mortality and fatality from acute myocardial infarction and access to emergency medical services. Due to deprivation factors there was an inverse relationship between fatality and mean distance to accident and emergency units in urban areas, but no clear pattern was evident within rural settlements. Large inequalities in mortality and fatality between quintiles 4 and 5 (most deprived) were evident in each, both urban and town and fringe areas, even though people in the most deprived areas lived closest, on average, to the nearest emergency medical services. Therefore any association between access to emergency services and rates of mortality and fatality from AMI may be overshadowed by the fact that those living in deprived areas have higher rates of mortality and fatality. The logistic regression analyses of fatality rates showed a higher probability of fatality for people living in town and fringe settlements than those living in village and dispersed areas. The fatality rate rose with increasing distance in both settlement types and although not a statistically significant factor in the model could still be an important factor when considering rural access to emergency services. The effect of deprivation was found to be different between the two rural settlement types. In town and fringe areas deprivation was a statistically significant factor increasing the probability of fatality. In contrast in village and dispersed areas deprivation was not a statistically significant factor. While there is an association between access to emergency services, as measured by mean distance, and fatality rates the effect of deprivation is far greater.

45
6. Self-reported health perception and migration in rural areas
6.1 Introduction This chapter examines health-associated migration and whether there is any evidence that people in England with (self-reported) poor health are more likely to move away from rural areas to urban areas. Further, the influence of socio-economic status on internal migration will also be assessed. These results could have implications for service planning and the future coherence of rural communities. There are many reasons why people choose to move from one area to another; for example for education, work or retirement, and moves are made across all age groups. Official statistics on recent internal migration patterns reveal that, during 2005, there were large gains in rural areas of people aged under 15, and between 30 and 64, and consequent losses from major urban areas (Office for National Statistics 2007). The picture is reversed for the 15 to 29 age group. In 2005 most households moving into rural areas are families with young children and people aged from about 44 to 64. For people over 65, migration to rural areas is also significant, but as a proportion of all people moving the figures are much lower than the middle age groups, showing that retirement to rural areas is not necessarily the major factor in internal migration. However it could be argued that those who have moved at older ages are more likely to remain in an area whereas those at younger ages may move again. Research has shown that between 2001 and 2005 the population of rural England rose at a faster rate, in percentage terms, than the country as a whole, with less sparse villages and hamlets growing fastest (Commission for Rural Communities 2008). Most of this increase was accounted for by internal migration by people moving out of cities rather than different birth and death rates between urban and rural areas. Nonetheless the rural population is ageing at a faster rate than the urban population and this growth is particularly pronounced among those aged 85 and over (Social Exclusion Task Force, 2009). This is an important consideration for rural health needs as rates of reported limiting long-term illness (LLTI) increase rapidly with age, at the 2001 Census approximately 60 per cent of those aged over 75 reported having an LLTI (Office for National Statistics, 2006). Little analysis has been published on health-associated migration patterns, that is, the effect that people’s health has on their decisions for moving. People who are not in good health, and/or have a disability, may, for example, be more likely to move from rural to urban areas, or to have stayed in an urban area, because of the increased centralisation of access to health and social care support. They may also have chosen to remain in the rural location to take advantage of the perceived health benefits. People may also decide to move or remain in an area for other reasons, for example to live close to family members, for financial reasons, or because of decreasing physical fitness.

46
6.2 Methods
Data sources Data were extracted from the 2001 Census which included questions on general health and place of residence one year before and at the time of the Census. The question on long-term illness asked respondents: ‘Do you have any long-term illness, health problem or disability which limits your daily activities or the work you can do?’ Responses could either be ‘yes’ or ‘no’. The question refers to the respondents’ perception of their health in 2001, and not in the previous year, so in this analysis we have assumed that someone with a long term illness in 2001 would probably have had a long term illness in 2000. The effect of this assumption is discussed in the ‘Limitations of the Analysis’ section below. The question on place of residence asked ‘What was your usual address one year ago?’ and asked respondents whether it was ‘the address shown on the front of the form, no usual address one year ago or was elsewhere’ with space to provide full address and postcode. For the purposes of this analysis each postcode response was linked to a Lower Super Output Area (LSOA). These LSOAs were subsequently assigned to one of the six rural/urban classes according to the RUAC 2004 classification. People living in communal establishments, and people reporting 'No usual address one year ago' (e.g. persons sleeping rough or travellers who had no fixed abode one year before Census) were excluded from all analyses. People of different ages have many different motives for moving and for this reason the data were analysed, for the household reference person (HRP), separately according to three different age ranges; ‘largely working-aged HRPs’ This included all HRPs who were aged between 25 and 64. The second age range included all HRPs who were aged 65 and over, the age group ‘older people’. The final age range includes those where HRPs were aged less than 25; ‘children and young people’. For each of these three age ranges examined, the distribution of the population by settlement type and household composition were established for background (see Figures 1 and 2). To assess what the perception of health was by settlement type, the proportion of HRPs for the older age groups reporting a limiting long-term illness was tabulated by settlement type. Around five per cent of the under 25 age range were HRPs. For this reason, all analyses were performed on the individual rather than the HRP.
Analysis To examine whether persons in a rural area were more likely to move out of a rural area if they reported that they had a limiting long-term illness, all subsequent analyses were confined to household heads who lived in one of the four rural settlement types in 2000. Initial tabulations were undertaken to assess the effect of age, household composition and the presence of reported limited long-term illness on the likelihood of moving to an urban area. Subsequent logistic regression models were used to determine the likelihood of moving to an urban area if a LLTI was reported relative to no LLTI reported for each of the three age ranges and household-type combination. Finally the influence of socio-economic status on any health-associated migration was examined by adding the National Statistics Socio Economic Classification (NS-SEC) variable to the logistic models. Although NS-SEC data are coded for all adults up to 74 at Census, data for ages 65-74 by NS-SEC is very patchy and unreliable as people get

47
categorised as being ‘not classified’ if they haven't worked for more than five years. This has the overall effect of lowering NS-SEC counts in higher classes in this age-group when this may not be valid. Below age 25, people aren't usually in their stable 'lifetime' NS-SEC category yet, and for our purposes should be analysed in a separate 'children' analysis. For these reasons, the inclusion of the NS-SEC variable was limited to the ‘Largely working-age population’ (aged 25-64) age range.
6.3 Results The results are presented in the following order according to the three different age ranges analysed:
A. Largely working-aged HRPs’; this included all HRPs who were aged between 25 and 64. B. All HRPs who were aged 65 and over age group – older people C. HRPs aged less than 25 - ‘children and young people’
A. Largely working age household heads (aged 25 – 64) In 2000, the year before the Census was undertaken in England, approximately one fifth (18.4 per cent) of ‘largely working age HRPs, i.e. those aged between 25 and 64, lived in a settlement type that was classified as rural’. By 2001, there was little change and a similar proportion of HRPs aged between 25 and 64 lived in a rural area (18.5 per cent). The rural areas were generally found to have an older age profile compared with urban areas (see Figure 6.2). At Census 2001, around three fifths of HRPs aged 25 to 64 living in areas classified as ‘Village and dispersed’ areas were aged over 45. By contrast, in the ‘Urban Less Sparse’ areas, this was closer to half of all HRPs. Areas classified as ‘Urban Sparse’ had very similar age profiles to ‘Town and Fringe’ areas. Figure 6.2 Age distribution of household heads aged 25 to 64, by settlement type, England, Census 2001
0%
20%
40%
60%
80%
100%
Urban lesssparse
Urban sparse Town &Fringe less
sparse
Town &Fringe sparse
Village &dispersed less
sparse
Village &dispersed
sparseSettlement type
Perc
enta
ge o
f hou
seho
ld h
eads
55-64
45-54
35-44
25-34

48
Census 2001 showed that couple families were the most common household composition type across all settlements; however the proportions were greatest in the village and dispersed areas (see Figure 6.3). In contrast, urban areas had larger proportions of household heads not living as part of a family (approximately 25 per cent). This grouping would include people who lived on their own and those who lived in a family household but were themselves outside the family, for example a lodger. It would also include households where all persons were ‘ungrouped individuals’ such as students sharing a house.
Figure 6.3 Composition of household heads aged 25 to 64, by settlement type, England, Census 2001
0%
20%
40%
60%
80%
100%
Urban lesssparse
Urban sparse Town &Fringe less
sparse
Town &Fringe sparse
Village &dispersed less
sparse
Village &dispersed
sparseSettlement type
Perc
enta
ge o
f hou
seho
ld h
eads
Not in a family -pensioner
Not in a familyother
In lone parentfamily - parent
In a couple family -member of couple
HRPs living on their own were less common in rural areas, while living as part of a couple without children was more common. HRPs living as part of a lone parent families was more common in urban areas than rural areas. Within rural areas the distribution of household composition types in ‘Town and Fringe Sparse’ areas was similar to the distribution in ‘Urban Sparse’ areas.

49
Figure 6.4 Presence of LLTI in 2001, for Household Reference Persons aged 25 to 64, by settlement type in 2001, England
0
5
10
15
20
25
30
Urban lesssparse
Urban sparse Town &Fringe less
sparse
Town &Fringe sparse
Village &dispersed less
sparse
Village &dispersed
sparseSettlement type
Perc
enta
ge o
f pop
ulat
ion
Table 6.5 – Percentage of population reporting an LLTI in 2001, household heads aged 25 to 64, by settlement type, England
Area %
Limiting long term
illness Total All areas 14.7 2102533 14267981 Urban 15.3 1783806 11633909 Town & Fringe 15.3 1788098 11668647 Village, hamlet and isolated dwellings 12.9 172325 1340723 Rural 15.1 1960423 13009370 Rural sparse 14.0 23080 164530 Rural less sparse 12.0 295647 2469542 Urban sparse 17.0 4889 28765 Urban less sparse 15.3 1778917 11605144 Town & Fringe sparse 14.5 9181 63503 Town & Fringe less sparse 12.8 163144 1277220 Village, hamlet and isolated dwellings sparse 13.8 13899 101027 Village, hamlet and isolated dwellings less sparse 11.1 132503 1192322

50
HRPs aged 25 to 64 living in urban areas were more likely than those living in rural areas to report having an LLTI (17 per cent in ‘Urban Less Sparse’ areas and 15 per cent in ‘Urban Sparse’ areas). Those living in the ‘Less Sparse’ areas were less likely to report having an LLTI than those living in ‘Sparse’ areas across settlement types. There is some evidence that fewer household heads living in rural settlement types report that they suffer from limiting long-term illnesses than their urban counterparts but the sparsity of the settlement also seems to have an effect (Figure 6.4 and Table 6.5). Many factors may affect the reasons behind a person’s decision to move, in this analysis the impact of age or household composition has been investigated. Between 2000 and 2001, less than 1 per cent (0.8 per cent) of those aged 25-64 moved from a rural to an urban area. Among those who did move however, a greater proportion of younger HRPs, that is those aged between 25 and 34 moved to an urban area (2 per cent) compared with those in older age groups (0.4 per cent of those aged between 55 and 64) (Table 6.6). While these proportions are small this analysis only looked at migration over a single year; over several years (for example between censuses) this could be a much more substantial number of moves.
Table 6.6 – Percentage of household heads aged 25 to 64 who moved from a rural to an urban area between 2000 and 2001, by age, England
Base = 100% Age range No
move %
Moved -rural to urban area %
All %
No move Moved - rural to urban area
All
25 – 34 98.5 1.5 100 3,182,919 49,693 3,232,612 35 – 44 99.3 0.7 100 4,101,420 29,615 4,131,035 45 – 54 99.5 0.5 100 3,783,681 18,831 3,802,512 55 – 64 99.6 0.4 100 3,090,886 10,936 3,101,822 All aged 25-64 99.3 0.8 100 14,158,906 109,075 14,267,981 Among the different household compositions that had moved from a rural area to an urban area between 2000 and 2001, HRPs aged 25 to 64 who were ‘not in a family – other’ made the most moves (1 per cent moved) while those who were ‘not in a family – pensioner’ made the fewest moves (0.4 per cent moved) (Table 6.7).

51
Table 6.7 – Percentage of household heads aged 25 to 64 who moved from a rural to an urban area between 2000 and 2001, by household composition, England
Base = 100% Household composition
No move %
Moved -rural to urban area %
All %
No move Moved - rural to urban area
All
Couple family 99.4 0.6 100 8,995,519 58,100 9,053,619 Lone parent family
99.3 0.7 100 1,660,712 10,938 1,671,650
Not in a family – other
98.8 1.2 100 3,240,419 38,914 3,279,333
Not in a family – pensioner
99.6 0.4 100 262,256 1,123 263,379
All household types
99.2 0.8 100 14,158,906 109,075 14,267,981
Fewer HRPs aged 25 to 64 who had a limiting long-term illness made the move from a rural area to an urban area (0.5 per cent) between 2000 and 2001 compared with those who did not report having an illness (0.8 per cent) (Table 6.8). Table 6.8 – Percentage of household heads aged 25 to 64 who moved from a rural to an urban area between 2000 and 2001, by presence of LLTI, England
Base = 100%
Limiting long-term illness
No move %
Moved -rural to urban area %
All %
No move Moved - rural to urban area
All
Not reported 99.2 0.8 100 12,067,580 97,868 12,165,448 Reported 99.5 0.5 100 2,091,3266 11,207 2,102,533 All 99.3 0.8 100 14,158,906 109,075 14,267,981 The preliminary analyses of HRPs aged 25 to 64 above illustrated that both age and household type may have an influence on migration to an urban setting. Thus to assess any additional influences of the effect of the presence of a limiting long-term illness it was necessary to examine the groups separately. These sub-groups were further investigated using a logistic regression analysis.

52
Logistic regression analysis for HRPs aged 25 to 64 Table 6.9 shows the odds ratios for the likelihood of moving between rural and urban areas in England, if an LLTI is reported at Census 2001 relative to no reported LLTI. The results are displayed for each of the HRPs household types and age bands. Table 6.9 Odds ratios of moving from a rural to an urban area between 2000 and 2001, for Household Reference Persons aged 25 to 64, having reported an LLTI (relative to no reported LLTI), in 2001, England
Household Composition Couple Lone parent Not in family - other Not in family
pensioner Age range
Ratio 95% CI Ratio 95% CI Ratio 95% CI Ratio 95% CI
25 to 34 1.01 0.95,1.07 1.06 0.95,1.19 0.74*** 0.70,0.79 35 to 44 1.06* 1.00,1.14 0.99 0.90,1.10 0.91** 0.85,0.97 45 to 54 1.19*** 1.12,1.28 0.90 0.80,1.01 0.87*** 0.82,0.93 55 to 64 1.26*** 1.19,1.34 0.91 0.76,1.12 1.11** 1.03,1.20 1.47*** 1.30,1.66 * Statistically significant (p-value < 0.05), ** statistically significant (p-value < 0.01) and *** statistically significant (p-value < 0.001). Older HRPs (aged between 55 and 64) with an LLTI, living in a couple family had a 26 per cent higher probability of moving from a rural to an urban area between 2000 and 2001 than those with no LLTI. This meant that 1.4 per cent of household heads who were in the oldest age group (55 to 64) and in a couple family moved if there was a limiting long-term illness compared with 1.2 per cent of those in the older aged band and in a couple family who moved but did not have an illness (Table 6.10 See appendix). Household heads, aged between 45 and 54, living in a couple family and reporting a limiting long-term illness were 19 per cent more likely to move from a rural to urban area. Those HRPs, aged between 55 and 64, not living in a family but a pensioner household who had reported a limiting long-term illness had a 47 per cent higher probability of moving to an urban area (3.2 per cent of this group moved) compared with those who did not report an illness (2.2 per cent of this group moved) (Table 6.11 see appendix). In contrast, those younger HRPs (in the age ranges 25 to 34, 35 to 44 and 45 to 54) and who were not living in a family household (such as lodgers, students or those living on their own) were less likely to move to an urban setting (26 per cent lower, 9 per cent lower and 13 per cent lower respectively than those who remained in rural areas). The model was subsequently adjusted by socio-economic status of the head of household.

53
Table 6.12 Odds ratios of moving from a rural to an urban area between 2000 and 2001, for Household Reference Persons aged 25 to 64, having reported an LLTI (relative to no reported LLTI), 2001, adjusted by NS-SEC, England
Household Composition Couple Lone parent Not in family - other Not in family -
pensioner Age range
Ratio 95% CI Ratio 95% CI Ratio 95% CI Ratio 95% CI
25 to 34 1.05 0.98,1.11 1.15* 1.02,1.29 0.84*** 0.79,0.90 35 to 44 1.04 0.98,1.11 1.05 0.95,1.16 0.93 0.87,1.00 45 to 54 1.13*** 1.06,1.21 0.97 0.86,1.10 0.96 0.90,1.03 55 to 64 1.24*** 1.17,1.33 0.92 0.75,1.13 1.19*** 1.10,1.30 1.54*** 1.36,1.75 * Statistically significant (p-value < 0.05), ** statistically significant (p-value < 0.01) and *** statistically significant (p-value < 0.001). Comparing the results presented in Tables 6.9 and 6.12 shows that adjusting for NS-SEC generally had very little impact on the overall patterns for migration between rural and urban areas among those who reported a limiting long-term illness.

54
B. Analysis of those aged 65 and over At the 2001 Census 45 per cent of household heads aged 65 and over reported having a limiting long-term illness. Between 2000 and 2001, 1.2 per cent of HRPs aged 65 and over who reported a limiting long-term illness had moved from a rural to urban area compared to 1.0 per cent of those who reported no illness (Table 6.13). Table 6.13 – Percentage of household heads aged 65 and over who moved from a rural to an urban area between 2000 and 2001, by presence of LLTI, England
Limiting long-term illness
No move %
Moved -rural to urban area %
All %
No move Moved - rural to urban area
All
Not reported 99.0 1.0 100 584,907 6,175 591,082 Reported 98.8 1.2 100 481,361 5,803 487,164 All 98.9 1.1 100 1,066,268 11,978 1,078,246 Logistic regression by age and household composition gave some evidence that more household heads aged 65 and over who reported a limiting long term illness moved from a rural to an urban area between 2000 and 2001. This difference was less evident for older pensioners (Table 6.14). Table 6.14 Odds ratios of moving from a rural to an urban area between 2000 and 2001, having reported an LLTI (relative to no reported LLTI), 2001, England
Persons aged 65 and over
Couple Lone parent Not in family pensioner
Age range
Ratio 95% CI Ratio 95% CI Ratio 95% CI
65 to 74 1.26*** 1.19,1.35 1.29 0.99,1.68 1.27*** 1.18,1.37 Over 75 1.20** 1.06,1.37 1.10 0.86,1.41 1.12** 1.04,1.20 * Statistically significant (p-value < 0.05), ** statistically significant (p-value < 0.01) and *** statistically significant (p-value < 0.001). Generally the differences by age and household type were neither as strong or distinct compared with the younger age groups. Among household heads aged between 65 and 74 who were also members of a couple family, 1.3 per cent of those reporting a limiting long-term illness moved from a rural to an urban area between 2000 and 2001 compared with 1 per cent who did not report an illness (Table 6.15, see appendix).

55
Table 6.16 Odds ratios of moving from a rural to an urban area between 2000 and 2001, having reported an LLTI (relative to no LLTI), 2001, adjusted by NS-SEC, England
Persons aged 65 and over Couple Lone parent Not in family
pensioner Age range
Ratio 95% CI Ratio 95% CI Ratio 95% CI
65 to 74 1.15*** 1.08,1.23 1.1 0.84,1.44 1.10** 1.02,1.19 Over 75 1.13 0.99,1.28 1.02 0.80,1.32 1.02 0.95,1.10 * Statistically significant (p-value < 0.05), ** statistically significant (p-value < 0.01) and *** statistically significant (p-value < 0.001). There is evidence that some of the migration from rural to urban areas can be linked to socio-economic classification for the over 75 age group as the probability of moving from a rural to an urban area if they report an LLTI is no longer statistically significant. However there is still evidence that HRPs aged between 65 and 74 who reported a limiting long-term illness were more likely to move from a rural to an urban area compared with those who did not report an illness (Table 6.16). Those in a couple household were 15 per cent more likely and those who were not in a family but in a pensioner household 10 per cent more likely.
C. Analysis of those aged under 25 The analyses in this age range were performed on individuals who reported a limiting long-term illness as only around 5 per cent of this age group were HRPs. Two age ranges were identified, 0 to 15 and 16 to 24. The majority, around two thirds, of all those aged under 25 were dependent children living in a couple family (Figure 6.17). Figure 6.17 Household composition of individuals aged under 25, England, Census 2001
0
10
20
30
40
50
60
70
Dependentchild in a
couple family
Member ofcouple
Other child ofcouple
Dependentchild in loneparent family
Parent in loneparent family
Other child oflone parent
Not in afamily
Household type
Perc
enat
age
of in
divi
dual

56
Between 2000 and 2001, 6.6 per cent of individuals aged under 25 who reported a limiting long-term illness had moved from a rural to urban area compared to 6.0 per cent of those who reported no illness (Table 6.18). This increase of movement among the younger age group, irrespective of presence of illness, is consistent with internal patterns of migration which illustrate younger aged individuals are most likely to move to urban areas either for work of for study. Table 6.18 Percentage of individuals aged under 25 who moved from a rural to an urban area between 2000 and 2001, by presence of LLTI, England
Limiting long-term illness
No move %
Moved -rural to urban area %
All %
No move Moved - rural to urban area
All
Not reported 94.0 6.0 100 2,221,841 141,262 2,363,103 Reported 93.4 6.6 100 94,423 6,690 101,113 All 94.0 6.0 100 2,316,264 147,952 2,464,216 Among the younger age group (aged under 16) there was no evidence that the presence of a limiting long-term illness affected the likelihood of moving. This was true for those in the older age group (aged 16 to 24) if they were also a dependent child. However, there was evidence that ‘non-dependent children’ in a couple family were 15 per more likely to move to an urban area if they reported have a limiting long-term illness (Table 6.19) rather than staying in the rural area. Individuals were who were in a couple or not in a family were less likely to move to an urban area if they reported a limiting long-term illness (22 per cent and 44 per cent less likely respectively). Table 6.19 Odds ratios of moving from a rural to an urban area between 2000 and 2001, having reported an LLTI (relative to no reported LLTI), persons aged under 25, in 2001, England
Aged under 16 Aged 16 to 24 Household type Ratio 95% CI Ratio 95% CI Dependent child in a couple family
1.03 0.97,1.09 1.16 0.97,1.39
Member of a couple . . 0.78*** 0.73,0.83 Other child of couple . . 1.15** 1.04,1.27 Dependent child in lone parent family
0.96 0.90,1.03 1.06 0.86,1.31
Parent in lone parent family
. . 1.19** 1.05,1.35
Other child of lone parent
. . 0.82 0.67,1.02
Not in a family 0.87 0.69,1.10 0.56*** 0.53,0.60 * Statistically significant (p-value < 0.05), ** statistically significant (p-value < 0.01) and *** statistically significant (p-value < 0.001). Not applicable ‘.’.

57
Appendix tables 6.20 to 6.21 clearly illustrate the larger percentages of young people aged between 16 and 24 who move to urban areas regardless of the presence of a limiting long-term illness. Adjusting by the NS-SEC of the household head made little difference to the results.
6.4 Limitations Only a relatively small number of moves from rural to urban areas were actually made between 2000 and 2001, irrespective of health status. This precluded further disaggregation of both the rural and urban areas to establish whether respondents were moving from a particular type of rural settlement to a particular type of urban settlement. However this analysis only looked at migration over a single year; over several years (for example between censuses), this could be a much more substantial number of moves. Previous studies have highlighted the intra-rural variation in reporting limiting long-term illnesses and the need to treat rural areas separately (Barnett et al, 2001) which was not done in this study. A larger number of moves would have enabled stronger conclusions to be drawn. In addition, the analysis did not further explore health related migration from urban to rural areas. It was not possible to determine from the data source why people had in fact moved during the year analysed. Their health may have had little to do with decision process. As discussed in the introduction people cite many different reasons for moving. The analysis focused only on the self-reported health of the head of the household, for those aged 25 and over and on the individual, for those aged under 25. In fact, the majority of household heads and individuals were living in couple families. Thus the presence of a limiting long-term illness within the family and any resultant migration is likely to be under-reported in our analysis. Data was limited to respondents’ self-reported presence or absence of a limiting long-term illness in 2001. It was impossible to determine the number who may have had the limiting long-term illness prior to 2000 and thus may have already made the decision to move to an urban area for health reasons.
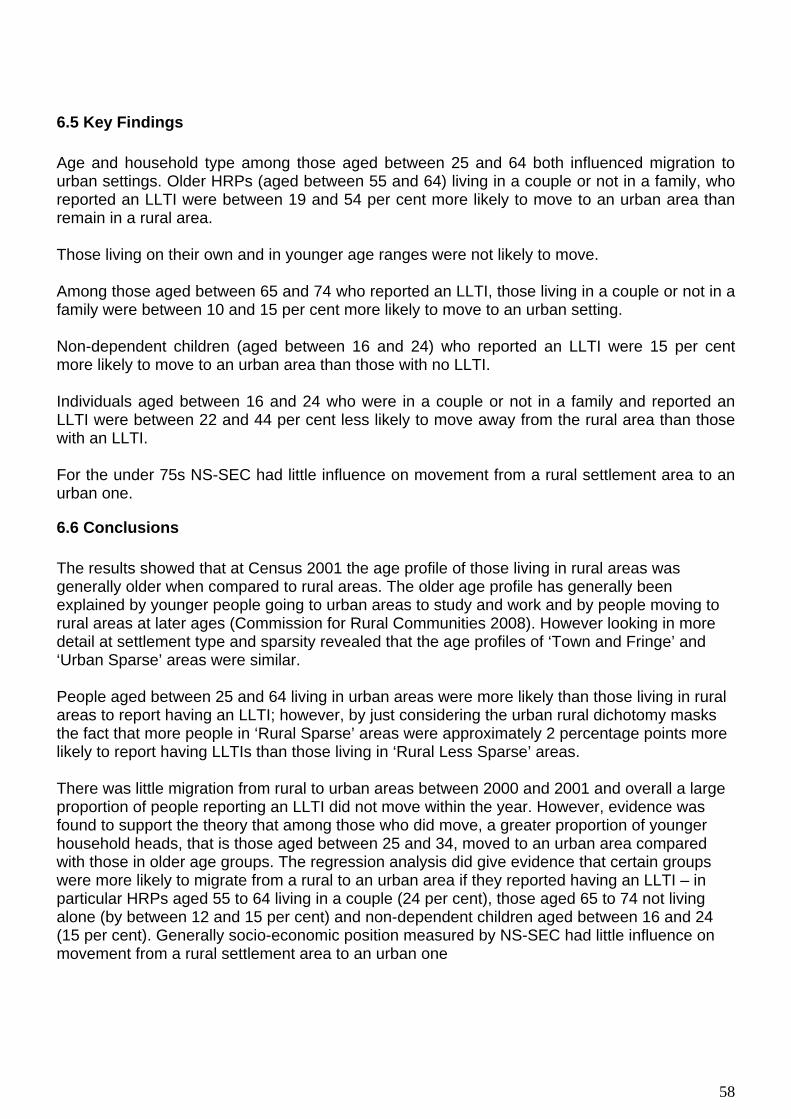
58
6.5 Key Findings Age and household type among those aged between 25 and 64 both influenced migration to urban settings. Older HRPs (aged between 55 and 64) living in a couple or not in a family, who reported an LLTI were between 19 and 54 per cent more likely to move to an urban area than remain in a rural area. Those living on their own and in younger age ranges were not likely to move. Among those aged between 65 and 74 who reported an LLTI, those living in a couple or not in a family were between 10 and 15 per cent more likely to move to an urban setting. Non-dependent children (aged between 16 and 24) who reported an LLTI were 15 per cent more likely to move to an urban area than those with no LLTI. Individuals aged between 16 and 24 who were in a couple or not in a family and reported an LLTI were between 22 and 44 per cent less likely to move away from the rural area than those with an LLTI. For the under 75s NS-SEC had little influence on movement from a rural settlement area to an urban one.
6.6 Conclusions The results showed that at Census 2001 the age profile of those living in rural areas was generally older when compared to rural areas. The older age profile has generally been explained by younger people going to urban areas to study and work and by people moving to rural areas at later ages (Commission for Rural Communities 2008). However looking in more detail at settlement type and sparsity revealed that the age profiles of ‘Town and Fringe’ and ‘Urban Sparse’ areas were similar. People aged between 25 and 64 living in urban areas were more likely than those living in rural areas to report having an LLTI; however, by just considering the urban rural dichotomy masks the fact that more people in ‘Rural Sparse’ areas were approximately 2 percentage points more likely to report having LLTIs than those living in ‘Rural Less Sparse’ areas. There was little migration from rural to urban areas between 2000 and 2001 and overall a large proportion of people reporting an LLTI did not move within the year. However, evidence was found to support the theory that among those who did move, a greater proportion of younger household heads, that is those aged between 25 and 34, moved to an urban area compared with those in older age groups. The regression analysis did give evidence that certain groups were more likely to migrate from a rural to an urban area if they reported having an LLTI – in particular HRPs aged 55 to 64 living in a couple (24 per cent), those aged 65 to 74 not living alone (by between 12 and 15 per cent) and non-dependent children aged between 16 and 24 (15 per cent). Generally socio-economic position measured by NS-SEC had little influence on movement from a rural settlement area to an urban one

59
7. Variations in life expectancy at birth between rural and urban areas of England, 2001-07
7.1 Introduction
This chapter investigates differences in period life expectancy at birth in England according to different rural and urban area types within the Rural and Urban Area Classification 2004. The effect of deprivation within each area, measured using the Index of Multiple Deprivation 2007, was also examined. The analyses utilised the latest population and mortality data, aggregated over the 2001-07 period, to provide a more detailed and robust examination of variations in life expectancy between rural and urban areas than has been produced previously.
Life expectancy
At present, the Office for National Statistics (ONS) reports annually on life expectancy figures for the United Kingdom (UK), constituent countries and sub-national areas down to local authority level. Results are calculated as three-year averages in accordance with methodological recommendations (Toson and Baker, 2003). Life expectancy at birth in the UK is generally higher for females than males and is higher in the south compared with the north (Kyte and Gordon 2009; Office for National Statistics, 2009). For 2006-08, life expectancy in England was highest in the South East, South West and East of England and lowest in the North West and North East. At local authority level, broad inequalities were evident and figures ranged from 73.6 years to 84.3 years for males and from 78.8 years to 88.9 years for females. In addition to the standard annual figures, results have also been periodically produced to examine life expectancy within smaller geographical areas.
ONS calculated life expectancy at ward-level in England and Wales as experimental statistics for the 1999-2003 period, aiming to identify a suitable methodology for use with small populations, to establish a minimum population size to make the calculations feasible, and to consider the effects of having no deaths in some age groups (Toson and Baker, 2003). The study explored various methods and concluded that: Chiang’s revised methodology should be used for all sub-national life expectancy calculations, calculations should not be performed for areas with populations of less than 5,000; and that if there are no deaths in the final age band, a value based on national age-specific death rates should be inserted. These recommendations have been followed in this study to calculate life expectancy for rural and urban areas.
While the annual figures provide a useful indicator of health outcomes and are used for monitoring changes and variations in the population’s life expectancy, it is not possible to assess specific rural and urban community needs using the results because these areas are not neatly distributed within administrative geographical areas.
At present, there are relatively few studies that have focused on variations in life expectancy between and within rural and urban areas of England and in areas with different levels of deprivation (Charlton, 1996; Raleigh and Kiri, 1997; Woods et al, 2005; Gartner et al, 2007). On
60
the whole, they have reported that life expectancies are higher in rural and less deprived areas and lower in urban and more deprived areas, regardless of the time period under investigation. However, the studies are based on differing area and deprivation classifications and the results are now dated. This study will develop previous work by using the government’s current classifications of rural and urban areas and deprivation, and the latest population and mortality data to present a detailed and robust analysis of variations in life expectancy between rural and urban areas in England.
7.2 Methods
Data Sources
The population data used were unpublished, experimental mid-year LSOA population estimates split by sex and 5-year age group, produced by ONS. ONS mortality data for persons whose usual place of residence was in England, by sex and 5-year age group were also used. The data were combined for the years 2001 to 2007 to ensure that the numbers were large enough, particularly in areas with fewer LSOAs, to ensure that the results calculated were sufficiently robust.
Calculation of period life expectancy
Abridged life tables were constructed using standard methods (Newell, 1994; Shyrock and Siegel, 1976). Separate tables were constructed for males and females, and for each analysis with and without the inclusion of IMD 2007 quintiles. The tables were created using annual mid-year population estimates and numbers of deaths registered in each calendar year, which were aggregated over the 2001-07 period. A detailed description of the standard methods and notation associated with the calculation of life expectancy can be found on the Government Actuary’s Department website (Government Actuary’s Department, online).
The calculation of confidence intervals used the method developed by Chiang (1968). A report detailing research undertaken by ONS to compare methodologies to allow the calculation of confidence intervals for life expectancy at birth has been published in the National Statistics Methodology Series (Toson and Baker, 2003). An example of a life table constructed using the same method used to calculate life expectancy and confidence intervals in this article can be found on the ONS website (Office for National Statistics, 2005).
Meaning of period life expectancy
All figures presented are period life expectancies.
Period expectation of life at a given age for an area in a given time period is an estimate of the average number of years a person of that age would survive if he or she experienced the particular area’s age-specific mortality rates for that time period throughout the rest of his or her life.

61
The figures reflect mortality among those living in the area in each time period, rather than mortality among those born in each area. It is not therefore the number of years a person in the area in each time period could actually expect to live, both because the death rates of the area are likely to change in the future and because many of those in the area may live elsewhere for at least some part of their lives.
Period life expectancy at birth is also not a guide to the remaining expectation of life at any given age. For example, if female life expectancy was 80 years for a particular area, the life expectancy of women aged 65 years in that area would exceed 15 years. This reflects the fact that survival from a particular age depends only on the mortality rates beyond that age, whereas survival from birth is based on mortality rates at every age.
7.3 Results
Life expectancy in rural and urban areas
For 2001-07, life expectancy at birth for males in England was 76.9 years. For females, life expectancy was 4.4 years higher at 81.3 years. However, when the figures were calculated by Index of Multiple Deprivation (IMD) 2007 quintiles, wide variations were observed. Life expectancy for males ranged from 72.4 years in the most deprived areas to 80.2 years in the least deprived areas. For females, expectation of life varied from 78.1 years in the most deprived to 83.5 years in the least deprived areas. This showed differences of 7.8 years and 5.4 years respectively, indicating broader inequalities among males than females.
Using the RUAC 2004, England was divided into dichotomous rural and urban areas. At lower super output area level 19 per cent of areas in England were classified as rural (Table 3.5). Life expectancy was higher in rural areas than in urban areas for both males and females and the difference in life expectancy between the areas was wider among men (2.1 years) than women (1.4 years).
When deprivation quintiles were included in the calculations, more detailed differences in life expectancy were evident. Figure 7.1 shows that in the least deprived quintile, the life expectancy of both males and females was slightly higher in urban areas than in the least deprived rural areas. However, in the other quintiles, life expectancy was lower in urban areas for both men and women. Although the differences between rural and urban areas were relatively small, the gaps in life expectancy are wider between the more deprived quintiles.
In males, life expectancy in urban areas ranged from 72.3 years in the most deprived quintile to 80.3 years in the least deprived, compared with 73.5 years and 79.9 years respectively in rural areas. The variations were much smaller in females, with life expectancy ranging from 78.1 years to 83.6 years in the most deprived to the least deprived urban areas and from 78.4 years to 83.3 years respectively in rural areas. The figures show that inequalities were widest among men in urban areas (8.0 years).
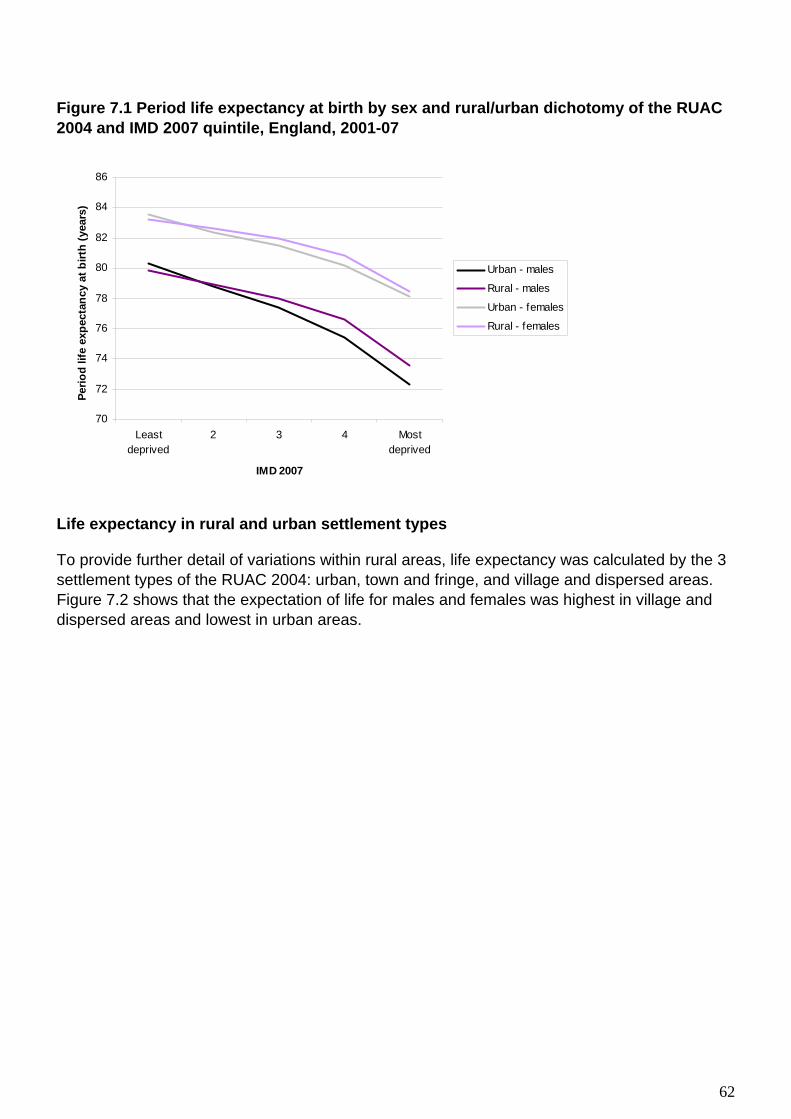
62
Figure 7.1 Period life expectancy at birth by sex and rural/urban dichotomy of the RUAC 2004 and IMD 2007 quintile, England, 2001-07
70
72
74
76
78
80
82
84
86
Leastdeprived
2 3 4 Mostdeprived
IMD 2007
Perio
d lif
e ex
pect
ancy
at b
irth
(yea
rs)
Urban - males
Rural - males
Urban - females
Rural - females
Life expectancy in rural and urban settlement types
To provide further detail of variations within rural areas, life expectancy was calculated by the 3 settlement types of the RUAC 2004: urban, town and fringe, and village and dispersed areas. Figure 7.2 shows that the expectation of life for males and females was highest in village and dispersed areas and lowest in urban areas.
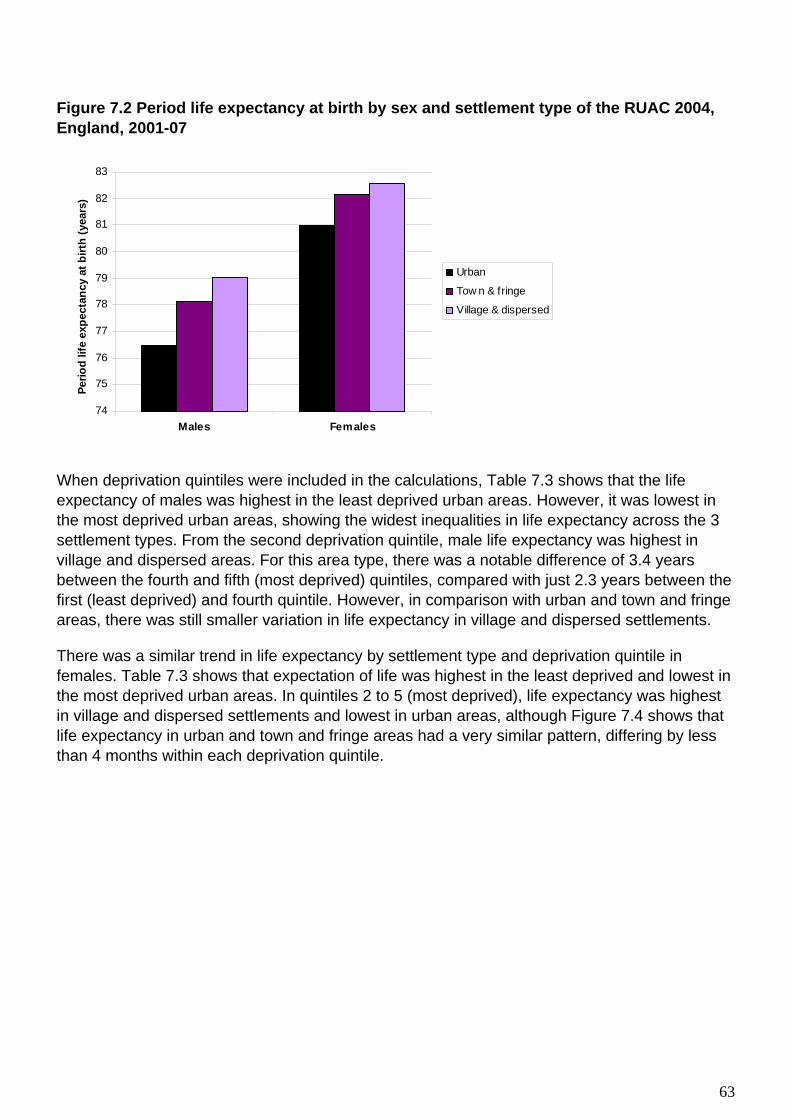
63
Figure 7.2 Period life expectancy at birth by sex and settlement type of the RUAC 2004, England, 2001-07
74
75
76
77
78
79
80
81
82
83
Males Females
Perio
d lif
e ex
pect
ancy
at b
irth
(yea
rs)
Urban
Tow n & fringe
Village & dispersed
When deprivation quintiles were included in the calculations, Table 7.3 shows that the life expectancy of males was highest in the least deprived urban areas. However, it was lowest in the most deprived urban areas, showing the widest inequalities in life expectancy across the 3 settlement types. From the second deprivation quintile, male life expectancy was highest in village and dispersed areas. For this area type, there was a notable difference of 3.4 years between the fourth and fifth (most deprived) quintiles, compared with just 2.3 years between the first (least deprived) and fourth quintile. However, in comparison with urban and town and fringe areas, there was still smaller variation in life expectancy in village and dispersed settlements.
There was a similar trend in life expectancy by settlement type and deprivation quintile in females. Table 7.3 shows that expectation of life was highest in the least deprived and lowest in the most deprived urban areas. In quintiles 2 to 5 (most deprived), life expectancy was highest in village and dispersed settlements and lowest in urban areas, although Figure 7.4 shows that life expectancy in urban and town and fringe areas had a very similar pattern, differing by less than 4 months within each deprivation quintile.

64
Table 7.3 Period life expectancy at birth by sex and rural/urban settlement type of the RUAC 2004 and IMD 2007 quintile, England, 2001-07
Years Sex Settlement
type IMD 2007
Life expectancy at birth
95% Confidence intervals
Lower limit
Upper limit
Males Urban Least 80.3 80.3 80.4 >10,000 2 78.8 78.7 78.8 3 77.4 77.3 77.4 4 75.4 75.4 75.5 Most 72.3 72.3 72.4 Rural Least 79.8 79.7 79.9 Town & fringe 2 78.4 78.2 78.5 3 77.3 77.1 77.4 4 75.7 75.5 75.9 Most 73.4 73.1 73.7 Rural Least 80.0 79.9 80.2 Village & 2 79.3 79.2 79.4 dispersed 3 78.5 78.4 78.6 4 77.7 77.5 78.0 Most 74.3 73.5 75.1 Females Urban Least 83.6 83.5 83.6 >10,000 2 82.4 82.4 82.5 3 81.5 81.5 81.6 4 80.2 80.2 80.3 Most 78.1 78.1 78.2 Rural Least 83.3 83.2 83.4 Town & fringe 2 82.5 82.4 82.6 3 81.6 81.4 81.7 4 80.3 80.1 80.5 Most 78.4 78.1 78.7 Rural Least 83.2 83.0 83.3 Village & 2 82.7 82.6 82.8 dispersed 3 82.3 82.2 82.4 4 81.7 81.5 81.9 Most 78.6 77.8 79.3

65
Figure 7.4 Period life expectancy at birth by sex and rural/urban settlement type of the RUAC 2004 and IMD 2007 quintile, England, 2001-07
70
72
74
76
78
80
82
84
86
Least deprived 2 3 4 Most deprived
IMD 2007
Life
exp
ecta
ncy
at b
irth
(yea
rs)
Males - Urban >10,000
Males - Tow n & fringe
Males - Village & dispersed
Females - Urban >10,000
Females - Tow n & fringe
Females - Village & dispersed
In each settlement type, the differences across the deprivation quintiles were much smaller in females than in males. For females, life expectancy varied by 5.5 years in urban areas, 4.9 years in town and fringe areas, and by 4.6 years in village and dispersed settlements. In males, the differences were 8.0 years, 6.4 years and 5.7 years respectively.
When compared with the England figures, the results for life expectancy across all deprivation quintiles in urban areas are very similar, which may be reflective of the fact that approximately 80 per cent of the population between 2001-07 lived in urban settlements. Although rural areas have fewer residents, variation was evident within different settlement types, with village and dispersed areas experiencing higher life expectancies across the four lowest deprivation quintiles than town and fringe areas. Apart from those in the least deprived quintile, figures for the expectation of life in village and dispersed settlements were above the England average.
Life expectancy in rural and urban sparsity contexts
For further analysis, the RUAC 2004 was split into four sparsity contexts: urban sparse/less sparse and rural sparse/less sparse. Figure 7.5 shows that life expectancy was highest in rural less sparse areas for males (78.6 years) and in rural sparse areas for females (82.7 years). The lowest life expectancies were in urban sparse areas for males (76.1 years) and in urban sparse and less sparse areas for females (81.0 years). For both sexes, life expectancy in each of the rural sparsity contexts was above the England average. However, within both rural and urban areas, sparse areas were not significantly different to less sparse areas.

66
Figure 7.5 Period life expectancy at birth by sex and rural/urban sparsity context of the RUAC 2004, England, 2001-07
72
74
76
78
80
82
84
Males Females
Life
exp
ecta
ncy
at b
irth
(yea
rs)
Urban sparse
Urban less sparse
Rural sparse
Rural less sparse
Table 7.6 shows the life expectancy results for sparsity contexts by deprivation quintile. Results were not calculated for the least deprived urban sparse and the most deprived rural sparse areas due to small numbers of populations. The results showed wide variations between the least and most deprived categories. For males, life expectancy was highest in the least deprived urban less sparse areas (80.3 years), although the figure was only 0.4 years higher than life expectancy in the corresponding rural sparse and less sparse areas (79.9 years). In contrast, expectation of life was lowest in the most deprived less sparse urban areas (72.3 years). A similar pattern was observed in females, however, the differences between the highest and lowest life expectancies in each sparsity context were smaller. Although not all deprivation quintiles were included in the results, there was less variation in life expectancy in sparse areas than in less sparse areas.
The steepest gradient in life expectancy between the least deprived and most deprived areas was observed in less sparse urban areas for both males (8.0 years) and females (5.5 years). In men, the differences in other areas ranged from 6.4 years in rural less sparse areas, 6.2 years in urban sparse areas, and 2.1 years in rural sparse areas. The differences were much smaller in women, ranging by 4.9 years, 2.9 years and 1.1 years for the respective areas. However, not all deprivation quintiles were included in these gradients.

67
Table 7.6 Period life expectancy at birth by sex and rural/urban sparsity context of the RUAC 2004 and IMD 2007 quintile, England, 2001-07
Years Sex Context IMD 2007 Life expectancy at birth 95% Confidence intervals
Lower limit Upper limit
Males Urban Least *** *** *** Sparse 2 79.4 78.6 80.3 3 77.4 76.5 78.4 4 75.6 74.8 76.3 Most 73.2 72.1 74.3 Urban Least 80.3 80.3 80.4
Less Sparse 2 78.8 78.7 78.8
3 77.4 77.3 77.4 4 75.4 75.4 75.5 Most 72.3 72.3 72.4 Rural Least 79.9 79.2 80.5 Sparse 2 79.0 78.6 79.4 3 78.5 78.3 78.8 4 77.8 77.4 78.2 Most *** *** *** Rural Least 79.9 79.8 80.0
Less Sparse 2 78.9 78.8 79.0
3 77.9 77.8 78.0 4 76.3 76.1 76.5 Most 73.5 73.2 73.8 Females Urban Least *** *** *** Sparse 2 81.2 80.2 82.2 3 82.3 81.5 83.1 4 80.9 80.3 81.5 Most 79.4 78.5 80.3 Urban Least 83.6 83.5 83.6
Less Sparse 2 82.4 82.4 82.5
3 81.5 81.5 81.6 4 80.2 80.2 80.3 Most 78.1 78.1 78.2 Rural Least 82.8 82.1 83.5 Sparse 2 83.2 82.8 83.5 3 82.9 82.7 83.2 4 82.1 81.8 82.5 Most *** *** *** Rural Least 83.3 83.2 83.3
Less sparse 2 82.6 82.5 82.7
3 81.9 81.8 81.9 4 80.6 80.4 80.7 Most 78.4 78.1 78.7
*** These categories have small populations and were therefore excluded from life expectancy calculations.

68
7.4 Limitations
An ecological approach was taken to this study, whereby aggregated data about the population in terms of area and deprivation measures were used to produce life expectancy results, to give an indication of average health outcomes. However, this method is susceptible to the ecological fallacy, which means that assumptions about individuals cannot be made from results relating to aggregate data (Bryman, 2008). This limitation is also emphasised by the claim that the poor health of individuals can be masked by favourable averages of the surrounding population (Haynes and Gayle, 2000). However, the methods used to calculate life tables figures require a sufficient number of populations and deaths to be aggregated in order to produce meaningful results and to allow comparisons between different areas.
Life expectancy at birth figures are based on the current population and mortality rates of a given area. The results are an estimate of the number of years a person would survive if he or she experienced the area’s age-specific mortality rates for the rest of his or her life.
The methodology takes no account of migration, which may make a significant difference to the results, particularly as there is a tendency for healthier young people to migrate to urban areas while the less healthy stay at home (O’Reilly et al, 2007). However, this would not be possible within the current death registration system in England as it is the area of usual residence of the deceased that is recorded on death certificates, which does not necessarily reflect the area where they spent most of their life.
This study was based on the assumption that area-based classifications and deprivation-based measures are appropriate and accurate to define and distinguish between different areas. However, limitations and associated methodological issues have been raised in previous work (e.g. Higgs 1999; Romeri et al. 2006). At the individual-level, socio-economic circumstances and health outcomes, even within small areas, may vary greatly and are not necessarily concentrated in, for example, deprived inner city areas or affluent rural settlements. However, the use of small area LSOAs in this analysis is a substantial improvement on previous studies carried out using larger geographical areas.
To improve the current study, the calculation of time series data would enable comparisons to be made over different periods and determine whether inequalities within different area types persist. However, data aggregated over a number of years is required to calculate robust results so further analyses may be limited in terms of meaningfulness and timeliness. A further option, which would be feasible to build upon this study, would be to include life expectancy at age 65 results in the analysis, particularly as rural populations tend to be older than urban populations.
Although life expectancy figures are a useful indicator of health outcomes, Higgs (1999) states that ‘more research is needed to establish the types of factors that are unique to rural areas that may be impacting on health experience and health status ( p.218).

69
7.5 Key Findings
For the 2001-07 period, life expectancy in England was 76.9 years for males and 81.3 years for females. The inclusion of IMD 2007 deprivation quintiles in the calculations had a large impact on the results, varying by 7.8 years for men and 5.4 years for women between the least and most deprived quintiles. Males living in the less deprived quintiles had similar life expectancies to females living in the more deprived quintiles in both urban and rural areas.
Overall, life expectancy was higher in rural areas than urban areas for both males and females. When the impact of deprivation within different area types was examined, wide inequalities were evident, particularly among men and in urban areas. When life expectancies were calculated by area type and deprivation the figures were highest in the least deprived urban areas, but lowest in the most deprived urban areas, showing wide disparities within urban areas. Deprivation in rural areas had seemingly less effect on the rural life expectancy figures as there was smaller variation between the least and most deprived quintiles.
Within rural settlement types, life expectancy was higher in village and dispersed areas than town and fringe areas. However, in village and dispersed communities, there was a large difference between the fourth and fifth deprivation quintiles, which shows that there may be pockets of acute deprivation within this settlement type that need to be addressed.
In terms of rural and urban sparsity contexts, the longest life expectancies were in rural less sparse areas for both sexes. Although not all categories could be included in the deprivation analysis, the results still showed broad variations, with life expectancy being highest in the least deprived urban less sparse areas and lowest in the most deprived urban less sparse areas. Patterns of life expectancies within sparse areas were not clear, even though seven years of data were aggregated. The nature of the areas may mask small pockets of deprivation and poor health which are difficult to capture, and this is reflected in the large confidence intervals surrounding figures for this area type.
7.6 Conclusion The results established clear differences in period life expectancy at birth, both between rural and urban areas and within them by deprivation quintiles. Life expectancies rose with increasing rurality for both sexes and were higher in village and dispersed areas compared with town and fringe areas. In terms of sparsity contexts, the highest life expectancies were in less sparse rural areas, although perhaps due to their very nature, results were unclear for both rural and urban sparse areas. Urban areas experienced lower life expectancies over the 2001-07 period compared with rural areas (apart from those in the least deprived quintile) and when the impact of deprivation was considered, urban areas had the widest gaps between the highest and lowest figures, particularly in men.

70
They show that it is important to examine differences in life expectancies in the context of both area classification and deprivation. Within rural areas, there are intricate differences between life expectancies that are often overlooked by analysing all rural areas together.

71
8. List of References Adams, J. and White, M. (2005), ‘Socio-economic deprivation is associated with increased proximity to general practices in England: an ecological analysis’, Journal of Public Health, vol. 27(1), pp. 80-81 Asthana, S., Halliday, J., Brigham, P. and Gobson, A. (2002), Rural deprivation and service need: a review of the literature and an assessment of indicators for rural service planning, South West Public Health Observatory: Bristol Asthana, S., Gibson, A., Moon, G. and Brigham, P. (2003), ‘Allocating resources for health and social care: the significance of rurality’, Health and Social Care in the Community, vol. 11(6), pp. 486-493 Asthana, S. and Halliday, J. (2004), ‘What can rural agencies do to address the additional costs of rural services? A typology of rural service innovation’, Health and Social Care in the Community, vol. 12(6), pp. 457-465 Baird, A.G. (2006) ‘Poor access to care: rural health deprivation’, British Journal of General Practice, August 2006, pp. 567-568 Barnett, S., Roderick, P., Martin, D., Diamond, I. and Wrigley, H. (2002) ‘Interrelations between three proxies of health care need at the small area level: an urban/rural comparison’, Journal of Epidemiology and Community Health, vol. 56, pp. 754-761 Bevan, A. (1952/1961), In Place of Fear, London: MacGibbon & Kee British Medical Association (2005), Healthcare in a Rural Setting, London: BMA Carstairs, V., Morris, R. (1989) ‘Deprivation and mortality: an alternative to social class? Community Medicine, vol.11, pp. 210-219 Christie, S.M.L. and Fone, D.L. (2003), ‘Does car ownership reflect socio-economic disadvantage in rural areas? A cross-sectional geographical study in Wales, UK’, Public Health, vol.117, pp. 112-116 Cloke, P., Milbourne, P. and Thomas, C. (1997), ‘Living lives in different ways? Deprivation, marginalization and changing lifestyles in rural England’, Transactions of the Institute of British Geographers, New Series, vol. 22(2), pp.210-230 Commission for Rural Communities (2007), What is Rural? Accessed online: www.ruralcommunities.gov.uk/fiels/what%20is%20rural1.pdf Commission for Rural Communities (2008), State of the countryside 2008, accessed online: <www.ruralcommunities.gov.uk/files/The%20State%20of%20the%20Countryside1.pdf> Commission for Rural Communities (2008), State of the Countryside Update 5, accessed online:

72
<www.ruralcommunities.gov.uk/files/socupdate5.pdf Commission for Rural Communities (2009), Key finding from the Rural Services Data series, accessed online: <www.ruralcommunities.gov.uk/publications/keyfindingfromtheruralservicesdataseries2009 Department for Communities and Local Government (2007), The English Indices of Deprivation 2007. Summary (2007) accessed online: www.communities.gov.uk/documents/communities/pdf/576659.pdf Department for Environment, Food and Rural Affairs (2005), Defra Classification of Local Authority Districts and Unitary Authorities in England. A Technical Guide, accessed online; www.defra.gov.uk/evidence/statistics/rural/documents/rural-defn/LAClassifications_technicalguide.pdf Department for Environment, Food and Rural Affairs (2008), Departmental Strategic Objective: Socially and economically sustainable rural communities, accessed online; http://www.defra.gov.uk/rural/policy/dso/index.htm Department of Health (2000), The NHS Plan: A Plan for Investment, A Plan for Reform, Cm 4818-I, London: HMSO Farmer, J.C., Baird, A.G. and Iverson, L. (2001), ‘Rural deprivation: reflecting reality’, British Journal of General Practice, vol.51, pp. 486-491 Gartner, A., Gibbon, R. and Riley, N. (2007), A profile of rural health in Wales, Wales Centre for Health: Cardiff Gartner, A., Farewell, D., Dunstan, F. and Gordon, E. (2008), ‘Differences in mortality between rural and urban areas in England and Wales, 2002-04’, Health Statistics Quarterly, vol.39, pp.6-13 Gilthorpe, M.S. and Wilson, R.C. (2003), ‘Rural/urban differences in the association between deprivation and healthcare utilisation’, Social Science & Medicine, vol.57, pp. 2055-2063 Goldthorpe J (2000), ‘Social class and the differentiation of employment contracts’ in Goldthorpe J (ed), On Sociology: Numbers, Narratives and the Integration of Research and Theory, Oxford University Press: Oxford.
Government Actuary’s Department (online), ‘Interim Life Tables Methodology’, accessed online; http://www.gad.gov.uk/Demography%20Data/Life%20Tables/Interim_life_tables_methodology.html Gulliford, M., Figueroa-Munoz, J., Morgan, M., Hughes, D., Gibson, B., Beech, R. and Hudson, M. (2002), ‘What does ``access to health care” mean?’ Journal of Health Services Research & Policy, vol. 7(3), pp. 186-188

73
Gulliford, M.C., Jack, R.H., Adams, G. and Ukoumunne, O.C. (2004), ‘Availability and structure of primary medical care services and population health and health care indicators in England’, BMC Health Services Research pp. 4-12 Hart, J.T. (1971), ‘The inverse care law’, The Lancet, 27 February, vol. 297, pp. 405-412 Haynes, R. and Gale, S. (2000), ‘Deprivation and poor health in rural areas: inequalities hidden by averages’, Health and Place, vol. 6, pp. 275-285 Haynes, R., Lovett, A. and Sünnenberg, G. (2003), ‘Potential accessibility, travel time and consumer choice: geographical variations in general medical practice registrations in Eastern England’, Environment and Planning A, vol. 35(10), pp. 1733-1750 Higgs, G. and White, S.D. (1997), ‘Changes in service provision in rural areas. Part 1: The use of GIS in analysing accessibility to services in rural deprivation research’, Journal of Rural Studies, vol. 13(4), pp. 441-450 Higgs, G. (1999), ‘Investigating trends in rural health outcomes: a research agenda’, Geoforum, vol. 30, pp. 203-221 Huff, N., Macleod, C., Ebdon, D., Phillips, D., Davies, L. and Nicholson, A. (1999), ‘Inequalities in mortality and illness in Trent NHS Region’, Journal of Public Health Medicine, vol. 21(1), pp.81-87 Jarman, B. (1983), ‘Identification of under-privileged areas’, British Medical Journal, vol. 286, pp. 705-709 Jones. A.P., Haynes, R., Sauerzapf, V., Crawford, S.M., Zhao, H. and Forman, D. (2008) ‘Travel times to health care and survival from cancers in Northern England’, European Journal of Cancer, vol.44, pp. 269-274 Jordan, H., Roderick, P. and Martin, D. (2004a) ‘The Index of Multiple Deprivation 2000 and accessibility effects on health’, Journal of Epidemiology and Community Health, vol.58, p. 250-257 Jordan, H., Roderick, P., Martin, D. and Barnett, S. (2004b) ‘Distance, rurality and the need for care: access to health services in South West England’, International Journal of Health Geographics, vol. 3(1), pp. 3-21 Langford, M. and Higgs, G. (2006) ‘Measuring Potential Access to Primary Healthcare Services: The Influence of Alternative Spatial Representations of Population’, The Professional Geographer, vol. 58(3), pp. 294-306 Law, M.R. and Morris, J.K. (1998) ‘Why is mortality higher in poorer areas and in more northern areas of England and Wales?’, Journal of Epidemiology and Community Health, 52, pp. 344-352
74
Levin, K.A. (2003) ‘Urban-rural differences in self-reported limiting long-term illness in Scotland’, Journal of Public Health Medicine, vol. 25(4), pp. 295-302 Levin, K.A. and Leyland, A.H. (2005) ‘Urban/rural inequalities in suicide in Scotland, 1981-1999’, Social Science & Medicine, vol. 60, pp. 2877-2890 Levin, K.A. and Leyland, A.H. (2006) ‘A comparison of health inequalities in urban and rural Scotland’, Social Science & Medicine, vol. 62, pp. 1457-1464 Manthorpe, J., Iliffe, S., Clough, R., Cornes, M., Bright, L., Moriarty, J. and Older People Researching Social Issues (2008) ‘Elderley people’s perspectives on health and well-being in rural communities in England: findings from the evaluation of the National Service Framework for Older People’, Health and Social Care in the Community, vol. 16(5), pp. 460-468 Mai S and McCarthy M (1998), `Neighbourhoods, housing and health in Social Determinants of Health’ (1998), Second Edition, Marmot M and Wilkinson R, eds (1998), Oxford University Press Martin, D., Brigham, P., Roderick, P., Barnett, S. and Diamond, I. (2000) ‘The (mis)representation of rural deprivation’, Environment and Planning A, vol. 32, pp. 735-751 Martin, D., Wrigley, H., Barnett, S. and Roderick, P. (2002) ‘Increasing the sophistication of access measurement in a rural healthcare study’, Health and Place, vol. 8, pp. 3-13 Mitchell, R. and Popham, F. (2007) ‘Greenspace, urbanity and health: relationships in England’, Journal of Epidemiology and Community Health, vol. 61, pp. 681-683 Nicholl, J., West, J., Goodacre, S. and Turner, J. (2007) ‘The relationship between distance to hospital and patient mortality in emergencies: an observational study’, Emergency Medicine Journal, vol. 24, pp. 665-668 O’Reilly, D., Rosato, M. and Patterson, C. (2005) ‘Self-reported health and mortality: ecological analysis based on electoral wards across the United Kingdom, BMJ, vol.331, pp. 938-939 Office for Public Management Ltd (2009) Qualitative Research into Rural Deprivation. Final report for Commission for Rural Communities, accessed online: www.ruralcommunities.gov.uk/files/ruralinsights09.pdf Office for National Statistics (2004) Rural/Urban definition, accessed online; www.statistics.gov.uk/geography/rudn.asp
Office for National Statistics (2005) ‘Life table templates’, accessed online; http://www.statistics.gov.uk/statbase/ssdataset.asp?vlnk=6949 Office for National Statistics (2006) Focus on Health: Chapter 3 Limiting long-term illness, accessed online;

75
www.statistics.gov.uk/STATBASE/Product.asp?vlnk=12985 Office for National Statistics (2007) Internal Migration Estimates, access online: www.statistics.gov.uk/STATBASE/Product.asp?vlnk=7070 O’Reilly, G., O’Reilly, D., Rosato, M. and Connolly, S. (2007) ‘Urban and rural variations in morbidity and mortality in Northern Ireland’, BMC Public Health, 7:123 Phillimore, P. and Reading, R. (1992) ‘A rural advantage? Urban-rural health differences in Northern England’, Journal of Public Health Medicine, vol. 14(3), pp. 290-299 Propper, C., Damiano, M., Leckie, G. and Dixon, J. (2006) ‘Distance Travelled in the NHS in England for Inpatient Treatment’, Centre for Market and Public Organisation, University of Bristol: Bristol Riva, M., Curtis, S., Gauvin, L. and Fagg, J. (2009) ‘Unravelling the extent of inequalities in health across urban and rural areas: Evidence from a national sample in England’, Social Science & Medicine, vol. 68, pp. 654-663 Senior, M., Williams, H. and Higgs, G. (2000) ‘Urban-rural mortality differentials: controlling for material deprivation’, Social Science & Medicine, vol. 51, pp. 289-305 The Scottish Government (2009) Rural Scotland Key Facts 2009: People and Communities: Services and Lifestyle: Economy and Enterprise, accessed online: www.scotland.gov.uk/Publications/2009/09/24095407/0 Social Exclusion Task Force (2009) ‘Working together for older people in rural areas’, report to Cabinet Office, accessed online; www.defra.gov.uk/rural/documents/living/working-together-report.pdf Townsend, P., Phillimore, P., Beattie, A. (1988) Health and Deprivation: Inequality and the North, London: Croom Helm Watkins, F. and Jacoby, A. (2007) ‘Is the rural idyll bad for your health? Stigma and exclusion in the English countryside’, Health and Place, vol.13, pp.851-864 Wenger, G.C. (2001) ‘Myths and realities of ageing in rural Britain’, Ageing and Society, vol.21, pp.117-130 Woods, L.M., Rachet, B., Riga, M., Stone, N., Shah, A. and Coleman, M.P. (2005) ‘Geographical variation in life expectancy at birth in England and Wales is largely explained by deprivation’, Journal of Epidemiology and Community Health, vol. 59, pp. 115-120 Woods, R. (2003) ‘Urban-Rural Mortality Differentials: An Unresolved Debate, Population and Development Review, vol. 29(1), pp. 29-46.

76
Appendix A – Glossary Age-standardisation Mortality rates are usually strongly related to the age composition of the population. It is therefore misleading to use overall rates (crude rates) when comparing two different populations unless they have the same age structure. Age-standardised rates, calculated by making adjustments to population structures, allow for comparisons to be made between geographical areas and between sexes. Direct age-standardisation is used throughout this report, where specific rates for the study population are multiple by the standard reference population in that age group. These are then summed and divided by the total standard population for those age groups to give an overall age-standardised rate. AMI – Acute myocardial infarction (heart attacks) Acute myocardial infarction is more commonly known as a heart attack. Deaths with an underlying cause of acute myocardial infarction were identified using the International Classification of Disease, Tenth Revision code I21. CHD – Coronary Heart Disease Coronary Heart Disease is sometimes referred to as Ischaemic Heart Disease. Deaths with an underlying cause of coronary heart disease were identified using the International Classification of Disease, Tenth Revision code I20-I25. Confidence interval Confidence intervals are a measure of the statistical precision of an estimate and show the range of uncertainty around the estimated figure. Calculations based on small numbers of events are often subject to random fluctuations. As a general rule, if the confidence interval around one figure overlaps with the interval around another, we cannot say with certainty that there is more than a chance difference between the two figures.

77
European Standard Population Age-standardised rates were calculated using direct age-standardisation and the European Standard Population (ESP). The same population was used for both male and females.
Age Group European Standard Population <1 1,6001-4 6,4005-9 7,00010-14 7,00015-19 7,00020-24 7,00025-29 7,00030-34 7,00035-39 7,00040-44 7,00045-49 7,00050-54 7,00055-59 6,00060-64 5,00065-69 4,00070-74 3,00075-79 2,00080-84 1,00085+ 1,000Total 100,000
FRP – Family reference person In a Lone Parent Family, the Family Reference Person (FRP) is taken to be the lone parent in a Lone Parent Family. In a Couple Family, the FRP is chosen from the two people in the couple on the basis of their economic activity; (in the priority order: full-time job, part-time job, unemployed, retired, and other). If both people have the same economic activity, the FRP is identified as the elder of the two, or, if they are the same age, the first member of the couple on the form. GIS - Geographical Information System Geographic information systems are computer-based systems for managing, analysing and presenting geographically referenced data. ONS geography uses GIS software to join data together and calculate straight-line or ‘crow-fly’ distances from individuals to their nearest accident and emergency unit.
HES - Hospital Episode Statistics Hospital Episode Statistics (HES) is the national statistical data warehouse for England of the care provided by NHS hospitals and for NHS hospital patients treated elsewhere.

78
HRP - Household reference person The concept of Household Reference Person (HRP) in the 2001 Census replaces Head of Household used in 1991. For a person living alone, it follows that this person is the HRP. If the household contains only one family (with or without ungrouped individuals) the HRP is the same as the Family Reference Person (FRP). If there is more than one family in the household, the HRP is chosen from among the FRPs using the same criteria as for choosing the FRP (economic activity, then age, then order on the form). If there is no family, the HRP is chosen from the individuals using the same criteria. In 1991, the Head of Household was taken as the first person on the form unless that person was aged under 16 or was not usually resident in the household. ICD – International Classification of Diseases The International Classification of Diseases (ICD) is a coding scheme for classifying diseases and causes of death. The tenth revision (ICD-10) was introduced for coding causes of death from 2001 onwards. IMD – Indices of Multiple Deprivation The Indices of Multiple Deprivation (IMD) identifies areas of multiple deprivation at the small area level; it is based on the concept that distinct dimensions of deprivation such as income, employment, education and health can be identified and measured separately. These dimensions are referred to as domains and they are then weighted and aggregated to provide an overall measure of deprivation and each area is allocated a deprivation rank and score. The analyses in this report use the IMD 2004 and IMD 2007; both contain an additional domain of crime. LLTI – Limiting long-term illness In this report a person is considered to have a limiting long-term illness if at the 2001 Census they responded ‘yes’ to the following question: ‘Do you have any long-term illness, health problem or disability which limits your daily activities or the work you can do?’ Logistic Regression Logistic regression allows a discrete outcome, such as death, to be predicted from a set of variables that may be continuous, discrete, binary, or a mixture of any of these. It results in a model that selects only the variables that are significant predictors of the outcome variable. Another advantage of logistic regression analysis is that it makes no assumption about the distribution of the independent variables; they do not have to be normally distributed, linearly related or of equal variance. LSOA – Lower Super Output Area There are 32,482 Lower Layer Super Output Areas in England which were built from groups of Output Areas (typically 4 to 6) and constrained by the boundaries of the Standard Table (ST) wards used for 2001 Census outputs. They have an average population of approximately 1,500 people.
Mortality Rate

79
A mortality rate is a measure of the frequency of occurrence of deaths in a defined population during a specified time interval. In its simplest form the crude mortality rate is defined as the total number of deaths in a given year divided by the total population. The value of crude rates is limited, particularly when comparing between two populations, with different age structures. In these circumstances it is usual to age-standardise or compare age-specific rates. NS-SEC – National Statistics Socio-Economic Classification The NS-SEC was developed in order to replace the Registrar General’s Social Class, which had been criticised as lacking a coherent theoretical basis and becoming increasingly irrelevant to the changing patterns of industry and employment in modern economics. The conceptual basis of the NS-SEC is the structure of employment relations operating in modern developed economics. Occupations are differentiated in terms of reward mechanisms, promotion prospects, autonomy and job security. The most advantaged NS-SEC groups (higher managerial and professional occupations), typically exhibit personalised reward structures, have good opportunities for advancement, have relatively high levels of autonomy within the job, and are relatively secure. These attributes tend to be reversed for the least advantaged group (routine occupations).
Odds ratio Odds can be understood as the ratio of the probability of an event occurring over the probability of it not occurring. For example, an odds ratio of 1 indicates equal odds in the two groups, or an odds ratio of 0.85 can be interpreted odds being 15 per cent lower predictor group compared to the reference group. ODPM – Office of the Deputy Prime Minister Following the constitutional changes announced on 5 May 2006, the Department for Communities and Local Government succeeded the Office of the Deputy Prime Minister. ONS – Office for National Statistics Period Life Expectancy Period expectation of life at a given age for an area in a particular time period is an estimate of the average number of years a person of that age would survive if he or she experienced the particular area’s age-specific mortality rates for that time period throughout the rest of his or her life. The figure reflects mortality among those living in the area in each time period, rather than mortality among those born in each area. It is not therefore the number of years a person in the area in each time period could actually expect to live, both because the death rates of the area are likely to change in the future and because many of those in the area may live elsewhere for at least some part of their lives. Period life expectancy at birth is also not a guide to the remaining expectation of life at any given age. For example, if female life expectancy was 80 years for a particular area, life expectancy of women aged 65 years in that area would exceed 15 years. This reflects the fact that survival from a particular age depends only on the mortality rates beyond that age, whereas survival from birth is based on mortality rates at every age.

80
RUAC – Rural and Urban Area Classification Throughout this report the Rural and Urban Area Classification (RUAC) 2004 for England and Wales was used. In the RUAC, areas with a population of 10,000 or more were categorised as urban, whereas rural settlements were identified according to household and residential land use and densities. Areas were then defined according to settlement types and context (sparsity). The smallest geography which areas were classified at was 2001 Census Output Areas, which can then be aggregated to larger geographies. The RUAC is a detailed and flexible classification that enables statistical analyses to be performed for a simple rural/urban dichotomy, sparse and less sparse areas, different settlement types, or for the individual classes, depending on the level of analysis required. As the national standard measure, the use of the RUAC allows statistical indicators to be compared across different topical areas. Suicide Suicide has been defined as deaths given an underlying cause of intentional self-harm or injury/poisoning of undetermined intent. In England, it has been customary to assume that most injuries and poisonings of undetermined intent are cases where the harm was self-inflicted but there was insufficient evidence to prove that the deceased deliberately intended to kill themselves. Suicides were identified used the International Classification of Disease, Tenth Revision codes X60-X84 and Y10-Y34, excluding Y33.9 (where the Coroner’s verdict was pending). WIMD – Welsh Index of Multiple Deprivation The Welsh Index of Multiple Deprivation (WIMD) is the official measure of deprivation for small areas in Wales. It was developed for the Welsh Assembly Government by the Assembly’s Statistical Directorate and the Data Unit - Wales.

81
Appendix B – Extra Tables/Maps Figure 3.2 Lower Super Output Areas in England by the Rural Urban Area Classification 2004
Source: ONS

82
Figure 3.3 Lower Super Output Areas in England by the Index of Multiple Deprivation 2007
Source: ONS

83
Box 3.5 National Statistics Socio-Economic Classification – Analytic classes Analytic class
Examples of occupations included
1.1 Large employers and higher managerial
Senior officials in national and local government; directors and chief executives of major organisations; officers in the armed forces.
1.2
Higher professional
Civil engineers, medical practitioners, physicists, geologists, IT strategy and planning professionals, legal professionals, architects.
2 Lower managerial and professional
Teachers in primary and secondary schools, quantity surveyors, public service administrative professionals, social workers, nurses, IT technicians.
3 Intermediate NCOs and other ranks in the Armed Forces, graphic designers, medical and dental technicians, Civil Service administrative officers and local government clerical officers, counter clerks, school and company secretaries.
4 Small employers and own account workers
Hairdressing and beauty salon proprietors, shopkeepers, dispensing opticians in private practice, farmers, self-employed taxi drivers.
5 Lower supervisory and technical
Bakers and flour confectioners, screen-printers, plumbers, electricians and motor mechanics employed by others, gardeners, rail transport operatives.
6 Semi-routine Pest control officers, clothing cutters, traffic wardens, scaffolders, assemblers of vehicles, farm workers, veterinary nurses and assistants, shelf fillers.
7 Routine Hairdressing employees, floral arrangers, sewing machinists, van, bus and coach drivers, labourers, hotel porters, bar staff, cleaners and domestics, road sweepers, car park attendants.

84
Map 5.1 Allocation of postcode centroids for persons who died with an underlying cause of acute myocardial infarction to the nearest accident and emergency hospital, England, 2008
Source: ONS

85
Table 6.10 Percentage of household heads, aged between 55 and 64, living in a couple family who moved from a rural to an urban area between 2000 and 2001, by presence of limiting long-term illness, England Limiting long-term illness
No move %
Moved -rural to urban area %
All %
No move Moved - rural to urban area
All
Not reported 98.8 1.2 100 416,071 4,821 420,892 Reported 98.6 1.4 100 90,261 1,318 91,579 All 98.8 1.2 100 506,332 6,139 512,471 Table 6.11 Percentage of household heads, aged between 55 and 64, not living in a family but a pensioner household who moved from a rural to an urban area between 2000 and 2001, by presence of limiting long-term illness, England Limiting long-term illness
No move %
Moved -rural to urban area %
All %
No move Moved - rural to urban area
All
Not reported 97.8 2.2 100 31,797 709 32,506 Reported 96.8 3.2 100 12,630 414 13,044 All 97.5 2.5 100 506,332 6,139 45,550 Table 6.15 Percentage of household heads, aged between 65 and 74, living in a couple family who moved from a rural to an urban area between 2000 and 2001, by presence of limiting long-term illness, England
Persons aged 65 and over
Limiting long-term illness
No move %
Moved -rural to urban area %
All %
No move Moved - rural to urban area
All
Not reported 99.0 1.0 100 255,234 2,591 257,825 Reported 98.7 1.3 100 132,114 1,700 133,814 All 98.9 1.1 100 387,348 4,291 391,639

86
Table 6.20 Percentage of individuals, aged between 16 and 24, who were non-dependent children who moved from a rural to an urban area between 2000 and 2001, by presence of LLTI, England
Persons aged 16 to 24 Limiting long-term illness
No move %
Moved -rural to urban area %
All %
No move Moved - rural to urban area
All
Not reported 97.6 2.4 100 261,625 6,390 268,015 Reported 97.3 2.7 100 14,512 407 14,919 All 97.6 2.4 100 276,137 7,797 282,934
Table 6.21 Percentage of individuals, aged between 16 and 24, who were living in a couple who moved from a rural to an urban area between 2000 and 2001, by presence of limiting long-term illness, England
Persons aged between 16 and 24 Limiting long-term illness
No move %
Moved -rural to urban area %
All %
No move Moved - rural to urban area
All
Not reported 72.4 27.6 100 70,771 26,984 97,755 Reported 77.0 23.0 100 4,234 1,262 5,496 All 72.6 27.4 100 75,005 28,246 103,251
Table 6.22 Percentage of individuals, aged between 16 and 24, who were not in a family who moved from a rural to an urban area between 2000 and 2001, by presence of limiting long-term illness, England
Persons aged between 16 and 24 Limiting long-term illness
No move %
Moved -rural to urban area %
All %
No move Moved - rural to urban area
All
Not reported 44.6 55.4 100 34,496 42,930 77,426 Reported 58.8 41.2 100 3,064 2,144 5,208 All 45.4 54.6 100 37,560 45,074 82,634