
Industry@RuleML2015 DataGraft
63
-
Upload
ruleml -
Category
Technology
-
view
110 -
download
0
Transcript of Industry@RuleML2015 DataGraft

Outline
• What is DataGraft
• Case study example: PLUQI
• DataGraft Rationale
2

Developed to allow
data workers to manage their data in a
simple, effective, and efficient way
Powerful
data transformation and
scalable data access capabilities
3

One stop shop for hosted data management
• Interactively build, modify and share data transformations
• Reuse transformations to repeatably clean and transform spreadsheet data
• Host and share data and transformations in cloud based catalog
4

Transformation pipeline with data preview
5

Catalogue of public data pages and transformations

Flexible management and sharing of data and transformations
• Choose to share transformations or data pages privately or publicly
• Fork, reuse and extend transformations built by other professionals from DataGraft public catalog
• API access to public or private datasets and transformations
7
Public/Private and sharing of transformations

Reusing transformations
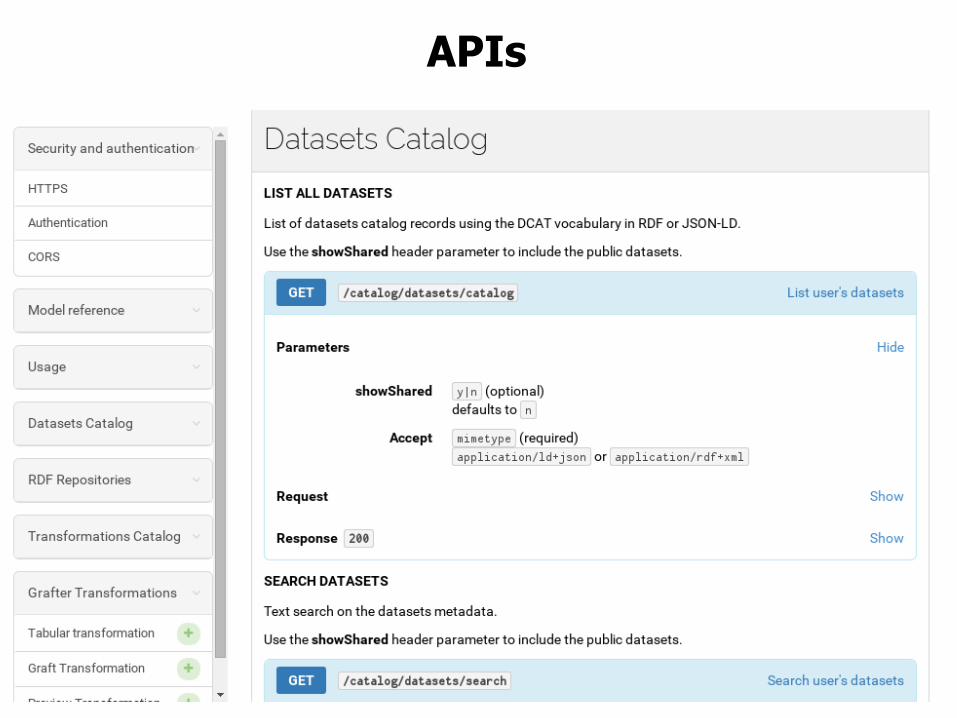
APIs

Reliable data hosting and querying services
• Query Join and visualise datasets through own SPARQL endpoint
• Scalable RDF data hosting
• Visualise data with SPARQL based chart builder
11
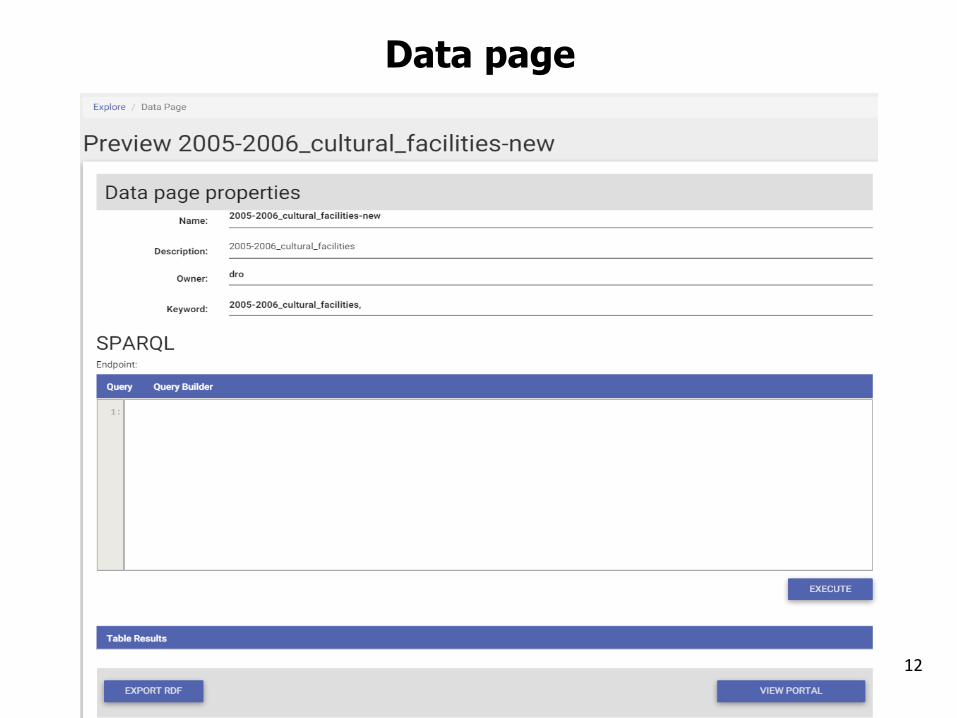
Data page
12

Data visualization
13

Case study: PLUQI
14
PLUQI: Personalized and Localized Urban Quality IndexisA
Application (mobile/Web) showing a customizable index that represents and visualize the level of well-being and sustainability for given cities based on individual preferences.
The index model includes various domains:
Daily life satisfaction: weather,
transportation, community etc.;
Healthcare level: number of doctors,
hospitals, suicide statistics, etc.;
Safety and security: number of police
stations, fire stations, crimes per capita, etc.;
Financial satisfaction: prices, incomes,
housing, savings, debt, insurance, pension, etc.;
Level of opportunity: jobs, unemployment,
education, re-education, economic dynamics, etc.;
Environmental needs and efficiency: green space, air quality, etc.;

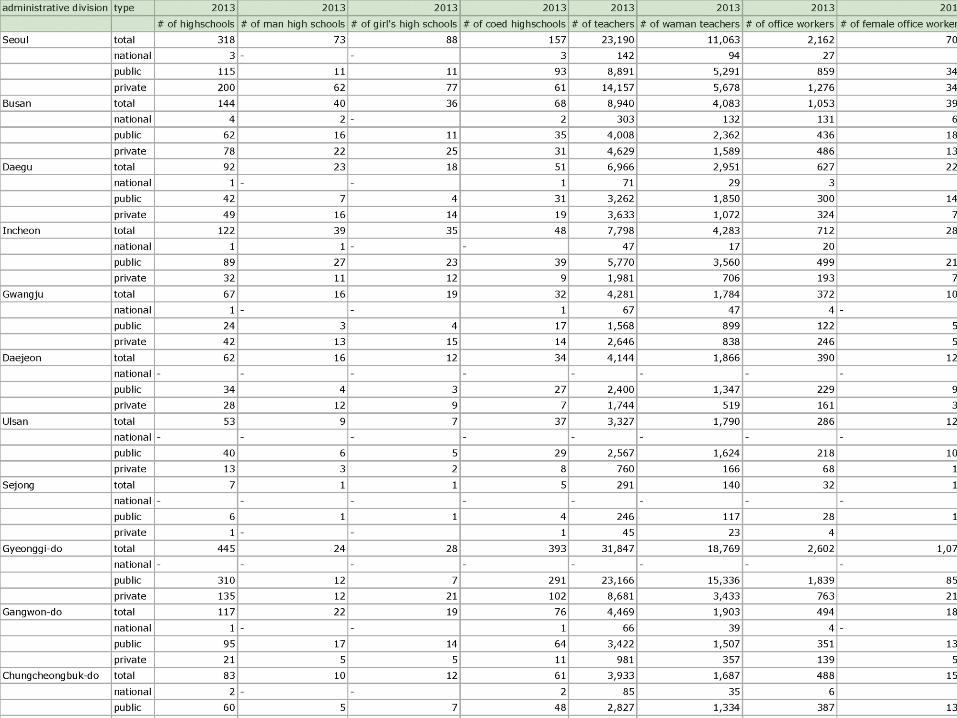
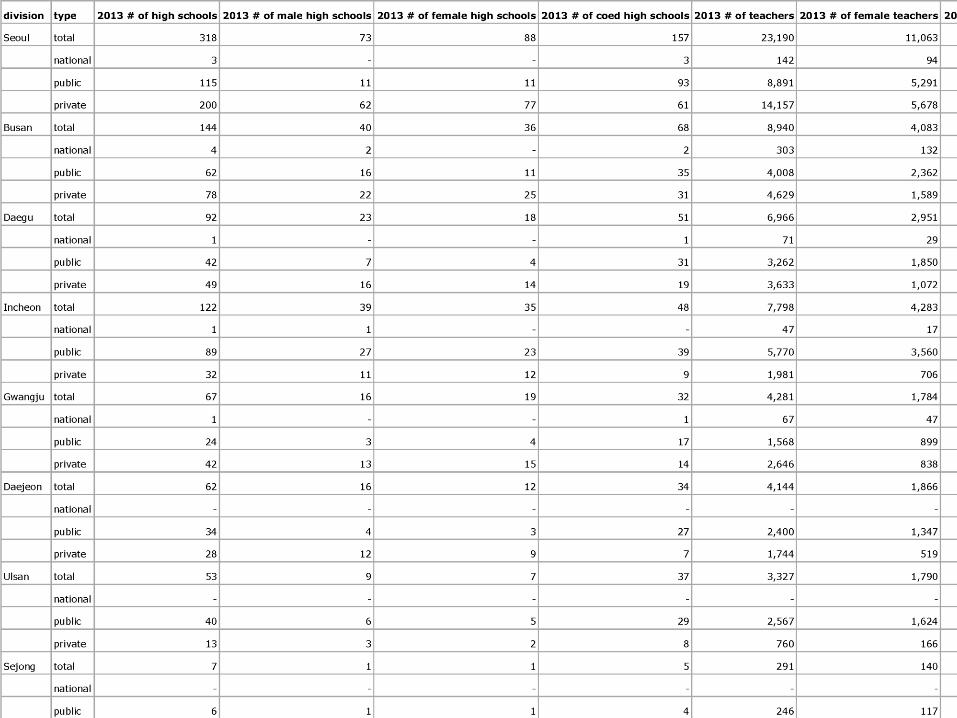
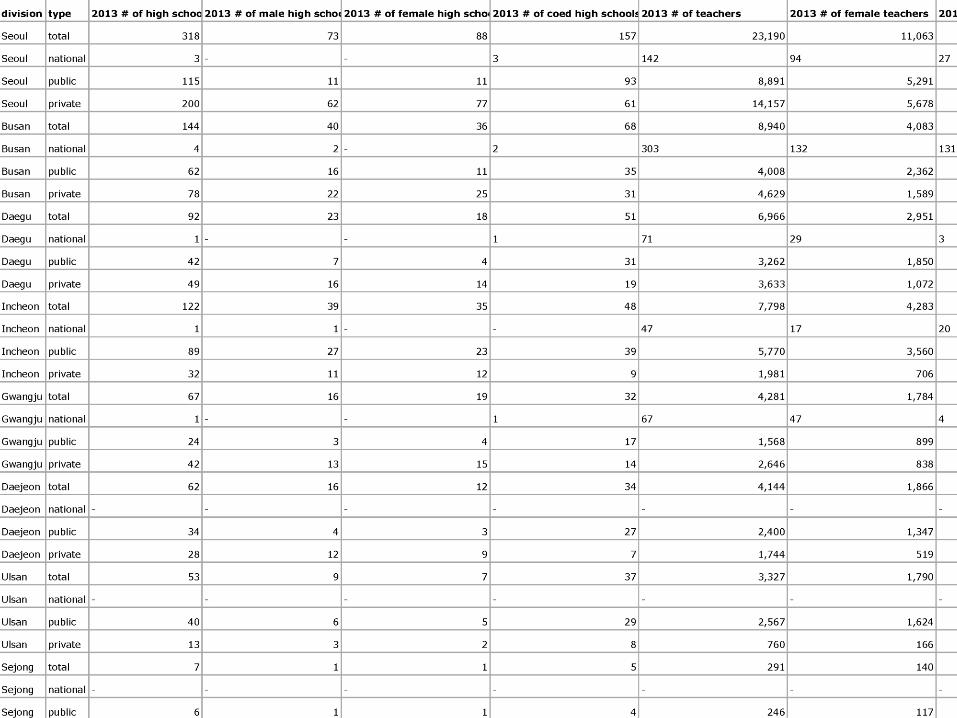
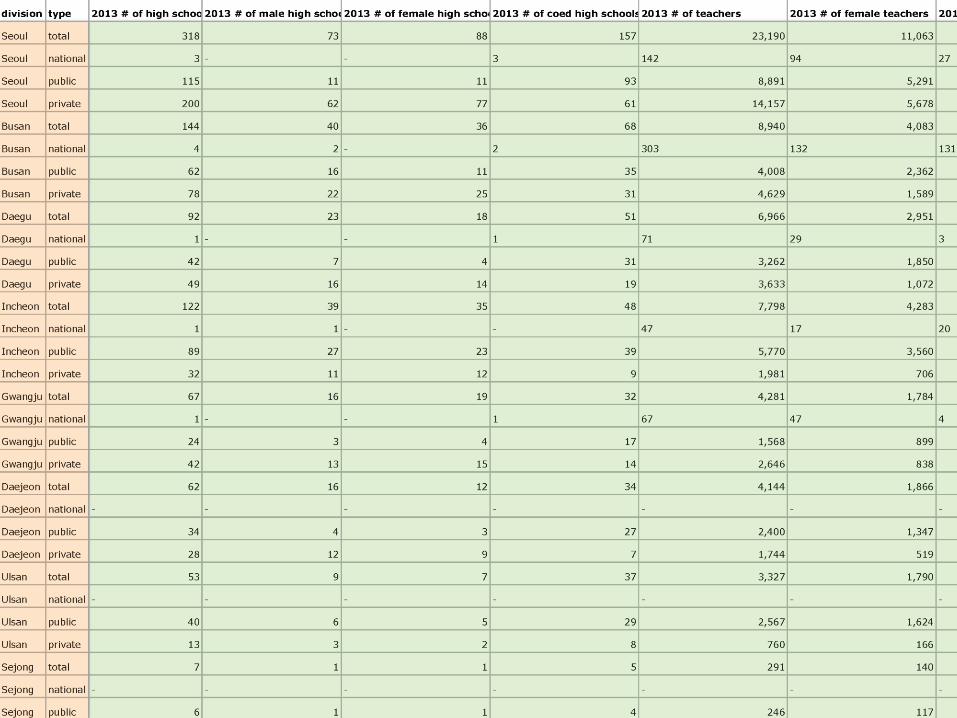
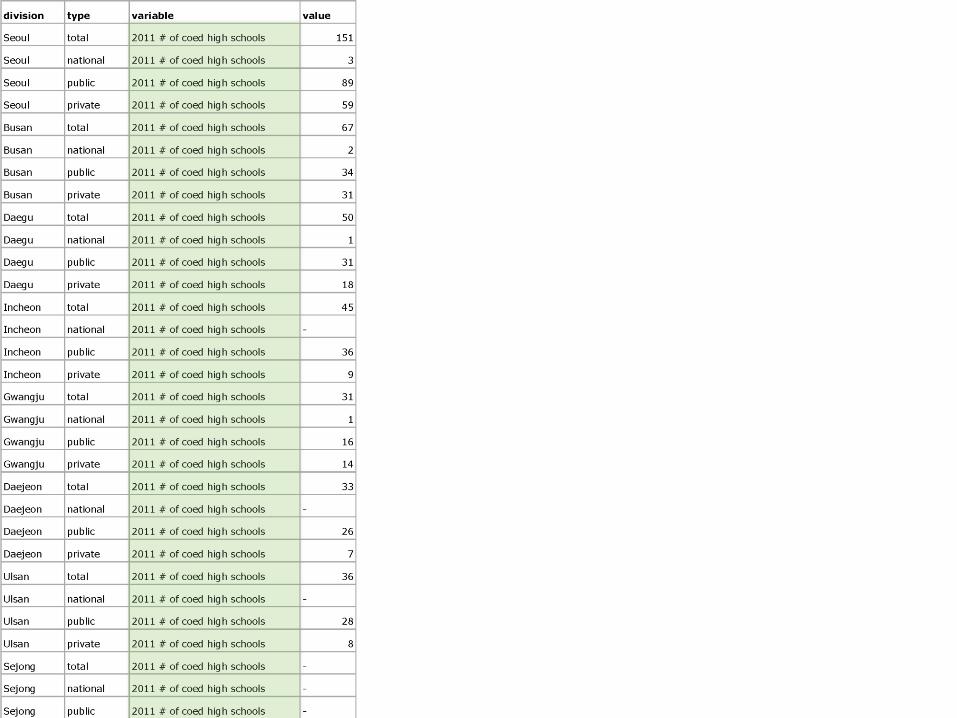
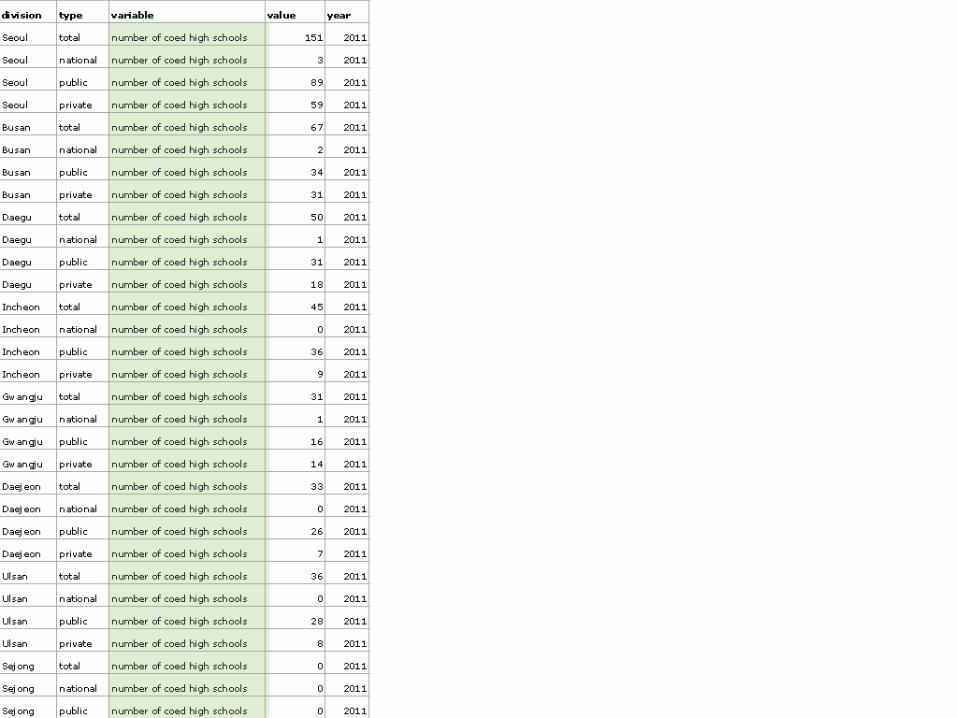
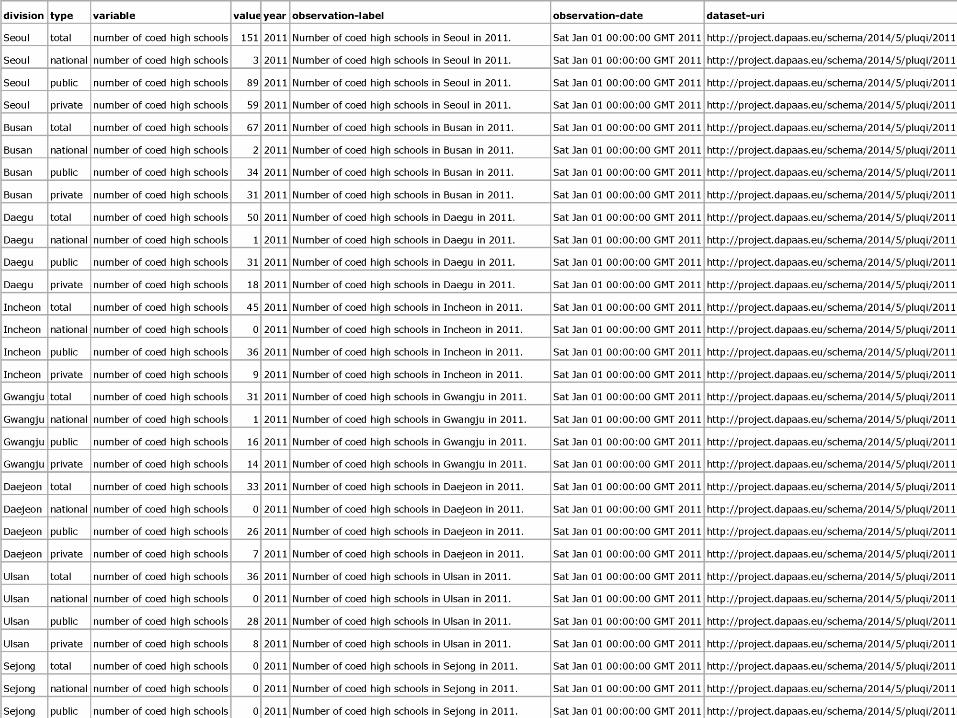
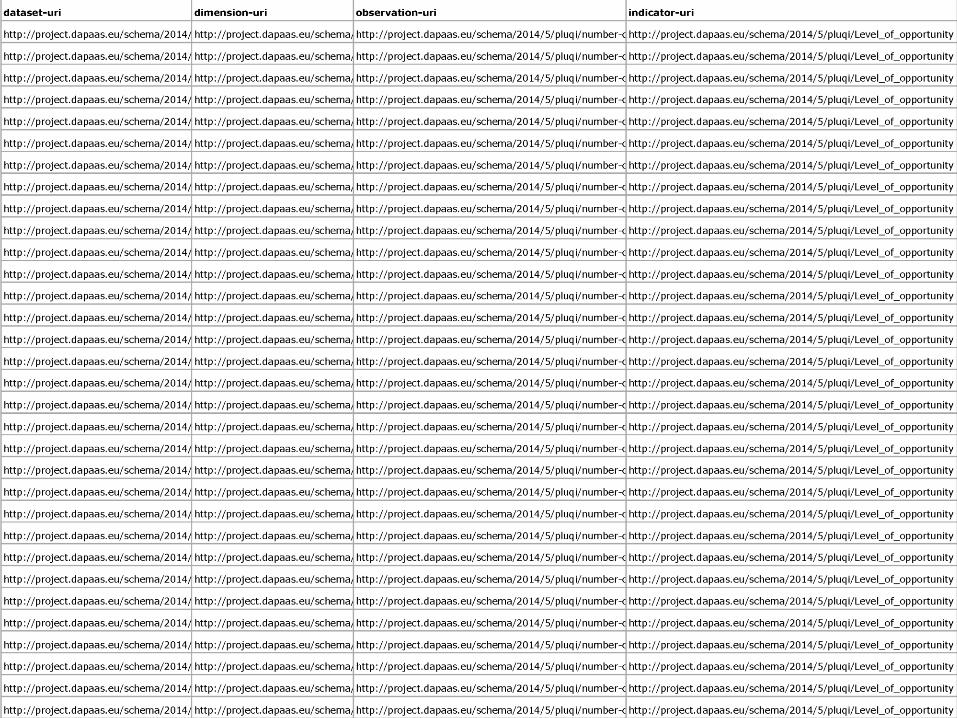
Example tabular data transformation
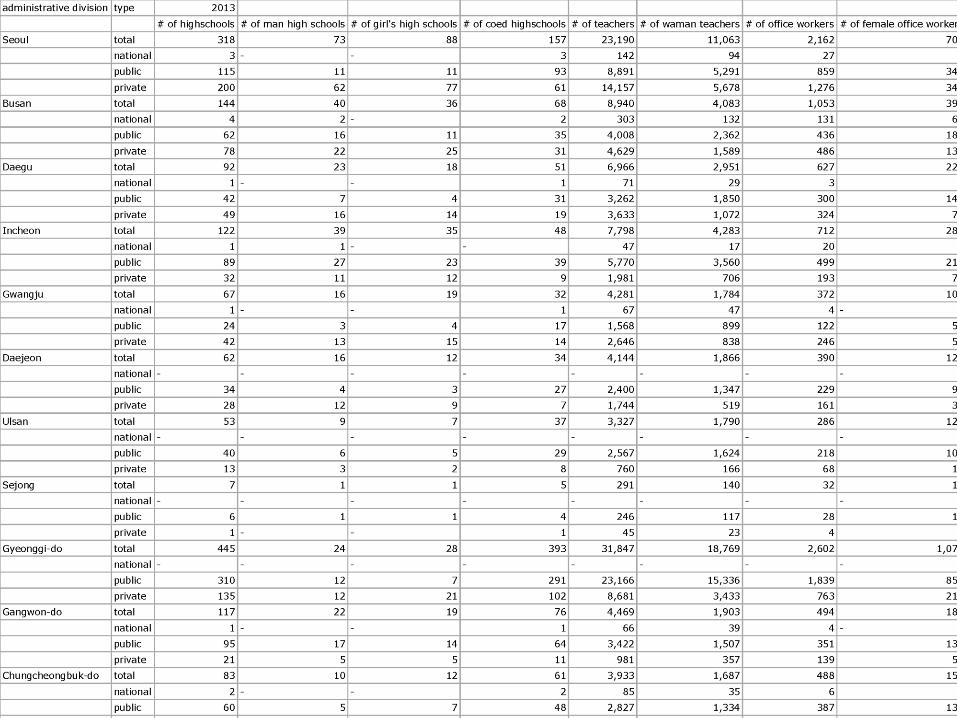
16

17

18
19

20

21
22

23
24
25

26
27

28

29

30
31

32

33

34
35

36
37

Interactive transformation of PLUQI data

Pipeline – high-level generated code (Clojure with Grafter library)
39

Specifying RDF mappings
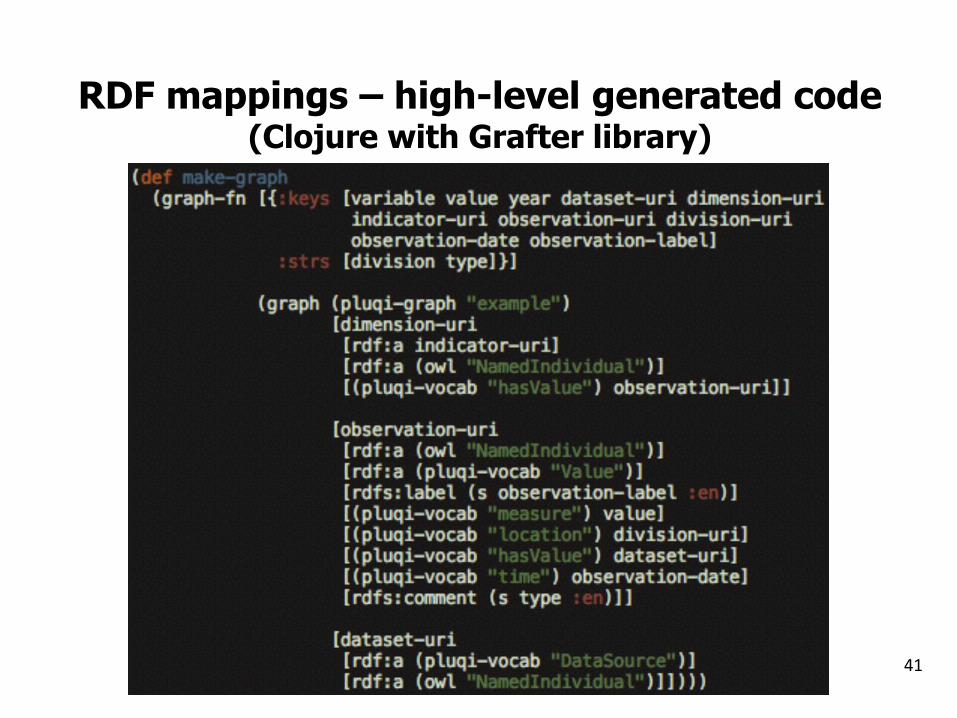
RDF mappings – high-level generated code (Clojure with Grafter library)
41

PLUQI – potential usage
• Place recommendation for travel agencies or travelers
• Policy analysis and optimization for (local) government
• Understanding the citizen’s voice and demands regarding environmental conservation
• Commercial impact analysis for retailer and franchises
• Location recommendation and understanding local issues for real estate
• Risk analysis and management for insurance and financial companies
• Local marketing and sales force optimization for marketers
42
DataGraft Rationale
43

Open Data
• Businesses can develop new ideas, services and applications; improve decision making, cost savings
• Can increase government transparency and accountability, quality of public services
• Citizens get better and timely access to public services

Lots of open datasets on the Web…
• A large number of datasets have been published as open data in the recent years
• Many kinds of data: cultural, science, finance, statistics, transport, environment, …
• Popular formats: tabular (e.g. CSV, XLS), HTML, XML, JSON, …
45

…but few actually used
• Few applications utilizing open
and distributed datasets at present
• Challenges for data consumers
– Data quality issues
– Difficult or unreliable data access
– Licensing issues
• Challenges for data publishers
– Lack of expertise & resources: not easily to publish & maintain high quality data
– Unclear monetization & sustainability
46
Open Data Portal Datasets Applications
data.gov ~ 110 000 ~ 350
publicdata.eu ~ 50 000 ~ 80
data.gov.uk ~ 20 000 ~ 350
data.norge.no ~ 300 ~ 40
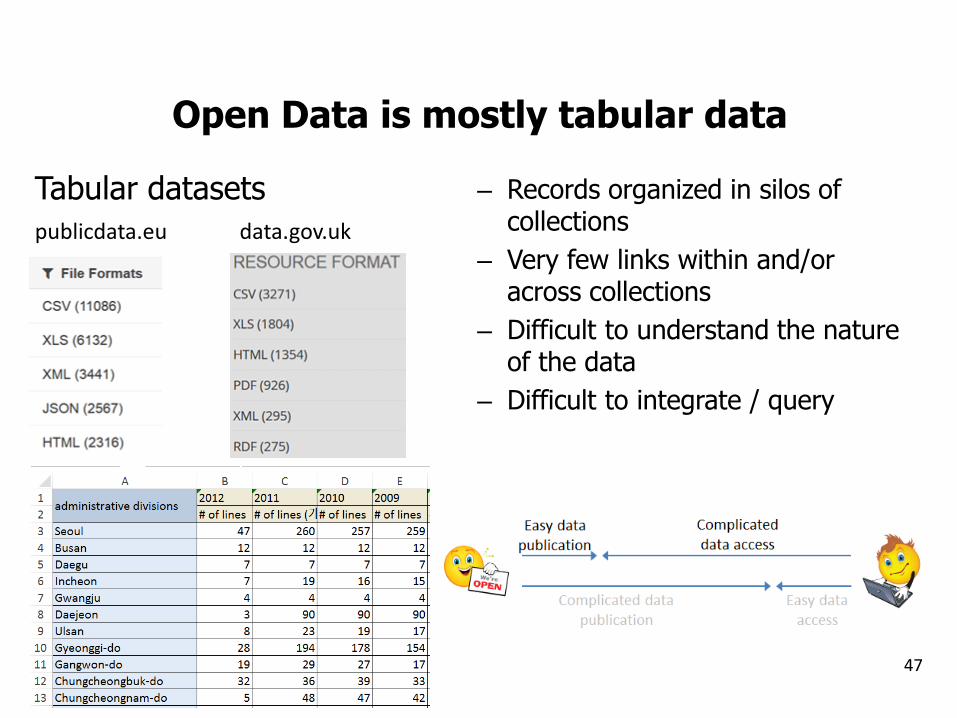
Open Data is mostly tabular data
– Records organized in silos of collections
– Very few links within and/or across collections
– Difficult to understand the nature of the data
– Difficult to integrate / query
47
Tabular datasets
publicdata.eu data.gov.uk

Linked Data
• Method for publishing data on the Web
• Self-describing data and relations
• Interlinking
• Accessed using semantic queries
• A set of standards developed by W3C– Data format: RDF
– Knowledge representation: RDFS/OWL
– Query language: SPARQL
– Linking medium: HTTP
http://www.w3.org/standards/semanticweb/data
48
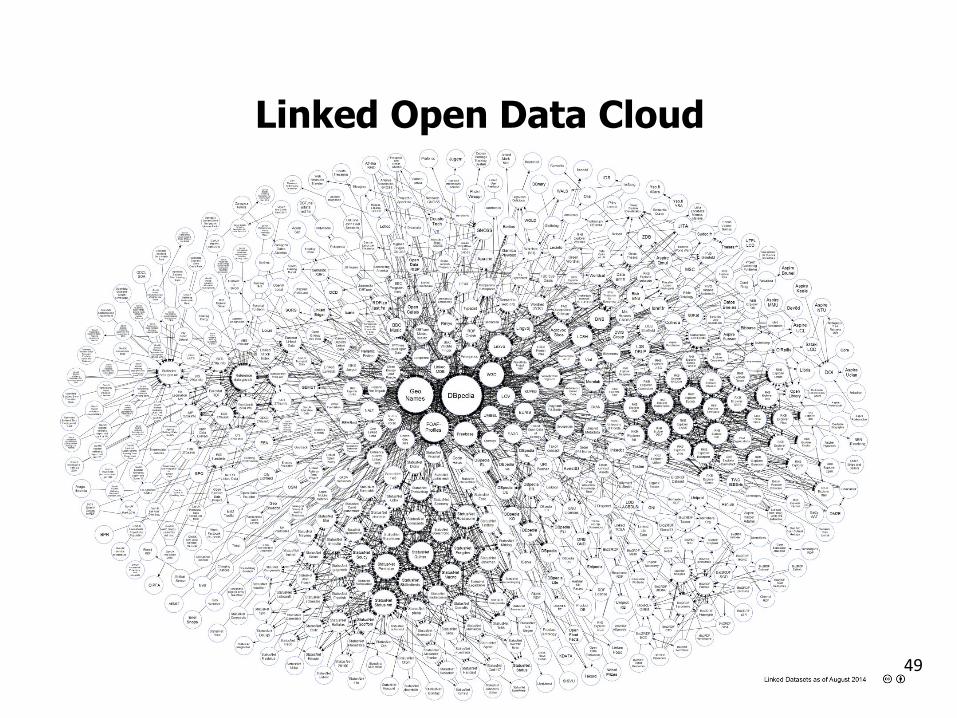
Linked Open Data Cloud
49

Example
50

Linked Data is great for Open Data
• Linked Data as a great means to represent and integrate disparate and heterogeneous open data sources
• How Linked Data can improve Open Data:
– Easier integration, free data from silos
– Seamless interlinking of data
– Understand the data
– New ways to query and interact with data
• Challenges with using Linked Data
– Lack of tooling & expertise to publish high quality Linked Data
– Lack of resources to host LOD endpoints / unreliable data access
51

DataGraft: Packaging Linked Data
• Packaging Linked Data to make it more approachable to the open data community
– Publishers
– Developers
– Data workers
52
53
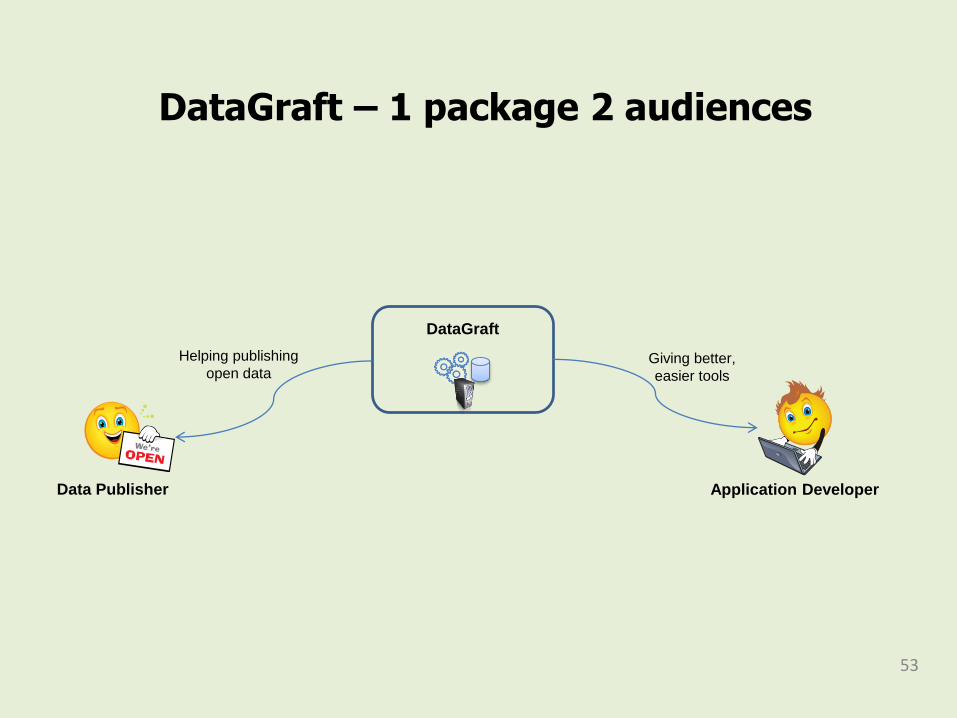
DataGraft – 1 package 2 audiences
DataGraft
Data Publisher Application Developer
Helping publishing
open dataGiving better,
easier tools

54
Tabular Data
GraphData

Data Transformation: Data + Transformation
55
Raw Data Transformation process
Usable Data
Transformation
ReuseShareEvolve
…

DataGraft means to making Open (Linked) Data easier to use
• A platform/hosting: to make it easy for publishers to put data on the web, and developers to publish their applications
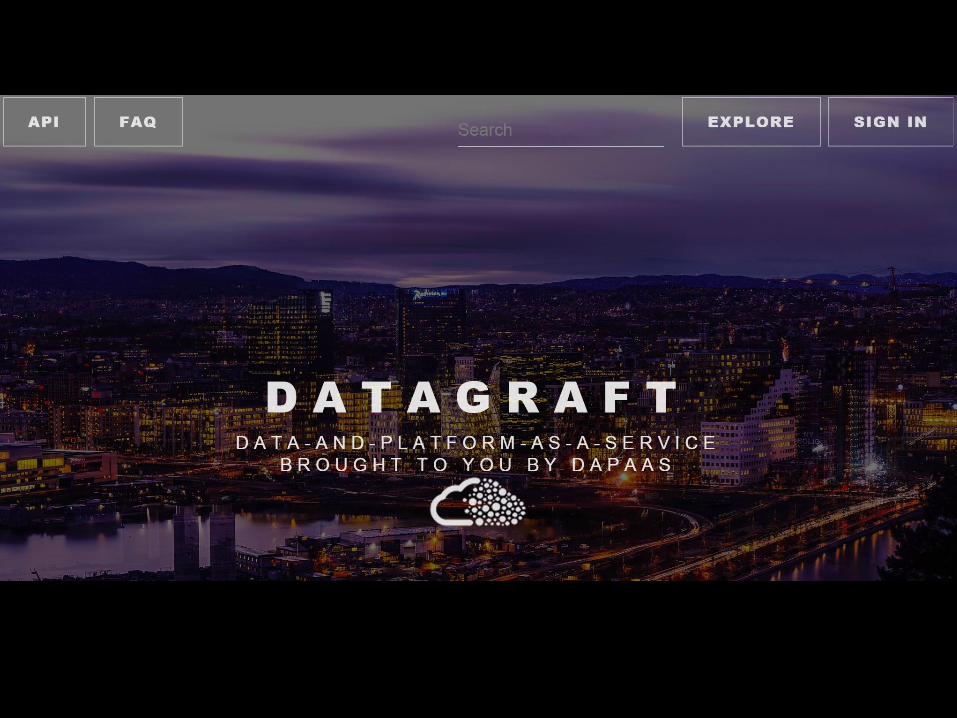
• A portal: to help advertising data and applications availability - and enticing new users
• Tool-supported data transformation methodology: to make it easy for people with Excel knowledge to publish large amounts of high quality data
• API's with high-quality documentation: for processing large amounts of data reliably in order to create interactives, visualisations and transformations
56
Make Linked Data more accessible to everyone!
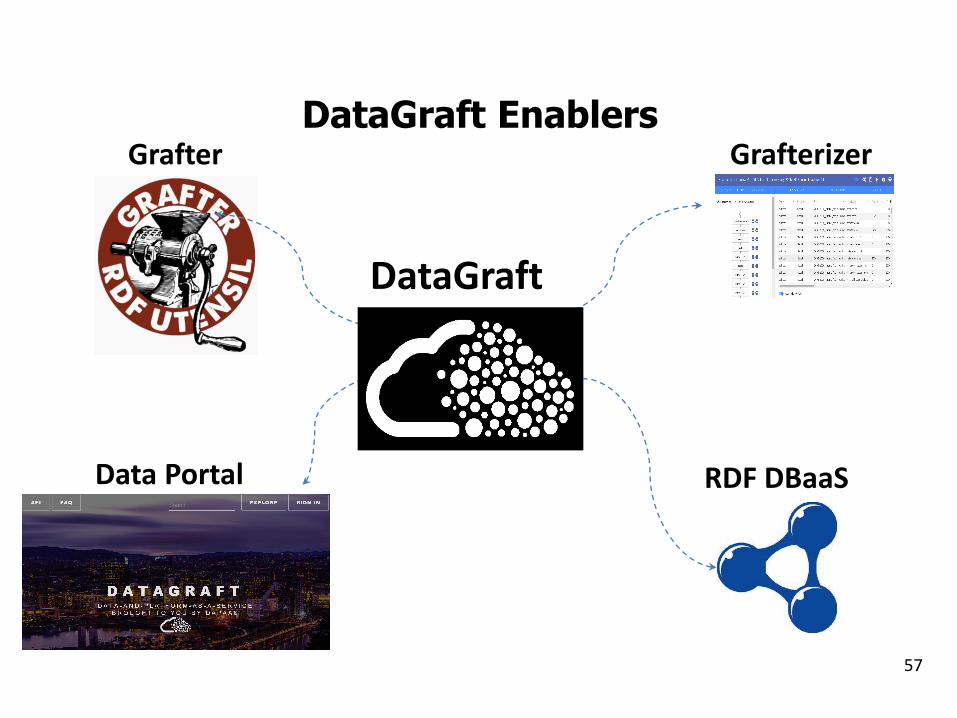
DataGraft Enablers
57
Grafter Grafterizer
RDF DBaaSData Portal
DataGraft
DataGraft – targeted impacts
58
• A reduction in the cost for organisations (e.g. SMEs, public organizations, etc) which lack sufficient expertise and resources to publish open data
• A reduction on the dependency of open data publishers on generic Cloud platforms to build, deploy and maintain their open/linked data from scratch
• An increase in the speed of publishing new datasets and updating existing datasets
DataGraft– targeted impacts (cont’)
59
• A reduction in the cost and complexity of developing applications that use open data
• An increase in the reuse of open data by providing fast and seamless access to numerous open data sets to the applications hosted on DataGraft.net

Summary
60
• DataGraft – emerging solution (as-a-Service) for making Open (Linked) Data more accessible
– Platform, portal, methodology, APIs
• Key features:
– Support for Sharable/Repeatable/Reusable Data Transformations
– Reliable RDF Database-as-a-Service
61


![Linked Data for Common Agriculture Policy: Enabling Semantic … · 2020. 3. 16. · service data as Linked Data was performed with the help of DataGraft [3,4]10{ a cloud-based platform](https://static.fdocuments.in/doc/165x107/5fc7ebf1f58bb039c4107799/linked-data-for-common-agriculture-policy-enabling-semantic-2020-3-16-service.jpg)