Industry: Auto Ancillary - Business...
14
Company Report Industry: Auto Ancillary Rohan Korde ([email protected]) +91‐22‐66322235 Prabhudas Lilladher Pvt. Ltd. and/or its associates (the 'Firm') does and/or seeks to do business with companies covered in its research reports. As a result investors should be aware that the Firm may have a conflict of interest that could affect the objectivity of the report. Investors should consider this report as only a single factor in making their investment decision. Please refer to important disclosures and disclaimers at the end of the report CEAT Building blocks in place; BUY
Transcript of Industry: Auto Ancillary - Business...

Company Report Industry: Auto Ancillary
Rohan Korde ([email protected]) +91‐22‐66322235
Prabhudas Lilladher Pvt. Ltd. and/or its associates (the 'Firm') does and/or seeks to do business with companies covered in its research reports. As a result investors should be aware that the Firm may have a conflict of interest that could affect the objectivity of the report. Investors should consider this report as only a single factor in making their investment decision.
Please refer to important disclosures and disclaimers at the end of the report
CEAT Building blocks in place; BUY

CEAT
Company ReportSeptember 20, 2016
Rating BUY
Price Rs1,128
Target Price Rs1,310
Implied Upside 16.1%
Sensex 28,635
Nifty 8,808
(Prices as on September 20, 2016)
Trading data
Market Cap. (Rs bn) 45.6
Shares o/s (m) 40.5
3M Avg. Daily value (Rs m) 745.8
Major shareholders
Promoters 50.76%
Foreign 26.14%
Domestic Inst. 5.21%
Public & Other 17.89%
Stock Performance
(%) 1M 6M 12M
Absolute 30.5 1.0 (5.7)
Relative 28.5 (13.7) (14.9)
How we differ from Consensus
EPS (Rs) PL Cons. % Diff.
2017 99.4 94.6 5.1
2018 125.7 121.7 3.2
Price Performance (RIC: CEAT.BO, BB: CEAT IN)
Source: Bloomberg
0
200
400
600
800
1,000
1,200
1,400
Sep‐15
Nov‐15
Jan‐16
Mar‐16
May‐16
Jul‐16
Sep‐16
(Rs)
Ceat is all set to reap benefits from its strategic focus on the higher‐contribution
two‐wheeler and passenger vehicle segments. The company’s capacity increase
program is expected to be completed towards the end of FY17 which would aid
Ceat in reaping benefits of the operating leverage from FY18 onwards. Tyre
industry had benefited in the past two years from multi‐year low rubber prices.
While prices have now increased from the lows, we expect Ceat to counter this
increase by a combination of product mix improvement, operating leverage,
improvement in demand on higher auto sales and selective price increases. Higher
profitability and increase in cash flow generation would result in an improved
balance sheet position from FY18. We initiate coverage on Ceat with a “Buy”. Our
target price of Rs1,310 based upon a target 6x EV/EBITDA for FY18e against the
current trading multiple of 5.3x FY18e.
Improvement in product mix: Ceat has steadily improved its product mix in
favour of higher‐contribution products. Passenger segment now constitutes
~42% of Ceat’s sales from just 15% in FY11. Commissioning new plants for two‐
wheelers and specialty tyres would further improve the product mix in FY18.
Better demand outlook: Domestic demand for tyres had been robust, but the
domestic producers have been facing challenges in the past two years due to
higher imports of CV tyres and subdued replacement demand. Continued
growth in auto sales would structurally improve the demand environment and
build up the vehicle population for future replacement. While the overall
demand environment was sluggish due to imports, UV and two‐wheeler tyre
demand has been high for Ceat.
Operating leverage benefits: Completion of capex in FY17 would lower the need
for further debt and also lead to higher operating leverage. As the ongoing
capex are in the higher‐profitability two‐wheeler, PCR, and farm tyre segments,
it would benefit Ceat’s overall performance. This would also help counter
pressures from any further increase in cost of key inputs like rubber.
Key financials (Y/e March) 2015 2016 2017E 2018E
Revenues (Rs m) 57,521 57,141 59,939 68,962
Growth (%) 3.6 (0.7) 4.9 15.1
EBITDA (Rs m) 6,804 8,223 8,045 9,785
PAT (Rs m) 3,172 4,465 4,021 5,084
EPS (Rs) 78.4 110.4 99.4 125.7
Growth (%) 3.9 40.8 (9.9) 26.4
Net DPS (Rs) 10.0 11.5 12.0 12.5
Profitability & Valuation 2015 2016 2017E 2018E
EBITDA margin (%) 11.8 14.4 13.4 14.2
RoE (%) 23.4 23.8 17.9 19.2
RoCE (%) 17.0 19.2 15.7 17.3
EV / sales (x) 0.9 0.9 0.9 0.8
EV / EBITDA (x) 7.7 6.2 6.6 5.3
PE (x) 14.4 10.2 11.4 9.0
P / BV (x) 2.7 2.2 1.9 1.6
Net dividend yield (%) 0.9 1.0 1.1 1.1
Source: Company Data; PL Research

CEAT
September 20, 2016 3
Improvement in product mix With its new strategy since FY11, Ceat has successfully been able to transform its product portfolio. From a stage where its product mix mirrored the industry with higher share of its sales accruing from the truck and bus (T&B) segment. Now the passenger vehicle and two‐wheeler segments constitute an equally important share.
Exhibit 1: PV and 2W share improves in the Product Mix
Source: Company Data
Ceat has steadily improved its product mix in favour of higher‐profitability products. Passenger segment now constitutes ~42% of Ceat’s sales, from just 15% in FY11. Commissioning its new plants for two‐wheelers and specialty tyres would further improve the product mix in FY18. Ceat’s product profitability hierarchy (in order from higher to lower) is as under:
Two‐wheeler tyres
Specialty tyres
Passenger Vehicle tyres
Last mile connectivity vehicles (like Tata Ace)
HCV and MCV Based upon the profitability hierarchy, Ceat has identified four pillars as its strategic growth areas:
Two‐wheeler tyres (outsourced and in‐house capacity)
Passenger Vehicle tyres (OEM, UV, Europe entry)
Specialty tyres (Farm)
Exports (going global to emerging and new geographies)
0
10
20
30
40
50
60
70
80
90
Strategic Focus areas Others
FY10 FY14 FY15 FY16 Q1FY17

CEAT
September 20, 2016 4
Growth in these four pillars would be achieved by focussing on the following building blocks:
Differentiation: Ceat focussed on introducing and highlighting novelty in its
products like different print designs, a better grip for the tyres, etc.
Branding: Developing the brand like a consumer company, complemented by
award winning advertisements, helped improve realisations over a period of
time. Ceat tyres retail at a higher price than MRF in the motorcycle segment
now.
Distribution: A five‐year vision to develop a distributor‐based approach
(compared to MRF which has dealer‐based approach) has resulted in bigger
network for Ceat. The company now has ~270 distributors and 4300+ dealers.
Ceat also has 230 Shoppees to create brand pull and a Shop‐in‐shop concept,
which was started two years ago. Ceat’s reach now covers ~95% of its potential
market.
Deepen OEM partnerships: Scaling up to be the first source supplier for OEMs is
typically a profitable option. With new capacities building up in its more
profitable segments, Ceat has started supplying to new OEM customers like
Honda Motorcycles, Renault, Suzuki Motorcycles, etc.
R&D: Setting up the R&D facility at Halol helped faster product upgradation for
Ceat.
Expanding global reach: As the Ceat brand is well known in the international
market due to its history, it would be relatively easy for Ceat to increase its
presence there. Ceat has got a strong international presence in more than 100
countries.
Expanding capacity in higher profitability segments
Ceat is investing Rs4.20bn in Nagpur for a 120 MT plant for two‐wheeler tyres.
This would augment its two‐wheeler capacity significantly, from ~1.4m tyres
p.m. to ~2.6m tyres p.m.
Investment in PCR is Rs6.50bn in Halol in Phase II for 120MT capacity. Of this,
~40MT has already been commissioned. The Halol plant in Phase I has a capacity
of 150MT. Of this, 70MT is dedicated for PCR and 80MT is for TBR.
In Ambernath, the capex is ~Rs3.30bn which is for speciality tyres, specifically
farm tyres for export to US and Europe.
This capex is over a three year time frame starting FY16 and to be completed by
FY18. We expect significant part of the capex to be met through internal accruals.
Consequently, we expect the product mix improvement trend for Ceat to continue
ahead as well. We expect the share of two‐wheeler tyres in the mix to increase to
30% in FY18e (from 27% in FY16), while share of PV tyres in the sales mix would
increase from 11% in FY16 to ~15% in FY18.

CEAT
September 20, 2016 5
Better demand outlook Demand for tyres was subdued in the past two years due to higher imports in the CV space and subdued replacement demand. A recovery in replacement demand and auto sales would structurally improve the demand environment and build up the vehicle population for future replacement. Demand for UV and two‐wheeler tyres has been consistently high for Ceat.
Expanding base in two‐wheelers and passenger segment
Two‐wheelers were among the key focus areas identified by Ceat for profitable growth. In addition to expanding sales in the replacement segment, the company has also garnered a share of the OEM pie. Acquisition of business recently from OEMs like HMSI, Suzuki Motorcycles would also benefit growth. Among models, Ceat is now the primary supplier for the Royal Enfield Himalayan, Honda Navi, Bajaj V15, Hero Splendor iSmart 110, Suzuki Access 125, etc.
In PVs, Ceat is the primary supplier for Renault Kwid, M&M TUV 300 and Datsun Redigo. Renault was a new addition to its OEM customer base.
Exhibit 2: Trend in Ceat’s 2/3 wheeler revenue growth
Source: Company Data, PL Research
Exhibit 3: Trend in Ceat’s PV revenue growth
Source: Company Data, PL Research
Being a first choice supplier for OEMs in two‐wheeler tyres would mean higher margins as well as better positioning to capture the replacement demand. With the company’s Nagpur facility commencing operations, Ceat can now bid for incremental / fresh OEM business. Tyres which were previously outsourced can now be made in‐house.
Growth in exports Ceat has forayed into the European market in a small way. There is a distribution network present in Europe as the company previously had a presence there. The company plans to use the learning from this foray into other markets as well. In the past two years, exports were under pressure due to exchange fluctuation, Chinese dumping and weak environment in consumer markets like Middle East and Africa.
0
10
20
30
40
50
‐
5,000
10,000
15,000
20,000
25,000
FY11
FY12
FY13
FY14
FY15
FY16
FY17E
FY18E
2/3 wheelers (Rs m) YoY gr. (%) (RHS)
0
20
40
60
80
100
‐
2,000
4,000
6,000
8,000
10,000
12,000
FY11
FY12
FY13
FY14
FY15
FY16
FY17E
FY18E
PC/UV (Rs m) YoY gr. (%) (RHS)

CEAT
September 20, 2016 6
With Ceat now increasing its portfolio and its capacity, the company appears better positioned to grow in the higher profitability export market.
Specialty foray Ceat is setting up a new facility at Ambernath in Maharashtra for specialty farm radial tyres for Europe and US markets. The foray would be through a 100% subsidiary called CSTL. The capacity of the Ambernath facility would be 100MT. Of this, 40MT would be operational by March 2017; further 60MT would be operational in FY18. While Ceat has a presence in this segment due to its Bhandup and Nasik plants, the company is now looking at an increased presence in the specialty segment. Currently, 50% of Ceat’s farm and specialty tyres are exported. The agri tyre segment in exports is consumer‐focussed, where Ceat’s channel partners have given a feedback that there is a gap for a third player apart from Balkrishna Industries and Alliance Tyres. As the overall market size is huge, there is a good chance for Ceat to succeed in this venture. The positive part is that China does not have a significant presence in agri tyres since it involves higher SKUs and is not a mass production market.
Share of CV tyres in sales lowered Ceat’s dependence on the T&B segment has been lowered significantly over a period of time. The focus for the company in this segment is to sweat its assets to the maximum. We expect the proportion of sales from this segment to get lowered further over a period of time (from 38% in FY16 to 30% in FY18). Addition of capacity in non‐T&B segment and lower focus on sales to OEMs in T&B would serve towards this end. While the company’s presence in the T&B segment was limited, Ceat has now launched a new T&B in June 2016. The previous version was unsuitable for overloading which was prevalent in the Indian market. The new product looks to make up for this and so far appears to have a good response.
Sri Lanka is a steady market Ceat has 60MT manufacturing capacity in Sri Lanka, while the overall market size there is 120MT. Ceat is the sole manufacturer in SL and competes with other Indian and international brands. The company gets some duty incentives from Govt, while imported tyres are at a higher duty. Imported tyres are also impacted by currency depreciation. This is proving to be a steady market for Ceat with stable profitability. In Q1FY17, this venture’s EBITDA margin was 25%, while the 5‐year average was ~20%. However, faster growth in this market would be difficult. As the market grows, Ceat may make small capacity additions if required. Exports form ~20‐30% of the ventures revenues.

CEAT
September 20, 2016 7
Exhibit 4: Sri Lanka JV performance
SR (Rs m) FY13 FY14 FY15 FY16
Revenue 4357 4553 4890 4729
EBITDA 532 759 978 1085
EBITDA Margin (%) 12.2 16.7 20.0 22.9
Source: Bloomberg, PL Research
Bangladesh plans yet to be firmed up Ceat has obtained clearance for setting up its Bangladesh plant. While land has been acquired, the plans are yet to be finalized. Change in plans was required as the Bangladesh tyre market is also witnessing an increase in radialisation, which needed a change in plans from Ceat.

CEAT
September 20, 2016 8
Operating leverage benefits Since last five years, Ceat has approached the market with a different perspective. As the company changed its product mix, they are also witnessing better demand for its products being positioned in the consumer segment. Ceat has been witnessing high demand in most of its segments and is operating at high capacity utilisation. Since the increase in capacity is in Ceat’s higher profitability segments, higher capacity utilisation there would result in improvement in profitability for Ceat. Completion of capex in FY17 would lower the need for further debt. As the capex has been for the higher profitability segments, it would benefit Ceat’s profitability and also lead to higher operating leverage. Product mix improvement would also help counter pressures from an increase in input costs. Ceat’s current production capacity is as under:
Bhandup: 250MT, completely bias, T&B, farm, specialty, LCV
Nasik: 200MT, bias same as Bhandup. Radial PCR is ~10‐12 MT
Halol: 70MT, PCR
Halol: 80MT, TBR
Outsourced: 250‐300 MT, 2‐wheelers(~14 lakh tyres p.m.) tubes, flaps The ongoing capex program is for specialty, two‐wheelers and PVs:
Overall capex plan is of Rs14bn of which Rs8bn was spent till March'16.
Remaining capex which will come into play will be ~Rs6bn, of which, ~Rs4.75bn is
during FY17 & ~Rs1.25bn in FY18. This will be managed from a mix of internal
accruals and debt.
All investments are likely to be completed by Q2FY18, with the Ambernath plant
ramp‐up happening at a slow pace. Capacity which has been commissioned at
Nagpur and Halol is already running at 90% capacity. Blended capacity utilisation for
Ceat is also at a high level of ~85%. Thus, as new capacity is commissioned, there is
strong potential for Ceat to garner operating leverage benefits.
Neutralising the impact of a rise in rubber price Kerala is the largest Rubber producing state in the country followed by the North
Eastern part of the country which contribute around 90% of the supply in India. The
peak season for this is in the October – December quarter. Malaysia, Thailand and
Indonesia are major International producers. Rubber supply is increasing, while
demand is dull due to slower sales in China.
While rubber has bounced back from the lows of FY16, an improvement in Ceat’s
product mix would help it counter this increase in inputs. As a rule of thumb, the

CEAT
September 20, 2016 9
heavier the tyre, the higher the rubber content. A move towards the passenger and
specialty segment would hence work towards de‐risking the company from a rise in
rubber price. Similarly, rubber is now entering the peak tapping period, due to which
there would be QoQ easing in rubber prices.
Exhibit 5: Trend in average annual domestic Rubber price
Source: Company Data, PL Research
‐
5,000
10,000
15,000
20,000
25,000
FY07
FY08
FY09
FY10
FY11
FY12
FY13
FY14
FY15
FY16
ytd FY17
Avg. Domestic Rubber price (Rs / quintal)

CEAT
September 20, 2016 10
Key Financials We expect Ceat to register a 9.9% CAGR in consolidated revenue over FY16‐18e. We expect its gross margins to be lower 150bps over this period, while its EBITDA margin is expected at 14.2% in FY18 (lower 20bps from FY16).
Exhibit 6: Trend in revenue growth
(5.0)
‐
5.0
10.0
15.0
20.0
25.0
30.0
‐
20,000
40,000
60,000
80,000
FY10
FY11
FY12
FY13
FY14
FY15
FY16
FY17E
FY18E
Sales (Rs m) YoY gr. (%) (RHS)
Source: Company Data, PL Research
Exhibit 7: Trend profit growth
(200.0)
‐
200.0
400.0
600.0
800.0
‐
1,000
2,000
3,000
4,000
5,000
6,000
FY10
FY11
FY12
FY13
FY14
FY15
FY16
FY17E
FY18E
Adj. profit (Rs m) YoY gr. (%) (RHS)
Source: Company Data, PL Research
Net profit CAGR is expected at 5.4% over the same period. After a YoY profit dip of 12.2% in FY17e, we expect a strong 26.4% YoY growth in its profits. Net profit margin is expected to be lower from 8% in FY16 to 7.4% in FY18e. While Ceat would be benefitting from positives of product mix and operating leverage, in FY17, there would be cost increase from higher adspend and an increase in rubber price.
Exhibit 8: Trend in EBITDA Margins
‐
2.0
4.0
6.0
8.0
10.0
12.0
14.0
16.0
FY10
FY11
FY12
FY13
FY14
FY15
FY16
FY17E
FY18E
Source: Company Data, PL Research
CEAT
September 20, 2016 11
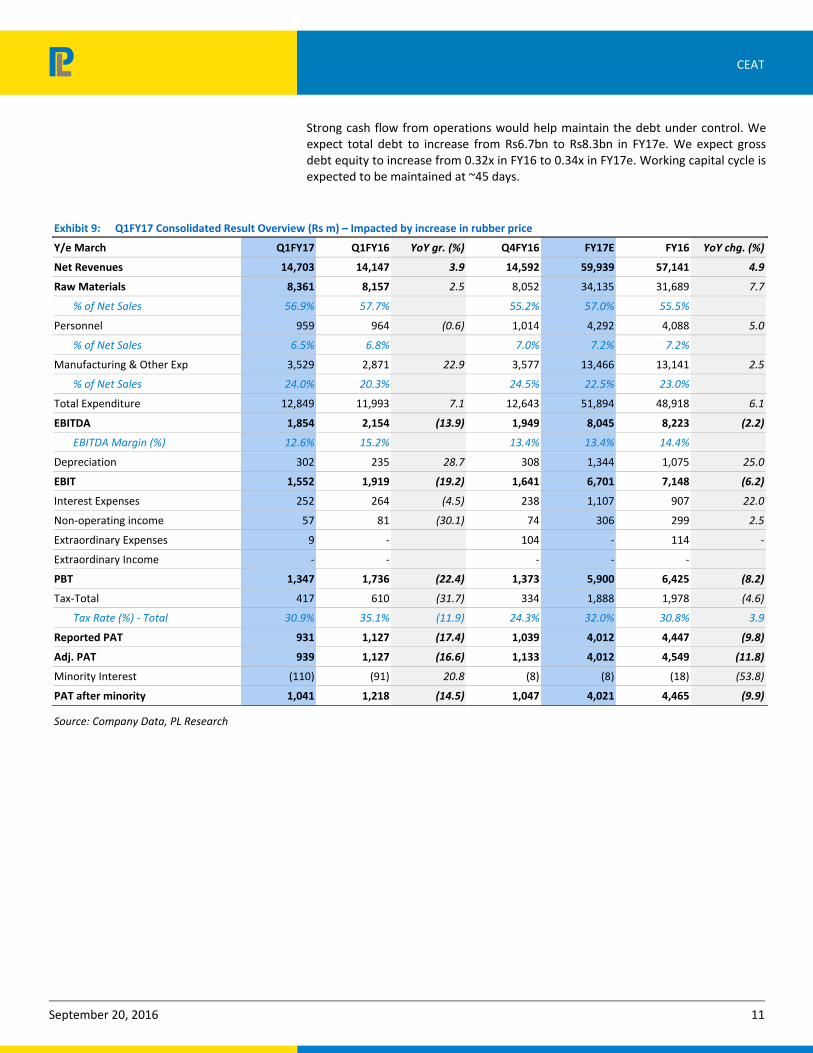
Strong cash flow from operations would help maintain the debt under control. We expect total debt to increase from Rs6.7bn to Rs8.3bn in FY17e. We expect gross debt equity to increase from 0.32x in FY16 to 0.34x in FY17e. Working capital cycle is expected to be maintained at ~45 days.
Exhibit 9: Q1FY17 Consolidated Result Overview (Rs m) – Impacted by increase in rubber price
Y/e March Q1FY17 Q1FY16 YoY gr. (%) Q4FY16 FY17E FY16 YoY chg. (%)
Net Revenues 14,703 14,147 3.9 14,592 59,939 57,141 4.9
Raw Materials 8,361 8,157 2.5 8,052 34,135 31,689 7.7
% of Net Sales 56.9% 57.7% 55.2% 57.0% 55.5%
Personnel 959 964 (0.6) 1,014 4,292 4,088 5.0
% of Net Sales 6.5% 6.8% 7.0% 7.2% 7.2%
Manufacturing & Other Exp 3,529 2,871 22.9 3,577 13,466 13,141 2.5
% of Net Sales 24.0% 20.3% 24.5% 22.5% 23.0%
Total Expenditure 12,849 11,993 7.1 12,643 51,894 48,918 6.1
EBITDA 1,854 2,154 (13.9) 1,949 8,045 8,223 (2.2)
EBITDA Margin (%) 12.6% 15.2% 13.4% 13.4% 14.4%
Depreciation 302 235 28.7 308 1,344 1,075 25.0
EBIT 1,552 1,919 (19.2) 1,641 6,701 7,148 (6.2)
Interest Expenses 252 264 (4.5) 238 1,107 907 22.0
Non‐operating income 57 81 (30.1) 74 306 299 2.5
Extraordinary Expenses 9 ‐ 104 ‐ 114 ‐
Extraordinary Income ‐ ‐ ‐ ‐ ‐
PBT 1,347 1,736 (22.4) 1,373 5,900 6,425 (8.2)
Tax‐Total 417 610 (31.7) 334 1,888 1,978 (4.6)
Tax Rate (%) ‐ Total 30.9% 35.1% (11.9) 24.3% 32.0% 30.8% 3.9
Reported PAT 931 1,127 (17.4) 1,039 4,012 4,447 (9.8)
Adj. PAT 939 1,127 (16.6) 1,133 4,012 4,549 (11.8)
Minority Interest (110) (91) 20.8 (8) (8) (18) (53.8)
PAT after minority 1,041 1,218 (14.5) 1,047 4,021 4,465 (9.9)
Source: Company Data, PL Research

CEAT
September 20, 2016 12
Valuations & Risks We expect Ceat to reap benefits from its strategic focus on the higher‐profitability two‐wheeler and passenger vehicle segments. Additionally, the company’s capacity increase program would also be completed towards FY17‐end and would help Ceat reap benefits of operating leverage in FY18. The tyre industry had benefited in the past two years from multi‐year low rubber prices. While prices have now increased from the lows, we expect Ceat to counter this increase by a combination of product mix improvement, operating leverage, improvement in demand on higher auto sales and selective price increases. Higher profitability and increased cash flow generation would result in an improved balance sheet position FY18 onwards. We initiate coverage on Ceat with a “Buy”. Our target price of Rs1,310 based upon a target 6x EV/EBITDA for FY18e against the current trading multiple of 5.3x FY18e.
Exhibit 10: Comparative valuations
FY17E FY17E FY18E FY18E
EPS (Rs) PE (x) EPS (Rs) PE (x)
Ceat 99.4 11.3 125.7 9.0
Apollo Tyres * 21.1 10.5 22.3 9.9
MRF * 3956.9 10.9 4056.8 10.6
JK Tyres * 19.9 7.5 24.3 6.2
Balkrishna Industries * 57.3 14.8 65.0 13.1
Source: Bloomberg, PL Research *Bloomberg consensus estimates
Risks
A sharp spike in rubber prices would lead to lower profitability for tyre
companies and provide earnings risks.
Pricing discipline is crucial for the tyre industry and if a player indulges in
excessive competition which can then hamper the industry’s prospects.
Ceat’s competitors have announced their entry into the two‐wheeler tyre
segment, which can result in the space getting crowded, even though Ceat has
the first‐mover advantage there.
Delay in completion of capacity expansion can result in delays in getting the
benefits of operating leverage for Ceat.

CEAT
September 20, 2016 13
Income Statement (Rs m)
Y/e March 2015 2016 2017E 2018E
Net Revenue 57,521 57,141 59,939 68,962
Raw Material Expenses 35,333 31,689 34,135 39,101
Gross Profit 22,188 25,452 25,804 29,860
Employee Cost 3,789 4,088 4,292 4,722
Other Expenses 11,595 13,141 13,466 15,354
EBITDA 6,804 8,223 8,045 9,785
Depr. & Amortization 934 1,075 1,344 1,613
Net Interest 1,319 907 1,107 1,328
Other Income 287 413 306 314
Profit before Tax 4,838 6,653 5,900 7,158
Total Tax 1,576 1,978 1,888 2,076
Profit after Tax 3,262 4,675 4,012 5,082
Ex‐Od items / Min. Int. (33) (18) (8) (1)
Adj. PAT 3,172 4,465 4,021 5,084
Avg. Shares O/S (m) 40.5 40.5 40.5 40.5
EPS (Rs.) 78.4 110.4 99.4 125.7
Cash Flow Abstract (Rs m)
Y/e March 2015 2016 2017E 2018E
C/F from Operations 7,979 5,299 6,228 6,901
C/F from Investing (5,413) (4,621) (311) (311)
C/F from Financing (2,951) (1,309) (2,555) (2,709)
Inc. / Dec. in Cash (385) (631) 3,362 3,881
Opening Cash 1,030 645 242 3,604
Closing Cash (2,035) 943 4,277 8,436
FCFF 4,671 (514) (4,082) 1,150
FCFE 669 (1,561) (2,500) 150
Key Financial Metrics
Y/e March 2015 2016 2017E 2018E
Growth
Revenue (%) 3.6 (0.7) 4.9 15.1
EBITDA (%) 3.4 20.9 (2.2) 21.6
PAT (%) 16.9 40.8 (9.9) 26.4
EPS (%) 3.9 40.8 (9.9) 26.4
Profitability
EBITDA Margin (%) 11.8 14.4 13.4 14.2
PAT Margin (%) 5.5 7.8 6.7 7.4
RoCE (%) 17.0 19.2 15.7 17.3
RoE (%) 23.4 23.8 17.9 19.2
Balance Sheet
Net Debt : Equity 0.4 0.3 0.3 0.2
Net Wrkng Cap. (days) 47 42 47 51
Valuation
PER (x) 14.4 10.2 11.4 9.0
P / B (x) 2.7 2.2 1.9 1.6
EV / EBITDA (x) 7.7 6.2 6.6 5.3
EV / Sales (x) 0.9 0.9 0.9 0.8
Earnings Quality
Eff. Tax Rate 33.4 30.8 32.0 29.0
Other Inc / PBT 4.7 4.6 5.2 4.4
Eff. Depr. Rate (%) 3.9 3.5 3.4 3.7
FCFE / PAT 21.1 (35.0) (62.2) 2.9
Source: Company Data, PL Research.
Balance Sheet Abstract (Rs m)
Y/e March 2015 2016 2017E 2018E
Shareholder's Funds 16,823 20,645 24,181 28,758
Total Debt 7,750 6,704 8,285 7,285
Other Liabilities 1,576 1,889 1,989 2,089
Total Liabilities 26,149 29,239 34,455 38,133
Net Fixed Assets 17,883 24,026 28,682 31,070
Goodwill 215 205 205 205
Investments 3,124 403 403 403
Net Current Assets 4,927 4,604 5,165 6,455
Cash & Equivalents 1,236 1,073 1,230 974
Other Current Assets 15,765 15,674 17,403 20,511
Current Liabilities 12,075 12,143 13,468 15,029
Other Assets — — — —
Total Assets 26,149 29,239 34,455 38,133
Quarterly Financials (Rs m)
Y/e March Q2FY16 Q3FY16 Q4FY16 Q1FY17Net Revenue 13,569 13,279 13,914 14,558
EBITDA 1,908 1,969 1,862 1,855
% of revenue 14.1 14.8 13.4 12.7
Depr. & Amortization 228 262.1 283 300
Net Interest 219 190 229 245
Other Income 198.9 120.2 61.4 68.9
Profit before Tax 1,650 1,637 1,309 1,370
Total Tax 500 461 286 405
Profit after Tax 1,149 1,176 1,022 965
Adj. PAT 1,160 1,176 1,095 971
Source: Company Data, PL Research.

CEAT
September 20, 2016 14
Prabhudas Lilladher Pvt. Ltd.
3rd Floor, Sadhana House, 570, P. B. Marg, Worli, Mumbai‐400 018, India
Tel: (91 22) 6632 2222 Fax: (91 22) 6632 2209
Rating Distribution of Research Coverage PL’s Recommendation Nomenclature
26.7%
58.6%
14.7%
0.0%0%
10%
20%
30%
40%
50%
60%
70%
BUY Accumulate Reduce Sell
% of Total Coverage
BUY : Over 15% Outperformance to Sensex over 12‐months
Accumulate : Outperformance to Sensex over 12‐months
Reduce : Underperformance to Sensex over 12‐months
Sell : Over 15% underperformance to Sensex over 12‐months
Trading Buy : Over 10% absolute upside in 1‐month
Trading Sell : Over 10% absolute decline in 1‐month
Not Rated (NR) : No specific call on the stock
Under Review (UR) : Rating likely to change shortly
DISCLAIMER/DISCLOSURES
ANALYST CERTIFICATION
We/I, Mr. Rohan Korde (MMS, BCom), Research Analysts, authors and the names subscribed to this report, hereby certify that all of the views expressed in this research report accurately reflect our views about the subject issuer(s) or securities. We also certify that no part of our compensation was, is, or will be directly or indirectly related to the specific recommendation(s) or view(s) in this report.
Terms & conditions and other disclosures:
Prabhudas Lilladher Pvt. Ltd, Mumbai, India (hereinafter referred to as “PL”) is engaged in the business of Stock Broking, Portfolio Manager, Depository Participant and distribution for third party financial products. PL is a subsidiary of Prabhudas Lilladher Advisory Services Pvt Ltd. which has its various subsidiaries engaged in business of commodity broking, investment banking, financial services (margin funding) and distribution of third party financial/other products, details in respect of which are available at www.plindia.com
This document has been prepared by the Research Division of PL and is meant for use by the recipient only as information and is not for circulation. This document is not to be reported or copied or made available to others without prior permission of PL. It should not be considered or taken as an offer to sell or a solicitation to buy or sell any security.
The information contained in this report has been obtained from sources that are considered to be reliable. However, PL has not independently verified the accuracy or completeness of the same. Neither PL nor any of its affiliates, its directors or its employees accepts any responsibility of whatsoever nature for the information, statements and opinion given, made available or expressed herein or for any omission therein.
Recipients of this report should be aware that past performance is not necessarily a guide to future performance and value of investments can go down as well. The suitability or otherwise of any investments will depend upon the recipient's particular circumstances and, in case of doubt, advice should be sought from an independent expert/advisor.
Either PL or its affiliates or its directors or its employees or its representatives or its clients or their relatives may have position(s), make market, act as principal or engage in transactions of securities of companies referred to in this report and they may have used the research material prior to publication.
PL may from time to time solicit or perform investment banking or other services for any company mentioned in this document.
PL is in the process of applying for certificate of registration as Research Analyst under Securities and Exchange Board of India (Research Analysts) Regulations, 2014
PL submits that no material disciplinary action has been taken on us by any Regulatory Authority impacting Equity Research Analysis activities.
PL or its research analysts or its associates or his relatives do not have any financial interest in the subject company.
PL or its research analysts or its associates or his relatives do not have actual/beneficial ownership of one per cent or more securities of the subject company at the end of the month immediately preceding the date of publication of the research report.
PL or its research analysts or its associates or his relatives do not have any material conflict of interest at the time of publication of the research report.
PL or its associates might have received compensation from the subject company in the past twelve months.
PL or its associates might have managed or co‐managed public offering of securities for the subject company in the past twelve months or mandated by the subject company for any other assignment in the past twelve months.
PL or its associates might have received any compensation for investment banking or merchant banking or brokerage services from the subject company in the past twelve months.
PL or its associates might have received any compensation for products or services other than investment banking or merchant banking or brokerage services from the subject company in the past twelve months
PL or its associates might have received any compensation or other benefits from the subject company or third party in connection with the research report.
PL encourages independence in research report preparation and strives to minimize conflict in preparation of research report. PL or its analysts did not receive any compensation or other benefits from the subject Company or third party in connection with the preparation of the research report. PL or its Research Analysts do not have any material conflict of interest at the time of publication of this report.
It is confirmed that Mr. Rohan Korde (MMS, BCom), Research Analysts of this report have not received any compensation from the companies mentioned in the report in the preceding twelve months
Compensation of our Research Analysts is not based on any specific merchant banking, investment banking or brokerage service transactions.
The Research analysts for this report certifies that all of the views expressed in this report accurately reflect his or her personal views about the subject company or companies and its or their securities, and no part of his or her compensation was, is or will be, directly or indirectly related to specific recommendations or views expressed in this report.
The research analysts for this report has not served as an officer, director or employee of the subject company PL or its research analysts have not engaged in market making activity for the subject company
Our sales people, traders, and other professionals or affiliates may provide oral or written market commentary or trading strategies to our clients that reflect opinions that are contrary to the opinions expressed herein, and our proprietary trading and investing businesses may make investment decisions that are inconsistent with the recommendations expressed herein. In reviewing these materials, you should be aware that any or all o the foregoing, among other things, may give rise to real or potential conflicts of interest.
PL and its associates, their directors and employees may (a) from time to time, have a long or short position in, and buy or sell the securities of the subject company or (b) be engaged in any other transaction involving such securities and earn brokerage or other compensation or act as a market maker in the financial instruments of the subject company or act as an advisor or lender/borrower to the subject company or may have any other potential conflict of interests with respect to any recommendation and other related information and opinions.
DISCLAIMER/DISCLOSURES (FOR US CLIENTS)
ANALYST CERTIFICATION
The research analysts, with respect to each issuer and its securities covered by them in this research report, certify that: All of the views expressed in this research report accurately reflect his or her or their personal views about all of the issuers and their securities; and No part of his or her or their compensation was, is or will be directly related to the specific recommendation or views expressed in this research report
Terms & conditions and other disclosures:
This research report is a product of Prabhudas Lilladher Pvt. Ltd., which is the employer of the research analyst(s) who has prepared the research report. The research analyst(s) preparing the research report is/are resident outside the United States (U.S.) and are not associated persons of any U.S. regulated broker‐dealer and therefore the analyst(s) is/are not subject to supervision by a U.S. broker‐dealer, and is/are not required to satisfy the regulatory licensing requirements of FINRA or required to otherwise comply with U.S. rules or regulations regarding, among other things, communications with a subject company, public appearances and trading securities held by a research analyst account.
This report is intended for distribution by Prabhudas Lilladher Pvt. Ltd. only to "Major Institutional Investors" as defined by Rule 15a‐6(b)(4) of the U.S. Securities and Exchange Act, 1934 (the Exchange Act) and interpretations thereof by U.S. Securities and Exchange Commission (SEC) in reliance on Rule 15a 6(a)(2). If the recipient of this report is not a Major Institutional Investor as specified above, then it should not act upon this report and return the same to the sender. Further, this report may not be copied, duplicated and/or transmitted onward to any U.S. person, which is not the Major Institutional Investor.
In reliance on the exemption from registration provided by Rule 15a‐6 of the Exchange Act and interpretations thereof by the SEC in order to conduct certain business with Major Institutional Investors, Prabhudas Lilladher Pvt. Ltd. has entered into an agreement with a U.S. registered broker‐dealer, Marco Polo Securities Inc. ("Marco Polo").
Transactions in securities discussed in this research report should be effected through Marco Polo or another U.S. registered broker dealer.