Industry Action Plan for Nigerian Shrimp and Prawnspdf.usaid.gov/pdf_docs/PNACY676.pdfIndustry...
23
Industry Action Plan for Nigerian Shrimp and Prawns Prepared by: Chemonics International Inc. 1133 20 th Street NW, Suite 600 Washington, DC 20036 (202) 955-3300 Prepared for: The United States Agency for International Development (USAID)/Nigeria RAISE IQC Contract No. PCE-I-00-99-00003-00 Agricultural Development Assistance in Nigeria Task Order No.812 November 2002
Transcript of Industry Action Plan for Nigerian Shrimp and Prawnspdf.usaid.gov/pdf_docs/PNACY676.pdfIndustry...
Industry Action Plan for Nigerian Shrimp and Prawns
Prepared by:
Chemonics International Inc. 1133 20th Street NW, Suite 600
Washington, DC 20036 (202) 955-3300
Prepared for:
The United States Agency for International Development (USAID)/Nigeria RAISE IQC Contract No. PCE-I-00-99-00003-00 Agricultural Development Assistance in Nigeria
Task Order No.812
November 2002

Chemonics International Inc. 2 USAID PCE-I-00-99-00003-00 November 2002 Task Order No. 812
FOREWORD Under the Rural and Agricultural Incomes with a Sustainable Environment (RAISE) IQC, Chemonics International and its Agricultural Development Assistance in Nigeria (ADAN) project are working with USAID/Nigeria and the Government of the Federal Republic of Nigeria (GON) to stimulate Nigeria’s economic growth through increased competitiveness in the world market. A key component of this effort centers on determination of specific agricultural products with the greatest potential for increasing foreign exchange and employment. ADAN specifically targets increased agricultural commodity production and exports, and seeks to boost domestic sales as well through opportunistic ‘fast track’ activities, which are loosely based on development of networks and linkages to expedite trade. The following Industry Action Plan addresses the Nigerian shrimp/prawn industry, one of five industry clusters selected during a stakeholder conference in Abuja, Nigeria in January 2002 and further discussed at a follow-up stakeholder conference in Lagos, Nigeria in October 2002. Chemonics would like to take the opportunity to thank local consultants Prof. Martins Anetekhai, Prof. Adebiyi Daramola, Aderemi Osijo, and external consultants, Grahame Dixie, Dr. Peter Jaeger and Nigel Peacock, for their participation in the development of this report. Project deliverables include Sub-sector Assessments and Industry Action Plans (IAPs). The IAPs focus primarily on actions the Nigerian private sector need to undertake to improve the viability of these industry clusters, although government activities are also addressed. These plans are a supplement to the Sub-sector Assessments, providing the reader with a quick overview of key market information from the Sub-sector Assessments, as well as, actions to address the needs of the Nigerian industries. Those seeking additional background and analyses should refer to the accompanying assessment reports.

Chemonics International Inc. 3 USAID PCE-I-00-99-00003-00 November 2002 Task Order No. 812
TABLE OF CONTENTS
I. STRATEGIC ANALYSIS......................................................................................................... 6 A. BACKGROUND........................................................................................................................... 6 B. OBJECTIVES .............................................................................................................................. 6 C. KEY DEFINITIONS...................................................................................................................... 6 D. THE MARKET............................................................................................................................ 6
D.1. The International Market - Shrimp.................................................................................. 7 D.2. International Market -Freshwater Prawns...................................................................... 8 D.3. The Local Market............................................................................................................. 9
II. IMPLEMENTATION ............................................................................................................. 11 A. APPROACH: ............................................................................................................................. 11 B. ACTIVITIES ............................................................................................................................. 11 B.1. THE COMMODITY BUSINESS BUREAU (CBB) ..................................................................... 13
B.2. Shrimp Farming ............................................................................................................. 13 B.3. Freshwater Prawn Farming .......................................................................................... 14 B.4. Government Participation ............................................................................................. 14 B.5. Evaluation and Feedback .............................................................................................. 15
ANNEX 1: SHRIMP FARMING- A MAJOR AGRIBUSINESS ............................................... 16 A. THE MODEL UNIT FARM......................................................................................................... 16
A.1. Overview ........................................................................................................................ 16 A.2. Capital & Operating Costs ............................................................................................ 17 A.3. Financial parameters..................................................................................................... 18 A.4. Sensitivity Analysis......................................................................................................... 18 A.5. Build up of a Nigerian Industry ..................................................................................... 19
ANNEX II: FRESHWATER PRAWN FARMING: ENHANCING RURAL LIVELIHOODS ............................................................................................................................... 20
A. OPERATIONAL MODELS .......................................................................................................... 20
ANNEX III: RISKS AND ASSUMPTIONS................................................................................ 22 A. ASSUMPTIONS FOR PRAWN FARMING ..................................................................................... 22 B. RISK ANALYSIS FOR SHRIMP FARMING................................................................................... 22
B.1. Technical risks ............................................................................................................... 22 B.2. General risks.................................................................................................................. 23

Chemonics International Inc. 4 USAID PCE-I-00-99-00003-00 November 2002 Task Order No. 812
LIST OF TABLES
Table 1: Income Generation and Job Creation............................................................................... 5 Table 2: The main OECD markets for shrimp imports – 1999-2000 ............................................ 7 Table 3: Price-time sequences for key shrimp/prawn indicator products, 1997-2002................... 8 Table 4: Freshwater prawn production in 1998 ............................................................................. 9 Table 5: Shrimp and prawn retail prices in markets in southern Nigeria..................................... 10 Table 6: Main Activities, Timeframe, Benchmarks..................................................................... 12 Table 7: Evaluation Criteria and Projections ............................................................................... 15 Table 8: Model of the build-up of a Nigerian shrimp farming industry ...................................... 17 Table 9: Capital cost breakdown.................................................................................................. 18 Table 10: Recurrent (operating costs) breakdown ......................................................................... 18 Table 11: Standard sensitivity tests................................................................................................ 19 Table 12: Summary of the economic parameters for prawn culture options ................................. 20 Table 13: Rice production in Nigeria and implied prawn culture potential................................... 21
Chemonics International Inc. 5 USAID PCE-I-00-99-00003-00 November 2002 Task Order No. 812
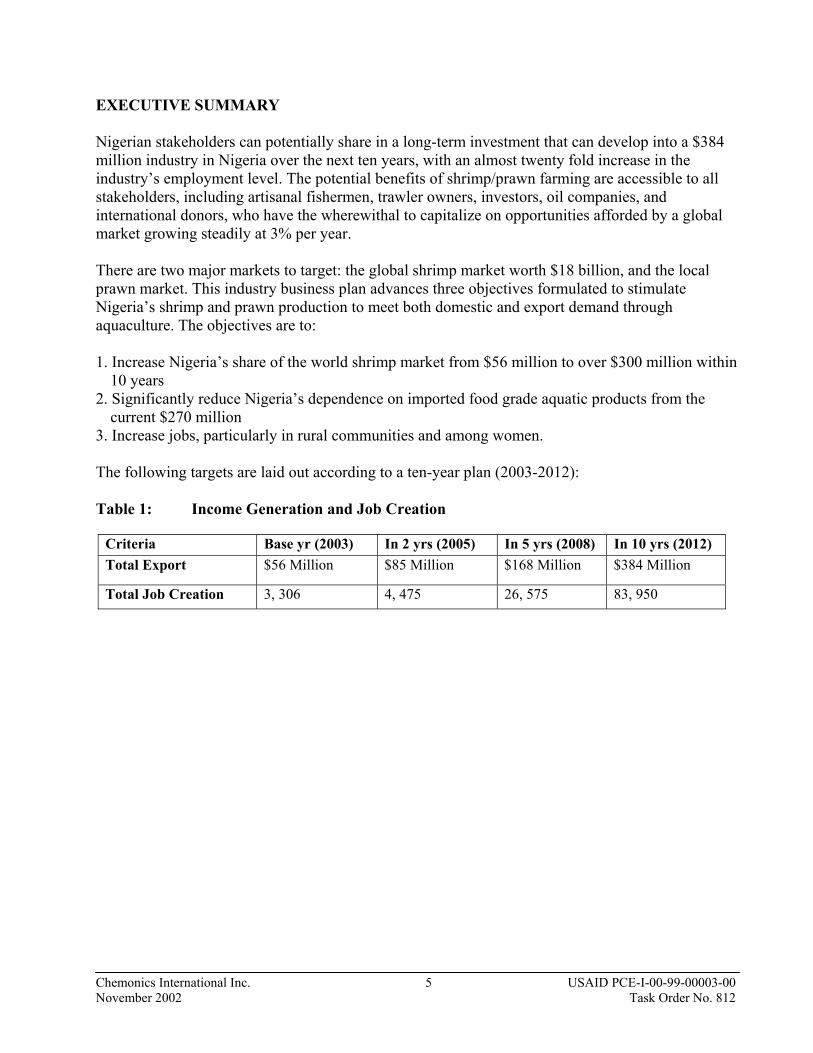
EXECUTIVE SUMMARY Nigerian stakeholders can potentially share in a long-term investment that can develop into a $384 million industry in Nigeria over the next ten years, with an almost twenty fold increase in the industry’s employment level. The potential benefits of shrimp/prawn farming are accessible to all stakeholders, including artisanal fishermen, trawler owners, investors, oil companies, and international donors, who have the wherewithal to capitalize on opportunities afforded by a global market growing steadily at 3% per year. There are two major markets to target: the global shrimp market worth $18 billion, and the local prawn market. This industry business plan advances three objectives formulated to stimulate Nigeria’s shrimp and prawn production to meet both domestic and export demand through aquaculture. The objectives are to:
1. Increase Nigeria’s share of the world shrimp market from $56 million to over $300 million within
10 years 2. Significantly reduce Nigeria’s dependence on imported food grade aquatic products from the
current $270 million 3. Increase jobs, particularly in rural communities and among women. The following targets are laid out according to a ten-year plan (2003-2012): Table 1: Income Generation and Job Creation
Criteria Base yr (2003) In 2 yrs (2005) In 5 yrs (2008) In 10 yrs (2012) Total Export $56 Million $85 Million $168 Million $384 Million
Total Job Creation 3, 306 4, 475 26, 575 83, 950

Chemonics International Inc. 6 USAID PCE-I-00-99-00003-00 November 2002 Task Order No. 812
I. STRATEGIC ANALYSIS A. Background Development of the Nigerian shrimp and prawn industry faces the following problems: • Fully or over-exploited wild capture shrimp production. • Limited knowledge or exposure to shrimp and prawn farming. • Absence of locally produced feeds for shrimp and prawn farming. • Land acquisition in the Delta by non-indigenes is very difficult and suitable areas for shrimp
farming tend to also be the oil rich areas. Based on this analysis, the team proposes the following long-term goal: To stimulate Nigeria’s shrimp & prawn production to meet both domestic and export demand through aquaculture. B. Objectives To achieve our goal, the specific objectives include:
• To increase Nigeria’s share of the world shrimp market from $56 million to $384 million within 10 years
• To significantly reduce Nigeria’s dependence on imported food grade aquatic products currently valued at US$270 million
• To increase jobs, particularly in the rural communities as a result of prawn farming. Employment from shrimp farming alone should increase from 3,306 to 83,950 within 10 years. Currently, there are over 250,000 artisanal fishermen that will be positively impacted directly and or indirectly from the introduction of shrimp and prawn farming.
C. Key definitions We have assigned the term shrimp to mean marine water Penaeids (e.g. the white shrimp caught by Nigerian trawlers in the ocean) while the term prawn refers exclusively to the large freshwater prawns (Macrobrachium) produced in Nigeria’s rivers and lakes, and found up to 250 kilometers inland. D. The Market The international market is the main focus of this business plan, based on the genesis of the project, which is to increase rural employment and incomes, especially among women and youth involved in export commodities. The plan does cover, however, local markets, as this is a key opportunity for Nigerian stakeholders. Shrimp has grown into a significant global seafood industry, producing nearly four million tons worth about $18 billion annually. Approximately half of the global shrimp supply is traded internationally, with trade flowing mainly from the tropical developing world to the OECD (Organization for Economic Cooperation & Development) countries, i.e. North America, Europe and Japan. Shrimp imports by these wealthy markets reached $7.8 billion in 2001. Combined with the domestic production in the USA and Europe, the total OECD market is valued at $8.6billon.

Chemonics International Inc. 7 USAID PCE-I-00-99-00003-00 November 2002 Task Order No. 812
D.1. The International Market - Shrimp This discussion is a summary of a more detailed market assessment for shrimp/prawn contained in the Nigerian shrimp/prawn assessment report. Uses Shrimp, once regarded as a luxury food by most people, has become more affordable and available as demand for it steadily rises in the major consuming markets of Japan, North America and Europe. Penaeid shrimp are the typical tropical shrimp, dominating the market and produced in many areas around SE Asia and Latin America. They have been the focus of a major global fishery industry that developed rapidly during the second half of the twentieth century, and have become central to the shrimp farming industry. Buyers Overall demand in this complex, highly segmented, market has been increasing at 3% p.a., with the US market growing at 5%. The main buyers are the OECD countries (US, Japan and Europe). US and European consumption has grown, but at the expense of the recession-dampened Japanese market, which has been in retreat (see Table 2).
Table 2: The main OECD markets for shrimp imports – 1999-2000
US imports Europe (EU)
imports Japan imports Total imports
1998 316,000 363,144 238,900 918,044 1999 331,700 348,034 247,300 927,034 2000 345,100 378,375 246,600 970,075 2001 400,300 363,184 245,000 1,008,484
Growth 5yr avg +6.4% pa +2.8%pa -1.7%pa +2.8%pa
10 yr avg +5.0%pa +2.9%pa -1.5%pa +2.3%pa Sources: Globefish/NMFS/Infofish (See Annex II)
Prices Prices for shrimp have remained remarkably stable for the 20 years during which the farming industry has developed, despite the huge increase in output that farming produced (farmed production has grown by 100% over the last 10 years). However, prices started to fall during 2000 and have continued to decline in 2002. This happened across the board, although the decline was not necessarily even. Key shrimp category prices show an average annual decline of 5 to 8% over these two years. At the same time, the premium that white shrimp received over black tiger has reduced to insignificant levels.

Chemonics International Inc. 8 USAID PCE-I-00-99-00003-00 November 2002 Task Order No. 812
Table 3: Price-time sequences for key shrimp/prawn indicator products, 1997-2002 1997 1998 1999 2000 2001 2002 Average price white shrimp Tails, port landed USA: $US/kg
12.4 11.9 11.2 13.7 12.5 7.5
Black tiger 26/30 grade Tails, CIF USA: $US/kg
13.3 13.7 11.6 13.8 11.0 10.0
White shrimp 26/30 grade Tails, CIF USA: $US/kg
15.4 14.9 13.2 14.0 13.3 10.7
Freshwater prawns 20/25grade Tails, CIF EU: $US/kg
11.8 12.5 10.4 11.4 7.9 5.8
Source: Price data from US NMFS, FAO Infofish (see Annex III) Producers Production has shown a steady increase to meet demand, with farmed shrimp contributing 25% and estimated to increase to 50% of production. Four producers dominate the output of world shrimp: China is the leading producer, responsible for 25% of world production, followed by Indonesia, India and Thailand. Other producers include Mexico, Colombia, Ecuador, Vietnam, Bangladesh, Honduras, Panama and the Philippines. Total global production currently stands at 3.8 million tons. D.2. International Market -Freshwater Prawns Uses Prawns reach a specialized market that is related to the traditions of ethnic groups within OECD markets - particularly Asiatic communities for whom freshwater prawns have been important in their national diets. This means that ethnic markets - and their restaurant trades - particularly favor prawns. They also have a specialty niche in the wider market – prawn’s large size and impressive appearance makes them an attractive “feature” item for displays by fishmongers and up-market restaurants. Buyers The EU is the main importer of freshwater prawns. Informally, traders estimate that monthly freshwater prawn imports by the main EU processors are 20-30 containers (20t/40ft) amounting to 6,000 tons per year. The main UK processor imports around 600 tons annually. Overall imports are probably significantly larger than this, as much trade bypasses the large processors (the ethnic and restaurant trade is seen as a lower key, parallel business by the big processors). That said, the freshwater prawn trade is clearly only a fraction of that for penaeid shrimp. Prices As can be seen from Table 3, freshwater prawn tails suffer a significant discount on international bulk markets (formerly 20%, relative to black tiger tails of the same size grade). This has increased dramatically (to 50%), and so it appears that prawns have suffered disproportionately from the recent market downturn. In view of the poor tail meat yield from freshwater prawns (40% rather than 60% plus for black tiger) this means that live freshwater prawns are now less than a third of the value of the equivalent weight of black tiger. Producers
Chemonics International Inc. 9 USAID PCE-I-00-99-00003-00 November 2002 Task Order No. 812
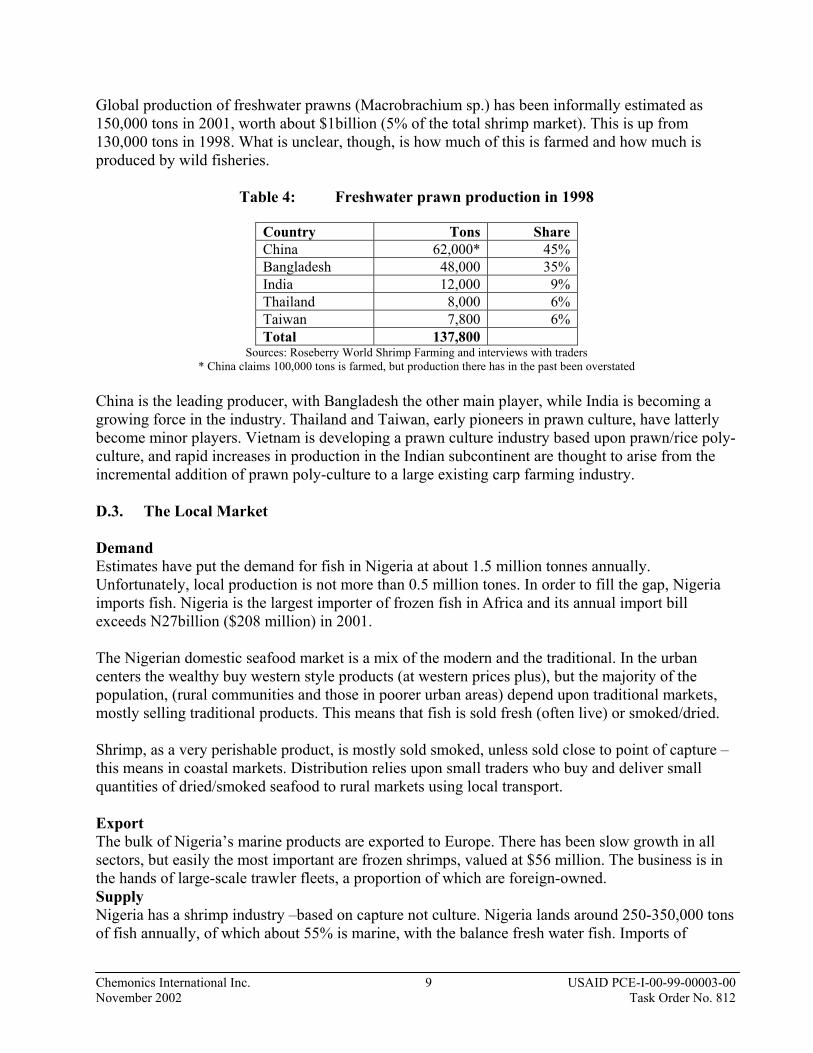
Global production of freshwater prawns (Macrobrachium sp.) has been informally estimated as 150,000 tons in 2001, worth about $1billion (5% of the total shrimp market). This is up from 130,000 tons in 1998. What is unclear, though, is how much of this is farmed and how much is produced by wild fisheries.
Table 4: Freshwater prawn production in 1998
Country Tons ShareChina 62,000* 45%Bangladesh 48,000 35%India 12,000 9%Thailand 8,000 6%Taiwan 7,800 6%Total 137,800
Sources: Roseberry World Shrimp Farming and interviews with traders * China claims 100,000 tons is farmed, but production there has in the past been overstated
China is the leading producer, with Bangladesh the other main player, while India is becoming a growing force in the industry. Thailand and Taiwan, early pioneers in prawn culture, have latterly become minor players. Vietnam is developing a prawn culture industry based upon prawn/rice poly-culture, and rapid increases in production in the Indian subcontinent are thought to arise from the incremental addition of prawn poly-culture to a large existing carp farming industry. D.3. The Local Market Demand Estimates have put the demand for fish in Nigeria at about 1.5 million tonnes annually. Unfortunately, local production is not more than 0.5 million tones. In order to fill the gap, Nigeria imports fish. Nigeria is the largest importer of frozen fish in Africa and its annual import bill exceeds N27billion ($208 million) in 2001. The Nigerian domestic seafood market is a mix of the modern and the traditional. In the urban centers the wealthy buy western style products (at western prices plus), but the majority of the population, (rural communities and those in poorer urban areas) depend upon traditional markets, mostly selling traditional products. This means that fish is sold fresh (often live) or smoked/dried. Shrimp, as a very perishable product, is mostly sold smoked, unless sold close to point of capture – this means in coastal markets. Distribution relies upon small traders who buy and deliver small quantities of dried/smoked seafood to rural markets using local transport. Export The bulk of Nigeria’s marine products are exported to Europe. There has been slow growth in all sectors, but easily the most important are frozen shrimps, valued at $56 million. The business is in the hands of large-scale trawler fleets, a proportion of which are foreign-owned. Supply Nigeria has a shrimp industry –based on capture not culture. Nigeria lands around 250-350,000 tons of fish annually, of which about 55% is marine, with the balance fresh water fish. Imports of
Chemonics International Inc. 10 USAID PCE-I-00-99-00003-00 November 2002 Task Order No. 812
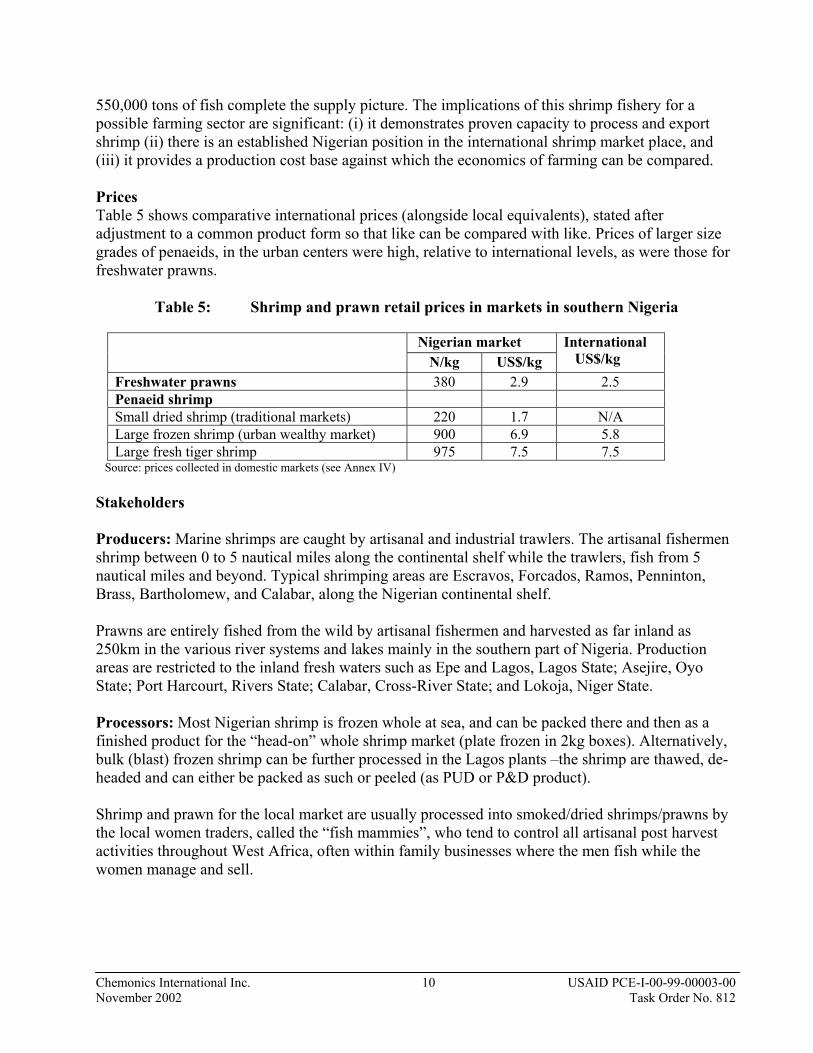
550,000 tons of fish complete the supply picture. The implications of this shrimp fishery for a possible farming sector are significant: (i) it demonstrates proven capacity to process and export shrimp (ii) there is an established Nigerian position in the international shrimp market place, and (iii) it provides a production cost base against which the economics of farming can be compared. Prices Table 5 shows comparative international prices (alongside local equivalents), stated after adjustment to a common product form so that like can be compared with like. Prices of larger size grades of penaeids, in the urban centers were high, relative to international levels, as were those for freshwater prawns.
Table 5: Shrimp and prawn retail prices in markets in southern Nigeria
Nigerian market N/kg US$/kg
International US$/kg
Freshwater prawns 380 2.9 2.5 Penaeid shrimp Small dried shrimp (traditional markets) 220 1.7 N/A Large frozen shrimp (urban wealthy market) 900 6.9 5.8 Large fresh tiger shrimp 975 7.5 7.5
Source: prices collected in domestic markets (see Annex IV) Stakeholders Producers: Marine shrimps are caught by artisanal and industrial trawlers. The artisanal fishermen shrimp between 0 to 5 nautical miles along the continental shelf while the trawlers, fish from 5 nautical miles and beyond. Typical shrimping areas are Escravos, Forcados, Ramos, Penninton, Brass, Bartholomew, and Calabar, along the Nigerian continental shelf. Prawns are entirely fished from the wild by artisanal fishermen and harvested as far inland as 250km in the various river systems and lakes mainly in the southern part of Nigeria. Production areas are restricted to the inland fresh waters such as Epe and Lagos, Lagos State; Asejire, Oyo State; Port Harcourt, Rivers State; Calabar, Cross-River State; and Lokoja, Niger State. Processors: Most Nigerian shrimp is frozen whole at sea, and can be packed there and then as a finished product for the “head-on” whole shrimp market (plate frozen in 2kg boxes). Alternatively, bulk (blast) frozen shrimp can be further processed in the Lagos plants –the shrimp are thawed, de-headed and can either be packed as such or peeled (as PUD or P&D product). Shrimp and prawn for the local market are usually processed into smoked/dried shrimps/prawns by the local women traders, called the “fish mammies”, who tend to control all artisanal post harvest activities throughout West Africa, often within family businesses where the men fish while the women manage and sell.

Chemonics International Inc. 11 USAID PCE-I-00-99-00003-00 November 2002 Task Order No. 812
II. IMPLEMENTATION This IAP advocates a dual program: moving shrimp and prawns culture in parallel following similar approaches, but adopting very different activities– shrimp as a large agribusiness of interest to substantial investors with a mid to long term investment horizon, while freshwater prawns are seen in terms of improving the livelihoods of the rural poor through revenue generating activities that are incremental to existing aquaculture or agricultural enterprises. A. Approach: 1. Establish Shrimp/Prawn Action Team as precursor to Commodity Business Bureau (CBB) 2. Perform in-depth feasibility study to validate assumptions and identify appropriate locations 3. Establish pilot project for demonstration, replication and awareness creation. 4. Provide technical assistance to current and future producers and processors to increase volume
and unit value of shrimp and prawn production Establishment of a commodity association is crucial to long-term sustainability. A Commodity Business Bureau (CBB) must be created as a private-sector entity to provide business services and establish and enforce a set of standards. The CBB will work in collaboration with government and multinational organizations. It will be the focal point of all shrimp/prawn activities including those mentioned above as well as market information, technical assistance, establishing business and financial linkages, strengthening associations and cooperatives, and developing standards and enforcement. Once created and functioning well, the CBB can be expanded to cover other commodities and standards. B. Activities The table which follows shows the main activities in this project, organized according to the project objectives:

Chemonics International Inc. 12 USAID PCE-I-00-99-00003-00 November 2002 Task Order No. 812
Table 6: Main Activities, Timeframe, Benchmarks YEARS ACTIVITY
1 2 3 4 5 6 7 8 9 10Industry Stakeholders’ Association/Organization a. Coordinate activities through the Shrimp/Prawn “Action” Team b. Create the CBB with members from all sectors of the industry c. Obtain adequate financing and management for the CBB d. Help develop working relationships between CBB and related public and private-sector organizations
e. Help the CBB prepare and execute operational plans Benchmark: CBB set up and operating effectively, end of year 1 Shrimp Farming a. Coordinate activities through the Shrimp/Prawn “Action Team” b. Prepare preliminary feasibility study and monitor international market price c. Promote to Nigerian business entrepreneur community d. Full, site-specific survey – locations, technical & socio economic e. Full feasibility studies – due diligence - by potential investors f. Piloting successfully begin replication Benchmark: A replicable, commercially viable shrimp farm is well established Freshwater Prawn Farming a. Coordinate activities through the Shrimp/Prawn “Action Team” b. Research hatchery technology, especially for the local species c. Trial of on-growing to perfect technology, in parallel with the hatchery research d. Assess scope for coordinating the prawn farming trials set up within the Delta e. Prepare a replicable package for community-based prawn farms f. Progress with demonstration & extension to rural artisans Benchmark: A replicable, commercial viable prawn farm is well established Government participation a. Provide support, which could include land, selection of appropriate pilot areas b. Take measures to reduce costs of materials and equipment for shrimp/prawn production and processing
c. Improve roads and increase transport options d. Continue streamlining port operations to reduce cost and pilferage e. Encourage more favorable monetary and fiscal policies f. Assist with export promotion in cooperation with NEPC Benchmark: The Government cooperating to meet Shrimp/Prawn industry goals Evaluation and feedback a. Develop a monitoring and evaluation system b. Assign responsibilities and monitor as scheduled Benchmark: Monitoring and feedback system working effectively

Chemonics International Inc. 13 USAID PCE-I-00-99-00003-00 November 2002 Task Order No. 812
B.1. The Commodity Business Bureau (CBB) The Commodity Business Bureau (CBB) will be composed of stakeholders in the production, processing and marketing of shrimps and prawns and will be given primary responsibility for carrying out this plan. The CBB will be assisted in its work by public and private sector organizations, which it will help to strengthen. The steps in organizing the CBB are as follows: 1. Convene a stakeholders’ forum to share the idea and gain commitment to establish the CBB 2. Establish a Steering Board with representatives from all sectors of the industry to:
• Develop services for members such as market information, Internet browsing and market and financial linkages, and determine the fees for these services
• Assist in setting up a pilot shrimp/prawn farm demonstration project • Provide technical assistance to help producers and processors to set up their own farms • Assure sustainability of the CBB • Monitor compliance with standards and the impact of the CBB’s services
3. Set up an office, recruit staff and begin operation 4. Eventually expand the CBB’s mandate to include other commodities, services and standards B.2. Shrimp Farming 1. Coordinate activities through the Shrimp/Prawn “Action Team”, which was established at the 10 October 2002 Agri-Business Forum On Export Opportunities For Shrimp/Prawn Production In Nigeria, Muson Center, Lagos, Nigeria. Key stakeholders have selected the following members:
1 Multinational (Shell Oil Company) 1 Private Sector (i.e. Ocean Fisheries) 1 Public Sector (Federal Department of Fisheries/PCU) 1 Research (NIOMR) 1 Commercial Bank (i.e. NACRDB)
2. Prepare a preliminary feasibility study, and monitor the international market for shrimp: this study provides a proforma for a full feasibility study. Further reconnaissance of areas designated as targets for shrimp farm sites (Akwa Ibom and Ondo States’ coastal zones) should be visited as a priority. 3. Promote to Nigerian business entrepreneur community: Provided that findings are positive, develop the feasibility study into a prospectus and circulate amongst the Nigerian business community. Accompany this with media promotion: e.g. business newspaper articles, TV programs. Convene a business forum in Lagos or Abuja designed explain the potential and engage entrepreneurs in a dialogue on shrimp culture, in order to generate interest. 4. Full, site-specific survey of potential – covering sites, technical and socio economic aspects etc. The public sector should undertake a comprehensive survey as part of its planning remit. This should involve use of the most up-to-date maps, aerial photographs, remote sensing data, cadastre, geological survey data, faunal and floral biodiversity data etc. The intention would be to provide the basis for determining the extent of suitable sites, priority areas for shrimp culture and for zoning these areas to ensure adequate protection of mangrove and other resources.

Chemonics International Inc. 14 USAID PCE-I-00-99-00003-00 November 2002 Task Order No. 812
5. Full feasibility studies by potential investors: this would be the responsibility of the potential investors, but the expert shrimp group should provide technical support. 6. Piloting: the risks and uncertainties of introducing this new technology to Nigeria means that there is a strong case for a cautious piloting approach during the pioneer stage. B.3. Freshwater Prawn Farming 1. Coordinate activities through the Shrimp/Prawn “Action Team” which was established at the 10 October 2002 Agri-Business Forum On Export Opportunities For Shrimp/Prawn Production In Nigeria, Muson Center, Lagos, Nigeria. Key stakeholders have selected the following members:
1 Multinational (Shell Oil Company) 1 Private Sector (i.e. Ocean Fisheries) 1 Public Sector (Federal Department of Fisheries/PCU) 1 Research (NIOMR) 1 Commercial Bank (i.e. NACRDB)
2. Research hatchery technology, especially for the local species M vollenhovenii, in a focused attempt to understand the breeding cycle and reproduce this reliably artificially. Without this, there is little prospect of developing viable prawn culture based on an indigenous species. 3. Trial on-growing to perfect technology, in parallel with the hatchery research to (i) improve low input culture for artisanal producers, (ii) assess fish/prawn polyculture using herbivore fish species, and (iii) assess whether rice/prawn polyculture is feasible and economically desirable. 4. Assess scope for coordinating the prawn farming trials set up within the Delta by the oil major’s community development programs. 5. Prepare a replicable package for community-based prawn farms for dissemination amongst the government institutions, NGOs and other agencies involved with rural development. 6. Progress with demonstration and extension to rural artisans, possibly with the assistance of demonstration farms if an effective formula for managing such farms can be created (bearing in mind the past performance of state owned facilities). B.4. Government Participation Government participation should consist of the following activities: 1. Provide necessary support, which could include land, selection of appropriate pilot areas. 2. Take measures to reduce costs of materials and equipment for shrimp/prawn production and processing 3. Improve roads and increase transport options from producing areas to processing plants and from there to the port
Chemonics International Inc. 15 USAID PCE-I-00-99-00003-00 November 2002 Task Order No. 812
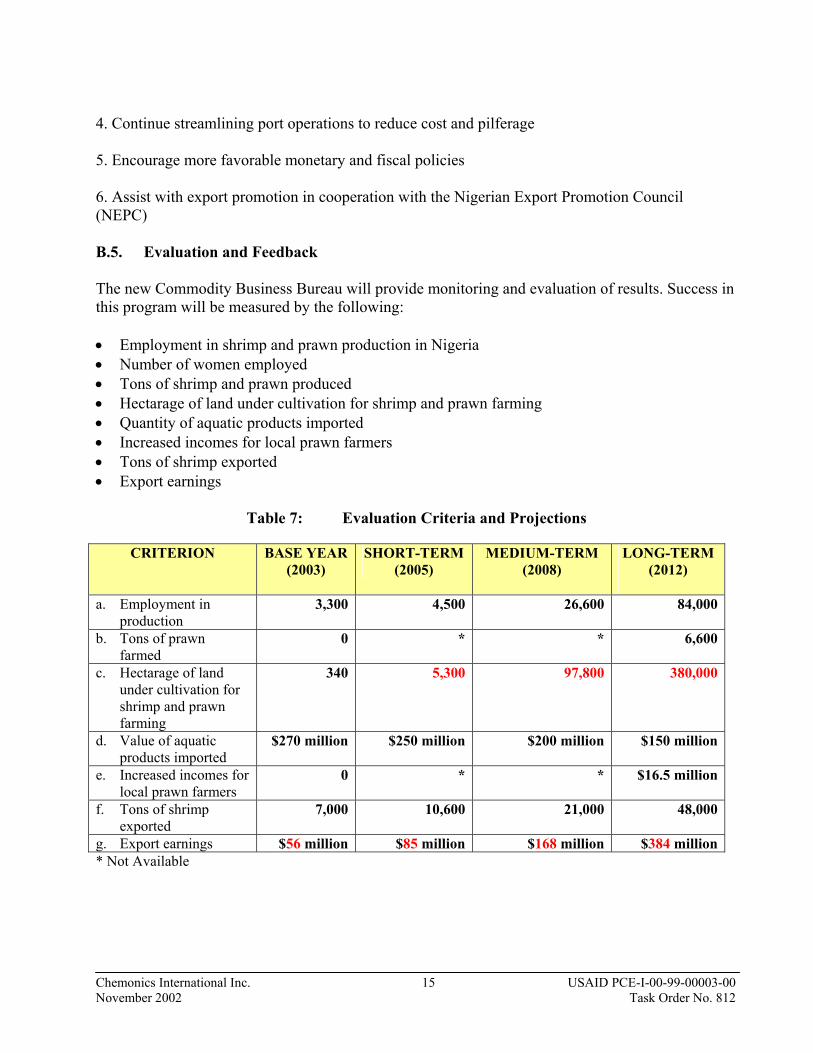
4. Continue streamlining port operations to reduce cost and pilferage 5. Encourage more favorable monetary and fiscal policies 6. Assist with export promotion in cooperation with the Nigerian Export Promotion Council (NEPC) B.5. Evaluation and Feedback The new Commodity Business Bureau will provide monitoring and evaluation of results. Success in this program will be measured by the following: • Employment in shrimp and prawn production in Nigeria • Number of women employed • Tons of shrimp and prawn produced • Hectarage of land under cultivation for shrimp and prawn farming • Quantity of aquatic products imported • Increased incomes for local prawn farmers • Tons of shrimp exported • Export earnings
Table 7: Evaluation Criteria and Projections
CRITERION BASE YEAR (2003)
SHORT-TERM (2005)
MEDIUM-TERM (2008)
LONG-TERM (2012)
a. Employment in
production 3,300 4,500 26,600 84,000
b. Tons of prawn farmed
0 * * 6,600
c. Hectarage of land under cultivation for shrimp and prawn farming
340 5,300 97,800 380,000
d. Value of aquatic products imported
$270 million $250 million $200 million $150 million
e. Increased incomes for local prawn farmers
0 * * $16.5 million
f. Tons of shrimp exported
7,000 10,600 21,000 48,000
g. Export earnings $56 million $85 million $168 million $384 million* Not Available

Chemonics International Inc. 16 USAID PCE-I-00-99-00003-00 November 2002 Task Order No. 812
Annex 1: SHRIMP FARMING- A MAJOR AGRIBUSINESS There are no commercial shrimp farms in Nigeria, nor any significant sustained development of the industry elsewhere in West Africa. As there was then no precedence for shrimp culture in the area, the only way to test assumptions about its potential viability was through modeling the sort of venture that could form the basis for a Nigerian shrimp culture industry. Then, the way the industry might develop can be explored by using this unit operation as a building block, and sequentially increasing the number of these blocks, modeling a structured development of an industry. This is assumed to be located on coastal land to the east and/or west the Niger Delta, and cost and other parameters will then inevitably be approximate, as shrimp farm design is highly site specific. This section describes the basic building block – the unit commercial shrimp farm of the sort that might be set up in Nigeria. There are four main components to a shrimp farm: • The on-growing pond system: the bulk of the investment and the element that uses most of the
land. This includes the ponds, the main inflow and drainage canals, pumping systems and associated facilities (e.g. unit managers houses)
• A hatchery, able to supply at least the demands of the farm and possibly extra for sale. The
nature of the site should preferably allow this to be built reasonably close to the pond farm • A processing facility. The possibility of contract processing a joint venture with an existing
plant, or where the project charters a freezer trawler as a pro-tem facility could be considered, especially in the initial phases. What is essential is that there is reliable access to certified facilities from the outset.
• A management and servicing unit: (i) on-farm management and central servicing (maintenance,
repair, transport, supplies group purchasing & storage, veterinary etc) and (ii) an HQ that supervises overall and assists with export marketing and financial management.
A. The Model Unit Farm A.1. Overview The target area is assumed to be either (i) coastal land between Bonny Island to the East of the Delta and (ii) Ondo state coast to the west of the Delta. A detailed survey would be needed to identify specific sites. We use proximate cost and other parameters, as shrimp farm design is site specific. The model farm would have a construction cost of $US 4.7million, including the hatchery and a processing facility. This unit would have an internal rate of return of 21% at current low shrimp prices (which would have been 30% plus at prices prevailing in the late 1990’s). The critical unit production cost would be $US3.6 per kg, a cost that is competitive with trawled shrimp, but not one of the lowest (US$2-3 per kg, achieved by extensive units in Bangladesh and Indonesia using existing impounded areas and relatively low inputs). Larger scale operations would have lower unit production costs because the advantages of scale would be considerable, so as the industry grew

Chemonics International Inc. 17 USAID PCE-I-00-99-00003-00 November 2002 Task Order No. 812
there would be scope to improve competitiveness. A sensitivity analysis shows that the venture would be reasonably resilient in the face of 10% divergences for key cost/revenue values. There should also be significant scope for further improving performance, as assumptions of yield and other factors are conservative. Conversely, the assumption is also made that feed will eventually be produced in Nigeria with some use of local materials. Should this not occur, and the industry becomes totally dependent upon imported feed, then there would be a lowering of the IRR to 18.5%, an increase in unit production cost to US$3.9/kg and a loss of net foreign exchange benefit.
Table 8: Model of the build-up of a Nigerian shrimp farming industry
Year 2003 2004 2005 2006 2007 2008 2009 2010 2011 2012 2013 Unit farm output (tons)
0
50
200
375
500
500
500
500
500
500
500
Scaling up factor *
1 (Pilot phase)
+5 +10 +15 +20 +25 Cumulative total –75
Growth in output (tons)
0
50
200
600
2,000
5,000
11,000
19,000
28,000
35,000
38,000
Growth in revenues (US$ million)
0
0
1
3
11
28
59
104
154
191
208
Area required (inc surrounds) square km
.34
1.7
5.3
16.8
44.8
97.8
175.8
268.6
344.2
379.6
379.6
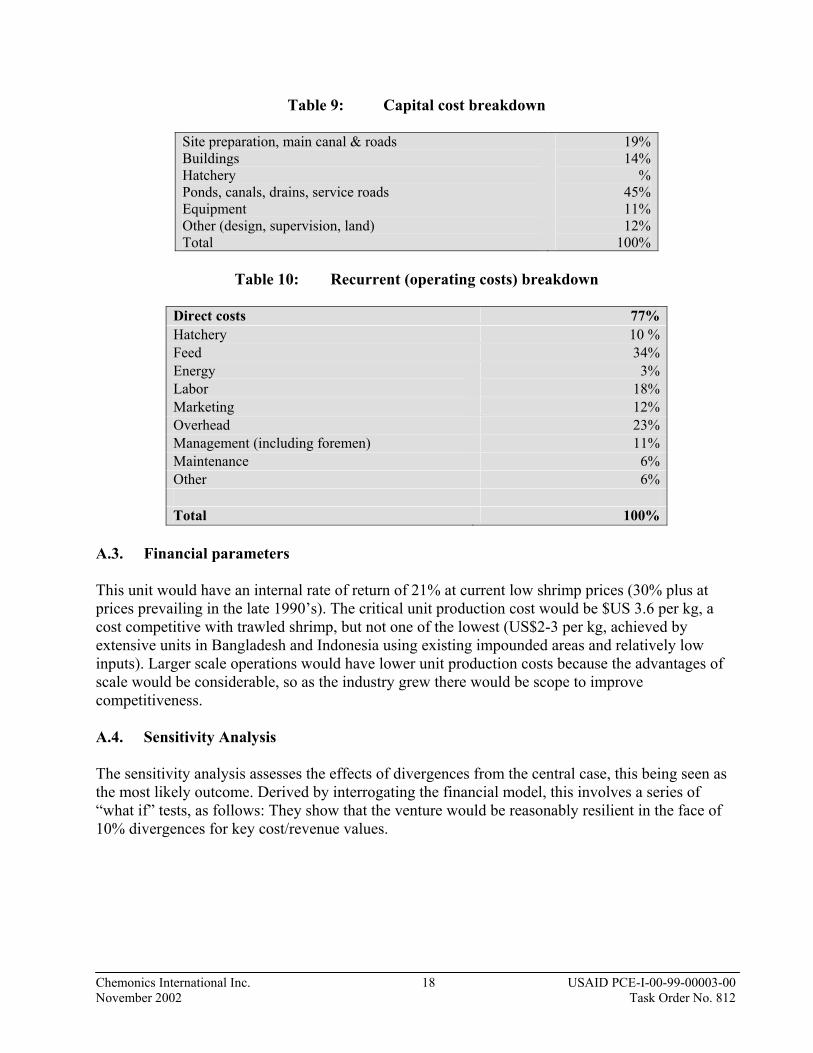
* the number or unit model farms constructed in each scaling up phase At the end of the 10-year period, an industry producing 38,000 tons of tiger shrimp annually worth $208million as an export is envisaged. This would require 28,000 hectares of ponds in 38,000 hectares (380 sq km). This is small proportion (5%) of the 740,000 of maritime swamps of the Niger Delta, but this is probably misleading, as the bulk of these swamps are unsuitable. A detailed survey that establishes the extent of genuinely suitable land is clearly a priority. A.2. Capital & Operating Costs The model farm would have a construction cost of $US 4.7million, including the hatchery and a processing facility. Contracting the latter unit out would reduce costs, but not by a large measure. Doing so could usefully reduce exposure for a pilot unit at the pioneering stage, and hiring one of the shrimp trawlers being abandoned as the fishery consolidates as a floating processing facility has been considered. The break down of costs is given below.
Chemonics International Inc. 18 USAID PCE-I-00-99-00003-00 November 2002 Task Order No. 812
Table 9: Capital cost breakdown
Site preparation, main canal & roads Buildings Hatchery Ponds, canals, drains, service roads Equipment Other (design, supervision, land) Total
19% 14%
% 45% 11% 12%
100%
Table 10: Recurrent (operating costs) breakdown
Direct costs 77%Hatchery 10 %Feed 34%Energy 3%Labor 18%Marketing 12%Overhead 23%Management (including foremen) 11%Maintenance 6%Other 6% Total 100%
A.3. Financial parameters This unit would have an internal rate of return of 21% at current low shrimp prices (30% plus at prices prevailing in the late 1990’s). The critical unit production cost would be $US 3.6 per kg, a cost competitive with trawled shrimp, but not one of the lowest (US$2-3 per kg, achieved by extensive units in Bangladesh and Indonesia using existing impounded areas and relatively low inputs). Larger scale operations would have lower unit production costs because the advantages of scale would be considerable, so as the industry grew there would be scope to improve competitiveness. A.4. Sensitivity Analysis The sensitivity analysis assesses the effects of divergences from the central case, this being seen as the most likely outcome. Derived by interrogating the financial model, this involves a series of “what if” tests, as follows: They show that the venture would be reasonably resilient in the face of 10% divergences for key cost/revenue values.
Chemonics International Inc. 19 USAID PCE-I-00-99-00003-00 November 2002 Task Order No. 812
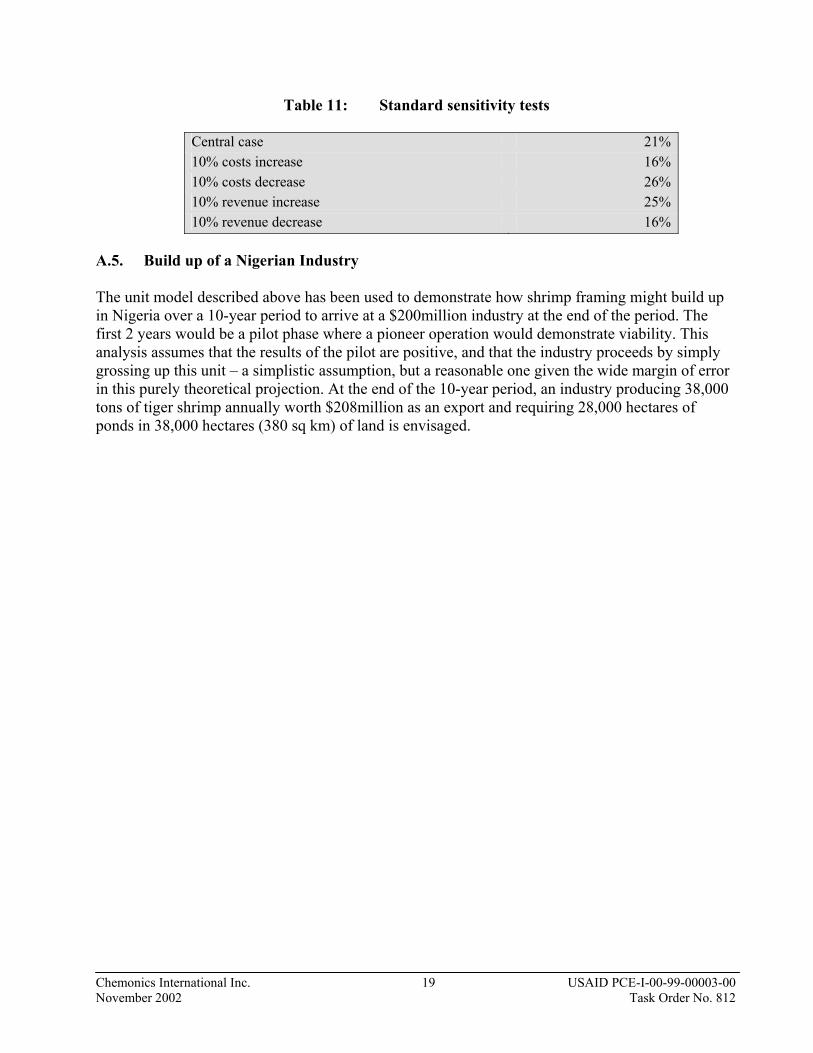
Table 11: Standard sensitivity tests
Central case 21%10% costs increase 16%10% costs decrease 26%10% revenue increase 25%10% revenue decrease 16%
A.5. Build up of a Nigerian Industry The unit model described above has been used to demonstrate how shrimp framing might build up in Nigeria over a 10-year period to arrive at a $200million industry at the end of the period. The first 2 years would be a pilot phase where a pioneer operation would demonstrate viability. This analysis assumes that the results of the pilot are positive, and that the industry proceeds by simply grossing up this unit – a simplistic assumption, but a reasonable one given the wide margin of error in this purely theoretical projection. At the end of the 10-year period, an industry producing 38,000 tons of tiger shrimp annually worth $208million as an export and requiring 28,000 hectares of ponds in 38,000 hectares (380 sq km) of land is envisaged.
Chemonics International Inc. 20 USAID PCE-I-00-99-00003-00 November 2002 Task Order No. 812
Annex II: FRESHWATER PRAWN FARMING: ENHANCING RURAL LIVELIHOODS
A. Operational Models
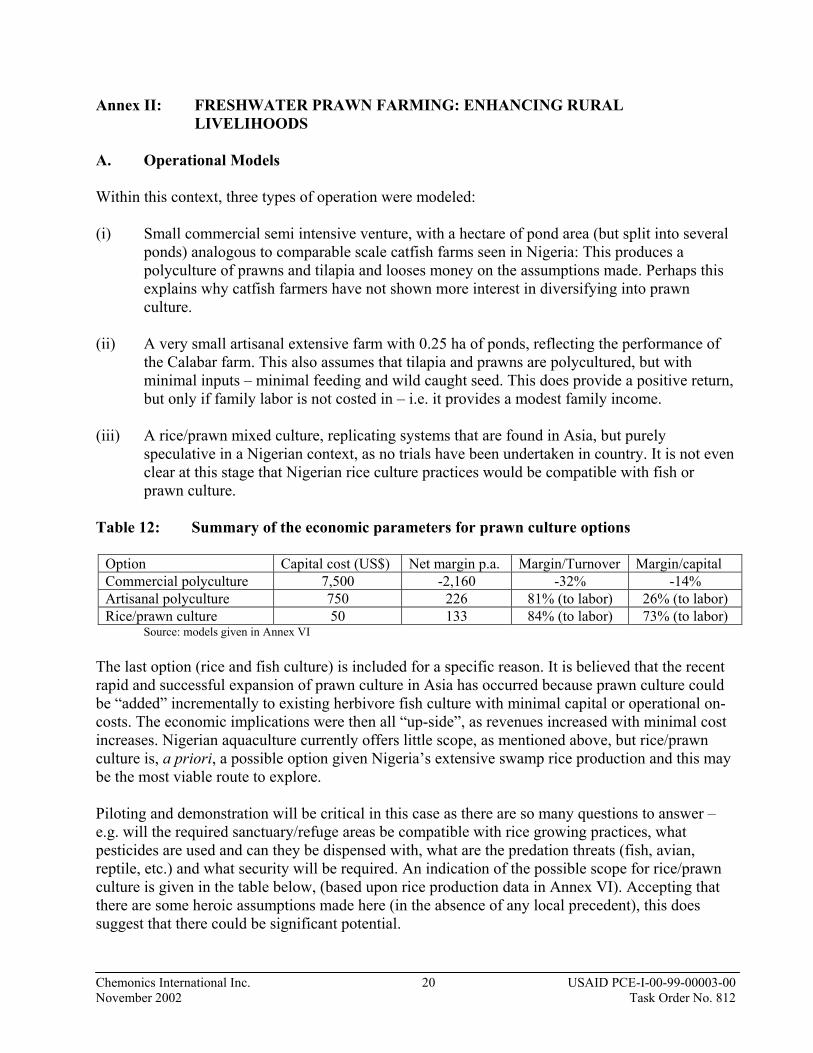
Within this context, three types of operation were modeled: (i) Small commercial semi intensive venture, with a hectare of pond area (but split into several
ponds) analogous to comparable scale catfish farms seen in Nigeria: This produces a polyculture of prawns and tilapia and looses money on the assumptions made. Perhaps this explains why catfish farmers have not shown more interest in diversifying into prawn culture.
(ii) A very small artisanal extensive farm with 0.25 ha of ponds, reflecting the performance of
the Calabar farm. This also assumes that tilapia and prawns are polycultured, but with minimal inputs – minimal feeding and wild caught seed. This does provide a positive return, but only if family labor is not costed in – i.e. it provides a modest family income.
(iii) A rice/prawn mixed culture, replicating systems that are found in Asia, but purely
speculative in a Nigerian context, as no trials have been undertaken in country. It is not even clear at this stage that Nigerian rice culture practices would be compatible with fish or prawn culture.
Table 12: Summary of the economic parameters for prawn culture options
Option Capital cost (US$) Net margin p.a. Margin/Turnover Margin/capital Commercial polyculture 7,500 -2,160 -32% -14% Artisanal polyculture 750 226 81% (to labor) 26% (to labor) Rice/prawn culture 50 133 84% (to labor) 73% (to labor)
Source: models given in Annex VI The last option (rice and fish culture) is included for a specific reason. It is believed that the recent rapid and successful expansion of prawn culture in Asia has occurred because prawn culture could be “added” incrementally to existing herbivore fish culture with minimal capital or operational on-costs. The economic implications were then all “up-side”, as revenues increased with minimal cost increases. Nigerian aquaculture currently offers little scope, as mentioned above, but rice/prawn culture is, a priori, a possible option given Nigeria’s extensive swamp rice production and this may be the most viable route to explore. Piloting and demonstration will be critical in this case as there are so many questions to answer – e.g. will the required sanctuary/refuge areas be compatible with rice growing practices, what pesticides are used and can they be dispensed with, what are the predation threats (fish, avian, reptile, etc.) and what security will be required. An indication of the possible scope for rice/prawn culture is given in the table below, (based upon rice production data in Annex VI). Accepting that there are some heroic assumptions made here (in the absence of any local precedent), this does suggest that there could be significant potential.

Chemonics International Inc. 21 USAID PCE-I-00-99-00003-00 November 2002 Task Order No. 812
Table 13: Rice production in Nigeria and implied prawn culture potential
State Rice production*
Tons
Rice cultivated area Hectares
Prawn production potential ** Tons
Prawn production value*** $US
Kaduna 603,000 240,000 1,200 3,000,000Niger 596,000 240,000 1,200 3,000,000Benue 285,000 114,000 600 1,500,000Taraba 240,000 96,000 500 1,250,000Other 1,574,000 630,000 3,150 7,875,000Total 3,298,000 1,320,000 6,600 16,500,000
* Source FMA (R&D) via FMA PCU ** Assuming only 5% of paddy is used for prawn farming to yield 100kg/ha/yr live prawn *** Valuing prawns @ $US 2.5/kg sold directly on rural markets
This analysis then (i) makes a strong case for avoiding even relatively small commercial scale prawn culture, while (ii) suggesting that there are artisanal pond culture options that could boost rural incomes modestly, and (iii) it may be that the real potential lies in rice/prawn culture using existing paddy fields, provided that there is compatibility. However, although the potential looks substantial, so is the lack of critical information (husbandry compatibility, predator risk, pesticide use, etc). Further investigation is warranted (including literature searches of past Nigerian activities in this field).
Chemonics International Inc. 22 USAID PCE-I-00-99-00003-00 November 2002 Task Order No. 812
Annex III: RISKS AND ASSUMPTIONS A. Assumptions for Prawn Farming As discussed in Annex I, prawn farming is a totally different prospect to brackish water shrimp culture – different in scale, in market targeting and in the segment of the population it addresses. Although there has been research on the subject in Nigeria, and there is some artisanal production (e.g. the Calabar farm mentioned in the previous Annexes), most of the key questions remain unanswered. Consequently, again we resort to modeling to assess what the likely outcome would be – basing this on what we do know, coupled with reasonable assumptions reflecting experience with prawn species elsewhere. The outcome provides an indication of viability, and demonstrates which assumptions are critical and so need testing as a priority. Annex VI in the assessment report provides three models of different scales of village level prawn farm. The key assumptions made here are: • That either the hatchery problems of the local species (M vollenhovenii) will be resolved or the
widely farmed Asian species M rosenbergii will be successfully introduced. • That hatcheries will accordingly be set up able to sell postlarvae at reasonably low cost i.e.
comparable with international marine shrimp postlarvae costs at around $10 per 1000. • That polyculture of the sort successful in Asia cannot be adopted, as the main farmed Nigerian
species (catfish) is an aggressive predator. Less favored fish species such as tilapia or local cyprinids (Carps) would have to be involved.
• That yields of extensively cultured prawns based on wild postlarvae recruitment is exemplified
by the Calabar farm – i.e. 700kg per hectare B. Risk Analysis for Shrimp Farming An alternative way of assessing the viability of shrimp culture in Nigeria is to identify and gauge the principle risks. As the investment is so large, this would seem to be an essential exercise anyway. These are categorized as technical (specific to shrimp culture) and general relating to the broader political and economic environment in Nigeria. Discussed in turn, these are: B.1. Technical risks • Yield undershoot: the assumptions made in the model are modest, but if they still prove to be
over-optimistic, then performance would be much poorer and possibly jeopardize the venture. • Hatchery related: shortages of postlarvae have proven to be major constraint to development of
shrimp farming. Hatchery failures were usually the cause, although some shrimp culture industries relied upon wild caught postlarvae and suffered when recruitment was poor. The position in Nigeria will probably be hatchery dependent as wild recruitment of farmable species

Chemonics International Inc. 23 USAID PCE-I-00-99-00003-00 November 2002 Task Order No. 812
(e.g. P monodon) is questionable at present and the indigenous species (P notialis) has no farm pedigree. Development of effective hatcheries will clearly be critical for a Nigerian industry.
• Disease: by far the most damaging factor for shrimp farming during the past decade has been
disease. Viral diseases such as white spot disease (WSSV) and taura/redtail virus have almost completely destroyed industries in Taiwan, Thailand, China and latterly Ecuador. Shrimp have a rudimentary immune system and so cannot be vaccinated in the way fish can be. Prevention is then the only effective cure, and as a novitiate, Nigeria has an advantage – these diseases have yet to manifest themselves, as there is no shrimp culture. However, this potential problem serves to stress the benefits of avoiding importing exotics – and thus the advantage of having a known farmable species (P monodon) already within the local ecosystem. Importation of postlarvae at the early stages of development of the industry should be avoided if possible - this being the route though which some devastating viral diseases are believed to have been transmitted recently.
B.2. General risks • Country risk: the risk associated with working in any developing county, enhanced in Nigeria by
the country’s past economic and political turmoil. The current political situation in the Niger delta area with resistance to any external commercial initiatives makes this one of the key risk factors.
• “Agriculture” risk: agriculture is traditionally seen as risky by investors: weather, flood, disease
and the complex problems of managing living organisms making it hazardous. This is especially true for aquaculture, with the risks expressing themselves though disease, hatchery problems as mentioned above, and through the impact of droughts/floods on on-growing - all of which can be devastating.
• Market risk: sale price is, as is usual, the single most critical factor in determining viability - i.e.
a change in sale price has more impact upon profitability than anything else. However in this case, the market should be more stable than most because it is believed to be “buffered”. This in effect provides a self-adjusting mechanism that establishes a “floor price” at current levels, albeit over the mid rather than immediate term (i.e. short term price declines can still be expected). Thus, for a primary food product, the outlook for prices is probably better than most, with greater stability than in many cases. Monitoring whether this buffering is still effective in the face of greatly increased farm shrimp supplies will be a near term key priority.