INDUSTRIALIZATION IN 21ST CENTURY
20
INDUSTRIALIZATION IN 21 ST CENTURY: IMPLICATIONS FOR INDIA Dr. Rajiv Kumar* Ajay Kumar** *Senior Fellow, Centre for Policy Research (CPR) & Founder Director, Pahle India Foundation (PIF), New Delhi **Senior Research Associate, CPR 1 Conference on “New Approaches to Productive Development – State, Innovation, Sustainability and Industrial Policy”, 1 st August 2016, Mexico City, Mexico
Transcript of INDUSTRIALIZATION IN 21ST CENTURY

INDUSTRIALIZATION IN 21ST CENTURY: IMPLICATIONS FOR INDIA
Dr. Rajiv Kumar*
Ajay Kumar**
*Senior Fellow, Centre for Policy Research (CPR) &
Founder Director, Pahle India Foundation (PIF), New Delhi
**Senior Research Associate, CPR1
Conference on “New Approaches to Productive Development – State,
Innovation, Sustainability and Industrial Policy”,
1st August 2016, Mexico City, Mexico

Introduction (1)
GLOBAL MANUFACTURING : OUTPUT & EMPLOYMENT 2
12
14
16
18
20
22
24
197
0-7
4
197
5-7
9
198
0-8
4
198
5-8
9
199
0-9
4
199
5-9
9
200
0-0
4
200
5-0
9
201
0-1
3
Manufacturing Value Added Share in GDP
World Developed Developing
12
14
16
18
20
22
24
26
197
0-7
4
197
5-7
9
198
0-8
4
198
5-8
9
199
0-9
4
199
5-9
9
200
0-0
4
200
5-0
9
201
0-1
3
Manufacturing employment share in total
employment
World Developed Developing
Source: UNIDO database
Manufacturing shares in GDPs of world and
developed countries have been steadily declining
since 1970. In developing countries it has been
stable since 1990 around 20 percent.
Share of employment in manufacturing in total
employment, for developed and developing
countries, show opposite trends since 1970. The
share in developed countries declined by almost
12% point (25.6% in 1970 to 13.3% in 2013) whereas it
has increased from 12% to 14% for developing &
emerging industrialized economies (DEIEs).
A distinctive characteristic in manufacturing
employment has been the growing share of
informal employment, which has increased from
29% in 1970 to about 40% in 2010. This trend has
been more marked in DEIEs over last three
decades.

3
Source: UNIDO & data from WITS (World bank)
0%
10%
20%
30%
40%
50%
60%
70%
80%
90%
100%
196
2
196
4
196
6
196
8
197
0
197
2
197
4
197
6
197
8
198
0
198
2
198
4
198
6
198
8
199
0
199
2
199
4
199
6
199
8
200
0
200
2
200
4
200
6
200
8
201
0
201
2
201
4
Composition of World Exports, 1962-2014
Others
Manufactured
Products
Agricultural Materials
World manufacturing exports, shares by development group
1990 2000 2010 2014
Industrialized Economies 82% 79% 66% 64%
Developing &emerging industrialeconomies(DEIEs) 18% 21% 34% 36%
Asia - Pacific 9% 11% 22% 24%
Introduction (2)
GLOBAL MANUFACTURING : EXPORTS
Share of manufactured exports in total global exports
increased from around 60% in 1960-64 to about 79% in
1996-2000 but then has subsequently declined to 68% in
2011.
A changed characteristic within manufacturing global
exports has been the growing share of developing &
emerging industrialized economies (DEIEs), which has
increased from 18% in 1990 to 36% in 2014, mainly driven
by manufactured exports from Asia-Pacific.
The share of medium and high tech products within
manufactured exports of DEIEs have gone up 52 per
cent in 2014, from 29 percent in 1990. The share of
resource based and low tech exports in total
manufacturing exports has declined from 71% in 1990 to
48% in 2014.

Resource Use & Sustainability
• Trend towards a lighter GDP
• Carbon Constraints & higher Energy Costs
Lower use of natural resources
Technology
• Digitalization & Automation
• Offshoring & Reshoring
• Industry 4.0
Internet of Things (IoT), 3D printing,
big data analytics etc.
Greater demand for Skilled Workers
Demand
• Demographic Shifts & declining demand in OECD for manufactured products
• Growth in demand in Emerging Markets
4
At the beginning of 21st Century
DRIVERS OF GOBAL MANUFACTURING (1)

Global Manufacturing (2)
DEMAND 5
STRUCTURAL
The role of external demand has weakened due to
ageing and plateauing of consumption demand in
OECD economies.
Consumption demand in emerging economies is rising
but not yet fully compensating for decline in OECD
demand.
Some emerging trends for preference for ‘local produce’
in OECD economies. Calls for protectionism and rolling
back trade liberalisation deals.
Investment demand for manufactured goods in OECD
also not as strong.
CYCLICAL
Rising demand in DEIEs had sustained growth. Severely
affected by slowdown in China and crash in global
commodity prices
-2
-1
0
1
2
3
4
5
200
0
200
1
200
2
200
3
200
4
200
5
200
6
200
7
200
8
200
9
201
0
201
1
201
2
201
3
201
4
An
nu
al Pe
rce
nta
ge
Gro
wth
Ra
te
Decline in Household Final Consumption
in OECD
Source: OECD data base (www.stats.oecd.org)
0
20
40
60
80
100
120200
0
200
1
200
2
200
3
200
4
200
5
200
6
200
7
200
8
200
9
201
0
201
1
201
2
201
3
201
4
201
5
World Commodity Price Indices *
Raw Materials Metals & Minerals
*World Commodity Price Indices, Real 2005 US Dollar, Source: World Bank Commodity Price Data (The Pink Sheet)

Global Manufacturing (3):
TECHNOLOGY TRENDS
Sharp increase in use of digital and networking technologies and robotisation are making
manufacturing highly technology intensive.
Also skills required are changing. No more able to absorb unskilled labour being released from
agriculture.
Industry 4.0 incorporates and reflects all these features.
The imperative of achieving global competitiveness in an open, liberal and globalizing
economy implies that new manufacturing capacities even in emerging economies have to
incorporate cutting edge technologies. These are generally not in sync with employment
maximization.
The markedly rising share of intra-industry trade in manufacturing sector and emergence of
vast regional and global production networks, poses a challenge to the extant notions of
comparative advantage.
Disaggregation of production chains implies greater share of logistics related services in
manufacturing even in emerging economies.
6

Global Manufacturing (4):
RESOURCES USE & SUSTANIABILITY
The world economy today uses around 30% fewer
resources to produce one Euro or Dollar of GDP than
30 years ago* . This shows the trend towards lighter
GDP.
The manufacturing growth has been benefited by the
increase in resource efficiency. For instance, resource
efficiency has grown by 3.5 times over 1995-2011.
7
* Sustainable Europe Research Institute (SERI), Austria, 2009
Resource efficiency is measured as the ratio of value added globally at basic prices divided by the total input in manufacturing
in current prices. Source: UNIDO elaboration based on World Input-Output Database (Timmer and others 2015).
0
1
2
3
4
19
95
19
97
19
99
20
01
20
03
20
05
20
07
20
09
20
11
Ind
ex, 1995=
1
Resource efficiency in manufacturing,
1995–2011
Carbon constraints would make energy rationing, to adopt energy mixes, less usages fossil fuel sourcesfor electricity generation.
Economic costs for industrialization under carbon constraints are going to be challenging, especially for
developing & emerging industrialized economies.
Changes in demand structure due to rising incomes and the impact of global industrial competitiveness
push economies to specialize in medium- and high-tech activities and to increase the demand for
highly skilled workforce.
So, abundant skill workforce in a nation is increasing determinant of competitiveness of their
manufacturing sectors.

8
Globally, three major goals under sustainability areenergy efficiency, recycle and reuse , and wastereduction.
Eco-innovations can be incremental or radical anddisruptive. Example- Fast development of global solarphotovoltaic sector has lowered prices from around$4 in 2008 to $0.8 per watt in 2012. There is forecast todrop to $0.40 per watt by 2035. (IEA 2014b).
Production under Industry 4.0 framework is with theconcept of smart factories with emerging newtechnologies and energy efficiency. This leads tomore responsive and responsible manufacturing forsustainability.
Third Industrial Revolution- distributed production ofenergy, manufactured products and knowledge: willchange the economic and manufacturinglandscape
IEA- International Energy Agency
Global Manufacturing (5):
RESOURCES USE & SUSTANIABILITY

Manufacturing in India (1) :
CHALLENGES9
Sectoral Composition of GDP at factor cost, constant prices, 2004-05.
Source: Central Statistical Organisation (CSO), India
0%
20%
40%
60%
FY
195
1
FY
195
4
FY
195
7
FY
196
0
FY
196
3
FY
196
6
FY
196
9
FY
197
2
FY
197
5
FY
197
8
FY
198
1
FY
198
4
FY
198
7
FY
199
0
FY
199
3
FY
199
6
FY
199
9
FY
200
2
FY
200
5
FY
200
8
FY
201
1
FY
201
4
Sectoral Share in GDP,1951-2014, India
Industry
Manufacturing
The share of the manufacturing in GDP was around
9% in 1950, moved up to 15% in 1983-84 but has
since virtually stagnated**.
Industrial policy changes, reforms and trade
liberalization since 1980 and even those after the
1991 reforms, have made little or no difference to
the share of manufacturing in GDP in India !!
Clearly the fundamental or structural constraints
affecting the sector have not been addressed.
Major Constraints are :
• Difficult business environment;
• Rigidity and legacy issues related to labor;
• Extensive infrastructure deficit;
• High cost of capital ;
• Poor access to credit, technology and markets for
micro, small and medium enterprises (MSMEs).
** The share of manufacturing in GDP under new series data on the basis of Gross Value Added (GVA) at basic
price with base year 2011-12 is being reported at 18% for 2014-15. But,the adjusted data with long time series
are not available for past years.

Manufacturing in India (2) :
CHALLENGES10
*Source: Indian National database , CSO & DGCI&S for India
& world bank data base for world and China
India is perhaps one of the few emerging economieswhich has seen a decline in the share of manufacturedexports from around 81% in 1999-2000 to 67% in 2014-15.
This is on two accounts. One, The country cashed in onChina induced iron ore price boom during the late 90sand ‘noughties’. Two, Indian firms so far have failed toparticipate in regional or global production networks.
The share of non-petroleum (manufactured) exports intotal exports has declined from around 81% in 2000 toaround 50% in 2015.
Share of petroleum exports in total merchandise exportsincreased from less than 1% in 2000 to around 18% in2014.
However, an increase in share of manufacturingemployment though marginal from 10.9% in 1991to 12%in 2014 could imply that pessimism aboutmanufacturing’s job generating prospects may beoverstated.
Share (%) of Manufacturing in GDP, Total Employment and Exports
for World, China and India*
1991
World China India*
GDP 19 33 15.0
Total Employment 14.4 13.9 10.9
Exports
(Merchandise) 71 76 72
2014
GDP 15.8 31 15.2
Total Employment 11.5 11.7 12
Exports (Merchandise) 67.3 94 67

Structural issues–in the light of Global Competitiveness
• A marked dualism has come to characterize the Indianmanufacturing sector. This is reflected in the huge gap in terms ofproductivity, investments, output and the distribution ofemployment between the organized and unorganized sectors ofmanufacturing.
• Output share of unorganised or informal sector in Totalmanufacturing has declined from 70% in 1950s to 30 % in 2010s,
Employment share has increased from around less than 30% toabout 80% in 2014. India has the largest informal employment inmanufacturing globally.
• The preponderance of micro, small and medium sized units thatoperate in the unorganized sector could be a reason for India’sinability to engage in global production networks. This has alsobeen called the problem of the ‘missing middle’.
11
Manufacturing in India (3) :
PRINCIPAL CHARACTERISTICS

Manufacturing under UPA government
• United Progressive Alliance (UPA) (2004-2014), established the
National Manufacturing Competitiveness Council (NMCC) in 2004
and announced the New Manufacturing Policy (NMP) in 2011.
• One of major goal was to raise the share of manufacturing in GDP to
25% by 2022. The establishment of manufacturing facilities for
domestic and export led production, along with associated services
and infrastructure was envisioned with the creation of National
Manufacturing and Investment Zones (NMIZs).
• Manufacturing sector growth has averaged 6.6% over 2004-2014,
which is lower than aggregate economic growth (GDP growth) of
6.8% during the same period. As a result, the sector’s share has
marginally come down (15.2% in FY2004 to FY15% in 2014) despite the
government plans and policies!
12
Manufacturing in India (4) :
POLICY INITIATIVES SINCE 2000

Manufacturing
brought center
stage for economic
growth by the
present NDA
government
• National Democratic Alliance (NDA), government in office since May
2014, has focused on ‘Indian Manufacturing’. It has virtually adopted all
the goals envisioned under UPA’s NMP 2011.
• Major thrust for growth in manufacturing has been under ‘Make in India’program (MIIP). ‘Skill India’ ; ‘Digital India’ ; ‘Start up India’ and ‘SmartCities’ along with MIIP are of some of crucial programs of the centralgovernment that in collaboration with various state governments havethe potential to reinvigorate the manufacturing growth in India.
13
Manufacturing in India (5) :
POLICY INITIATIVES SINCE 2014

Government has adopted focused approach for 25 productive sectors in which eleven sectors are from manufacturing :
Manufacturing sectors are, 1. Auto Components; 2. Automobiles; 3. Biotechnology; 4. Chemicals; 5. Defence Manufacturing; 6. Electrical Machinery; 7. Electronic System Design and Manufacturing; 8. Food Processing; 9. Leather; 10. Pharmaceuticals and 11. Textiles & Garments.
Focussing on ease of doing business and improving business environment. Example- Self certification, third party inspection provision, single window clearances, combing 18 application forms into one, applications for Industrial License are accepted online (24X7) etc.
Better inter-government coordination and government trying to become a more proactive partner
State governments now on board for being ranked on ‘ease of doing business’. World bank has helped to develop a 98 point evaluation criteria for assessing ‘ease of doing business environment’. First ranking was announced in September 2015 and expected annually.
Work in progress on simplifying labour laws
Action plans and focus on upgradation of industrial infrastructure
Further liberalization in FDI in sectors like Defence – 49 % can go up to 100 % in case of modernization and state of art technology, 100% FDI under automatic route permitted in Brownfield Airport projects; 100% FDI under automatic route permitted in construction, operation and maintenance in specified Rail Infrastructure projects ; 74% FDI under automatic route permitted in brownfield pharmaceuticals. FDI beyond 74% will be allowed through government approval route etc.
14
Manufacturing in India (6) :
POLICY INITIATIVES UNDER ‘MAKE IN INDIA’

15
Manufacturing in India (8) :
SECTORAL INITIATIVES – TEXTILES & APPAREL
Rigid labour rules, among others, caused Indian apparelexports to grow at a much slower rate. This resulted inBangladesh exceeded India in apparel exports in 2003and Vietnam in 2011. Apparel exports, the most labourintensive product, are flat around US$17 billion in last twoyears (2014 & 2015) from India.
Therefore, a slew of measures needed, which stands aslabour friendly and would promote employmentgeneration, economies of scale and boost exports.
New Textiles & Apparel policy of 2016 is with production &employment (generation) incentives and labour reform(an important step that can potentially be replicated inother industries, for instance, automobiles).
16
Manufacturing in India (9) :
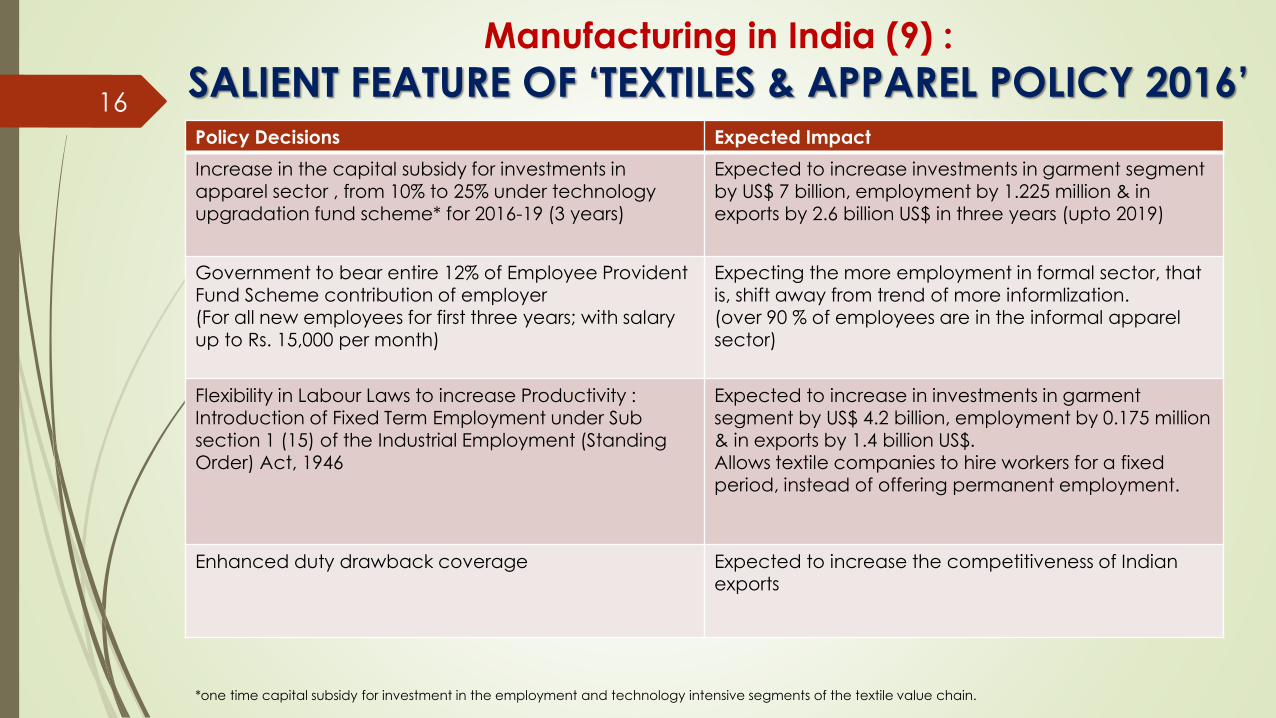
SALIENT FEATURE OF ‘TEXTILES & APPAREL POLICY 2016’Policy Decisions Expected Impact
Increase in the capital subsidy for investments in apparel sector , from 10% to 25% under technology upgradation fund scheme* for 2016-19 (3 years)
Expected to increase investments in garment segmentby US$ 7 billion, employment by 1.225 million & in exports by 2.6 billion US$ in three years (upto 2019)
Government to bear entire 12% of Employee Provident Fund Scheme contribution of employer (For all new employees for first three years; with salary up to Rs. 15,000 per month)
Expecting the more employment in formal sector, that is, shift away from trend of more informlization. (over 90 % of employees are in the informal apparel sector)
Flexibility in Labour Laws to increase Productivity :Introduction of Fixed Term Employment under Sub section 1 (15) of the Industrial Employment (Standing Order) Act, 1946
Expected to increase in investments in garment segment by US$ 4.2 billion, employment by 0.175 million & in exports by 1.4 billion US$. Allows textile companies to hire workers for a fixed period, instead of offering permanent employment.
Enhanced duty drawback coverage Expected to increase the competitiveness of Indian exports
*one time capital subsidy for investment in the employment and technology intensive segments of the textile value chain.

Some of major issues affecting the capital goods production in India are:
• Technology depth: Significant challenges and gaps exist in high-end, heavy-duty, high-productivity
and high precision technologies across sub-sectors.
• Cost competitiveness: Indian manufacturers are still challenged with respect to cost competitiveness
compared to their global peers due to a skewed and state-wise variation in tax and duty structure and
high infrastructure and logistics cost.
Some of significant Policy Measures under National Capital Goods Policy 2016 are :
• Strengthen existing capital goods scheme: The policy recommends increasing the budgetary
allocation & scope of the present 'Scheme on Enhancement of Competitiveness of Capital Goods‘
which include setting up of Centers of Excellence, Common Engineering Facility Centers, Integrated
Industrial Infrastructure Park and Technology Acquisition Fund Program.
• To launch a Technology Development Fund under the PPP model to fund technology acquisition,
transfer of technology, purchase of IPRs, designs & drawings as well as for commercialization of such
technologies of capital goods.
17
Manufacturing in India (10) :
SECTORAL INITIATIVES –National Capital Goods Policy

18
Zero Defect, Zero Effect
“Let’s think about making our product which has ‘zerodefect; so that it does not come back (get rejected)from the world market and ‘zero effect’ so that themanufacturing does not have an adverse effect on ourenvironment” said the prime minister of India, Mr Modi,while delivering his maiden Independence Day speechin 2014.
Resource efficiency in India is still lower than China,Mexico, Japan, Germany (see chart A). However,rate of improvement between 1995 to 2011 has beenbetter in India (10.1%)** in comparisons to China(8.1%), Germany (8.4%) and Japan (9.1%). The rate ofimprovement in resource efficiency of Mexcio was10.8% over 1995-2011.
India adheres the target of 20-25% reduction inemissions per unit of GDP (excluding agriculturesector) from 2005 level by 2020 as pledged targetsunder the UNFCCC [1].
0
1
2
3
China Germany India Japan Mexico
Ind
ex,
19
95
=1
Chart-A.
Changes in resource efficiency,
selected countries, 1995 and 20111995
2011
1. United Nations Framework Convention on Climate Change 2011. **CAGR- Compound Annual Growth Rate
Source: UNIDO elaboration based on World Input-Output
Database (Timmer and others 2015).
Manufacturing in India (11) :
SUSTAINABILITY & RESOURCE EFFICIENCY

Way Forward
Global manufacturing output share in world GDP is declining.
The employment intensity also declining with productivity , efficiency and technology improvements,
with present trend of lighter GDP.
These present a rather difficult external environment for India to expand its manufacturing output.
The imperative of achieving global competitiveness in an open, liberal and globalizing economy
implies that new manufacturing capacities in India have to incorporate cutting edge technologies,
which may not be employment intensive.
Government will therefore have to work closely together with private industry to identify niches within
manufacturing where labour intensive capacities can be expanded. This will require focused, in-depth
and trust based collaboration between the Government and private business. This may be difficult.
Special policy attention will have to be focused on development of MSMEs. These have hitherto
received a lot of rhetoric but not real attention to release their binding constraints.
Physical infrastructure deficit along with skills deficit has to be overcome urgently
Rules and procedures for FDI may have to be further liberalized for India to effectively become
participate in regional and global production networks and encourage intra-industry trade.
19