Industrialization and Economic Development Mini-Unit AP HUG.
67
Industrialization and Economic Development Mini-Unit AP HUG
-
Upload
colleen-kennedy -
Category
Documents
-
view
221 -
download
2
Transcript of Industrialization and Economic Development Mini-Unit AP HUG.

Industrialization and Economic Development Mini-Unit
AP HUG

Part 1: Classifying Development

Classifying Development
• Read through the ways to classify development.
• What do you think is the most major difference between Developed and Developing?
• Why do you think this?

What is Development?
The act of improving/advancing the quality of life (standard of living) of people.

What is sustainable development?
• Sustainable development –is development that meets the needs of the present without compromising the ability of future generations to meet their own needs.

“Rich Countries” “Poor Countries”
Developed Undeveloped
More Developed Less Developed
Developed Developing
First World (capitalist) Third World
“The North” “The South”
MEDC’s LEDC’s
Time

LEDCs/LDCs
Less economically developed countries (LEDCs) or Less Developed Countries (LDCs) these are the poorest of the developing countries.
They have major economic, institutional and human resource problems.
In 2009, 49 countries were labeled as LEDCs/LDCs many are in Sub-Saharan Africa
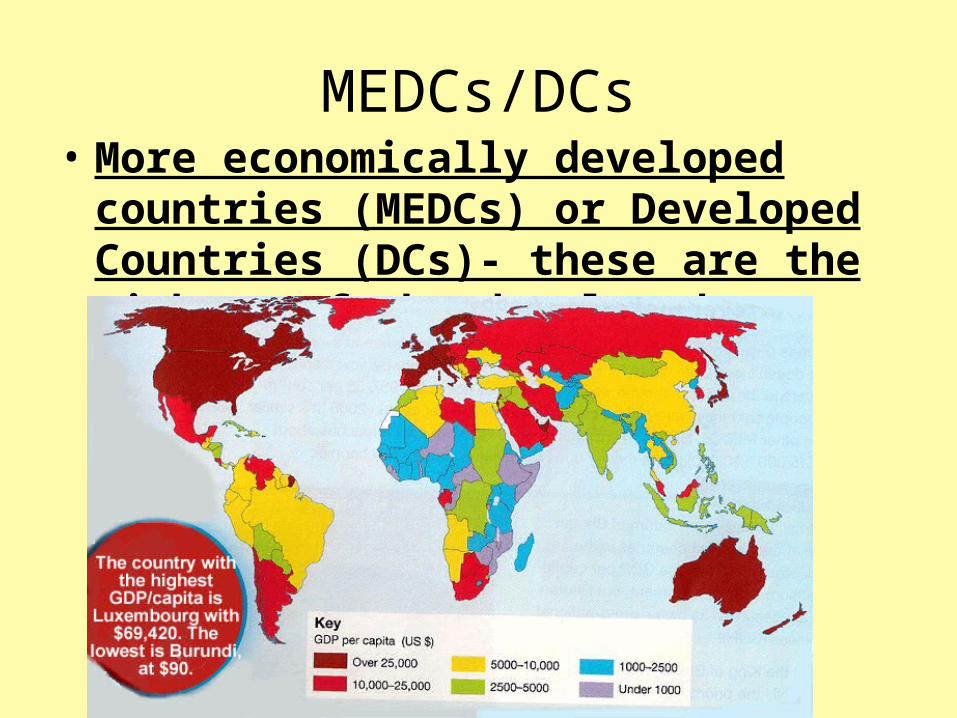
MEDCs/DCs• More economically developed countries
(MEDCs) or Developed Countries (DCs)- these are the richest of the developed countries.

The World of Haves and Have-Nots: UN Human Development Report
• The richest 20% of the world's people consumes 86% of all goods and services
• the poorest 20% consumes just 1.3%

The World of Haves and Have-Nots: UN Human Development Report
• the richest 20% consumes:– 45% of all meat and fish– 58% of all energy used and – 84% of all paper– has 74% of all telephone lines and– owns 87% of all vehicles

Haves• Americans spend $8 billion a year on
cosmetics -- $2 billion more than the estimated annual total needed to provide basic education for everyone in the world

Have-nots• Of 4.5 billion people in developing countries:
– nearly 60% lack access to safe sewers– 1/3 have no access to clean water– 1/4 do not have adequate housing and– 20% have no access to modern health services of
any kind

Measuring Economic Development
All these are indicators of income
Gross Domestic ProductGDP – total value of goods and services produced in a country (US$)
Gross National ProductGNP – GDP that also Includes income from investments abroad (US$)
GDP/GNP per capitaTotal value divided by the total population (per person)

National Income – Problems with using GDP/GNP
• Some economic activity not recorded – subsistence farming and barter activity, for example
• Some economic activity is carried out illegally – building work ‘cash in hand’, drug dealing, etc.
• Work of the non-paid may not be considered but may contribute to welfare – charity work, housework, etc.
• A small proportion of the population can own a large amount of the wealth in a country.
https://www.youtube.com/watch?v=QPKKQnijnsM
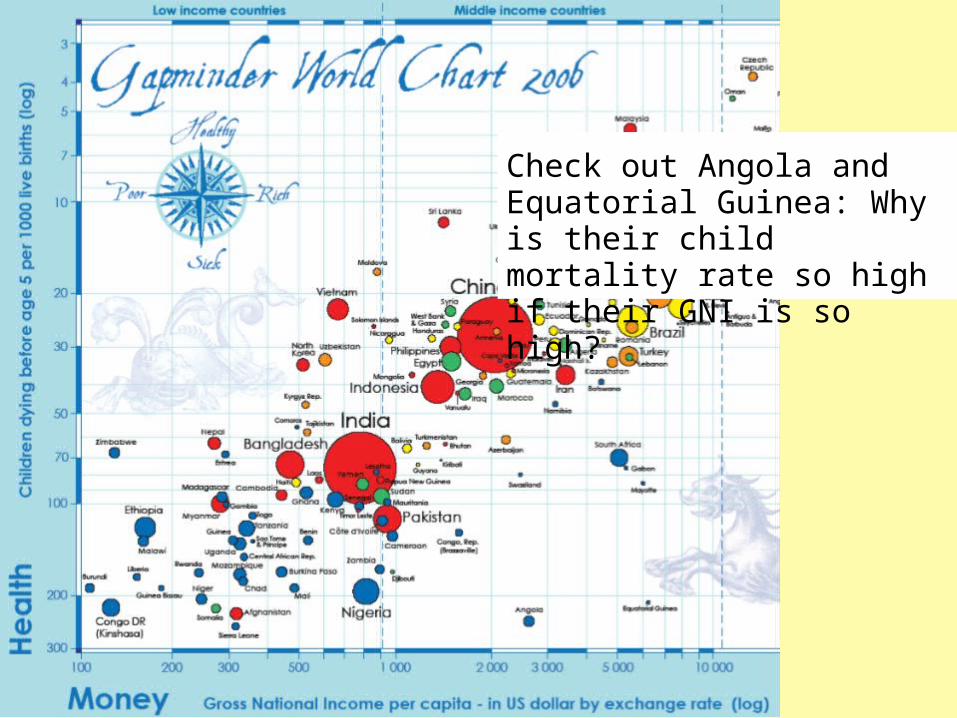
Check out Angola and Equatorial Guinea: Why is their child mortality rate so high if their GNI is so high?

Part 2 Development Diamonds

Development Diamonds
Development Diamonds illustrate relationships for 4 socio-economic indicators relative to averages of the countries in the same income group

Strengths of using the Development Diamond as a method of
showing level of development
• Development diamonds make it possible to assess a country’s achievements in both economic development and human development
• You can compare countries and their development using 4 indicators, not just 1
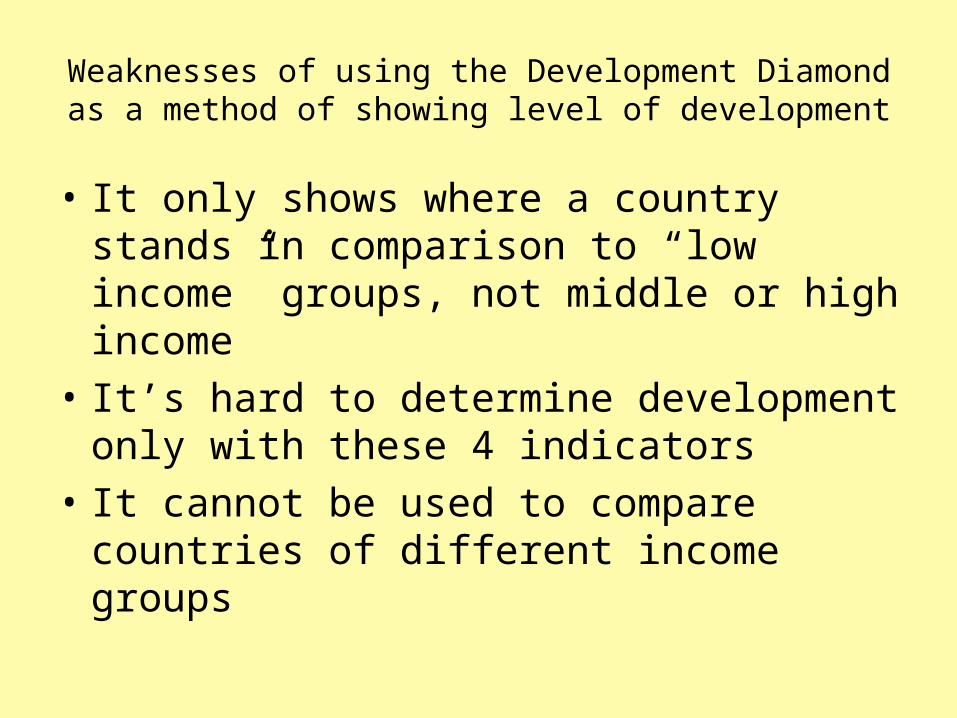
Weaknesses of using the Development Diamond as a method of showing level of development
• It only shows where a country stands in comparison to “low income” groups, not middle or high income
• It’s hard to determine development only with these 4 indicators
• It cannot be used to compare countries of different income groups

Development Diamond Activity


1. Which of the two “low-income” countries is most developed? Justify your answer with the data.
• Let’s “Unpack” this Question. What do you have to do to correctly answer this question?
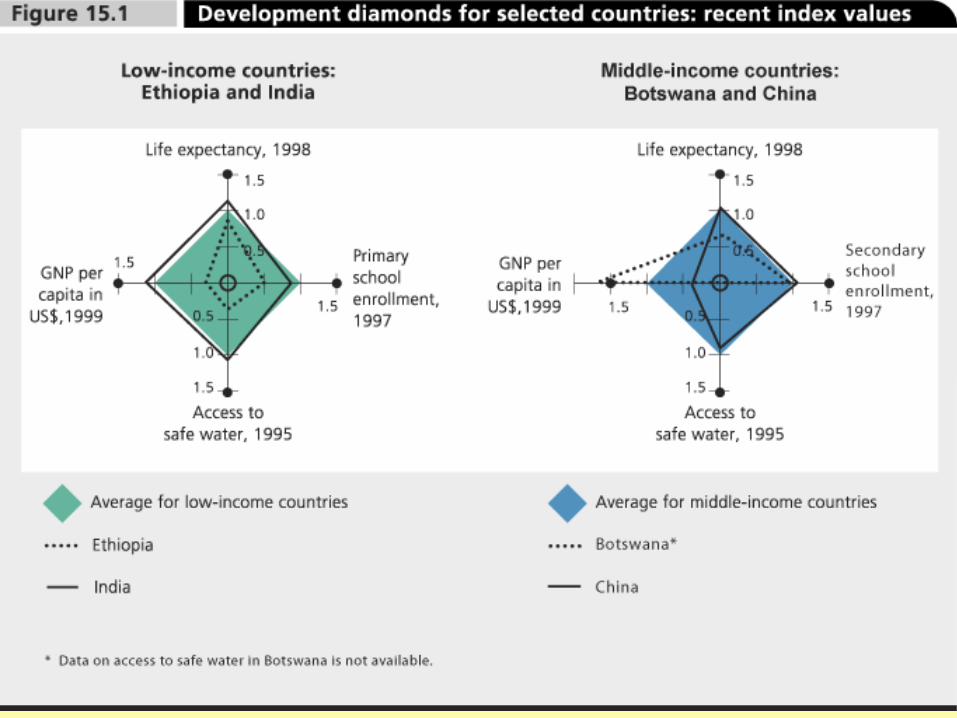

2. How does Ethiopia and India compare to the average for low-income countries?
• Let’s “unpack” this question. • To effectively answer this question, what do
you have to do?


3. Which of the two “middle-income” countries is most developed? Justify your answer with the data.
• Let’s use what we learned in Question 1, to answer this question.


4. How does Botswana and China compare to the average for middle-income countries?
• Let’s use what we learned in Question 2 to answer this question.

1.4 billion people struggle to survive on less than $1.25 a day (World Bank 2005). How can they be helped?
• The Goals were agreed to in 2001• The Goals were devised by the UN in 2000 and
adopted by nations in 2001• The idea of course is to create a better world• Many nations are already falling short• But there are success stories
Purpose


Part 3: Classifying Economic Activities

Levels of Economic ActivityPrimary (1st) Economic ActivitiesDefinition: extraction of natural resourcesExamples: farming, mining, forestry
Tertiary (3rd) Economic ActivitiesDefinition: Provision of services Examples: Retail, restaurants, tourism, police and fire provision, sanitation, advertising
Quinary (5th) Economic ActivitiesDefinition: highest level decision makingExamples: top-level government officials, business executives, financial consultants

Part 4: The Theories Used to Explain the Global Development Gap


Rostow - Stages of Growth1. Traditional Society• Characterised by
– subsistence economy – output not traded or recorded
– existence of barter – high levels of agriculture
and labour intensive agriculture
Village in Lesotho. 86% of the resident workforce in Lesotho is engaged in subsistence agriculture.
Copyright: Tracy Wade, http://www.sxc.hu/

Rostow - Stages of Growth
2. Transitional Stage– Development of
mining industries– Increase in capital use
in agriculture– Necessity of external
funding– Some growth in
savings and investmentThe use of some capital equipment can help increase productivity and generate small surpluses which can be traded.
Copyright: Tim & Annette, http://www.sxc.hu

Rostow - Stages of Growth3. Take off:
– Increasing industrialization
– Further growth in savings and investment
– Some regional growth– Number employed in
agriculture declines
At this stage, industrial growth may be linked to primary industries. The level of technology required will be low.
Copyright: Ramon Venne, http://www.sxc.hu
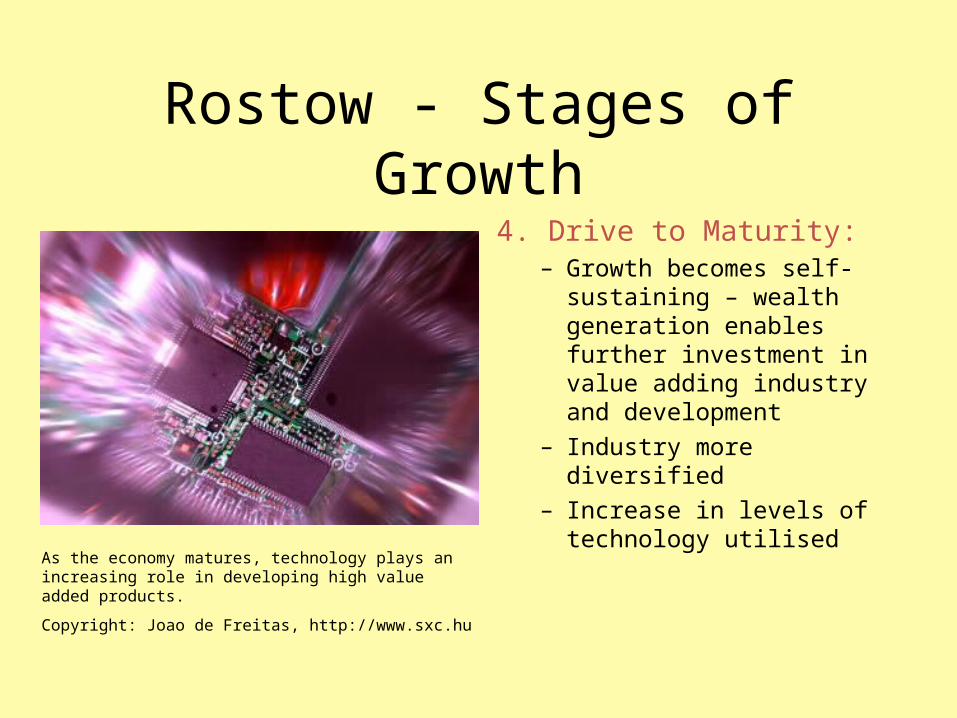
Rostow - Stages of Growth4. Drive to Maturity:
– Growth becomes self-sustaining – wealth generation enables further investment in value adding industry and development
– Industry more diversified– Increase in levels of
technology utilised
As the economy matures, technology plays an increasing role in developing high value added products.
Copyright: Joao de Freitas, http://www.sxc.hu

Rostow - Stages of Growth
5. High mass consumption– High output levels– Mass consumption of
consumer durables– High proportion of
employment in service sector
Service industry dominates the economy – banking, insurance, finance, marketing, entertainment, leisure and so on.
Copyright: Elliott Tompkins, http://www.sxc.hu

Assumptions Made by Rostow’s Model
• all countries have similar development trajectories
• intrinsic factors like culture and natural resources don’t impact development
• countries that undergo development at different times in history will undergo the same processes
• all countries have the same access to development
• the goal and purpose of all economies is to increase productivity and material consumption.

Developmentalism
• The notion that every country and region will eventually make economic progress toward a high level of mass consumption if they only compete to the best of their ability within the world economy.
• Rostow’s Model keeps this myth alive.

Limitations of Rostow’s Model
• The weakness is that it’s not fair to compare today’s poorer countries to those that were the first to take off. Those that took off first didn’t have to compete in a global market.
• it is difficult to say whether all countries will eventually conform to Rostow’s Model.
• It is unlikely that Rostow’s model will be universally applicable.
Dependency Theory
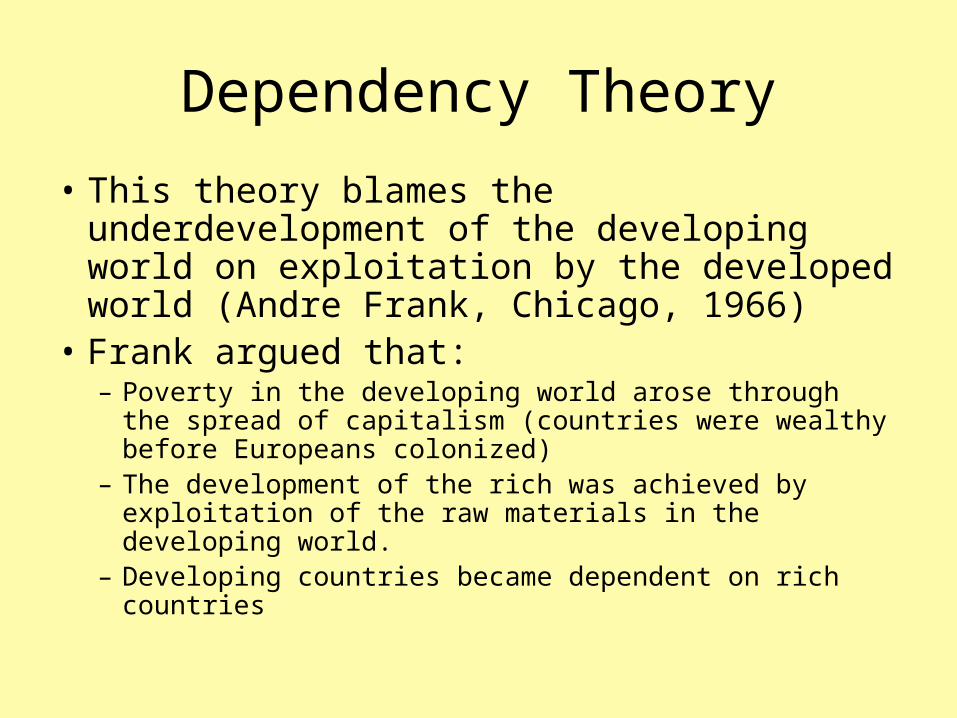
• This theory blames the underdevelopment of the developing world on exploitation by the developed world (Andre Frank, Chicago, 1966)
• Frank argued that: – Poverty in the developing world arose through the spread
of capitalism (countries were wealthy before Europeans colonized)
– The development of the rich was achieved by exploitation of the raw materials in the developing world.
– Developing countries became dependent on rich countries

Neocolonialism
• the geopolitical practice of using capitalism, business globalization, and cultural imperialism to influence a country, instead of direct military or political control.

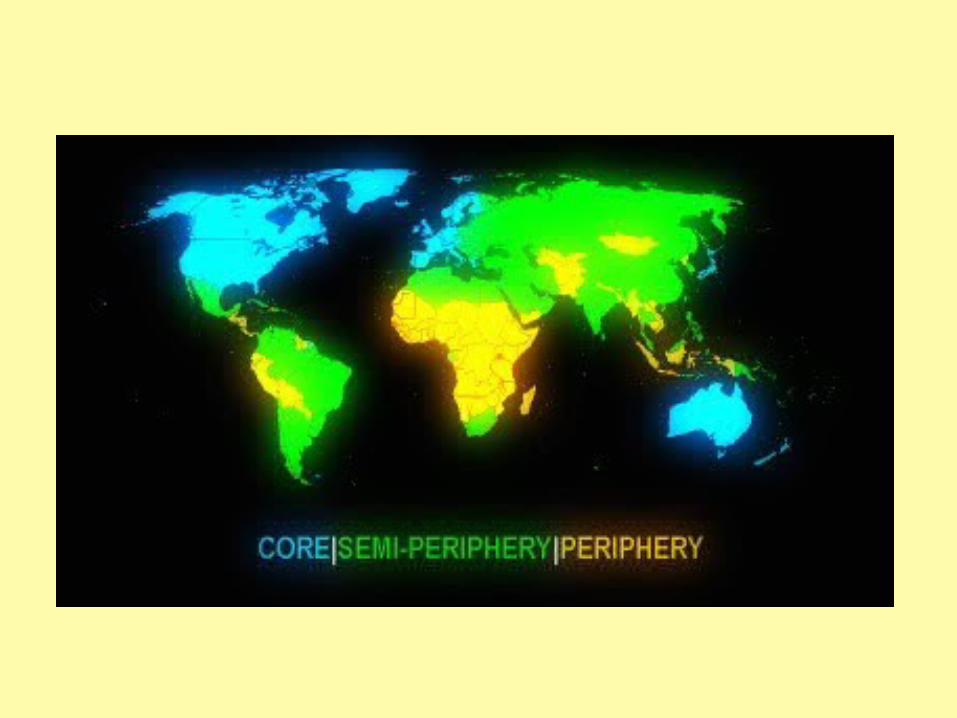
World Systems (core/periphery) theory
• This theory is based on the history of the capitalist world economy. Countries fall into three economic levels, and can move from one level to another if their contribution to the world economy changes.
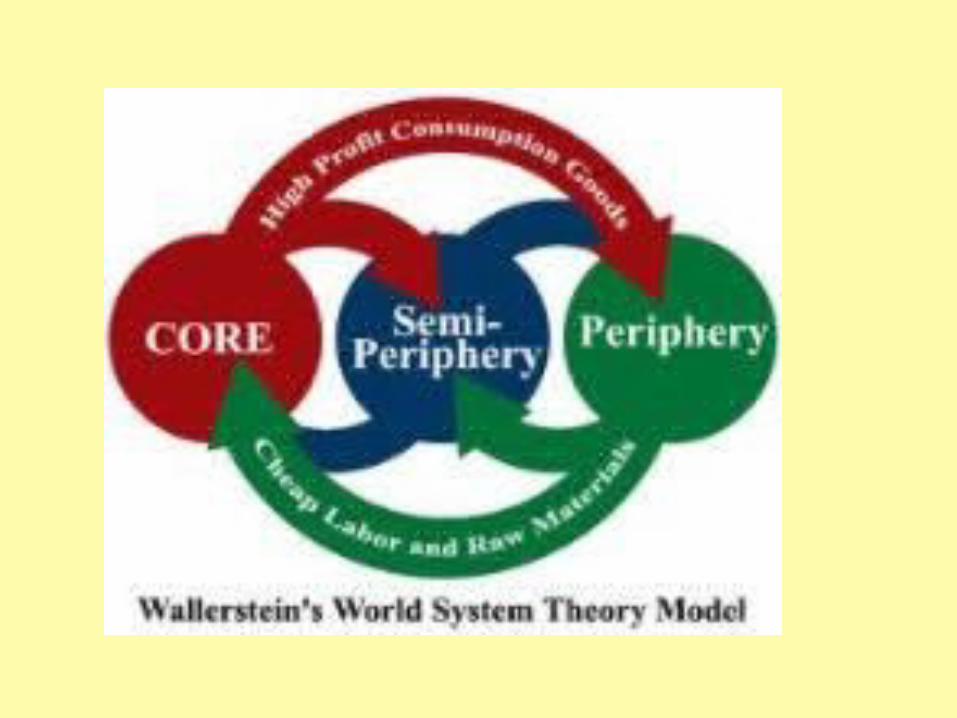

The CORE
North America Western Europe East Asia
Main trade flows are between these three areas. Countries in this core have diversified economies, with high output, high purchasing power and large domestic markets. These are the manufacturers.
SEMI PERIPHERY
A wide range of countries. First waves of NICs – South Korea, Taiwan, Hong Kong, Singapore
2nd Waves: Malaysia, Mexico, South Africa BRICs – Brazil, Russia, India, China.
THE PERIPHERY
LEDCs. Mainly Africa.
Small domestic markets, lack of infrastructure, population increase, low economic output, low levels of economic diversification, high agricultural population.
Outside this core, the global periphery is a location of cheap raw materials or cheap manufacturing or a market for the core to “dump” their surplus products.
Raw material Producers

Part 5: Growth and Diffusion of Industrialization
Industrial Revolution
• Began in the late 1700s in England and led to the huge growth of the world population for the next two centuries as industrialization diffused outwards.

The Industrial RevolutionB. Why did it begin in the Great
Britain?– capitalist system
• people free to form businesses• education • patent system encouraged
development– labor:
• Jethro Tull’s seed drill (1701) and other developments > improved productivity in farming > people can leave farms and work elsewhere

The Industrial Revolution (cont)B. Why did it begin in the Great
Britain? 3. raw materials (iron ore, coal)4. rivers, canals, harbors (ease
in trade)5. small, compact size (iron and
coal near rivers and harbors)6. existing banking system
(borrow $ to buy machinery)7. stable political system8. colonies (guaranteed
markets, additional raw materials)

The Industrial Revolution (cont)C.Key developments
– James Watt patents the steam engine (1769)
• wood replaces running water as source of energy
• changes location of machinery
– was located by running water (streams, rivers)
– now can be located wherever wood exists (more flexibility)

The Industrial Revolution (cont)D. Effects
– economic: more goods at lower prices
– social: available labor leaves farms and clusters in cities
– political: surplus labor > mistreated workers > liberalism and communism

The Industrial Revolution (cont)D. Effects
4. technological: > railroad, steamship
5. agricultural: > 2d Agricultural Revolution
• increased productivity
• use of machinery > larger farms > enclosures

Globalization
• Globalization refers to how the world is increasingly inter-connected.
• It is most closely associated with the transnational activities of huge corporations, which operate sometimes in alliance with and sometimes against states.

Fordism
• The process of using assembly line techniques in manufacturing and is attributed to Henry Ford

Commodity Chain
• A chain of activities from the manufacturing to the distribution of a product.
• Example: The clothing Industry – Growing of cotton – Textile mills to create cloth– Garment factories where stiching occurs – Firms for design– Retailing and selling to the consumer

Transnational Corporations • Companies that have
facilities and processes spread among several countries.
• Found at the high-profit end of the commodity chain and specialize in brand names, high technology and design and marketing.

Theory of Comparative Advantage
– countries should specialize in producing those goods of which they are relatively more efficient producers
• these countries should then trade with the rest of the world to obtain needed commodities
– if countries do specialize this way, total world production will be greater

Outsourcing
• The practice of shifting production of a product to a third party either in the country in which you are based or in an other country.
• (part of comparative advantage)
• Taking advantage of less expensive labor
Maquiladoras
• Foreign-owned assembly companies located in the United States/Mexico border region.
• These companies are able to take advantage of cheaper labor, tax breaks, lax environmental regulations while operating close the the markets for the products.


Review for Mini Quiz (Friday)
• 15 multiple Choice • 1 FRQ
– FRQ is connected to Rostow’s Model. It is important to know:
• Each stage of the model (name and description) • The limitations of the model • Assumptions made by the model