Industrial Site Spill Modeling
16
Schade, T., C. Jorge Schwarz and D. Kaufmann. 2010. "Industrial Site Spill Modeling." Journal of Water Management Modeling R236-19. doi: 10.14796/JWMM.R236-19. © CHI 2010 www.chijournal.org ISSN: 2292-6062 (Formerly in Dynamic Modeling of Urban Water Systems. ISBN: 978-0-9808853-3-0) 303 19 Industrial Site Spill Modeling Trent Schade, Cristina A. Jorge Schwarz and Daniel R. Kaufmann Industrial complexes in the United States have many safeguards against chemi- cal spills. Spills within the confines of the facility boundaries result in lost productivity, material losses, risks to human health and the environment, regu- latory fines, and negative publicity. Containing a spill within the facility boundaries provides some measure of legal and physical protection for the company. Occasionally spills occur that move beyond the protection of the industrial site physical boundaries. This increases the risk and consequence to the facility’s neighbors and the natural environment. Potentially, the impacted community can be quite large. Preventing spills in the first place is generally a top priority. Before a spill occurs, the facility needs to prepare and practice a response. Hydraulic system modeling is a great tool to help aid and inform spill response. Spill modeling uses dynamic hydraulic system modeling to identify weakness in the hydraulic barriers. This chapter examines a spill model of an industrial site where events transpired to cause a breach in the hydraulic boundary. The chapter describes the data collection, verification, and integration process, categorizes five spill source types, and demonstrates four spill modeling techniques using SWMM. It concludes with a description of the model application for root cause analysis including designing redundant backup systems to maintain a solid hydraulic barrier.
Transcript of Industrial Site Spill Modeling

Schade, T., C. Jorge Schwarz and D. Kaufmann. 2010. "Industrial Site Spill Modeling." Journal of Water Management Modeling R236-19. doi: 10.14796/JWMM.R236-19.© CHI 2010 www.chijournal.org ISSN: 2292-6062 (Formerly in Dynamic Modeling of Urban Water Systems. ISBN: 978-0-9808853-3-0)
303
19 Industrial Site Spill Modeling
Trent Schade, Cristina A. Jorge Schwarz and Daniel R. Kaufmann
Industrial complexes in the United States have many safeguards against chemi-cal spills. Spills within the confines of the facility boundaries result in lost productivity, material losses, risks to human health and the environment, regu-latory fines, and negative publicity. Containing a spill within the facility boundaries provides some measure of legal and physical protection for the company. Occasionally spills occur that move beyond the protection of the industrial site physical boundaries. This increases the risk and consequence to the facility’s neighbors and the natural environment. Potentially, the impacted community can be quite large.
Preventing spills in the first place is generally a top priority. Before a spill occurs, the facility needs to prepare and practice a response. Hydraulic system modeling is a great tool to help aid and inform spill response. Spill modeling uses dynamic hydraulic system modeling to identify weakness in the hydraulic barriers. This chapter examines a spill model of an industrial site where events transpired to cause a breach in the hydraulic boundary. The chapter describes the data collection, verification, and integration process, categorizes five spill source types, and demonstrates four spill modeling techniques using SWMM. It concludes with a description of the model application for root cause analysis including designing redundant backup systems to maintain a solid hydraulic barrier.

Industrial Site Spill Modeling 304
19.1 Background
The identity of the facility under study here must remain anonymous due to the potential for litigation. This facility, like many industrial complexes, operates on-site flow equalization prior to discharge of all waste water. The facility oc-casionally discharges process chemicals to the publicly owned treatment works (POTW) and has an industrial discharge permit with the POTW for these dis-charges. Generally the POTW is able to provide neutralization or change the recycle rate to meet their NPDES discharge requirements . With few surprises the POTW considers this facility to be an exemplary industrial discharger.
On one occasion, however, the POTW started receiving flow above the threshold for pH and acted quickly to by-pass the activated sludge process. The by-pass caused an impact to downstream water resources, and an investigation identified the industrial facility as the source of the pollutant.
The facility acted quickly and identified the probable source of the chemi-cal. Upon further investigation, they realized that a spill occurred because of a hydraulic misconnection. The plant management and the executive team de-cided to initiate a project to identify other potential failure points in the hydraulic barrier.
19.2 Root Cause Analysis
In the practice of engineering, root cause analysis (RCA) is a systematic ap-proach used to identify sources of a problem, and it emphasizes the deep evaluation of causes (Rooney and Vanden Heuvel, 2004). As part of a success-ful environmental management system (EMS), the SWMM application developed here serves as an important tool in RCA. The U.S. Environmental Protection Agency (USEPA) defines a root cause as a fundamental deficiency that results in a nonconformance and must be corrected to prevent recurrence of the same or similar nonconformance (USEPA, 2000). Important goals of an EMS include continuous improvement, pollution prevention, and environmental risk reduction (Commission for Environmental Cooperation, 2000).
Industrial spills frequently occur with little or no corrective action process, other than the immediate repair to facility equipment. The spill gets mopped up, and the equipment gets fixed, and the facility is back in operation. This scenario can repeat over and over again with little awareness or response from manage-ment. Generally, it could be seen as a maintenance and engineering problem. After a catastrophic spill with significant environmental impacts and negative publicity, management suddenly engages the issue and goes into response

Industrial Site Spill Modeling 305
mode. But at this point, the standard response, “fix the leak”, does not nearly match the magnitude of the impact.
Management must now start to question the systems that produced this cata-strophic event. RCA is a general category of analytical systems that examines these problems. Table 19.1 shows an example of RCA using the WHY? tech-nique.
Table 19.1 An example of questions generated by the RCA WHY? technique.
The RCA process provides a perfect opportunity to change business prac-tices and reevaluate root business decisions that may be creating additional cost as well as additional risk to health, safety or the environment.
In the RCA subsequent to the spill, the facility identified poor communica-tion, lack of training, and missing procedures as root causes for this incident. Part of the corrective and preventive actions included developing tools to:
• Consolidate all engineering drawings into one central database;• Run different spill scenarios to identify procedural and hydrau-
lic weaknesses;• Provide training;• Help respond to a spill quickly, efficiently, and effectively; and• Run a root cause analysis in the event of another spill.
This application of SWMM on a GIS platform provides all of the above re-quirements to help prevent another environmental impact at this facility.
19.3 GIS Data
Several key data gaps were identified in the facility’s information about the piping systems related to stormwater and waste water. Even among some of the
RCA WHY? example 1. The pipe started to leak. WHY?2. It developed a crack. WHY?3. A joint failed. WHY?4. Temperature was extremely cold. That is not under our control. Anything else?5. Product froze. WHY?6. It was not flowing. WHY?7. This line was not in production on Saturday. WHY?8. Maintenance is performed on Saturday. WHY?9. It is less expensive to hire maintenance for Saturday than 3rd shift during the week. WHY?

Industrial Site Spill Modeling 306
process lines, the facility is complex, routinely modified, and sufficiently aged that it is not always possible to correctly identify pipes. A phased approach carefully managed the processes of initial data collection, thorough verification, and integration into a modeling system.
19.3.1 Collection
The first task was to compile all possible information about the sewer system into a GIS. The facility has an extensive database of AutoCAD drawings from their engineering design work for the sewer and stormwater collection systems. However, numerous engineering revisions in AutoCAD over time resulted in several overlapping or multiple line segments and features which had to be re-drawn as single line segments and single features in the GIS. The system had to be topologically connected in the GIS (e.g. pipes to manholes), because such connections were not represented as actually connecting in the AutoCAD draw-ings (Figures 19.1 and 19.2).
Figure 19.1. AutoCAD rendition of the sewer system.

Industrial Site Spill Modeling 307
Figure 19.2 The GIS rendition of the sewer system, after initial conversion.
A spreadsheet containing the attributes for each feature (pipe, pump, and manhole) later served as the attribute table in the GIS (Table 19.2). In addition, all storage tanks in the facility were mapped, as each could serve as a source in a spill scenario. These features recorded tank capacity and chemical type.
19.3.2 Verification
The data verification phase consisted of first creating printed maps of the facil-ity and the piping systems. During several trips to the facility, plant personnel corrected errors, and filled in any data gaps. Particular attention was given to abandoned pipes as they are a potential conduit for spills and should be re-moved, destroyed, or properly sealed. For example, the raw data included abandoned pipes terminating at active pipes with no other connection to the active network. The GIS technician cannot assume that the inactive pipe is mis-labeled. The data verification phase cleared up these uncertain conditions.

Industrial Site Spill Modeling 308
Table 19.2 A spreadsheet of the facility’s sewer attributes, in progress.
19.3.3 Data Integration
The data integration step brought the data from the GIS into MWHSoft’s InfoSWMM. InfoSWMM connected the existing geodatabase directly to the SWMM model.
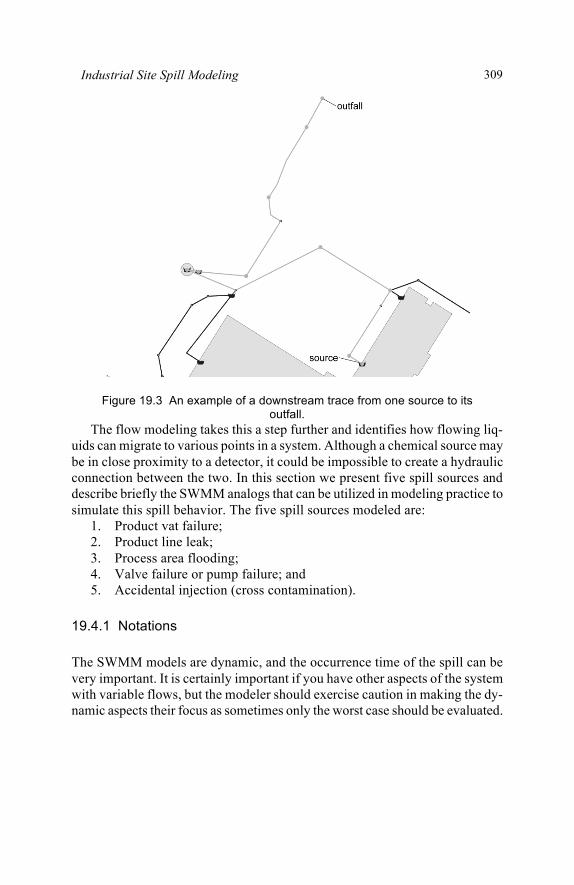
All orphan nodes (sources, orifices) and links (conduits, pumps) were iden-tified and manually connected. Once 100% connectivity was achieved, the software inferred any missing manhole elevations. The system was then ana-lyzed by tracing upstream and downstream (Figure 19.3), to verify that the correct flow direction had been translated to the GIS map.
19.4 Modeling Spill Sources
The power of having the facility information in a GIS database is significant. The RCA benefits include addressing questions such as Where are the possible sources of the chemical that was detected in this flow monitor? With a simple spatial or attribute query, the GIS can display where the possible sources of the chemical are on the map.
Pipe Code Force Main Grid Mat. Diam
(in.) Shape Notes
A02-A03 Gravity M14 CI 8 round A29-(LS) Force M16 ? ? round B01-(abnd. line?) Gravity P16 DI 18 round Abandoned or Active? (bldg ?)-(?) Gravity L17 PVC ? round Blank bldg btwn A8 & A7, to
existing line (bldg 01)-(?) Gravity O15 DI ? round NE corner of Bldg 02 to
existing line (bldg 01)-(bldg 02C)
Gravity O17 ? ? round
(bldg 04)-(?) Gravity W16 ? ? round S edge of Bldg 04 to existing line, W of LS
(bldg 06D)-(?) Gravity R17 ? ? round Runs N to existing line (bldg 6A)-(?) Gravity R16 ? ? round NW corner of 6A, N to existing
line 07-06-07-07 Gravity F15 PVC 6 round 07-07-(bldg?) Gravity F15 PVC 6 round Small blank bldg NW of Bldg
07 B02-B03 Gravity L16 DI 18 round
Industrial Site Spill Modeling 309
Figure 19.3 An example of a downstream trace from one source to its outfall.
The flow modeling takes this a step further and identifies how flowing liq-uids can migrate to various points in a system. Although a chemical source may be in close proximity to a detector, it could be impossible to create a hydraulic connection between the two. In this section we present five spill sources and describe briefly the SWMM analogs that can be utilized in modeling practice to simulate this spill behavior. The five spill sources modeled are:
1. Product vat failure;2. Product line leak;3. Process area flooding;4. Valve failure or pump failure; and5. Accidental injection (cross contamination).
19.4.1 Notations
The SWMM models are dynamic, and the occurrence time of the spill can be very important. It is certainly important if you have other aspects of the system with variable flows, but the modeler should exercise caution in making the dy-namic aspects their focus as sometimes only the worst case should be evaluated.

Industrial Site Spill Modeling 310
In a simple worst case scenario, it is convenient if the start of the spill is at the start of the simulation, t0. When the spill relationship to flow is important, it is may be more convenient and tell us more to identify the spill at some time into the model run, tspill.
19.4.2 Product Vat Failure
A product vat failure occurs when a vat punctures or structurally fails and im-mediately releases its contents into a secondary containment area, the natural environment or a storm drain. The physical system includes a product vat, a description of the land surface including geometric information, and any local storm drains. The purpose of the modeling is to determine the travel time to any sensitive parts of the local infrastructure or to the natural environment. In mod-eling the spill we can make a few simplifying assumptions. The spill will start at the moment of vat failure; the rate of the spill is continuous; and the initial volume of the vat will completely empty.
Figure 19.4 shows the physical scenario and the SWMM analog to this sys-tem. At time t0 the vat contains an initial volume of product, V0. At this point the system is static. Note that the analog includes a subcatchment area, a rain-gauge, and a SWMM node. Not shown on this figure is the rest of the drainage network connected to the node. It is also possible to model a connection to a groundwater aquifer from the subcatchment. At the time of spill, tspill, the vat ruptures and releases its volume at a constant rate equal to the initial vol-ume/time to the end of the spill. The SWMM analog chosen here requires rainfall intensity applied to the subcatchment to the intensity of rainfall can be calculated from the release rate and the subcatchment area.
Figure 19.4 Product vat failure.

Industrial Site Spill Modeling 311
The second rate to consider in modeling the system is the rate that the re-lease arrives at the storm drain (SWMM node in the analog). This rate is determined by subcatchment properties. Care must be applied in selecting these parameters. In a critical situation, it is prudent to perform some calibration test-ing where the area under the vat can be rapidly inundated with water and the storm network monitored. This will give the type of calibration data needed to appropriately calibrate the model.
In a screening or planning mode, it is still useful model this with worst case scenarios. Lots of impervious surface with high slopes will runoff quickly.
19.4.3 Product Line Leak
A product line leak is any instance where there is a pressurized flow of product out of a conduit to the natural environment or a storm sewer system. The physi-cal layout of this system is an above-ground pipe between two process locations. This is a common configuration at an industrial site. Figure 19.5 shows the physical configuration as a pipeline between two process buildings, and the SWMM analog is two nodes representing each building, a third node representing the location of the leak and an outfall node to control the timing of the leak.
Figure 19.5 Product line leak.

Industrial Site Spill Modeling 312
Assumptions include that the flow is continuous from building A to building B, and that the head difference between the two nodes is constant.
The modeling analog includes conduits connecting node A to node PL1 and node PLL to node B. These conduits have the same geometric properties as the line between the two buildings in the physical system. The third conduit con-nects the potential leak point to an outfall. This is how the analog will control the timing and flow rate of the leak.
SWMM lets us model this at any point along a pipe; in other words, LA-PL + LPL-B = LA-B. To model this in SWMM we need to install a node at the point where we have the leak. While this is a bit inconvenient if you are trying many different scenarios, several SWMM vendors provide tools that facilitate this.
19.4.4 Process Area Flooding
Another spill source is when a process area becomes inundated with flow. In this case, the process area may be in a lower part of an area that is subject to widespread flooding. SWMM helps answer questions for production managers related to where and when does a contaminant migrate under a flooding situa-tion. Consider the physical configuration shown in Figure 19.6.
Figure 19.6 Facility flood inundation
The assumptions in this model are that a process gets interrupted and inun-dated at some critical level and the floodwater carries the contaminated flow to the correct outfall. Flow is always in one direction.
This SWMM analog starts to get more complicated than the previous analo-gies. It is a series of nodes set at the critical levels representative of each of these processes. The critical elevations can be programmed into the analog us-

Industrial Site Spill Modeling 313
ing an outfall and a storage node. This technique for creating critical levels is described in the next section. As the schematic makes clear in the analog, the system can discharge to one of four locations.
19.4.5 Valve Failure or Pump Failure
Valves or pumps at industrial sites occasionally fail causing another type of leak at an industrial site. This leak is where the appurtenance in question no longer functions correctly, and it is allowing flow in an unintended direction or incorrect magnitude. The leak occurs when a valve or pump starts to fail. This failure can occur suddenly or it can occur slowly over time. It is possible that this failure can occur and continue undetected for a long period of time. This type of failure can be insidious and difficult to track down, especially if infra-structure is buried, or if portions are difficult to inspect routinely.
For modeling this system, our only assumption is that the head on one side of the valve or pump—usually the higher head—is constant. Figure 19.7 shows the physical representation of this type of leak. Figure 19.7 also shows the SWMM analog useful for a pump and a valve system. Unlike some of our other models, this analog has only one outfall that represents the same outfall as the physical system. It is important to note that this type of leak does not leave a controlled part of the system; it is not necessarily entering the natural environ-ment, but rather putting a product into an unintended location is a safety hazard.
Figure 19.7 Pump failure.
This type of leak requires an initial condition and possibly a timed injection. Both of these techniques are discussed below.

Industrial Site Spill Modeling 314
19.4.6 Accidental Injection (Cross Contamination)
Cross contamination is another source of chemical leak. This problem occurs when you have an unintentional hydraulic connection between two lines. Prod-uct manufacturers present many options for tools that help prevent cross contamination including backflow preventers and air gaps to prevent a vacuum.
For a cross contamination of any volume to occur there must be a pressure difference between two conduits. In water distribution systems research there are good examples where this pressure difference is the result of a low pressure event in the distribution system combined with a portable pump. Generally, industrial facilities have a stake in ensuring that the process flows stay con-nected properly, and they would tend to focus effort on meeting any and all local plumbing requirements which usually prescribe backflow preventers. However, due to the complexity in these systems, it is possible to occasionally install these devices incorrectly or inappropriately. Figure 19.8 shows a physi-cal layout where a potential source of contamination could enter the industrial pre-treatment and head to the POTW.
Figure 19.8 Cross contamination.
The SWMM analog is relatively straightforward, basically paralleling the physical system as shown. The primary motivation for modeling this is as a perception check on how the system hydraulics will behave under different flow scenarios.

Industrial Site Spill Modeling 315
19.4.7 Spill Modeling Techniques
This section describes four convenient techniques that make modeling these types of spill possible.
Setting Initial Conditions We occasionally want to have some part of the model include an initial concen-tration of contaminates. In the vat spill above, the vat needs to have an initial concentration of a pollutant. SWMM includes a very convenient tool to set wa-ter quality and hydraulic conditions for the start of a simulation. This tool takes a snapshot of the hydraulic conditions including flow in conduits, depth at nodes and status of appurtenances. This is commonly called the hotstart file. The hotstart file can be created at any instant within a solved model. It is used most often to ensure that the model initializes at a steady point. For hydraulics, this means that there is not an unreasonably high head value stuck somewhere on the model, creating a discontinuity. For water quality, it means there is no point where the chemical concentration is not abruptly different at the same time as there is mixing in the system.
Outside of the hotstart file, SWMM also allows the user to directly enter ini-tial depth at nodes, initial flow in pipes, and initial settings on hydraulic controls. It does not, however allow for initial water quality settings. Below is a quick and simple technique to achieve water quality settings at an initial time.
The overarching process is to create in initialization run, save the hotstart file, and then use the hotstart file for the simulation run. To create the initializa-tion run, the first step is to isolate parts of the system by installing proper appurtenances such as valves. This should be used carefully because these can-not be removed during the simulation run; they will remain a permanent addition to the system once they are installed. The initialization run and the resulting hotstart file must have the same system elements as in the simulation run.
These values should be set in the off position initially. The point here is that we need to fill up part of the system without impacting the rest of the system.
The next step for the initialization run is to create a concentration inflow at the proper level so that at the end of the hotstart run, the system will have con-centrations correct for the start of the simulation run. Anticipating some changes in the system, we can adjust the inflow concentration accordingly. For example, starting a storage node empty to fill with a 900 m3 volume after 1 h, the inflow should be:

Industrial Site Spill Modeling 316
Inflow (m3/s) = Volume (m3) / Fill Time (s) (19.1) = 900 / 3600 = 0.25 (m3/s)
If the tank is initially full, then the concentration of the inflow chemical will be diluted, as the tank mixing model assumes instantaneous and complete mix-ing. If this condition is unavoidable, the concentration will be of the inflow should be adjusted to account for the dilution.
Once the initialization run is configured properly, the user should make the initialization run and inspect results to ensure that the system is in the proper state. With confirmation on inspection of the initialization run results, the user can save the hotstart file.
Timed Injection A timed injection represents the physical condition where a constant source of a pollutant enters the system for a short period of time then stops. For example, if an industrial process tank begins to overflow, and we want to model the impact of various response times, we would need a timer that starts when the tank overflows and triggers an event after some delay. Modeling this condition can be difficult because there is not a Timer tool in the SWMM model.
There is a widely known trick among SWMM modelers that is convenient and elegant to solve this little problem. Off to one side of the model, we can add a pump connecting two tanks with an orifice and an outfall attached to the downstream tank. The pump is set to have a constant rate regardless of the head difference between the tanks. At the start of the time, the orifice is closed, the receiving tank is empty and the pump is off. As soon as the event starts, the pump engages filling the receiving tank. As this tank hits the proper depth, the tank shuts off and the orifice opens, resetting the system for the next timed event.
Forced Overflow A model of a forced overflow helps us understand the pathway and hydraulic behavior as the overflow occurs. Like the timed injection there is a widely known modeling trick to achieve this type of overflow and maintain continuity in the system. Basically, you can create an arbitrary inflow at the location of concern that ramps up at an appropriately slow change in flow over time.
This can be time consuming. This inflow point needs to enter the system at each node for each run. It is not a convenient technique, but sometimes it is necessary. A way to make it more palatable and speedy is to focus on areas that

Industrial Site Spill Modeling 317
split the system. If one does not have any flow limitations, then you can look at the next one.
Critical Levels Determining critical levels in a hydraulic system is a reverse of the forced over-flow problem. In this case, we are interested to see which parts of the physical system respond are at various critical levels. In the forced overflow scenario, we are searching for limitations of flow. In this case we are looking for limita-tions of head.
The forced overflows must be tried at multiple points from the uppermost areas toward the downstream. The critical levels analysis however can be done by adding a ramped-up depth at one outfall. As long as the depth changes very slowly and covers the entire depth of the model, then as it runs the model will overflow at many points. But you need to make sure to add surcharge depth everywhere so that you do not just have a huge flood at the lower part of the system.
19.5 Conclusions
The success of the project thus far is the result of cooperation between several parties dedicated to providing unique but practical solutions in the interest of environmental protection. RCA provides an excellent approach for finding the cause(s) and sources of problems. SWMM allowed us to enhance the approach by providing technological solutions that enable us to quickly and accurately answer the questions that RCA produced. The GIS data system and modeling effort will support ongoing sewer system modifications in ways that the client cannot anticipate, providing a structured scheme to identify spill sources, and designing future emergency response system upgrades.
References
Commission for Environmental Cooperation. (2000). “Improving Environmental Per-formance and Compliance: 10 Elements of Effective Environmental Management Systems.” Montreal.
Rooney, J.J., L.N. Vanden Heuvel. (2004) “Root Cause Analysis for Beginners.” Quality Progress July 2004.
Rossman, L.A. (2005). Storm Water Management Model User’s Manual. Version 5.0, U.S. Environmental Protection Agency, National Risk Management Research Labo-ratory, Cincinnati, OH.

Industrial Site Spill Modeling 318
USEPA, (2000) “Integrated Environmental Management Systems Implementation Guide.” EPA 744-R-00-011. Design for the Environment Program, Economics, Ex-posure, and Technology Division, Office of Pollution Prevention and Toxics, Washington, D.C.