Industrial segment Customer relationship assessment study Customer Satisfaction Management &...
15
Industrial segment Customer relationship assessment study Customer Satisfaction Management & Measurement, IMRB International Field work duration Feb 2013 - Apr 2013 Central Zone & Competition 8 th May 2013
-
Upload
myron-ward -
Category
Documents
-
view
218 -
download
1
Transcript of Industrial segment Customer relationship assessment study Customer Satisfaction Management &...

Industrial segment
Customer relationship
assessment study
Customer relationship
assessment study
Customer Satisfaction
Management & Measurement,
IMRB InternationalField work durationFeb 2013 - Apr 2013
Central Zone & Competition8th May 2013

© CSMM 2013, Confidential & Proprietary
Study Objectives
To understand the needs requirements & expectations of Tata Power customers of the industrial segmentTo understand the needs requirements & expectations of Tata Power customers of the industrial segment
To understand how Tata Power is perceived by the customersTo understand how Tata Power is perceived by the customers
1
To understand the satisfaction levels & assess how Tata Power is meeting these customer expectations To understand the satisfaction levels & assess how Tata Power is meeting these customer expectations
To understand what drives customers loyalty To understand what drives customers loyalty
To identify strengths and weaknesses of Tata PowerTo identify strengths and weaknesses of Tata Power
To identify strategic improvement priorities & leveragable strengths To identify strategic improvement priorities & leveragable strengths
2
3
4
5
6

© CSMM 2013, Confidential & Proprietary
Research design & Methodology
GEOGRAPHIC COVERAGEGEOGRAPHIC COVERAGE
All interviews were conducted in Mumbai.
This track has been covered for the following zone for Tata Power customers.Competition was covered across Mumbai.
INTERVIEWING METHODOLOGYINTERVIEWING METHODOLOGY
Blind methodology was used for conducting the interviews i.e. Customers were not informed who the sponsor of the study was.
CENTRAL ZONE
Goregaon
Malad
Borivali
Kandivali
Aarey Milk colony

© CSMM 2013, Confidential & Proprietary
Customer Satisfaction Index
CSI
EXPERIENCE INDEX LOYALTY INDEX
47 93
DissatisfactionIndex
* Dissatisfaction index has been calculated using the bottom box scores for all the aspects considered for the CSI score.

© CSMM 2013, Confidential & Proprietary
Customer Satisfaction Index
Experience Index
Loyalty Index
LT All Total
70 60 87 60 75 60 42
47 30 74 31 54 51 40
93 90 100 89 95 70 44
Customer Satisfaction Index
HT DirectChangeover
Base: 92 60 32 29 63 75 77
BEST RIL

© CSMM 2013, Confidential & Proprietary
Drivers of Loyalty – Overall Experiences
Loyalty
Payment Process
Impact wise Rank
All TotalTop 2 Box %
All Total Bot 2 Box %
Top 2 % (Excellent + V.Good)
Bot2 % (Fair + Poor)
33
41%41%
1%1%
Metering and billing
11
42%42%
2%2%
Electricity Supply
22
43%43%
1%1%

© CSMM 2013, Confidential & Proprietary
Customer ExperiencesTop 2 % (Excellent + V.Good )
45%
29%
25%
Scores in RED indicate high bottom 2 => 20
* : Low Base < 30
Impact %Competition Scores significantly higher/ lower than TATA Power
Scores significantly higher/ lower than TATA Power
TATA Power is performing better among HT consumers.Dissatisfaction is mainly around the areas of Complaint Handling and Relationship Building.

© CSMM 2013, Confidential & Proprietary
Metering and BillingTop 2 % (Excellent + V.Good )
45%
47%
36%
17%
Scores in RED indicate high bottom 2 => 20
* : Low Base < 30
Impact %Competition Scores significantly higher/ lower than TATA Power
Scores significantly higher/ lower than TATA Power
TATA Power is performing well across segments.Dissatisfaction is mainly around the areas of Timeliness and regularity of receiving bills.

© CSMM 2013, Confidential & Proprietary
Electricity SupplyTop 2 % (Excellent + V.Good )
29%
40%
33%
27%
Scores in RED indicate high bottom 2 => 20
* : Low Base < 30
Impact %Competition Scores significantly higher/ lower than TATA Power
Scores significantly higher/ lower than TATA Power
Dissatisfaction for Tata Power is mainly for not Providing Intimation in case of a predetermined power cut .

© CSMM 2013, Confidential & Proprietary
Payment ProcessTop 2 % (Excellent + V.Good )
25%
54%
20%
Scores in RED indicate high bottom 2 => 20
* : Low Base < 30
Impact %Competition Scores significantly higher/ lower than TATA Power
Scores significantly higher/ lower than TATA Power
15%
11%
TATA Power performs relatively well on Payment process.Adequacy of reminders serves as an area of improvement.

© CSMM 2013, Confidential & Proprietary
Customer Relation CentreTop 2 % (Excellent + V.Good )
Scores in RED indicate high bottom 2 => 20
* : Low Base < 30 Competition Scores significantly higher/ lower than TATA Power
Scores significantly higher/ lower than TATA PowerWait time at the Customer Relation Center , Knowledge level of the Executive and Promptness in resolving queries,
score lower especially among LT consumers

© CSMM 2013, Confidential & Proprietary
Complaint / Query Handling By Call CentreTop 2 % (Excellent + V.Good )
Scores in RED indicate high bottom 2 => 20
* : Low Base < 30 Competition Scores significantly higher/ lower than TATA Power
Scores significantly higher/ lower than TATA PowerEase of navigating the IVR , Wait time before getting connected to the executive and Time kept on hold score low
among HT consumers.

© CSMM 2013, Confidential & Proprietary
Complaint HandlingTop 2 % (Excellent + V.Good )
Scores in RED indicate high bottom 2 => 20
* : Low Base < 30 Competition Scores significantly higher/ lower than TATA Power
Scores significantly higher/ lower than TATA Power
© CSMM 2013, Confidential & Proprietary
The way forward
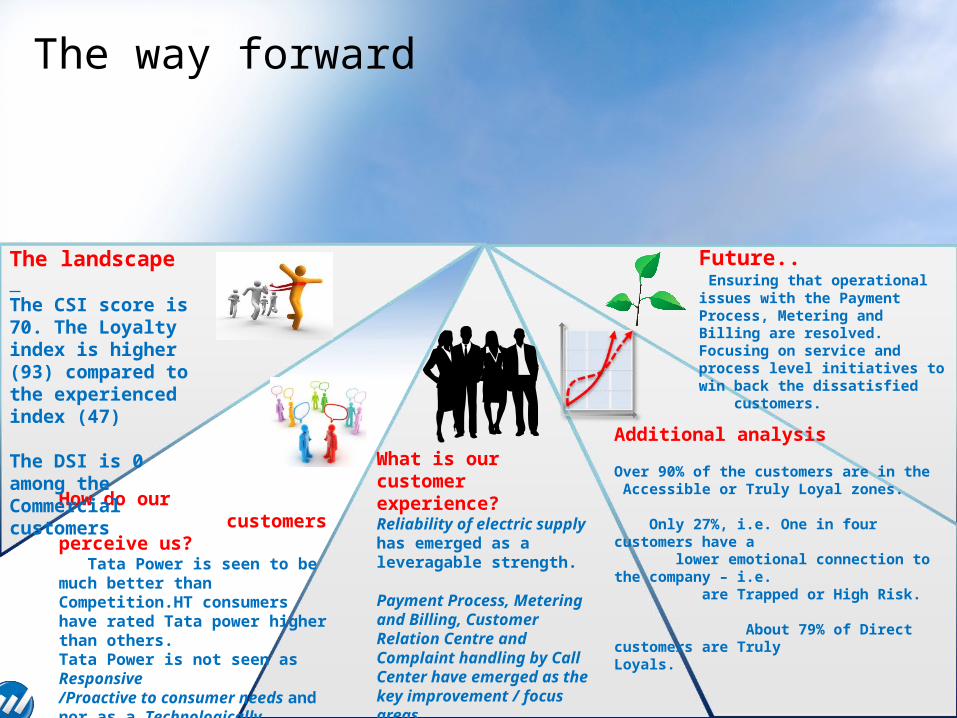
How do our customers perceive us? Tata Power is seen to be much better than Competition.HT consumers have rated Tata power higher than others.Tata Power is not seen as Responsive/Proactive to consumer needs and nor as a Technologically advanced company
The landscape The CSI score is 70. The Loyalty index is higher (93) compared to the experienced index (47)
The DSI is 0 among the Commercial customers
Additional analysis
Over 90% of the customers are in the Accessible or Truly Loyal zones.
Only 27%, i.e. One in four customers have a lower emotional connection to the company – i.e. are Trapped or High Risk.
About 79% of Direct customers are Truly Loyals.
Future.. Ensuring that operational issues with the Payment Process, Metering and Billing are resolved.Focusing on service and process level initiatives to win back the dissatisfied customers.
What is our customer experience?Reliability of electric supply has emerged as a leveragable strength.
Payment Process, Metering and Billing, Customer Relation Centre and Complaint handling by Call Center have emerged as the key improvement / focus areas