Industrial Minerals Research
86
Oilfield bonanza Oil and gas drilling demands industrial minerals Mike O’Driscoll Global Head of Research, Industrial Minerals
Transcript of Industrial Minerals Research
Oilfield bonanza Oil and gas drilling demands industrial minerals
Mike O’Driscoll
Global Head of Research, Industrial Minerals


Outline
1. Overview
2. Barite
3. Proppants
4. Market potential indicators
5. Conclusions
Structure
Trends
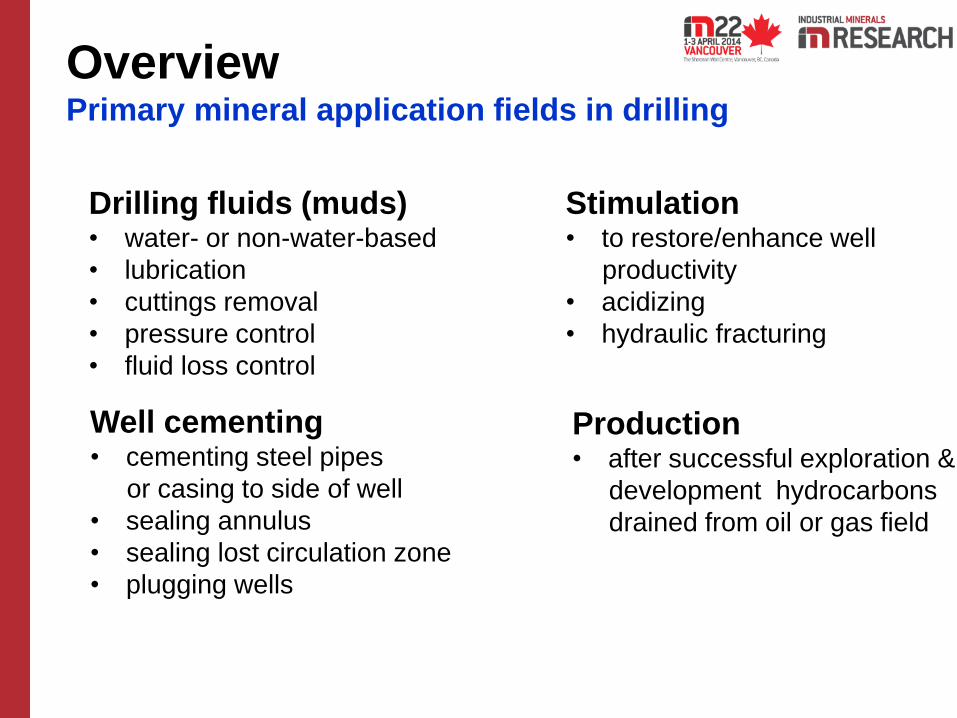
Overview Primary mineral application fields in drilling
Drilling fluids (muds) • water- or non-water-based
• lubrication
• cuttings removal
• pressure control
• fluid loss control
Well cementing • cementing steel pipes
or casing to side of well
• sealing annulus
• sealing lost circulation zone
• plugging wells
Stimulation • to restore/enhance well
productivity
• acidizing
• hydraulic fracturing
Production • after successful exploration &
development hydrocarbons
drained from oil or gas field

Overview Simplified drilling operation
Source: OGP/IPIECA
Industrial minerals:
drilling fluids
Industrial minerals:
well cement
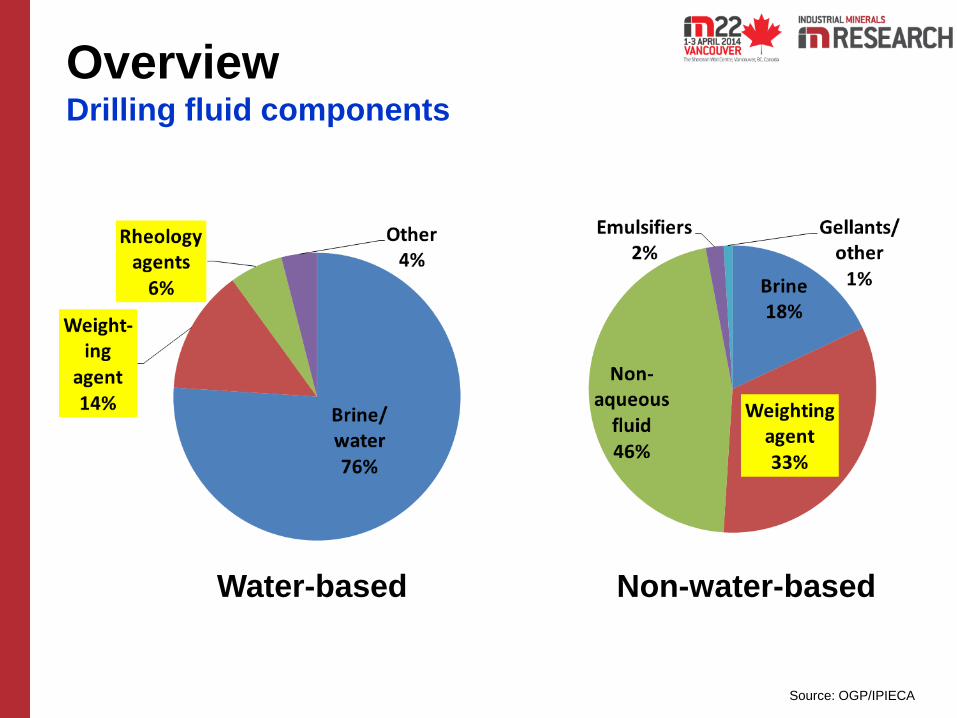
Overview Drilling fluid components
Water-based Non-water-based
Source: OGP/IPIECA

Overview Drilling fluid functions
• density, or weight
• viscosity
• filtration control
• rheology control, or
thinning/dispersing
• alkalinity, or ph-control
• lost-circulation control
• surface activity modification
• lubrication
• flocculation
• shale stabilization
• protection from toxic and/or
corrosive agents
Source: OGP/IPIECA

Overview Primary mineral applications
Weighting agents
high SG; help offset pressure; control liquid flow into wellbore from
formation; keep the hole open
eg. barite, haematite, calcium carbonate
Bridging agents
plug pore spaces at wellbore, restricting invasion of solids and fluids into
the formation
eg. calcium carbonate, salt
Viscosifiers
Carry cuttings to surface; build a cake against permeable formations;
lubricates drill string.
eg. sodium bentonite, treated calcium bentonite for freshwater muds;
attapulgite and sepiolite for saltwater muds; organophillic clays for oil muds

Overview Primary mineral applications
Lost circulation materials
used to plug or seal pores and cracks in the formation
eg. gilsonite, mica, diatomite, expanded perlite and vermiculite
(bentonites, organophilic clays)
Cross-linker
Hydrated polymers or gels (guar gum) are cross linked by borate ions to
provide increased viscosity. Benefits include, good proppant transport,
stable fluid rheology at high temperatures, low fluid loss, and good clean
up properties. eg. sodium borates
Stabilisers
Prevents dissolution of formation
eg. Gilsonite, salt, gypsum
Lubricants
Lubrication of drill bit and drill pipe
eg. graphite, bentonite
Proppants
Hold open fractures to enable oil and gas flow
eg. silica sand, calcined bauxite, calcined kaolin, magnesium silicate
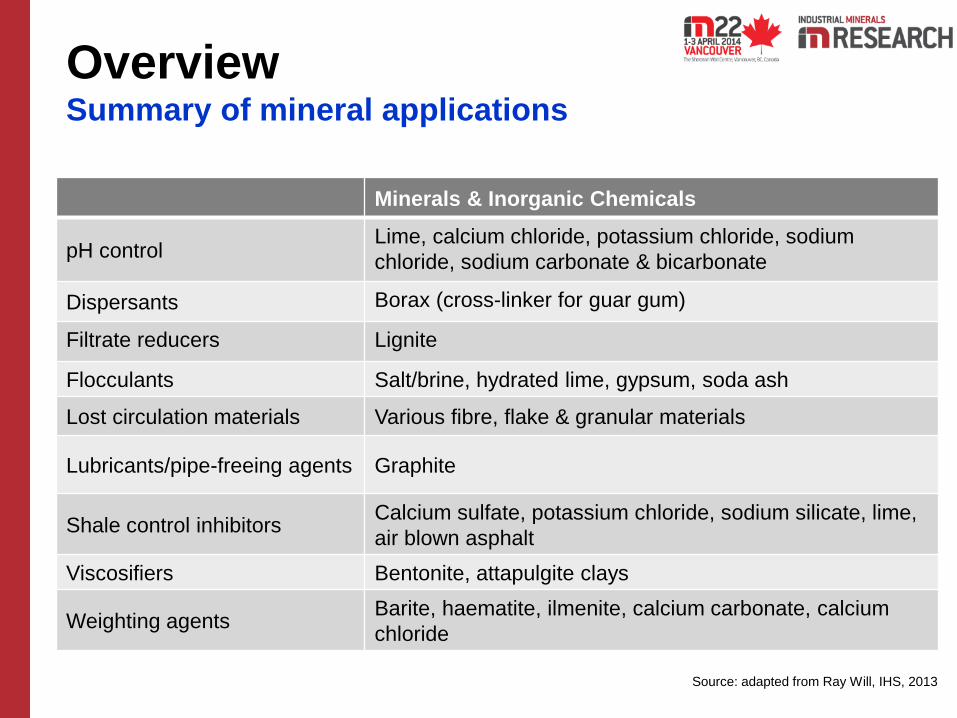
Overview Summary of mineral applications
Minerals & Inorganic Chemicals
pH control Lime, calcium chloride, potassium chloride, sodium
chloride, sodium carbonate & bicarbonate
Dispersants Borax (cross-linker for guar gum)
Filtrate reducers Lignite
Flocculants Salt/brine, hydrated lime, gypsum, soda ash
Lost circulation materials Various fibre, flake & granular materials
Lubricants/pipe-freeing agents Graphite
Shale control inhibitors Calcium sulfate, potassium chloride, sodium silicate, lime,
air blown asphalt
Viscosifiers Bentonite, attapulgite clays
Weighting agents Barite, haematite, ilmenite, calcium carbonate, calcium
chloride
Source: adapted from Ray Will, IHS, 2013

Overview Summary of mineral applications
Minerals & Inorganic Chemicals
Cementing
Accelerators Calcium chloride, sodium chloride, sodium sulphate, sodium
silicate
Dispersants Sodium chloride
Lost Circulation materials Gilsonite, perlite, mica, bentonite, silicates
Retarders Borax
Weighting agents Haematite, barite, sand, ilmenite, bentonite, attapulgite, pozzolan,
gilsonite, silicates
Stimulation
Fluid loss additives Silica flour, calcium carbonate
Proppants Silica sand, calcined bauxite, calcined kaolin, mag-silicate
Production
Hydrogen sulphide control Zinc & iron oxides
Water clarifiers Ferric chloride
Water injection chemicals Sodium sulphite
Source: adapted from Ray Will, IHS, 2013

Overview Supply chain
Mineral producer
Mineral processor/distributor
Oilfield service provider
Exploration/production Co.
Mineral trader
Trad. Captive Direct Captive
route processing buy production
Exploration, reserves, mining,
processing
Sourcing, logistics, financing
Sourcing, processing, storage,
logistics
Sourcing, processing, storage,
logistics, formulating, application
Application
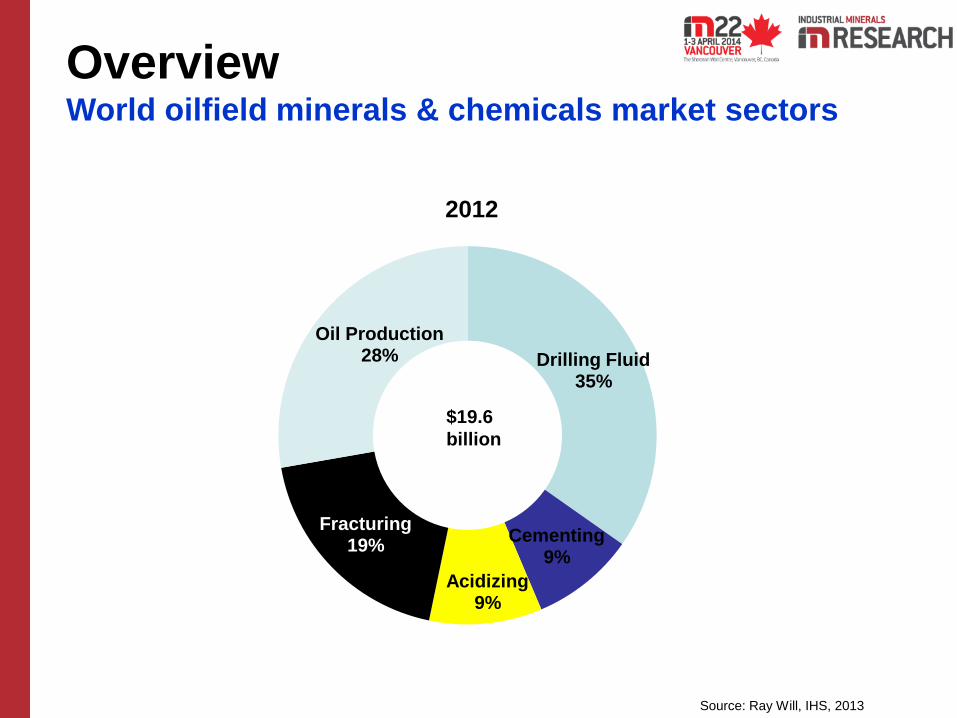
Overview World oilfield minerals & chemicals market sectors
Source: Ray Will, IHS, 2013
Drilling Fluid 35%
Cementing 9%
Acidizing 9%
Fracturing 19%
Oil Production 28%
2012
$19.6
billion

Overview World oilfield minerals & chemicals market sectors
by region
Source: Ray Will, IHS, 2013
North America 55%
Latin America 11%
Europe 6%
CIS 8%
Africa 7%
Middle East 7%
Asia Pacific 6%
2012
$19.6
billion

Barite

Barite Properties
Barite (barytes) and known as “heavy
spar”, is the naturally occurring mineral of
barium sulphate BaSO4 (65.7% BaO,
34.30% SO3).
Occur as either as bedded or
residual/eluvial deposits or vein and
cavity fillings
• natural product
• non-toxic
• relatively inexpensive
• inert - chemically and
physically unreactive
• high specific gravity (3.9-4.6)
• good sound-deadening and
radiation-shielding
• low oil adsorption

Barite API specifications
Density SG min. 4.10 & 4.22g/ml
Water soluble alkaline
earth metal
max. 250 ppm
>75um residue
<8um fines
max. 3%
max. 30%
Cadmium
Mercury
Extractable carbonates
Extractable sulphides
max. 3ppm
max. 1ppm
3,000mg/l max
50 mg/l max
But also need to consider: Pb, As toxic metals
EPA regs offshore
SiO2, Fe2O3, Al2O3 grindability

Barite World production 8.5m tonnes 2013
Source: data from The Barytes Association
USA
0.7
Mexico
0.12
Peru
0.12
India
1.7
Morocco
0.92 Turkey
0.25
Iran
0.2
Kazakhstan
0.2
China
3.5
Europe
0.16
Thailand
0.10
Vietnam
0.09
Also from: Algeria Russia Pakistan

Barite World production 8.5m tonnes 2013
43%
21%
11%
9%
3% 3%
2% 2%
2% 2%
1% 1% China
India
Morocco
USA
Turkey
Iran
Kazakhstan
Europe
Mexico
Peru
Thailand
Vietnam
Source: The Barytes Association
95% from:

Barite World production trend 2003-2013
0
1
2
3
4
5
6
7
8
9
10
2003 2004 2005 2006 2007 2008 2009 2010 2011 2012 2013
Mill
ion
s
Source: based on USGS data

Barite
Cobachi barite deposit, Sonora, Mexico Courtesy: Ken Santini
Mangampet, Andhra Pradesh, India Courtesy: IBC Ltd

Barite World consumption by market 8.4m tonnes 2013
Source: The Barytes Association

Barite World consumption by region 8.4m tonnes 2013
Source: The Barytes Association
38%
21% 10%
9%
5%
5% 5%
4% 3% USA
China
Gulf States
Europe
S. America
Russia/CIS
India
Africa
Malaysia
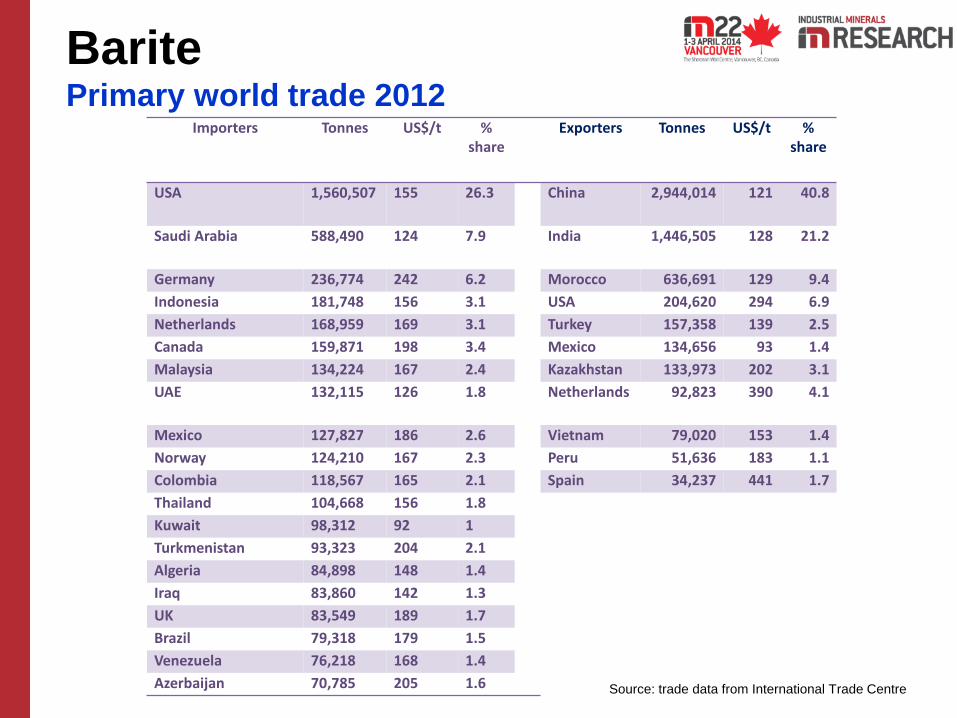
Barite Primary world trade 2012
Importers Tonnes US$/t % share
Exporters Tonnes US$/t % share
USA 1,560,507 155 26.3 China 2,944,014 121 40.8
Saudi Arabia 588,490 124 7.9 India 1,446,505 128 21.2
Germany 236,774 242 6.2 Morocco 636,691 129 9.4
Indonesia 181,748 156 3.1 USA 204,620 294 6.9
Netherlands 168,959 169 3.1 Turkey 157,358 139 2.5
Canada 159,871 198 3.4 Mexico 134,656 93 1.4
Malaysia 134,224 167 2.4 Kazakhstan 133,973 202 3.1
UAE 132,115 126 1.8 Netherlands 92,823 390 4.1
Mexico 127,827 186 2.6 Vietnam 79,020 153 1.4
Norway 124,210 167 2.3 Peru 51,636 183 1.1
Colombia 118,567 165 2.1 Spain 34,237 441 1.7
Thailand 104,668 156 1.8
Kuwait 98,312 92 1
Turkmenistan 93,323 204 2.1
Algeria 84,898 148 1.4
Iraq 83,860 142 1.3
UK 83,549 189 1.7
Brazil 79,318 179 1.5
Venezuela 76,218 168 1.4
Azerbaijan 70,785 205 1.6 Source: trade data from International Trade Centre

Barite US barite supply-demand & drilling 2003-2013
0
500
1000
1500
2000
2500
0
500,000
1,000,000
1,500,000
2,000,000
2,500,000
3,000,000
3,500,000
2003 2004 2005 2006 2007 2008 2009 2010 2011 2012
B-H rig count
Source: based on USGS data
Note: net import reliance of around 80% for US barite market; China has been main source accounting for 90-95% imports 2003-13
2013
US production
US consumption Baker Hughes
rig count
tonnes

Barite Key trends & developments
• Prices have stabilised in US$120-150/t FOB range
• Issues with Chinese and Indian supply have encouraged consumers
to seek alternative sources
• Global resource availability has been extended through acceptance
and increasing use of 4.0 and 4.1 SG barite; API added 4.1 SG
• At same time, concerns over HM impurities from new sources
eg. As, Pb contents – talk of incorporating into API specs.
• Major players increasing processing capacity at traditional bases
eg. India: RockFin, IBC
USA: Baroid, Baker-Hughes, Excalibar, Superior Weighting
• Emergence of potential new supply sources:
- greenfield & existing/dormant
- move to establish sources & processing near markets
• Use of micronised barite: reduces sag in shallow, horizontal wells

Barite Trends & developments – potential/emerging new sources
Guatemala
Mexico
Morocco
Liberia
Zimbabwe
Thailand/Laos
Kazakhstan
Pakistan

Proppants
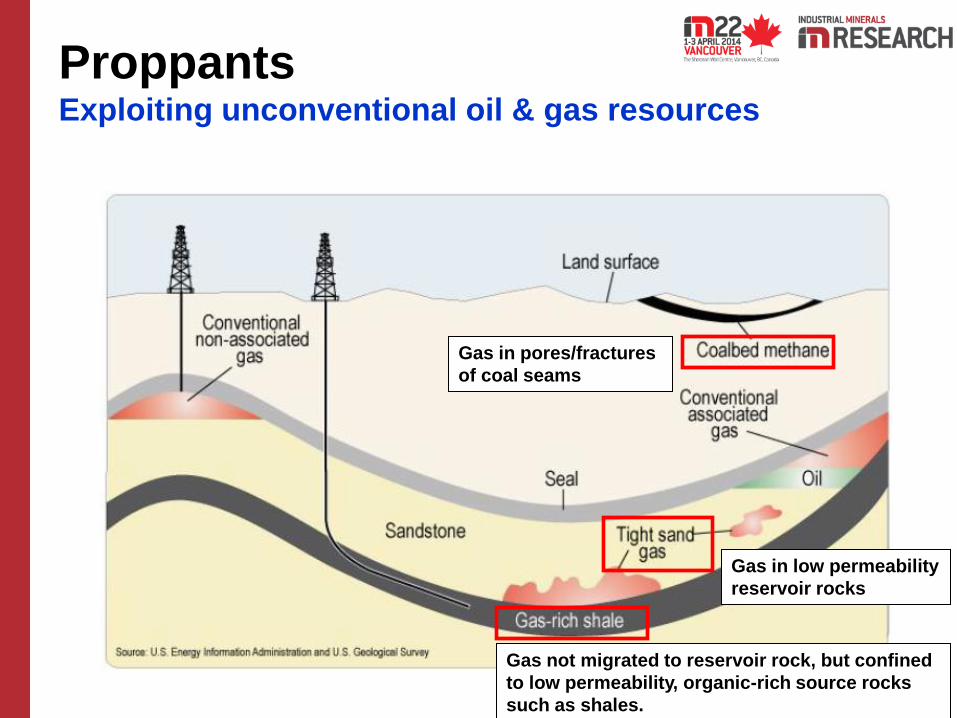
Proppants Exploiting unconventional oil & gas resources
Gas in pores/fractures
of coal seams
Gas in low permeability
reservoir rocks
Gas not migrated to reservoir rock, but confined
to low permeability, organic-rich source rocks
such as shales.

Propping agent
= “proppant”
Props open
fracture
Permits
oil/gas flow
(conductivity)
Proppants Hydraulic fracturing

Source: Baker Hughes
Drinking water acquifer
<1,000ft (305m)
Target rock formation
6-10,000ft (1,829-3,048m),
fractures extend ’00s ft
8,000ft (2,438m)
Proppants Fracturing depth perspective

1860s
“oilwell
shooting”
1930s
“well
acidizing”;
“pressure-
parting”
1947
Harris/ Clark
Stanolind Oil &
Gas Co.,
Hugoton, KS
20,000lbs sand
1949
patent filed;
excl. lic.
Halliburton,
Stephens OK,
Orchard TX;
100-150lbs,
332 wells; 75%
up in output
mid-1950s
more patents;
3,000
wells/mth;
400 lbs sand,
20/40 mesh
mid-1960s
water as
standard;
additives;
higher volume
proppants,
& coarser
1968
1st 1.5m lb
frac, Pan
American
Petroleum
Corp.
Proppants Evolution of fracturing:
1860-1970: early days, small proppant volumes

1981
George
Mitchell
Barnett
Shale, TX
1983
First ceramic
proppant used
1984
First resin
coated
proppant
1990-99
Mitchell Energy
perfected use of
proppants + water
in horizontal
wellbores
2000
ceramic and
resin coated
proppants to
exceed 1bn
lbs/yr
2008+
>50,000 frac stages
completed worldwide,
8-40 frac stages/well;
US oil production
increased by est. 30%
and gas 90%;
average 60,000 gal,
100,000lbs sand/well,
to >1m gal and 4-6m
lbs proppant/well
Proppants Evolution of fracturing:
1980-present: technology matures, larger proppant volumes

Source: Montgomery & Smith 2010
17 March 1949
Duncan, OK
1st fracturing by
Halliburton for
Stanolind Oil Co.
Proppants Evolution of fracturing: Past

Source: Baker Hughes
Proppants Evolution of fracturing: Present
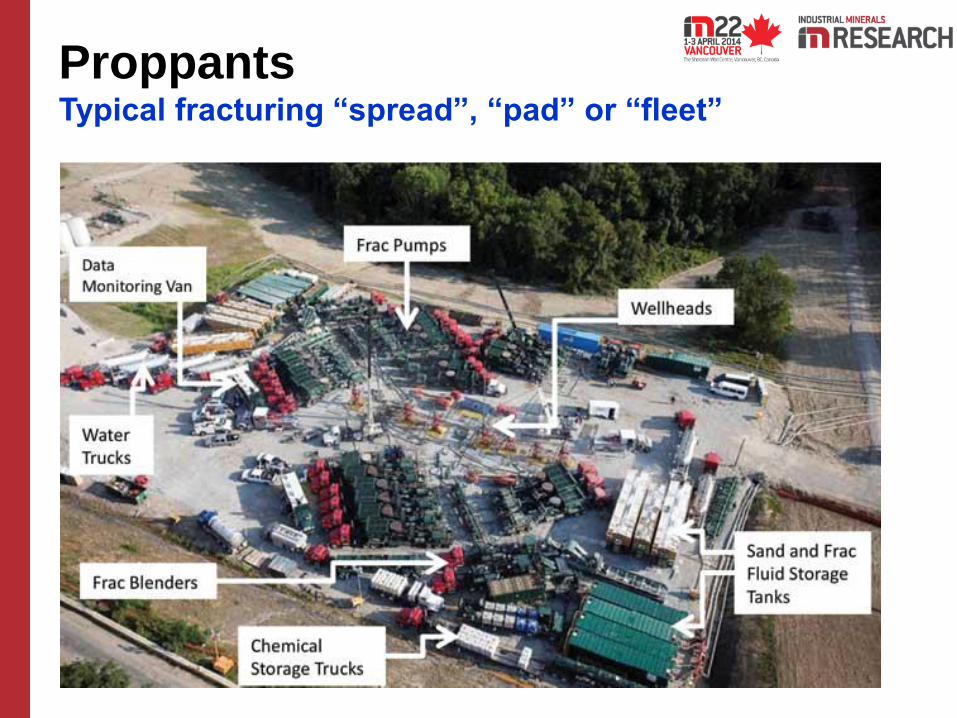
Proppants Typical fracturing “spread”, “pad” or “fleet”

Largest fracturing treatment = 661,500lbs
ceramic proppant @ 10,000HP
Proppants Example: Priobskoe oilfield, Western Siberia

• walnut shells
• silica sand
• alumino-silicates
• resin coated proppants
• fused zirconia
• plastic pellets
• steel shot
• glass beads
• aluminium pellets
• fly ash
“The ideal proppant is one that has:
• the specific gravity of water,
• the strength of iron,
• and is cheaper than dirt!”
Proppants Made from a variety of raw materials

Silica sand (“frac sand”) Ceramic proppants
Resin coated proppants
Proppants Primary proppant categories

Silica sand (“frac sand”) Ceramic proppants
Derived from silica sand
deposits, 99% SiO2
Derived mainly from
calcined bauxite, kaolin,
blends of bauxite & kaolin,
>50% Al2O3
(also magnesium silicate,
high purity alumina)
Proppants Primary proppant categories
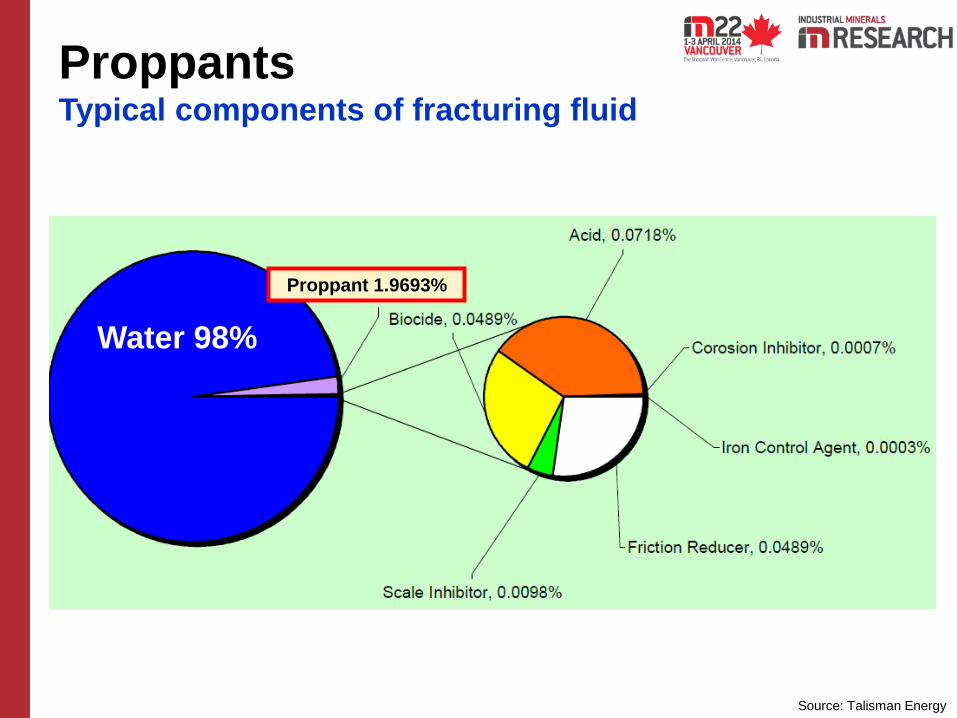
Proppants Typical components of fracturing fluid
Water 98%
Proppant 1.9693%
Source: Talisman Energy

American Petroleum
Institute
API RP 56
API RP 60
• Chemical composition
• Size fraction
• Roundness & sphericity
• Crush resistance
• Acid solubility
• Turbidity
Proppants Specifications

Frac sand
Quartz composition
99+% SiO2
Ceramic proppants
Alumina composition
>50% Al2O3
Proppants Specifications

90% to fall within range
Proppants Specifications

Source: redrawn from
Krumbein & Sloss 1955
API
≥ 0.6
Proppants Specifications
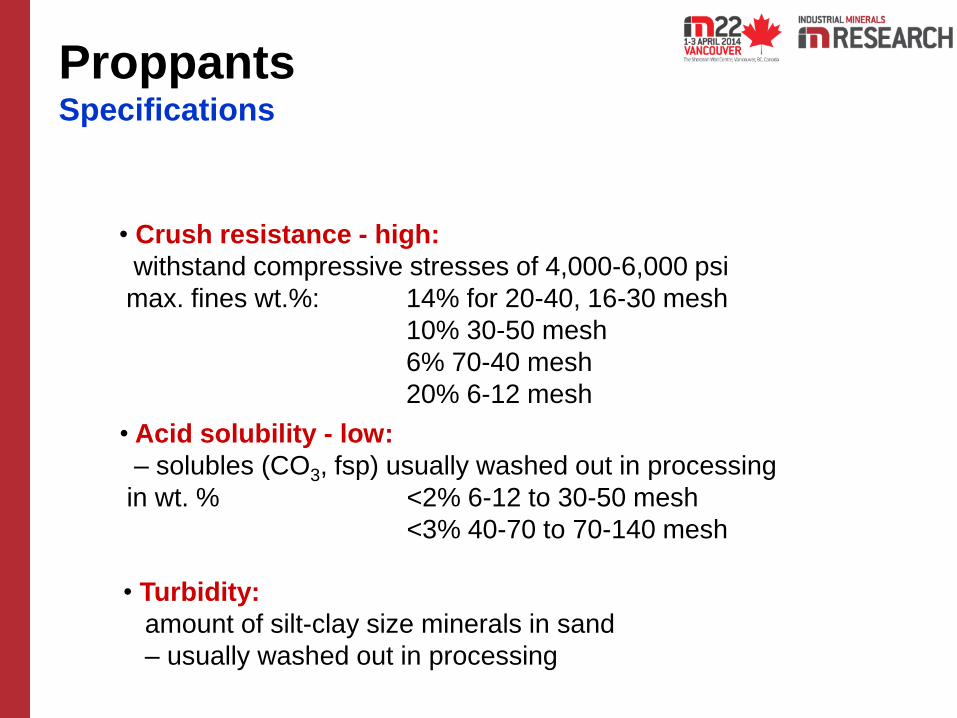
• Crush resistance - high:
withstand compressive stresses of 4,000-6,000 psi
max. fines wt.%: 14% for 20-40, 16-30 mesh
10% 30-50 mesh
6% 70-40 mesh
20% 6-12 mesh
• Acid solubility - low:
– solubles (CO3, fsp) usually washed out in processing
in wt. % <2% 6-12 to 30-50 mesh
<3% 40-70 to 70-140 mesh
• Turbidity:
amount of silt-clay size minerals in sand
– usually washed out in processing
Proppants Specifications

Source: IM Research
Proppants Proppant comparison
Source: IM Research
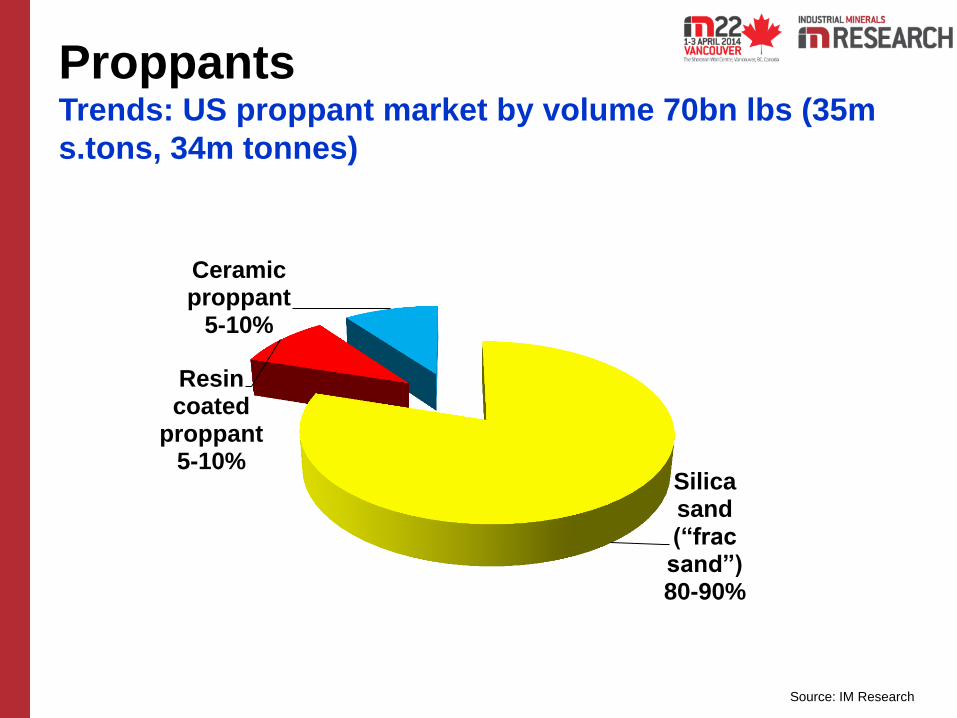
Proppants Trends: US proppant market by volume 70bn lbs (35m
s.tons, 34m tonnes)
Silica sand (“frac sand”) 80-90%
Resin coated
proppant 5-10%
Ceramic proppant
5-10%
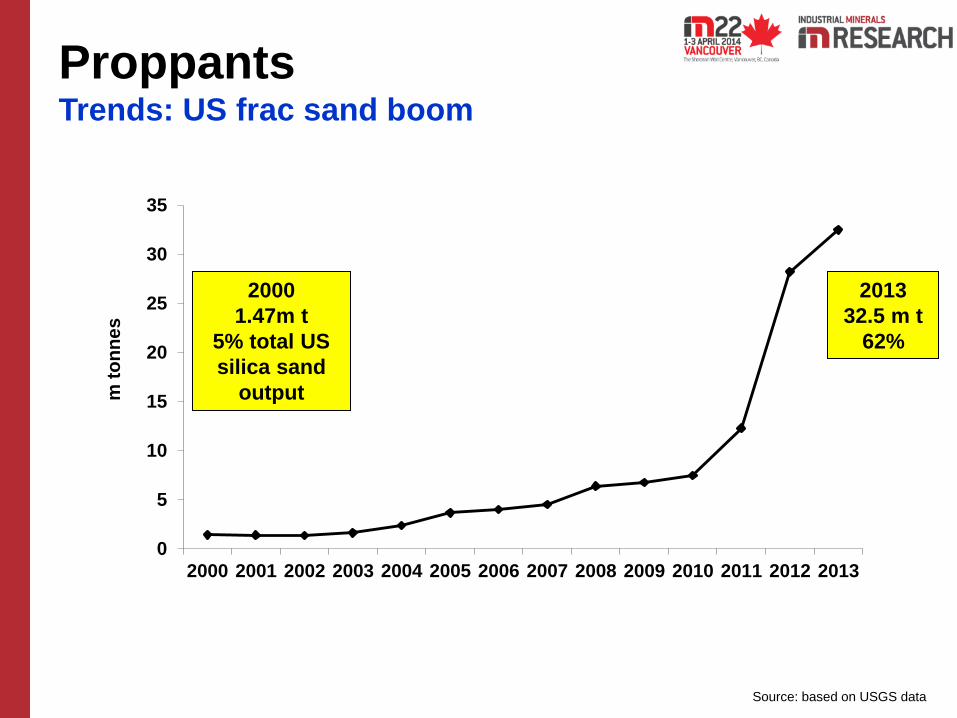
Source: based on USGS data
0
5
10
15
20
25
30
35
2000 2001 2002 2003 2004 2005 2006 2007 2008 2009 2010 2011 2012 2013
m t
on
nes
2000
1.47m t
5% total US
silica sand
output
2013
32.5 m t
62%
Proppants Trends: US frac sand boom

Source: Imerys 2014
Potential market demand Trends: World proppant demand growth
tonnes
Source: EIA
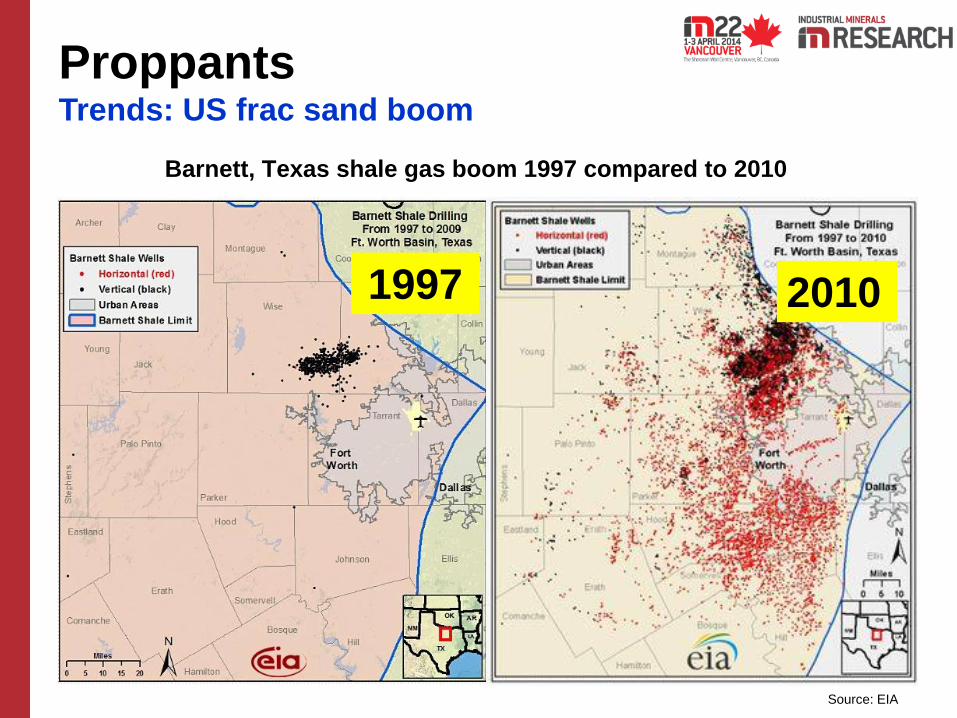
Proppants Trends: US frac sand boom
Barnett, Texas shale gas boom 1997 compared to 2010
1997 2010

Proppants Trends: Key US frac sand deposits
Cambrian-Ordovician
sandstone formations
• St Peter (Ottawa):
MN, MS, IL, NE, SD, WI
• Hickory (Brady): TX
• Jordan: MN, WI
• Wonowoc: WI
• Mt Simon: IL, MN, OH, WI
• Riley: TX
• Old Creek: OK
• Bidahochi: AZ
• river deposits
• inter-coastal plain deposits
• dune deposits

State of Wisconsin, USA
Frac sand operations
October 2013:
84 operational
15 in development
25 permitted
17 proposed
4 stalled
Source: Wisconsin Center for Investigative Journalism
Proppants Trends: US frac sand boom; Wisconsin hub

Mine/plant truck Transload rail Transload truck Frack pad
Proppants Trends: logistics factor paramount

Typical requirements of a 30-stage frac well • 40 rail car loads from
source to transload facility
• 160 truck loads from
transload to well site
Proppants Trends: logistics factor paramount
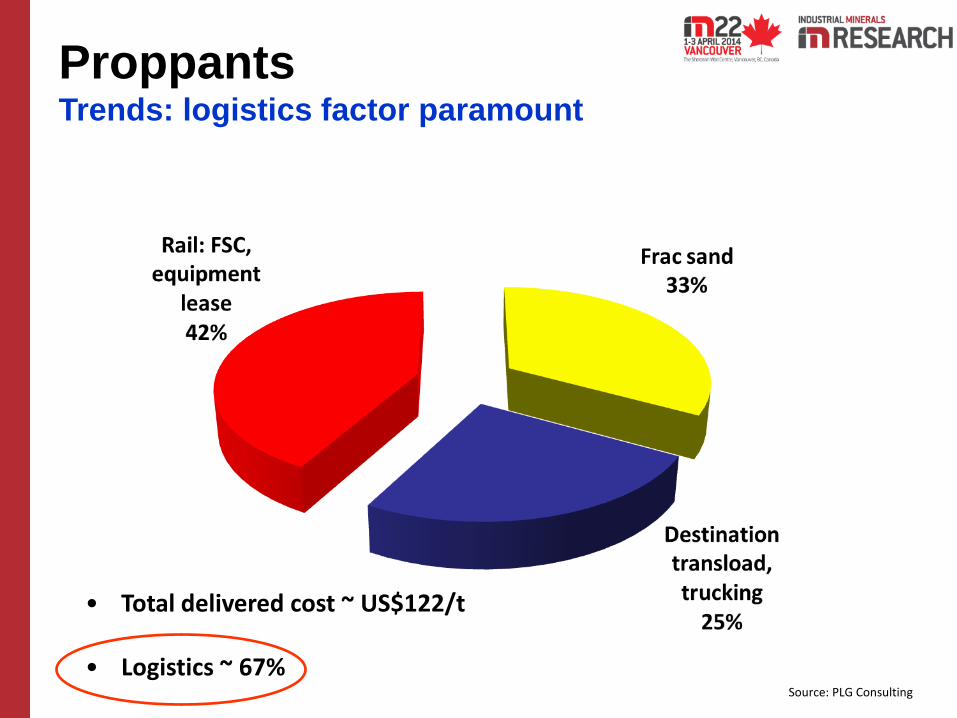
Source: PLG Consulting
• Total delivered cost ~ US$122/t • Logistics ~ 67%
Proppants Trends: logistics factor paramount

Preferred Sands running own rail
line for frac sand freight
13 January 2012
US Silica opens new storage facility in Ohio
4 October 2012
Santrol rail terminals expand proppant
supply to Eagle Basin
28 August 2012
Canadian Railway to service
2.4m tpa frac sand facility
14 August 2012
Frac sand partnership for Smart Sand
and Canadian Pacific
19 July 2012
US Silica inks rail freight deal with
Canadian Pacific
27 June 2012
Unimin secures long-term rail agreement
for Wisconsin sand
16 March 2012
Halliburton goes large with
new frac sand terminal
June 2013
Frac sand storage facility to open in N.
Dakota – Unimin, CP
13 August 2013
Jumbo bins cuts costs for frac sand
logistics
6 August 2013
CN frac sand revenue up 52% Q2
26 July 2013
Proppants Trends: logistics factor paramount

From Russia
Proppants Trends: ceramic proppant imports
From China
M/V Macuru Arrow at the Port of
Olympia, WA, unloading bagged
ceramic proppants
China Ceramic Proppant (Guizhou) Ltd,
Xiuwen, Guizhou in Bakken, N Dakota

Source: bauxite province map Hill & Sehnke 2007
Bauxitic kaolin: Alabama
Bauxite: Arkansas
Kaolin: Georgia Carbo Ceramics, AR, AL
Imerys, GA
Saint-Gobain, AR
CoorsTek, CO
Bauxite, Minas Gerais Mineracao Curimbaba, MG
Bauxite: Henan,
Guizhou,
Shanxi, Sichuan ~100 producers
Kaolin:
Novgorod Borovichi,
Novgorod
Serpentinite (MgSiO2):
Sverdlovsk Fores, Chelyabinsk
Bauxite, kaolin:
north India Hallmark,
Maharashtra
Proppants Trends: CP producer proximity to raw material source
Bauxite:
Komi Carbo,
Kopeysk

Source: based on ITC data; HS code 691490
articles of ceramics not elsewhere specified
194% growth in Chinese
ceramic proppant exports
Proppants Trends: China major CP exporter

USA
83%
697,657 t
US$540/t
Chinese ceramic
proppant export
markets
Source: based on ITC data; HS code 691490
articles of ceramics not elsewhere specified
Proppants Trends: China major CP exporter
2012:897,237 tonnes, US$604m. (US$673/t)

Source: based on ITC data; HS code 691490
articles of ceramics not elsewhere specified
Sharp rise in Chinese proppant
exports to emerging unconventional
oil and gas drilling regions
Proppants Trends: China major CP exporter

Source: Baker Hughes; ITC; HS code 691490 articles of ceramics not elsewhere specified
92
866
443
1,103
698 698
0
200
400
600
800
1,000
1,200
0
200
400
600
800
1,000
1,200
1,400
1,600
1,800
2,000
2008 2009 2010 2011 2012 2013
Vertical Horizontal
Directional Chinese proppant exports to US
Linear (Chinese proppant exports to US)
Increasing horizontal drilling & proppant imports
Baker
Hughes
Rig
Count
avg./yr
Ch
ine
se
ce
ram
ic p
rop
pa
nt e
xp
orts
(‘00
0s
ton
ne
s)
63% 29%
Source: based on ITC data; HS code 691490
articles of ceramics not elsewhere specified
VERTICAL
HORIZONTAL
DIRECTIONAL
Proppants Trends: China major CP exporter
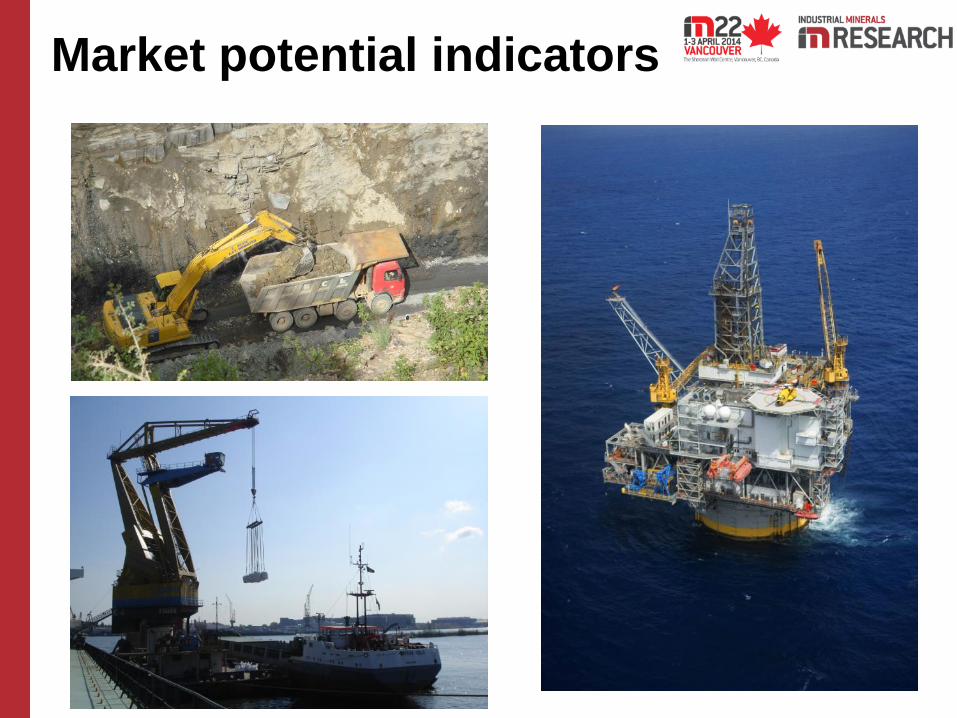
Market potential indicators

Market potential World overview
Source: World Energy Outlook 2013, IEA
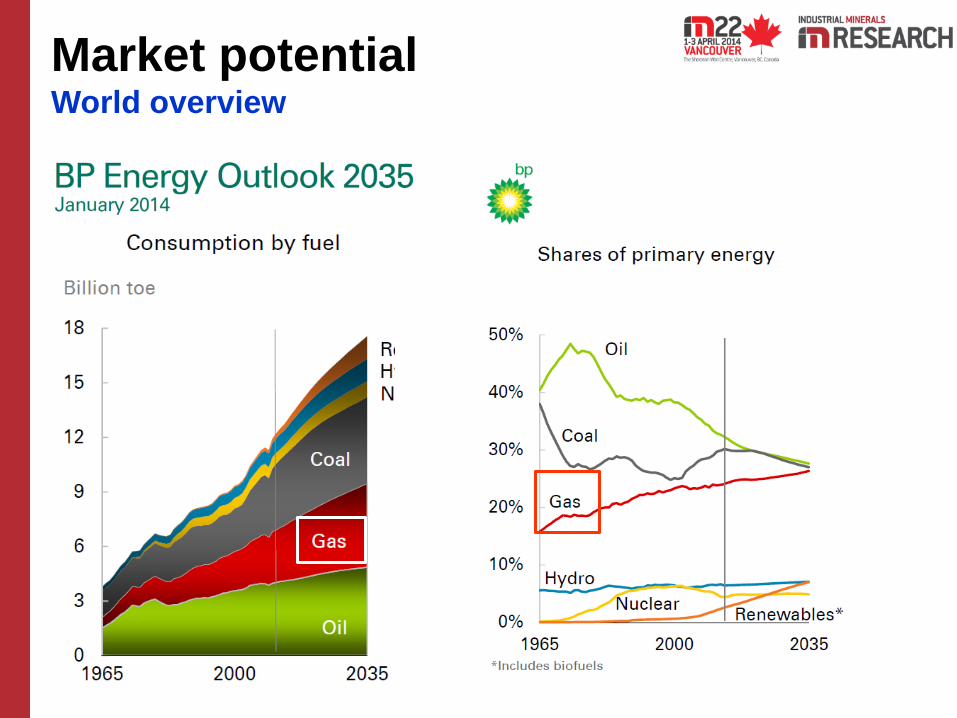
Market potential World overview

Market potential World overview
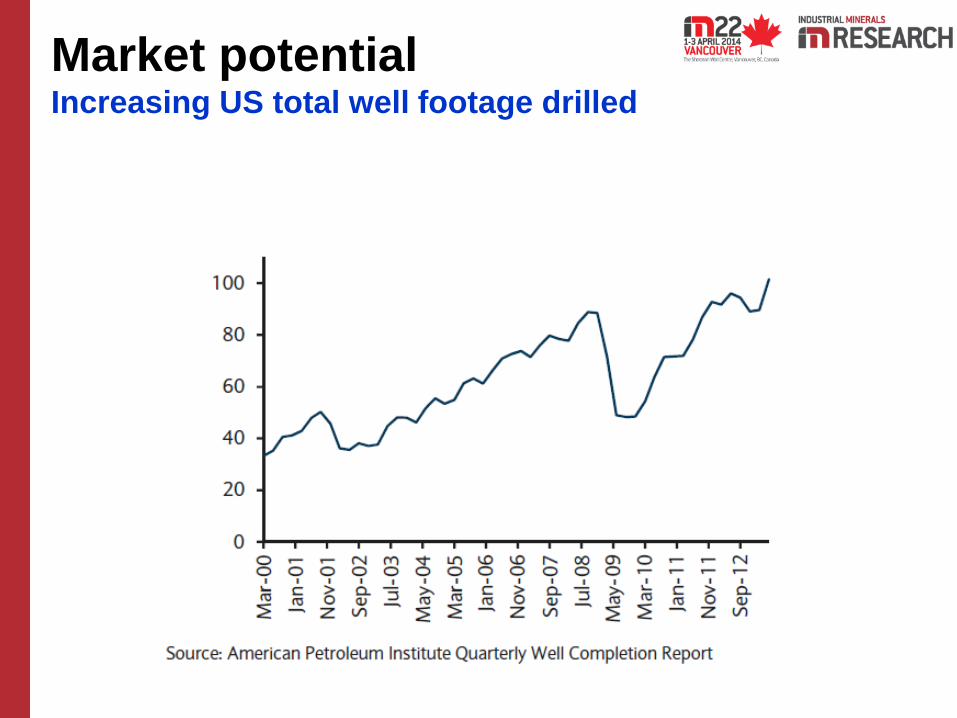
Market potential Increasing US total well footage drilled
China
USA
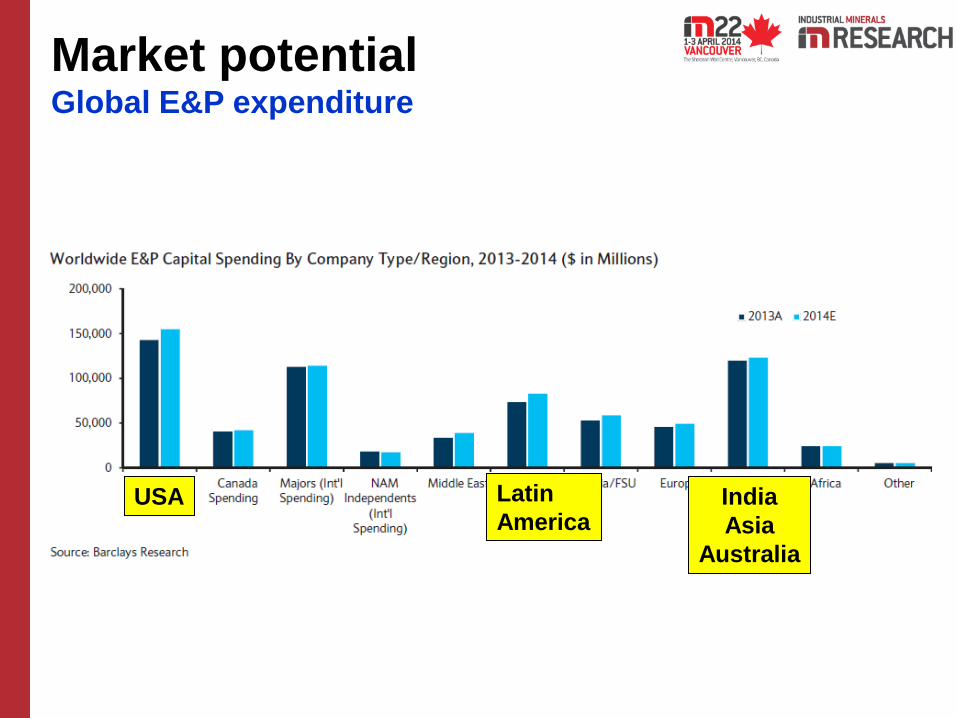
Market potential Global E&P expenditure
China
USA USA Latin
America India
Asia
Australia

Market potential Increasing E&P expenditure
China
USA

Market potential US shale gas and tight oil to contribute to future energy
China
USA
Source: EIA

Market potential US shale gale to continue: shale gas share of US energy
production
China
USA

Market potential World overview – Chinese consumption
China
USA

Market potential Unconventional resource potential
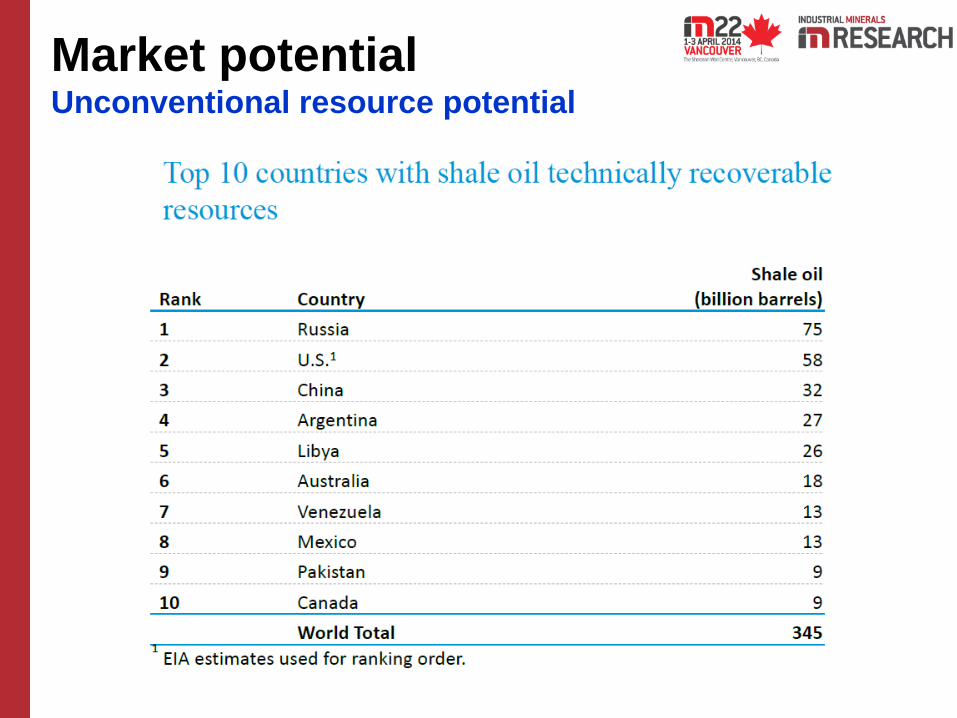
Market potential Unconventional resource potential

Market potential Asia Pacific shale gas & oil potential
IEA: SEA energy demand
to increase by 80% to 2035 96.3, 5%
46.5, 3%
4.4, 0%5.4, 0%105.2, 6%
436.7, 24%
1115.1, 62%
Australia
China
India
Indonesia
Mongolia
Pakistan
Thailand
3.7, 5%
7.94, 11%
3.4, 5%
9.09, 12%
32.18, 43%
17.49, 24%
Shale gas (tcf)
Shale oil (bbo)
Source: EIA June 2013

Market potential World proppant demand growth
World demand for well stimulation materials projected to increase
>12% p.a. to over 65m tonnes 2017, $23bn
2007 2012 2017 Annual growth %
‘000s tonnes 2007-12 2012-17
USA 7,582 28,630 48,240 30.4 11.0
Canada 1,669 4,162 8,930 20.1 16.5
China 316 1,373 2,585 34.2 13.5
Russia 560 1,074 2,155 13.9 14.9
Other 713 1,544 3,310 16.7 16.5
World 10,840 36,783 65,220 27.7% 12.1%
Source: Freedonia 2013

Market potential US proppant market growth
Source: PacWest Consultants 2013
Annual growth
Frac sand 9%
RCS 7%
CP 12%

Market potential US proppant market growth
Source: Halliburton 2013
Drivers: eg. Woodford, TX
More proppant used per well
(avg. lbs/well)
39% increase 2006-2012
to 2,300,000 lbs/well
(1,150 s. tons, 1,043 tonnes)
Elsewhere can be up to
6,000,000 lbs/well
(3,000 s.tons, 2,721 tonnes)
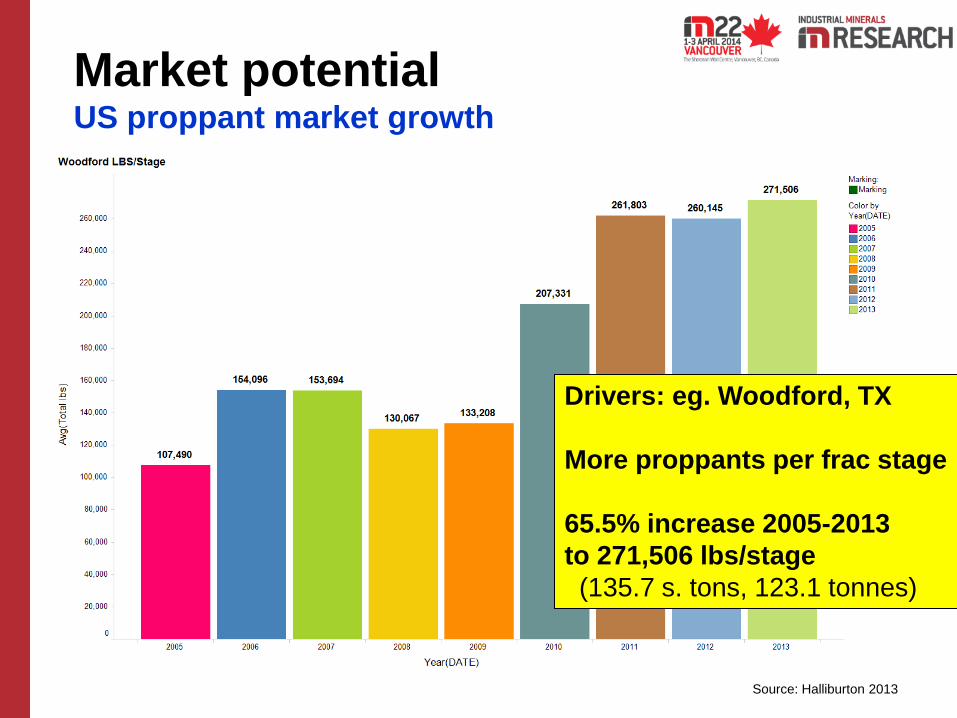
Drivers: eg. Woodford, TX
More proppants per frac stage
65.5% increase 2005-2013
to 271,506 lbs/stage
(135.7 s. tons, 123.1 tonnes)
Market potential US proppant market growth
Source: Halliburton 2013

Market potential Chinese shale gas development outlook
Drivers:
China’s energy demand
Shift to shale, tight, CBM
Shale gas
Standard Chartered Research Sept. 2013:
expect shale gas output in China to grow 85%
p.a. during 2015-2020 to reach 61bn cm 2020…
shale gas will account for 15% of China’s total
gas supply in 2020, and 30% in 2030

Market potential Chinese shale gas development outlook
= Increased drilling and fracturing activity

Conclusions
• Overall, industrial mineral demand for oil and gas drilling is assured
• Significant shift of focus of energy production to Asia Pacific where
consumption expected to grow rapidly
• North America (Mexico) and Asia Pacific expected to be major growth
markets, followed by Middle East and Latin America
• For barite: if prices remain stable, new sources will emerge to feed
expanding and new processing plants; China and India will be
challenged; wider acceptance of 4.0 and 4.2 SG grades; move to
establish regional sources of supply
• For proppants: N. America will continue to be a growth market; frac
sand logistics factors will streamline US supply sector; more suppliers
of CP will emerge, especially to supply new overseas growth markets;
= bauxite deposit development; Watch out for China shale gas market
evolution next 5 years and its impact on world CP trade
• Energy production and consumption increasing driving E&P growth

Conclusions New shale gas potential growth markets
1
2
3
4
5

Thank you