Industrial & Labor Relations Review - David Carddavidcard.berkeley.edu/papers/affirm-action.pdfDavid...
21
Industrial & Labor Relations Review Volume 58, Issue 3 2005 Article 6 Would the Elimination of Affirmative Action Affect Highly Qualified Minority Applicants? Evidence from California and Texas David Card * Alan B. Krueger † * University of California–Berkeley, † Princeton University, Copyright c 2005 by the authors. All rights reserved. No part of this publication may be reproduced, stored in a retrieval system, or transmitted, in any form or by any means, elec- tronic, mechanical, photocopying, recording, or otherwise, without the prior written permis- sion of the publisher, bepress, which has been given certain exclusive rights by the author. In- dustrial & Labor Relations Review is produced by The Berkeley Electronic Press (bepress). http://digitalcommons.ilr.cornell.edu/ilrreview
-
Upload
nguyenhuong -
Category
Documents
-
view
217 -
download
2
Transcript of Industrial & Labor Relations Review - David Carddavidcard.berkeley.edu/papers/affirm-action.pdfDavid...
Industrial & Labor Relations ReviewVolume58, Issue3 2005 Article 6
Would the Elimination of Affirmative ActionAffect Highly Qualified Minority Applicants?
Evidence from California and Texas
David Card∗ Alan B. Krueger†
∗University of California–Berkeley,†Princeton University,
Copyright c©2005 by the authors. All rights reserved. No part of this publication may bereproduced, stored in a retrieval system, or transmitted, in any form or by any means, elec-tronic, mechanical, photocopying, recording, or otherwise, without the prior written permis-sion of the publisher, bepress, which has been given certain exclusive rights by the author.In-dustrial & Labor Relations Review is produced by The Berkeley Electronic Press (bepress).http://digitalcommons.ilr.cornell.edu/ilrreview

Would the Elimination of Affirmative ActionAffect Highly Qualified Minority Applicants?
Evidence from California and Texas∗
David Card and Alan B. Krueger
Abstract
Between 1996 and 1998 California and Texas eliminated the use of affirmative action in col-lege and university admissions. At the states’ elite public universities admission rates of blackand Hispanic students subsequently fell by 30–50% and minority representation in the enteringfreshman classes declined. This study investigates whether the elimination of affirmative actionchanged minority students’ college application behavior. A particular concern is that highly qual-ified minorities—who were not directly affected by the policy change— would be dissuaded fromapplying to elite public schools, either because of reduced campus diversity or because of un-certainty about their admission prospects. The authors use information from SAT takers in thetwo states to compare the fractions of minority students who sent their test scores to selectivestate institutions before and after the elimination of affirmative action. They find no change in theSAT-sending behavior of highly qualified black or Hispanic students.
KEYWORDS: affirmative action, minority applicants, college and university admissions, blackstudents, Hispanic students, college application behavior
∗The authors are grateful to Jesse Rothstein, Melissa Clark, Martin Kurzweil, and Stacy Dale Bergfor valuable assistance, and to participants at the Berkeley Labor Lunch for comments. They alsothank the Andrew Mellon Foundation for financial support and the College Board for making thedata available.

416
Industrial and Labor Relations Review, Vol. 58, No. 3 (April 2005). © by Cornell University.0019-7939/00/5803 $01.00
S
WOULD THE ELIMINATION OF AFFIRMATIVE
ACTION AFFECT HIGHLY QUALIFIED MINORITY
APPLICANTS? EVIDENCE FROM CALIFORNIA AND TEXAS
DAVID CARD and ALAN B. KRUEGER*
Between 1996 and 1998 California and Texas eliminated the use of affirmativeaction in college and university admissions. At the states’ elite public universi-ties admission rates of black and Hispanic students subsequently fell by 30–50%and minority representation in the entering freshman classes declined. Thisstudy investigates whether the elimination of affirmative action changed minor-ity students’ college application behavior. A particular concern is that highlyqualified minorities—who were not directly affected by the policy change—would be dissuaded from applying to elite public schools, either because ofreduced campus diversity or because of uncertainty about their admissionprospects. The authors use information from SAT takers in the two states tocompare the fractions of minority students who sent their test scores to selectivestate institutions before and after the elimination of affirmative action. Theyfind no change in the SAT-sending behavior of highly qualified black orHispanic students.
*David Card is Professor of Economics, Universityof California–Berkeley, and Alan B. Krueger is Profes-sor of Economics, Princeton University. The authorsare grateful to Jesse Rothstein, Melissa Clark, MartinKurzweil, and Stacy Dale Berg for valuable assistance,and to participants at the Berkeley Labor Lunch forcomments. They also thank the Andrew Mellon Foun-dation for financial support and the College Boardfor making the data available.
The SAT data used in this paper are used under aconfidentiality agreement from the College Board.Copies of the computer programs used to generatethe tables will be provided on request to the firstauthor at Department of Economics, University ofCalifornia, 549 Evans Hall #3880, Berkeley, CA 94720-3880; [email protected].
ince the late 1960s many of the nation’selite colleges and universities have used
affirmative action policies to boost the ad-mission rates of black and Hispanic stu-
dents.1 Although the status of affirmativeaction at state-run institutions has alwaysbeen controversial, the Supreme Court’s1978 Bakke decision created a legal foot-hold by permitting the use of race as onefactor in the evaluation of applicants. Inthe 1990s, however, affirmative action cameunder renewed political and legal attack,and between 1996 and 1998 California andTexas halted the use of race-based admis-
1See Bowen and Bok (1998:1–14) for a brief his-tory of affirmative action policies in college admis-sions. Kane (1998) summarized the extent of affirma-tive action at elite institutions in the mid-1990s.Throughout this paper, we use “minority” to refer toAfrican-American and Hispanic students. These twogroups, plus American Indians, are classified as “un-der-represented minorities” by the University of Cali-fornia and many other institutions.

AFFIRMATIVE ACTION AND HIGHLY QUALIFIED MINORITIES 417
sion preferences. The effect on minorityadmissions at the top public universities inthe two states was immediate. At UC Berke-ley the fraction of black and Hispanic appli-cants who were offered admission fell fromone-half to one-quarter. At Texas A&M theadmission rates of black and Hispanic ap-plicants fell from 90% to 70%. The de-clines in admission rates led to propor-tional declines in the fractions of enteringminority freshmen at these campuses, trig-gering concern about the effects on cam-pus diversity.2
A concern of many analysts was that theelimination of affirmative action would havean unintended effect on highly qualifiedminority applicants. To the extent thatthese students value racial and ethnic di-versity, the drop in minority admission ratesat the top public schools in California andTexas might lead them to apply elsewhere,intensifying the impact of the switch torace-blind admissions. Moreover, givenuncertainty about admission prospects, theelimination of affirmative action couldcause even highly qualified minority appli-cants to redirect their search toward lesscompetitive public schools or private col-leges where affirmative action remained ineffect or where admissions standards weremuch lower.3
In this paper we use micro data for thepopulation of SAT takers in California andTexas to track changes in the fraction ofminority students who sent their scores toselective public colleges and universities
following the elimination of affirmativeaction. Both California and Texas requirethe SAT test (or the alternative ACT test)for admission to public four-year collegesand universities.4 Although the list ofschools designated to receive a student’stest scores is not exactly the same as the listthat receive an application, an analysis oftwo different data sets shows a very highcorrelation between the number of stu-dents applying to an institution and thenumber sending their test scores there. Inlight of this, we use data on SAT takers totest whether the elimination of affirmativeaction in Texas and California led to anychanges in the propensity of minority stu-dents to apply to the most selective publicinstitutions. We also examine other out-comes, including the number of schoolsdesignated to receive scores and the lowerquality bound of the schools on the list.Our analysis pertains to a period before theSupreme Court ruled in 2003 that, “nar-rowly tailored,” race can be taken into ac-count as one factor among many in admis-sions decisions in the Gratz v. Bollinger andGrutter v. Bollinger cases.
Affirmative Action andAdmissions at Selective Public
Institutions in California and Texas
The Situation before 1996
In the mid-1990s a relatively high frac-tion of minority students at the Universityof California (UC) were admitted “by ex-ception”—that is, by a process that bypassedthe standards for high school grade pointaverages and standardized test scores. Forexample, in 1996, 23% of black freshmanenrollees and 11% of Hispanic enrolleeswere classified as admitted by exception,compared with approximately 2% of Asianand white enrollees (UC Office of the Presi-dent 1998). Most of the exceptional
2For example, the minority share of entering fresh-men at Berkeley fell from 22% in fall 1997 (the lastcohort admitted with race preferences) to 12% in1998, while at Texas A&M the minority share ofentering freshmen fell from 20% in 1995 to 12% in1997. Sources for these statistics are described in thenext section.
3If some highly qualified minority students feelstigmatized by being identified as members of a less-qualified group, they may actually prefer institutionswith race-blind admissions, leading to a rise in appli-cations after the lifting of affirmative action. Theevidence on such stigma effects is limited—see Turnerand Pratkanis (1994).
4Only a small fraction of students in California andTexas take the ACT and not the SAT; see Clark(2003).
418 INDUSTRIAL AND LABOR RELATIONS REVIEW
Tab
le 1
. C
har
acte
rist
ics
of F
resh
man
Ap
pli
can
ts, A
dm
itte
es, E
nro
llee
s, a
nd
SA
T T
aker
s in
199
5.
Perc
ent
Enro
llee
Min
orit
yA
llM
inor
itie
sA
llM
inor
itie
sPc
t. M
inor
ity
Pct.
Min
orit
yA
llM
inor
itie
sA
llM
inor
itie
s(1
)(2
)(3
)(4
)(5
)(6
)(7
)(8
)(9
)(1
0)(1
1)
Cal
ifor
nia
UC
LA
22.1
43.1
52.1
35.5
39.5
29.9
23.4
1105
954
57.6
40.1
San
Die
go15
.559
.552
.624
.719
.110
.616
.811
2697
957
.641
.5B
erke
ley
19.2
39.9
53.6
39.0
35.8
23.6
18.8
1155
1003
64.8
47.6
San
ta B
arb
ara
18.8
81.7
75.1
23.1
22.5
16.8
17.5
1090
967
48.2
37.5
Dav
is15
.371
.881
.026
.419
.116
.514
.311
0998
756
.844
.1Ir
vin
e19
.874
.368
.725
.521
.315
.217
.210
8095
551
.339
.4Sa
nta
Cru
z21
.785
.186
.119
.218
.421
.017
.910
8696
043
.833
.7R
iver
sid
e24
.779
.577
.620
.924
.928
.723
.110
3692
343
.834
.0
Tex
as UT
Au
stin
19.7
94.1
97.8
47.6
41.7
19.5
26.2
1077
967
56.8
46.9
Tex
as A
&M
15.1
74.2
89.0
57.1
51.0
19.6
20.7
1063
965
57.8
46.6
Tex
as T
ech
18.5
100.
010
0.0
45.8
38.2
14.6
19.9
1014
911
48.8
37.3
S.W
. Tex
as30
.375
.868
.556
.852
.022
.826
.596
788
539
.431
.4U
niv
. Ho
ust
on
48.6
96.6
94.5
63.0
61.5
36.3
40.4
982
898
39.5
31.6
Un
iv. N
. Tex
as27
.176
.564
.552
.849
.516
.723
.210
0789
944
.916
.7
Not
es:
See
tex
t fo
r so
urc
es.
Ad
min
istr
ativ
e d
ata
for
Cal
ifo
rnia
per
tain
to
th
e Fa
ll 1
995
fres
hm
an c
oh
ort
of
Cal
ifo
rnia
res
iden
ts.
Yiel
d r
ate
is f
ract
ion
of
s tu
den
ts o
ffer
ed a
dm
iss i
on
wh
o m
atri
cula
t e.
Tex
as a
dm
issi
on
an
d y
ield
rat
es a
re b
ased
on
dat
a b
y et
hn
icit
y f o
r 19
95 f
irs t
tim
e fr
esh
man
rep
ort
ed i
n S
har
p (
1999
).N
um
ber
of
Tex
as a
pp
lica
nt s
an
d e
thn
ic d
i str
ibu
t io
n a
re b
ased
on
dat
a f o
r Fa
ll 1
998
firs
t -t i
me
Tex
as u
nd
erg r
adu
ate
app
l ica
nts
.
Dat
a fr
om S
AT
Tak
ers
Who
Sen
t Sc
ores
:
Adm
issi
on R
ates
:Y
ield
Rat
es:
Ave
rag e
SA
T:
GP
A A
– or
Bet
ter:

AFFIRMATIVE ACTION AND HIGHLY QUALIFIED MINORITIES 419
admittees were at the three most selectiveUC campuses: Berkeley, UCLA, and UCSan Diego. Comparable data for the selec-tive undergraduate institutions in Texas(Texas A&M University, University of Texasat Austin, Texas Tech University, South-west Texas State University, University ofHouston, and University of North Texas)are unavailable.5 Nevertheless, a survey ofadmission policies in Sharp (1999, Chap.2) suggests that the two most selective insti-tutions, Texas A&M and UT Austin, oper-ated significant affirmative action policiesin 1995.
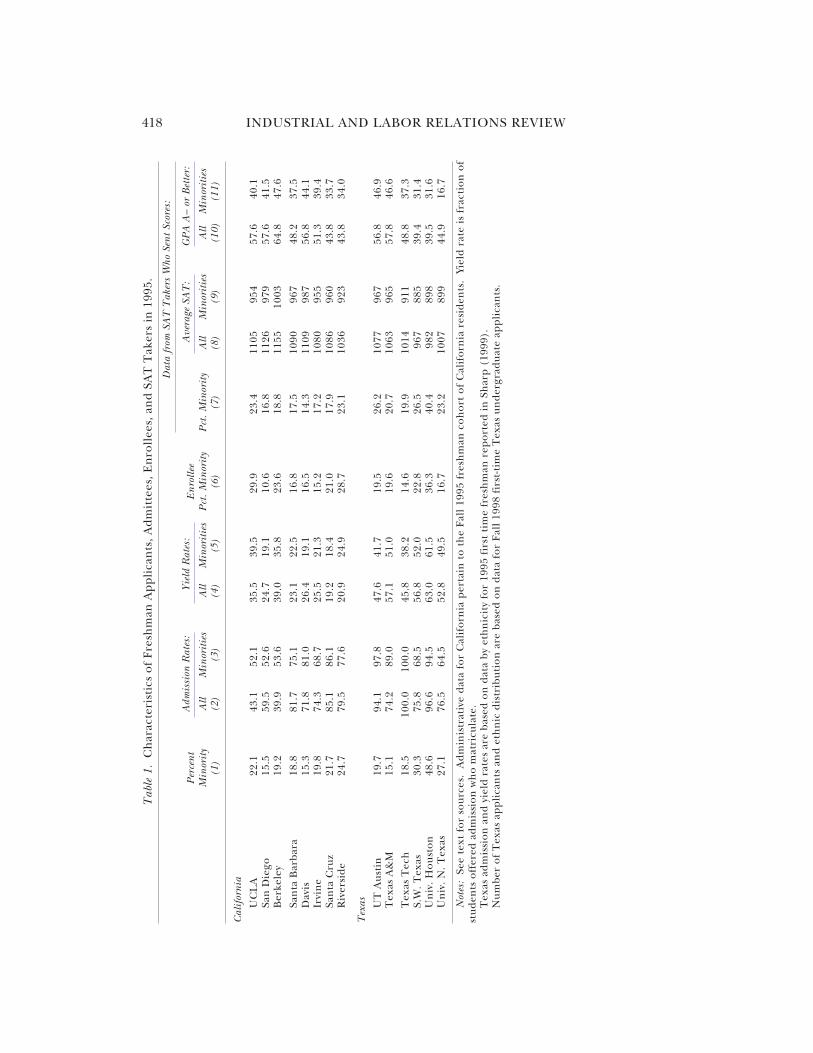
One indicator of the extent of affirma-tive action is the gap between admissionrates of minority and non-minority appli-cants. Table 1 presents admission data forthe eight UC campuses and the six selectiveTexas institutions in 1995, including theadmission rates of all applicants and ofminority applicants. We also show the char-acteristics of the “SAT-sending” pool foreach institution—the set of students whosent their SAT scores to the campus foradmission in fall 1994–96. Not all studentswho send their SAT scores actually apply toan institution, and some applicants takethe ACT rather than the SAT. Neverthe-less, as discussed below, we believe that theSAT-sending pool is a relatively good proxyfor the actual application pool.
Consistent with the existence of signifi-cant affirmative action programs, black andHispanic students were admitted at rela-tively high rates at the most selective Cali-fornia and Texas universities just prior tothe elimination of affirmative action. In-deed, at UCLA, Berkeley, UT Austin, andTexas A&M, minority applicants had higheradmission rates than other groups in 1995.
This is particularly remarkable in light ofthe gap in qualifications between minorityand non-minority SAT senders in the twostates. For example, the difference in aver-age SAT scores between minority SAT send-ers and the overall pool was about 150points at the three most selective UC cam-puses, and approximately 100 points at theother UC campuses and the Texas schools.Similarly, there was a 15–20 percentagepoint gap in the fraction of students with atleast an A-minus grade point average be-tween the overall SAT-sending pool andthe minority pool at the most selective UCcampuses, and a 10-point gap at the otherUC campuses and the Texas schools.
The high admission rates of minorityapplicants at UCLA, UC Berkeley, and TexasA&M, coupled with relatively high “yieldrates” of minority admittees (that is, thematriculation rate of those offered admis-sion), meant that the entering classes atthese campuses had even higher minorityrepresentation than the applicant pools(compare column 6 to column 1 in Table1). At most of the other selective institu-tions in the two states, the fraction of mi-nority enrollees was slightly lower than thefraction of minority applicants, reflecting acombination of lower minority admissionrates and lower minority enrollment ratesconditional on admission. The force ofaffirmative action programs was thereforemost visible at the elite public institutionsof California and Texas. Kane’s (1998)analysis suggests that the same was truenationwide: he concluded that the impactof affirmative action in the 1990s was con-fined to the most selective 20% of collegesand universities.
The Elimination of AffirmativeAction in California and Texas
In California the elimination of race-based admission policies arose through apolitical process. The UC Board of Re-gents, acting with the support of the Gover-nor, voted in 1995 to eliminate affirmativeaction in admissions starting in fall 1998(see National Association for College Ad-mission Counseling 2001). Before the
5We follow Sharp (1999) and Thomas (2002) indefining these six campuses as selective. University ofTexas schools, including UT Austin, offer “provi-sional admission” to all high school graduates withthe requisite number of high school courses. Thesestudents must earn a 2.0 GPA or better in summerclasses to enter in the fall. Because of this policy, it isunclear whether UT Austin should be consideredhighly selective.
420 INDUSTRIAL AND LABOR RELATIONS REVIEW
policy could take effect, however, an elec-tion was held on a statewide proposition(Proposition 209) outlawing affirmativeaction in public employment, education,and contracting. Proposition 209 was passedby voters in November 1996, but only be-came law after a year-long series of appeals.Affirmative action in UC admissions there-fore ended as originally planned by theRegents with the fall 1998 cohort.
The elimination of affirmative action inTexas stemmed from a 1992 lawsuit filed byCheryl Hopwood and others challengingthe constitutionality of admissions at theUniversity of Texas School of Law. Initiallythe federal district court ruled that the useof race-based admission preferences waslegal. On appeal, however, the Fifth Cir-cuit Court of Appeals reversed the lowercourt, declaring that the goal of a diversestudent body is “not of sufficient compel-ling interest to support the use of race as afactor in admissions” (Hopwood v. State ofTexas, 78 F.3d 932, 5th Circuit 1996). Afterthe Supreme Court refused to hear the
case, the Appeals Court ruling was inter-preted by the state Attorney General asoutlawing the use of racial preferences incollege admissions. Although the final sta-tus of the Hopwood decision was only clari-fied in time to affect freshman cohortsentering after 1997, some schools, includ-ing Texas A&M, appear to have begun theprocess of dismantling affirmative action ayear earlier (Sharp 1999:26), presumablyin response to the Appeals Court’s deci-sion.
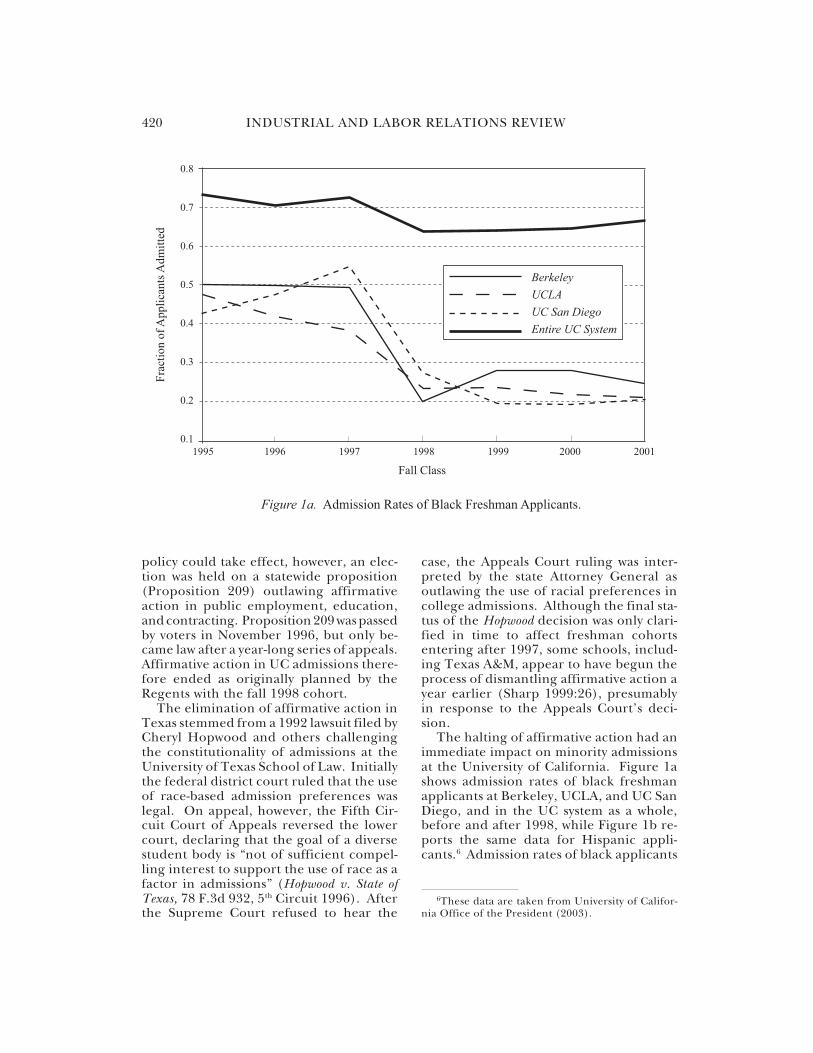
The halting of affirmative action had animmediate impact on minority admissionsat the University of California. Figure 1ashows admission rates of black freshmanapplicants at Berkeley, UCLA, and UC SanDiego, and in the UC system as a whole,before and after 1998, while Figure 1b re-ports the same data for Hispanic appli-cants.6 Admission rates of black applicants
Figure 1a. Admission Rates of Black Freshman Applicants.
0.8
0.7
0.6
0.5
0.4
0.3
0.2
0.1
Fall Class
1995 1996 1997 1998 1999 2000 2001
Fra
ctio
n o
f A
pp
lica
nts
Ad
mit
ted
Berkeley
UCLA
UC San Diego
Entire UC System
6These data are taken from University of Califor-nia Office of the President (2003).

AFFIRMATIVE ACTION AND HIGHLY QUALIFIED MINORITIES 421
at the three most selective campuses fellfrom 45–55% in the 1995–97 period to 20–25% in 1998–2001. Admission rates ofHispanic applicants show a similar decline,although there was a slight downward trendat UCLA and Berkeley even before 1998.7
Despite the large drops at these campuses,system-wide admission rates fell by muchless, reflecting the relative stability of mi-nority admission rates at UC Riverside (theleast selective UC campus) and UC SantaCruz.8
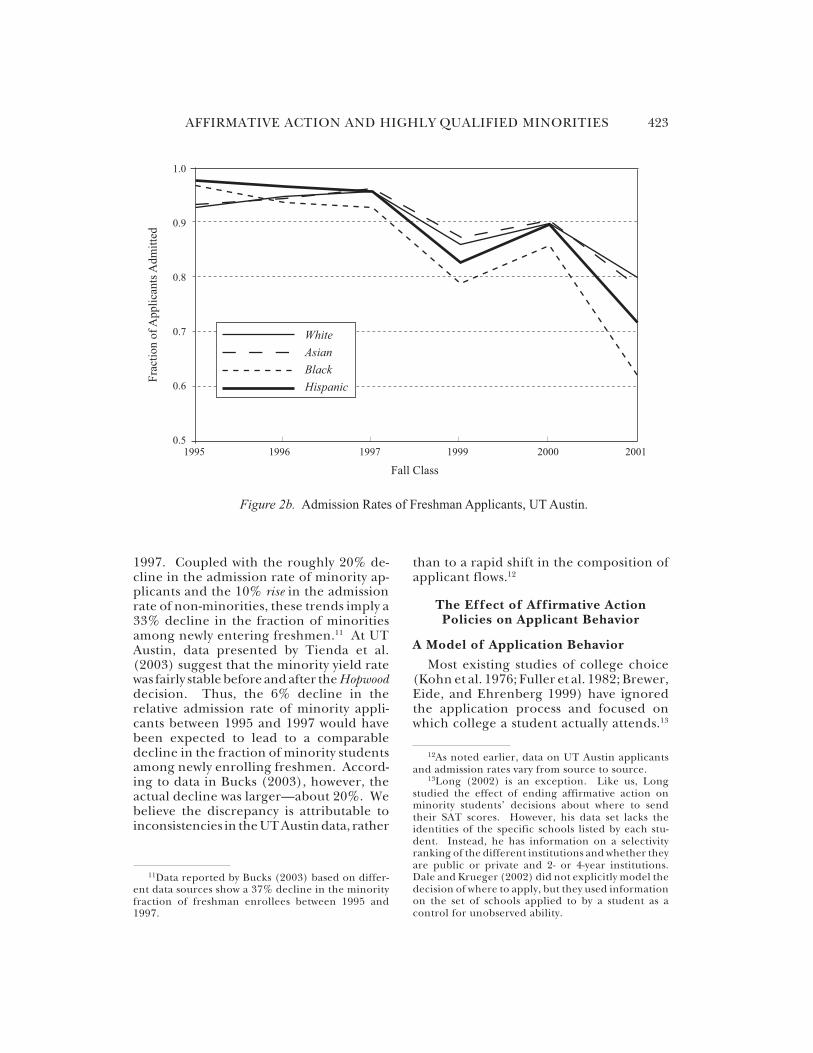
Evidence on the effects of ending affir-mative action in Texas is clouded by severalfactors, including year-to-year variability inadmission rates at the Texas schools, lack ofconsistent data (especially with respect toprovisionally admitted students), and theimplementation of a new policy in fall 1998that guaranteed automatic admission toany Texas campus for high school studentswho graduated in the top 10% of theirclass. Nevertheless, as shown in Figures 2aand 2b, available data suggest that the ad-mission rates of black and Hispanic fresh-man applicants at Texas A&M and UT Aus-tin both declined relative to the rates forwhites and Asians after 1996.9 As noted, the
Figure 1b. Admission Rates of Hispanic Freshman Applicants.
0.9
0.8
0.7
0.6
0.5
0.4
0.3
0.2
0.1
Fall Class
1995 1996 1997 1998 1999 2000 2001
Fra
ctio
n o
f A
pp
lica
nts
Ad
mit
ted
Berkeley
UCLA
UC San Diego
Entire UC System
7Although the data are not shown, admission ratesfor Asian and white applicants at the three campuseswere trending smoothly over the 1995–2001 period.
8Most UC applicants apply to several campuses,including one of the less selective campuses. At UCRiverside, average admission rates of black applicantswere 67% in 1995–97 and 68% in 1998–2001, whileaverage admission rates of Hispanic applicants were79% in 1995–97 and 80% in 1998–2001. At UC SantaCruz, average admission rates for blacks were 78% in1995–97 and 65% in 1998–2001, while for Hispanicsthe averages were 84% in 1995–97 and 77% in 1998–2001.
9The data in Figure 2 for 1995–97 are taken fromSharp (1999, Tables 1b and 2b) and refer to first-timeTexas freshman applicants. The 1999–2001 data aretaken from annual statistical summaries reported bythe Texas Higher Education Coordinating Board(THECB, various years), and also refer to first-timeTexas undergraduate applicants. The UT Austinadmission rate data include provisional admits asadmitted.

422 INDUSTRIAL AND LABOR RELATIONS REVIEW
decline at Texas A&M began with the 1996entering cohort and continued with 1997cohort. Assuming that minority admissionrates in 1995 provide a valid counterfactualfor admissions in the absence of Hopwood,we estimate that the elimination of affirma-tive action at Texas A&M lowered Hispanicadmission rates by 15 percentage pointsand black admission rates by 30 percentagepoints. At UT Austin a similar pattern isdiscernible, although the relative declinein minority admittance rates continued af-ter 1997. In particular, black and Hispanicadmission rates fell by 5–7 percentage pointsrelative to admission rates of whites andAsians between 1995 and 1997, and by an-other 4–5 percentage points between 1997and 2001.
Even holding constant applicant behav-ior, the effects of ending affirmative actionon the makeup of the student body dependon the relative admission rate of minoritystudents and on the relative fraction ofadmitted minority students who decide toenroll (that is, the relative yield rate). At
the three most selective UC campuses therelative yield rate of minority students roseslightly between 1997 and 1998 (by about10%), partially offsetting the 50–60% de-clines in minority admission rates.10 Never-theless, the short-run effect of ending affir-mative action was a sharp decline in theethnic diversity of entering freshmen. Be-tween 1997 and 1998 the fraction of mi-norities in the freshman class fell from 22%to 12% at UC Berkeley; from 22% to 15% atUCLA; and from 13% to 10% at UC SanDiego.
At Texas A&M, data reported by Sharp(1999, Table 1b) show a small (3%) relativedecline in the yield rate of minority versusnon-minority admittees between 1995 and
10The rise in enrollment rates of admitted minori-ties may have been due in part to the change in thecomposition of the admitted minority pool, and inpart to efforts of the UC campuses to increase minor-ity yield rates after the elimination of affirmativeaction.
Figure 2a. Admission Rates of Freshman Applicants, Texas A&M University.
1.0
0.9
0.8
0.7
0.6
0.5
Fall Class
1995 1996 1997 1999 2000 2001
Fra
ctio
n o
f A
pp
lica
nts
Ad
mit
ted
White
Asian
Black
Hispanic
AFFIRMATIVE ACTION AND HIGHLY QUALIFIED MINORITIES 423
1997. Coupled with the roughly 20% de-cline in the admission rate of minority ap-plicants and the 10% rise in the admissionrate of non-minorities, these trends imply a33% decline in the fraction of minoritiesamong newly entering freshmen.11 At UTAustin, data presented by Tienda et al.(2003) suggest that the minority yield ratewas fairly stable before and after the Hopwooddecision. Thus, the 6% decline in therelative admission rate of minority appli-cants between 1995 and 1997 would havebeen expected to lead to a comparabledecline in the fraction of minority studentsamong newly enrolling freshmen. Accord-ing to data in Bucks (2003), however, theactual decline was larger—about 20%. Webelieve the discrepancy is attributable toinconsistencies in the UT Austin data, rather
than to a rapid shift in the composition ofapplicant flows.12
The Effect of Affirmative ActionPolicies on Applicant Behavior
A Model of Application Behavior
Most existing studies of college choice(Kohn et al. 1976; Fuller et al. 1982; Brewer,Eide, and Ehrenberg 1999) have ignoredthe application process and focused onwhich college a student actually attends.13
11Data reported by Bucks (2003) based on differ-ent data sources show a 37% decline in the minorityfraction of freshman enrollees between 1995 and1997.
12As noted earlier, data on UT Austin applicantsand admission rates vary from source to source.
13Long (2002) is an exception. Like us, Longstudied the effect of ending affirmative action onminority students’ decisions about where to sendtheir SAT scores. However, his data set lacks theidentities of the specific schools listed by each stu-dent. Instead, he has information on a selectivityranking of the different institutions and whether theyare public or private and 2- or 4-year institutions.Dale and Krueger (2002) did not explicitly model thedecision of where to apply, but they used informationon the set of schools applied to by a student as acontrol for unobserved ability.
Figure 2b. Admission Rates of Freshman Applicants, UT Austin.
1.0
0.9
0.8
0.7
0.6
0.5
Fall Class
Fra
ctio
n o
f A
pp
lica
nts
Ad
mit
ted
White
Asian
Black
Hispanic
1995 1996 1997 1999 2000 2001
424 INDUSTRIAL AND LABOR RELATIONS REVIEW
Admission to elite public and private schoolsis uncertain, however, and applicants tothese institutions must recognize that theymay not be admitted to any given school. InCard and Krueger (2004) we outlined avery simple model of the application deci-sion process, highlighting two channels forchanges in affirmative action policies toinfluence minority application rates to se-lective public schools: through changes inthe probability of admission and throughchanges in the utility of attending. Bothchannels work in the same direction forless qualified minorities. Assuming theyare less likely to be admitted to selectivestate schools in the absence of affirmativeaction, and that they value a bigger minor-ity presence on campus, less qualified mi-norities will be less likely to apply to selec-tive public schools and more likely to applyto lower-ranked state schools and private orout-of-state public schools where affirma-tive action is unchanged.
The impact on the application decisionsof highly qualified minority students is po-tentially in the same direction. To theextent that highly qualified minorities valuea larger minority presence on campus, theywill assign a lower utility to attending elitepublic schools in the post–affirmative ac-tion era, leading to a reduction in applica-tion flows. At the same time, they may raisetheir assessments of lower-ranked publicschools in anticipation of a larger inflow ofminority students after the end of affirma-tive action. Thus, like their less qualifiedpeers, highly qualified minority studentswill be diverted from elite public schools tolower-ranked institutions. A caveat is thatsome highly qualified minority students mayprefer a “non–affirmative action” campusenvironment, and put little or no weight onthe relative number of minority studentson campus. These preferences could leadto a rise in applications by some highlyqualified minority students to the elite pub-lic colleges after the end of affirmativeaction.
Although the admission probabilities ofhighly qualified minorities were not directlyaffected by ending affirmative action, stu-dents have imperfect information on their
actual admission prospects at any givenschool. Moreover, admission rates at eliteschools are typically less than 100% evenfor students with high test scores and stronggrades. This uncertainty blurs the distinc-tion between highly qualified and less quali-fied minority applicants, and makes it morelikely that even highly qualified minoritystudents perceive some risk of a decline intheir probability of admission at elite pub-lic schools, lowering the likelihood thatthey will apply to these schools.
Since our research design focuses onchanges in the probability of applying toelite schools by minorities relative to non-minorities, it is also worth considering theeffect of ending affirmative action on whiteand Asian students. Presumably, the elimi-nation of racial preferences has a smallpositive effect on admission probabilitiesfor non-minority applicants.14 If non-mi-norities place little or no value on the frac-tion of minorities on campus, this would beexpected to lead to a small increase in thelikelihood of applying to the elite publicschools after the end of affirmative action.
SAT Takers Data
We now turn to an analysis of the behav-ioral responses of minority applicants tothe elimination of affirmative action inCalifornia and Texas. Our data are derivedfrom the College Board’s Test Takers DataBase, and include all SAT takers in Califor-nia and Texas in the 1994–2001 admissioncohorts. Since students can take the testmultiple times, the College Board definescohorts based on their high school comple-tion dates. For example, the 1994 cohortincludes students who would be expectedto finish high school in spring 1994 andenter college the following September.15
14If the total number of students admitted remainsconstant, then the effect on the admission rate ofnon-minorities is pm/(1–pm) times as big as the effecton the admission rate of minorities, where pm is thefraction of minorities in the applicant pool. For theelite public schools in California and Texas this ratiowas about 0.25.
15We do not know how many times a student hastaken the test. The data set includes only the most
AFFIRMATIVE ACTION AND HIGHLY QUALIFIED MINORITIES 425
Over the 1994–2001 period the annualnumber of SAT takers rose steadily in Cali-fornia and Texas, reflecting a combinationof rising numbers of high school graduatesand increasing test participation.16 Testtakers report their ethnicity and other aca-demic and family background informationin the Student Descriptive Questionnairecomponent of the SAT. The ethnic catego-rization is a combination of race and His-panic origin.17 Both California and Texashave high fractions of minority test takers(6% black and 18% Hispanic in California;10% black and 20% Hispanic in Texas).California also has a high fraction of Asiantest takers (22%). A striking trend in bothstates is the rise in the fraction of test takerswho decline to state their ethnicity.18 Inboth states the increase seems to havestarted in 1996 (that is, around the time ofthe elimination of affirmative action) andwas accompanied by a parallel decline inthe fraction of white non-Hispanic test tak-ers. Based on this pattern we infer thatmost non-identified test takers are white.
Mean SAT scores are slightly higher inCalifornia than in Texas, whereas highschool GPAs are higher in Texas. For ex-
ample, 44% of Texas test takers reported aGPA of A-minus or better in 1994, versus36% in California. Over the 1990s highschool grades rose in both states, with 50%of Texans and 43% of Californians report-ing an average of A-minus or better by2001. SAT takers also report their classrank, and unlike the GPA distributions theclass rank distributions are similar in thetwo states and fairly stable over time.Roughly one-fifth of SAT takers in bothstates reported that they were in the top10% of their class, and another fifth re-ported that they were in the second decile.
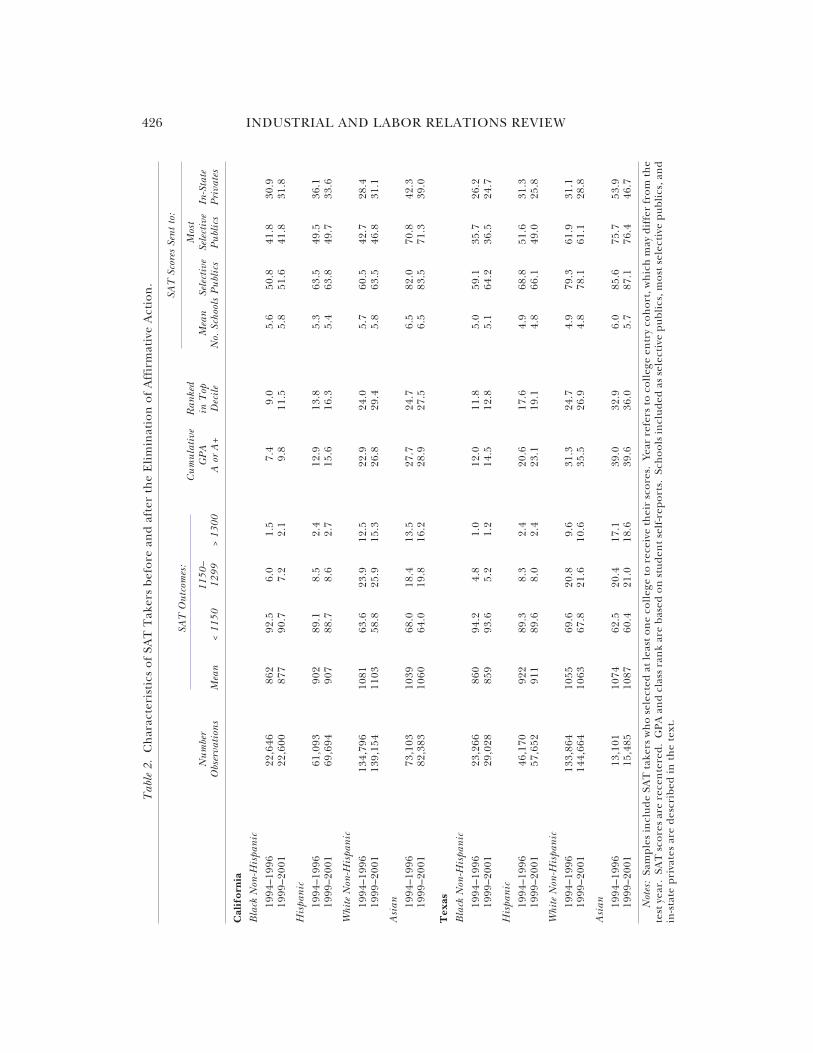
Table 2 presents comparisons by ethnicityof SAT takers’ outcomes in the two states.To set the stage for our later analysis, thetable shows means for each group from theperiods before (1994–96) and after (1999–2001) the elimination of affirmative action.Several key patterns are evident in the table.First, as noted in Table 1, average SATscores were lower for black and Hispanicstudents than for whites and Asians. Sec-ond, the ethnic differences in SAT out-comes did not greatly change after 1997.Third, although black and Hispanic stu-dents had lower GPAs than whites and wereless likely to be in the top rank of their class,the disparity in classroom achievement wassmaller than the disparity in test scores.For example, pre-1997, California blackswere only one-fifth as likely as whites toscore 1150 or better on the SAT, but wereone-third as likely to report at least an Aaverage, and 38% as likely to report beingin the top decile of their class. (Similarcomparisons hold for Hispanics and forboth groups in Texas.) The relativelysmaller minority gaps in class performancethan in test scores could reflect differencesin average grading standards and peergroups in schools attended by minorities,or differences in minority test performanceconditional on class performance (Steeleand Aronson 1998), or both.19
recent test results and most recent background infor-mation. Most of the records are for students in theirsenior year (73.9%). Nearly all the remaining records(25.7%) are for students in their junior year. Werestrict attention to the 85% of test takers who desig-nated at least one school to receive their test scores.The excluded group are more likely to have taken thetest in their junior year, more likely to have loweraverage scores and lower cumulative GPAs, and morelikely to be black or Hispanic.
16See Card and Krueger (2004), Appendix Table1. Over the 1990s the number of graduates of publichigh schools was rising at a rate of 2.4% per year inCalifornia and 1.7% per year in Texas, compared withgrowth rates of 2.8% and 3.7%, respectively, in thenumber of SAT takers in our data set.
17The specific categories are (1) American Indianor Alaskan Native; (2) Asian, Asian American, orPacific Islander; (3) Black or African-American; (4)Mexican or Mexican-American; (5) Puerto Rican; (6)Latin American, South or Central American, or otherHispanic or Latino; (7) White; and (8) Other.
18The fraction of non-reporters in California rosefrom 5% in 1996 to 13% in 2001, and in Texas from3% in 1996 to 10% in 2001.
19Rothstein (2004) estimated models that relatecollege grades (for UC students who entered in Fall1993) to high school grades and SAT scores. Heconcluded that the SAT captures differences across
426 INDUSTRIAL AND LABOR RELATIONS REVIEW
Tab
le 2
. C
har
acte
rist
ics
of S
AT
Tak
ers
befo
re a
nd
aft
er t
he
Eli
min
atio
n o
f A
ffir
mat
ive
Act
ion
.
SAT
Sco
res
Sen
t to
:
Cu
mu
lati
veR
ank e
dM
ost
Nu
mbe
r11
50–
GP
Ain
Top
Mea
nSe
lect
ive
Sele
ctiv
eIn
-Sta
teO
bser
vati
ons
Mea
n<
1150
1299
> 13
00A
or
A+
Dec
ile
No.
Sch
ools
Publ
ics
Publ
ics
Priv
ates
Cal
ifo
rnia
Bla
ck N
on-H
ispa
nic
1994
–199
622
,646
862
92.5
6.0
1.5
7.4
9.0
5.6
50.8
41.8
30.9
1999
–200
122
,600
877
90.7
7.2
2.1
9.8
11.5
5.8
51.6
41.8
31.8
His
pani
c
1994
–199
661
,093
902
89.1
8.5
2.4
12.9
13.8
5.3
63.5
49.5
36.1
1999
–200
169
,694
907
88.7
8.6
2.7
15.6
16.3
5.4
63.8
49.7
33.6
Whi
te N
on-H
ispa
nic
1994
–199
613
4,79
610
8163
.623
.912
.522
.924
.05.
760
.542
.728
.419
99–2
001
139,
154
1103
58.8
25.9
15.3
26.8
29.4
5.8
63.5
46.8
31.1
Asi
an 1994
–199
673
,103
1039
68.0
18.4
13.5
27.7
24.7
6.5
82.0
70.8
42.3
1999
–200
182
,383
1060
64.0
19.8
16.2
28.9
27.5
6.5
83.5
71.3
39.0
Tex
as
Bla
ck N
on-H
ispa
nic
1994
–199
623
,266
860
94. 2
4 .8
1.0
12.0
11.8
5 .0
59.1
35.7
26. 2
1999
–200
129
,028
859
93. 6
5 .2
1.2
14.5
12.8
5 .1
64.2
36.5
24. 7
His
pani
c
1 99 4
–199
646
,17 0
922
8 9.3
8.3
2.4
20.6
17.6
4.9
68.8
51. 6
3 1.3
1 99 9
–200
157
,65 2
911
8 9.6
8.0
2.4
23.1
19.1
4.8
66.1
49. 0
2 5.8
Whi
t e N
on-H
ispa
nic
1994
–19 9
613
3,86
41 0
5 569
.620
.89.
631
. 324
. 74.
979
. 36 1
.931
.119
99–2
0 01
144,
664
1 06 3
67.8
21.6
10. 6
35. 5
26. 9
4.8
78. 1
6 1.1
28.8
Asi
an 1994
–199
613
,101
1074
62. 5
2 0.4
17.1
39.0
32.9
6 .0
85.6
75.7
53. 9
1999
–200
115
,485
1087
60. 4
2 1.0
18.6
39.6
36.0
5 .7
87.1
76.4
46. 7
Not
es:
Sam
ple
s in
clu
de
SAT
tak
ers
wh
o s
elec
ted
at
leas
t o
ne
col l
ege
t o r
ecei
ve t
hei
r s c
ore
s . Y
ear
refe
rs t
o c
oll
ege
ent r
y co
ho
rt, w
hic
h m
ay d
i ffe
r fr
om
th
et e
st y
ear.
SA
T s
core
s ar
e r e
cen
ter e
d.
GP
A a
nd
cla
ss r
ank
a re
bas
ed o
n s
t ud
ent
self
- rep
ort
s. S
cho
ol s
incl
ud
ed a
s se
lect
ive
pu
bli
cs, m
os t
sel
ecti
v e p
ub
lic s
, an
din
-sta
te p
riv a
t es
are
des
crib
ed i
n t
he
text
.
SAT
Out
com
es:

AFFIRMATIVE ACTION AND HIGHLY QUALIFIED MINORITIES 427
schools that are correlated with minority share andparental income but are not reflected in high schoolgrades. This is consistent with the peer group/grad-ing standards interpretation of the larger gap in SATscores than grades.
Before taking the SAT, students desig-nate a list of institutions to receive their testscores. Test takers can specify up to fourschools to receive their scores withoutcharge, and four more for an additional fee(currently, $6.50 per school). After the testis completed, they can add additionalschools to the list for the same incrementalfee. Our data set includes the identities ofup to 20 institutions that each SAT takerdesignated to receive his or her test scores.(Only 1% of test takers designate morethan 14 schools.) We summarize informa-tion on the characteristics of the list ofschools in the four right-hand columns ofTable 2.
On average, SAT takers sent their scoresto 5–6 institutions, with a tendency for Asianstudents to send their scores to more schoolsand Hispanics to send their scores to fewer.We classify a student as sending scores to aselective public institution if he or she sentscores to one of the schools listed in Table1, and to a more selective public school ifthe list included UCLA, Berkeley, or UCSan Diego (for California students) or TexasA&M or UT Austin (for Texas students).For comparison purposes, we also presentprobabilities of sending scores to one ormore of the major in-state private institu-tions: University of Southern California,Stanford, University of San Diego, and theClaremont Colleges in California; Baylor,Rice, and Trinity University in Texas.
There are notable differences across eth-nic groups in the probabilities of sendingscores to different types of institutions. Forexample, in both California and Texas,black students were less likely than whitesto send scores to selective public institu-tions. When the comparison is narrowed tothe most selective schools, however, blacksin California were about as likely as whitesto submit their scores, whereas blacks inTexas were much less likely. We believesome of these differences reflect the loca-
tions of the various campuses. Two of thethree most selective University of Califor-nia campuses (UCLA and Berkeley) arelocated in large urban areas, whereas manyof the other UC campuses are not. UTAustin and Texas A&M are located insmaller cities with relatively low minoritypopulations, while several of the other Texasschools are in urban environments. Theseconsiderations suggest that it is probablymost useful to focus on changes in the rela-tive propensity of different groups to sendtheir scores to different institutions afterthe elimination of affirmative action, ratherthan on the levels at any particular time.Looking at the simple means in Table 2,there is little evidence of a systematic fall-off in interest of minority students in theelite or other selective public institutionsin California or Texas.
Sending SAT Scores versus Applying
How closely do changes in the probabil-ity of sending SAT scores to different insti-tutions reflect changes in application be-havior? Ideally, it would be possible toanswer this question using a sample of stu-dents who report both the schools to whichthey applied and the ones to which theysent their test scores. We are unaware ofany such data. As an alternative, we ob-tained two different data sets that allow usto estimate the correlation between thenumber of students sending their SATscores to an institution and the numberwho actually applied. The first consists ofdata by ethnic group and year for the eightUC campuses over the period from 1995 to2001. We used the test taker data set tocalculate the number of students in each offour ethnic groups (black, Hispanic, Asian,and white and other) who submitted theirSAT scores to each campus in each year,and compared this to the correspondingnumber of freshman applicants.20 Specifi-
20Information on the number of applicants at eachschool was obtained from the document “Final sum-mary of freshman applicants, admissions, and enroll-ments 1995–2002” available at http://www.ucop.edu/news/studstaff.html.
428 INDUSTRIAL AND LABOR RELATIONS REVIEW
cally, we fit a series of regression models ofthe form
(1) log(Sjct) = δjt + γc + λ log(Ajct) + εjct ,
where Sjct is the number of California stu-dents in ethnic group j who sent their SATscores to campus c for admission in year t,Ajct is the number of first-time freshmanapplications from California residents inethnic group j at campus c in year t, δjtrepresents an unrestricted dummy for eachethnic group in each year, γc represents adummy for each campus, and εjct is a re-sidual. Under reasonable assumptions, thecoefficient λ in this equation provides anestimate of the degree of attenuation biasthat would be expected when the fractionof students in a given ethnic group whosend their SAT scores to a particular cam-pus is used as a dependent variable in placeof the fraction who actually apply to thecampus.21
Our second data set consists of counts ofthe number of students in each of four
ethnic groups with SAT scores in six differ-ent ranges (under 1000, 1000–1100, 1100–1200, 1200–1300, 1300–1400, and over1400) who sent their SAT scores or appliedto one of 19 public and private institutionsfor admission in fall 1995.22 Using this dataset we fit a set of models similar to equation(1), estimated over observations represent-ing different combinations of ethnic group,SAT range, and school.
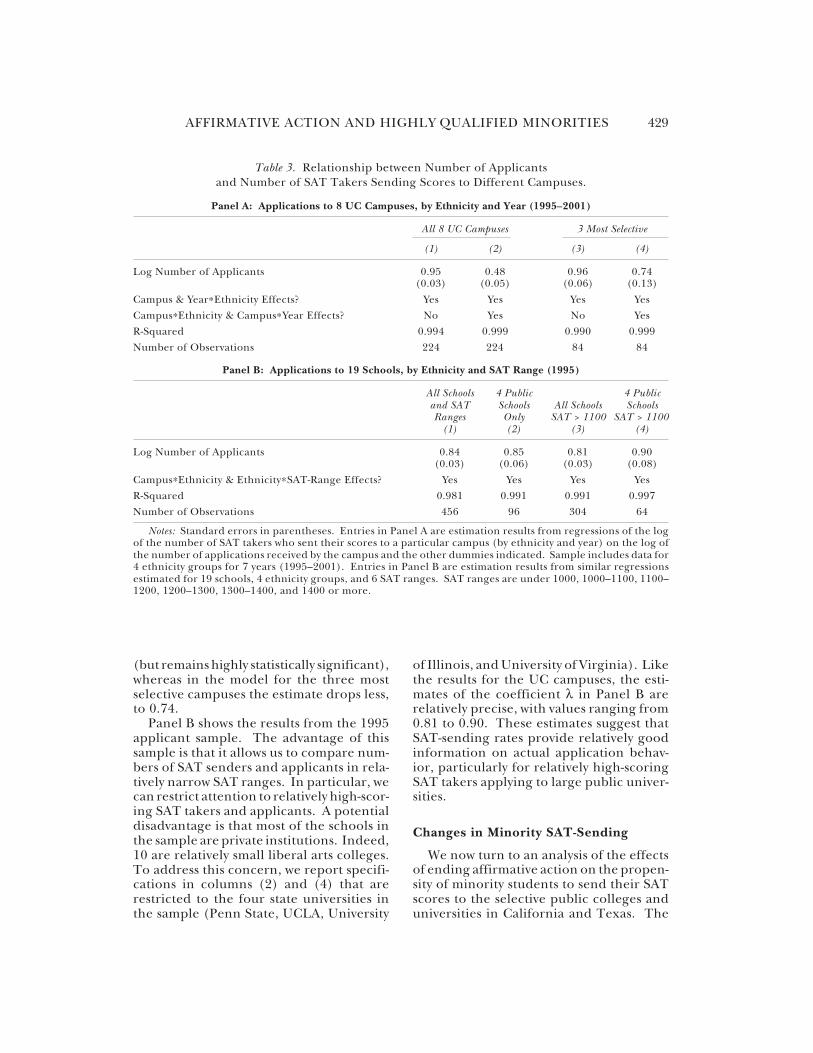
The estimation results are summarizedin Table 3. Panel A shows the results fromthe UC sample: the first two columns showresults based on applications to all eightUC campuses, while the third and fourthcolumns report results when the sample isrestricted to the three most selective UCcampuses (UCLA, Berkeley, and UC SanDiego). The specifications in columns (1)and (3) include campus dummies andethnicity-year effects. In these models thecoefficient λ is precisely estimated with avalue just under 1, suggesting that trends inthe number of applicants to a particularcampus are closely mirrored by trends inthe number of students who send their SATscores to that campus. The models in col-umns (2) and (4) expand the specificationby adding a full set of “two-way” interac-tions between campus, ethnicity, and yeardummies (that is, campus-by-ethnicity andcampus-by-year dummies in addition to theethnicity-by-year dummies). These specifi-cations provide a very stringent test of thesignal in observed SAT-sending rates asmeasures of underlying application behav-ior. When the model is fit to all eightcampuses, the estimate of λ falls to 0.48
21To see this, let Njt represent the number ofgraduating high school seniors in ethnic group j inyear t, let Ajct represent the number of these who applyto campus c, and let Sjct represent the number whosend their SAT scores to campus c. Let πjct = Ajct/Njtrepresent the application rate and µjct = Sjct/Njt repre-sent the SAT-sending rate. Suppose the model ofinterest is log πjct = Xjctβ + Zjctγ + ejct, where Zjct repre-sents a set of basic controls (for example, dummiesfor year, ethnic group, and campus) and Xjct repre-sents a set of covariates of primary interest (for ex-ample, year-ethnicity-campus interaction effects).Consider the linear projection
log µjct = λ log π jct + Zjct φ + ujct.
If ujct is orthogonal to Xjct, then a regression of SAT-sending rates on X and Z will yield an estimate of theeffect of the X’s that tends to λβ, rather than to β. (Inthe classical measurement error case, λ = 1 and thereis no bias arising from the use of a noisy dependentvariable.) This equation implies that
log Sjct = λ log Ajct + (1–λ) log Njt + Zjct φ + ujct .
Notice that if Z includes unrestricted dummies foreach ethnic group in each year, the number of gradu-ates is absorbed by Z and the estimate of λ from thismodel can be used to infer the degree of attenuationbias when SAT sending rates are used in place ofactual application rates.
22Data on the number of applicants by ethnicityand SAT range were made available to us by research-ers at the Andrew Mellon Foundation. The institu-tions are Barnard College, Bowdoin College, Colum-bia University, Harvard University, Macalester Col-lege, Middlebury College, Oberlin College, Penn StateUniversity, Pomona College, Princeton University,Smith College, Swarthmore College, UCLA, Univer-sity of Illinois (Urbana-Champaign), University ofPennsylvania, University of Virginia, Wellesley Col-lege, Williams College, and Yale. Across the 456campus/ethnic group/SAT range cells in this samplethe mean ratio of applicants to SAT takers is 0.79.
AFFIRMATIVE ACTION AND HIGHLY QUALIFIED MINORITIES 429
(but remains highly statistically significant),whereas in the model for the three mostselective campuses the estimate drops less,to 0.74.
Panel B shows the results from the 1995applicant sample. The advantage of thissample is that it allows us to compare num-bers of SAT senders and applicants in rela-tively narrow SAT ranges. In particular, wecan restrict attention to relatively high-scor-ing SAT takers and applicants. A potentialdisadvantage is that most of the schools inthe sample are private institutions. Indeed,10 are relatively small liberal arts colleges.To address this concern, we report specifi-cations in columns (2) and (4) that arerestricted to the four state universities inthe sample (Penn State, UCLA, University
of Illinois, and University of Virginia). Likethe results for the UC campuses, the esti-mates of the coefficient λ in Panel B arerelatively precise, with values ranging from0.81 to 0.90. These estimates suggest thatSAT-sending rates provide relatively goodinformation on actual application behav-ior, particularly for relatively high-scoringSAT takers applying to large public univer-sities.
Changes in Minority SAT-Sending
We now turn to an analysis of the effectsof ending affirmative action on the propen-sity of minority students to send their SATscores to the selective public colleges anduniversities in California and Texas. The
Table 3. Relationship between Number of Applicantsand Number of SAT Takers Sending Scores to Different Campuses.
Panel A: Applications to 8 UC Campuses, by Ethnicity and Year (1995–2001)
All 8 UC Campuses 3 Most Selective
(1) (2) (3) (4)
Log Number of Applicants 0.95 0.48 0.96 0.74(0.03) (0.05) (0.06) (0.13)
Campus & Year∗Ethnicity Effects? Yes Yes Yes Yes
Campus∗Ethnicity & Campus∗Year Effects? No Yes No Yes
R-Squared 0.994 0.999 0.990 0.999
Number of Observations 224 224 84 84
Panel B: Applications to 19 Schools, by Ethnicity and SAT Range (1995)
All Schools 4 Public 4 Publicand SAT Schools All Schools SchoolsRanges Only SAT > 1100 SAT > 1100
(1) (2) (3) (4)
Log Number of Applicants 0.84 0.85 0.81 0.90(0.03) (0.06) (0.03) (0.08)
Campus∗Ethnicity & Ethnicity∗SAT-Range Effects? Yes Yes Yes Yes
R-Squared 0.981 0.991 0.991 0.997
Number of Observations 456 96 304 64
Notes: Standard errors in parentheses. Entries in Panel A are estimation results from regressions of the logof the number of SAT takers who sent their scores to a particular campus (by ethnicity and year) on the log ofthe number of applications received by the campus and the other dummies indicated. Sample includes data for4 ethnicity groups for 7 years (1995–2001). Entries in Panel B are estimation results from similar regressionsestimated for 19 schools, 4 ethnicity groups, and 6 SAT ranges. SAT ranges are under 1000, 1000–1100, 1100–1200, 1200–1300, 1300–1400, and 1400 or more.
430 INDUSTRIAL AND LABOR RELATIONS REVIEW
framework for our analysis is the differ-ence-in-differences approach pioneered byAshenfelter (1978).
We compare the fraction of minoritystudents who send their SAT scores to aparticular set of institutions before andafter the elimination of affirmative action,relative to trends for comparable non-mi-nority students.
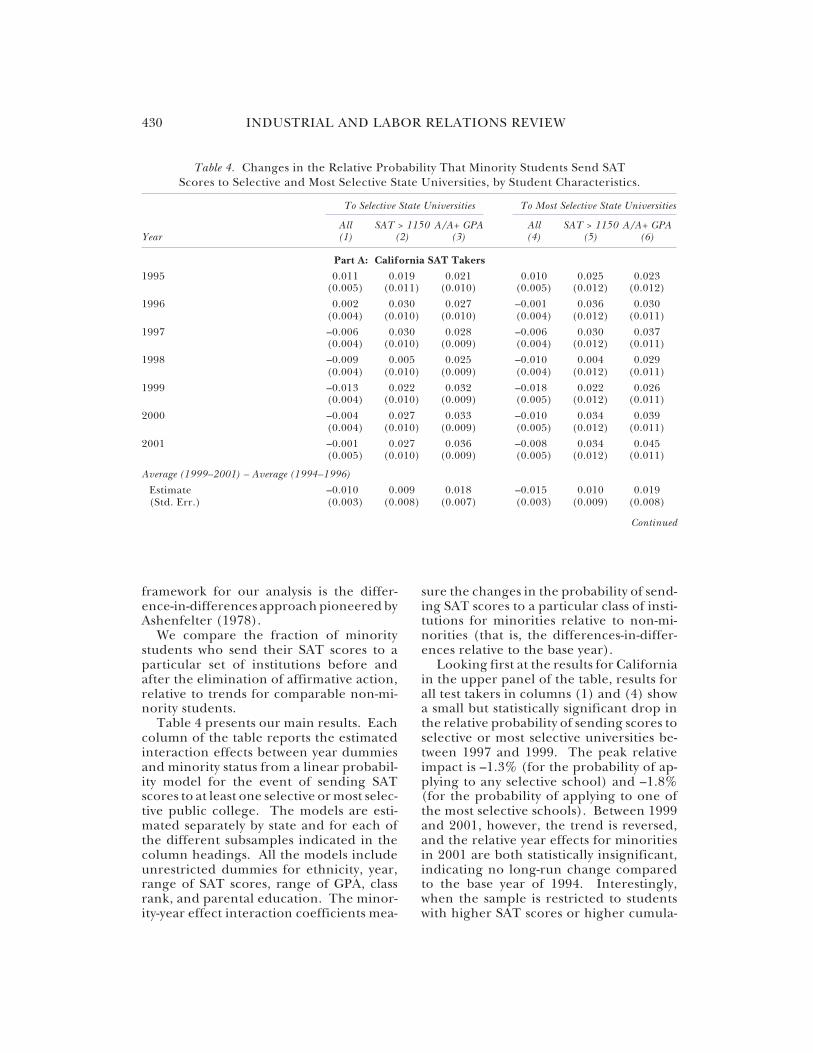
Table 4 presents our main results. Eachcolumn of the table reports the estimatedinteraction effects between year dummiesand minority status from a linear probabil-ity model for the event of sending SATscores to at least one selective or most selec-tive public college. The models are esti-mated separately by state and for each ofthe different subsamples indicated in thecolumn headings. All the models includeunrestricted dummies for ethnicity, year,range of SAT scores, range of GPA, classrank, and parental education. The minor-ity-year effect interaction coefficients mea-
sure the changes in the probability of send-ing SAT scores to a particular class of insti-tutions for minorities relative to non-mi-norities (that is, the differences-in-differ-ences relative to the base year).
Looking first at the results for Californiain the upper panel of the table, results forall test takers in columns (1) and (4) showa small but statistically significant drop inthe relative probability of sending scores toselective or most selective universities be-tween 1997 and 1999. The peak relativeimpact is –1.3% (for the probability of ap-plying to any selective school) and –1.8%(for the probability of applying to one ofthe most selective schools). Between 1999and 2001, however, the trend is reversed,and the relative year effects for minoritiesin 2001 are both statistically insignificant,indicating no long-run change comparedto the base year of 1994. Interestingly,when the sample is restricted to studentswith higher SAT scores or higher cumula-
Table 4. Changes in the Relative Probability That Minority Students Send SATScores to Selective and Most Selective State Universities, by Student Characteristics.
To Selective State Universities To Most Selective State Universities
All SAT > 1150 A/A+ GPA All SAT > 1150 A/A+ GPAYear (1) (2) (3) (4) (5) (6)
Part A: California SAT Takers
1995 0.011 0.019 0.021 0.010 0.025 0.023(0.005) (0.011) (0.010) (0.005) (0.012) (0.012)
1996 0.002 0.030 0.027 –0.001 0.036 0.030(0.004) (0.010) (0.010) (0.004) (0.012) (0.011)
1997 –0.006 0.030 0.028 –0.006 0.030 0.037(0.004) (0.010) (0.009) (0.004) (0.012) (0.011)
1998 –0.009 0.005 0.025 –0.010 0.004 0.029(0.004) (0.010) (0.009) (0.004) (0.012) (0.011)
1999 –0.013 0.022 0.032 –0.018 0.022 0.026(0.004) (0.010) (0.009) (0.005) (0.012) (0.011)
2000 –0.004 0.027 0.033 –0.010 0.034 0.039(0.004) (0.010) (0.009) (0.005) (0.012) (0.011)
2001 –0.001 0.027 0.036 –0.008 0.034 0.045(0.005) (0.010) (0.009) (0.005) (0.012) (0.011)
Average (1999–2001) – Average (1994–1996)
Estimate –0.010 0.009 0.018 –0.015 0.010 0.019(Std. Err.) (0.003) (0.008) (0.007) (0.003) (0.009) (0.008)
Continued

AFFIRMATIVE ACTION AND HIGHLY QUALIFIED MINORITIES 431
tive GPAs, there is no evidence of a dipbetween 1997 and 1999. Thus, the 1997–99drop is confined to relatively less-qualifiedSAT takers.23 The table also shows thechange in the average of the minority rela-tive year effects from 1994–96 to 1999–2001. These are slightly negative for theoverall samples but positive (and statisti-cally significant) for the high SAT scorersand the high GPA subgroup.
The results for Texas are broadly similar.In the case of Texas, the only statisticallysignificant relative year effects arise in themodels for high-scoring SAT takers. Most
notable are the effects in column (5) forSAT-sending rates to the most selectivepublic universities by students scoring 1150or higher on the SAT. Compared to 1995–97, the relative probability that minoritiessent their scores to Texas A&M or UT Aus-tin fell by 4.4% in 1998, then graduallyrecovered. Interestingly, there is no simi-lar trend for students with an A or A+ GPA.Since one would expect parallel changesfor the high SAT scorers and the high GPApopulation if there was a true behavioralreaction of highly qualified minorities tothe elimination of affirmative action, weare reluctant to draw any strong conclu-sions from the drop among the high scor-ers. In any case, by 2001 the relative prob-ability of sending SAT scores to the mostselective Texas institutions was back to the1995 level. Absent changes in admissionsrules, the observed changes in application
Table 4. Continued.
To Selective State Universities To Most Selective State Universities
All SAT > 1150 A/A+ GPA All SAT > 1150 A/A+ GPAYear (1) (2) (3) (4) (5) (6)
Part B: Texas SAT Takers
1995 0.013 0.000 –0.008 0.014 –0.021 –0.005(0.005) (0.013) (0.010) (0.006) (0.015) (0.012)
1996 0.009 –0.005 0.005 0.016 –0.020 0.012(0.005) (0.012) (0.010) (0.005) (0.014) (0.011)
1997 0.011 0.003 0.001 0.003 –0.020 –0.014(0.005) (0.012) (0.010) (0.005) (0.014) (0.011)
1998 0.016 –0.021 –0.004 0.006 –0.044 –0.020(0.005) (0.012) (0.009) (0.005) (0.014) (0.011)
1999 0.018 –0.016 –0.012 0.007 –0.035 –0.013(0.005) (0.012) (0.010) (0.005) (0.014) (0.011)
2000 0.019 0.006 0.003 0.005 –0.028 –0.004(0.005) (0.012) (0.009) (0.005) (0.014) (0.011)
2001 0.024 0.003 –0.001 0.021 –0.021 –0.006(0.005) (0.012) (0.009) (0.005) (0.014) (0.011)
Average (1999–2001) – Average (1994–1996)
Estimate 0.013 0.000 –0.003 0.001 –0.014 –0.010(Std. Err.) (0.004) (0.009) (0.007) (0.004) (0.011) (0.008)
Notes: Table shows estimates (and standard errors) of the interaction of year dummies with minority ethnicityin linear probability models for the event of sending SAT scores to selective state universities (columns 1–3) ormost selective state universities (columns 4–6). All models also include year effects, ethnicity effects, andcontrols for parents’ education, SAT range, cumulative GPA, rank in high school class, and grade when test iswritten.
23If we fit the model to SAT takers with scoresunder 1000, the peak relative impact is –2.1% in 1999(standard error 0.7%). By 2001 the relative effect forlower-scoring minorities is very close to 0.
432 INDUSTRIAL AND LABOR RELATIONS REVIEW
rates would have had only a trivial effect onthe composition of students at elite schools.
We have fit models similar to those inTable 4 with separate relative year effectsfor black and Hispanic test takers (see Cardand Krueger 2004, Table 5). Since thenumber of highly qualified black appli-cants is small, the black relative year effectsare somewhat variable from year to year.Overall, there is no evidence of a downwardtrend in the probability that highly quali-fied black or Hispanic students sent theirscores to selective or most selective publicuniversities after the elimination of affir-mative action. In fact, the only statisticallysignificant relative change is for high-GPAHispanics in California, who were more likelyto send their scores to the UC campuses asa whole, and to the most selective UC cam-puses in particular, after 1998.
We have also analyzed changes in therelative probability that highly qualifiedminority students sent their SAT scores toless selective public institutions only (thatis, to the UC campuses other than Berkeley,Los Angeles, and San Diego, and the Texasschools other than A&M and Austin). If theelimination of affirmative action causeshighly qualified minorities to lower theirsights from most selective to less-selectivepublic colleges, one might expect to see arise in such behavior. In California, usingsamples of students with SAT scores above1150, or with at least an “A” average, we findvirtually no change in this outcome after1998. In Texas there is a slight increase inthe relative probability that high-SAT mi-norities sent their scores only to one of theless selective public colleges after 1997 (thechange from 1994–96 to 1999–2001 is 1.4%with a standard error of 0.8%), but as in themodels in Table 4, this effect appears to betemporary. A comparison of 2001 to the1994–96 average shows no significantchange. Also, as in Table 4, the results forhigh-GPA minorities in Texas are less strik-ing, and show little relative change after1997 (the change from 1994–96 to 1999–2001 is 0.7% with a standard error of 0.8%).
Finally, we examined a variety of othercharacteristics of the list of schools thateach student designated to receive his or
her test scores, including the number ofschools in the list, the minimum quality ofthe institutions in the list (judged by theaverage SAT of all students who sent theirscores to each school in the list), and theminority preference of the applicant (mea-sured by the maximum share of minoritySAT senders at each of the schools on thelist). We used national samples of all SATtakers in 1994–96 to assign these character-istics to each school, and then calculatedthe relevant statistics over the set of schoolsin each student’s list. Results for theseoutcomes are presented in Card andKrueger (2004, Table 6).
In brief, we draw three main conclu-sions. First, there is no relative trend in thenumber of applications sent by minoritiesrelative to non-minorities after the end ofaffirmative action. Second, there are nostatistically significant changes in the mini-mum average quality of the list of SAT-receiving schools specified by minoritiesrelative to non-minorities in the post–affir-mative action period. In particular, highlyqualified minorities did not seem to beadding lower-quality “safety schools” to thelist of institutions receiving their test scoresin the post–affirmative action era. Ourstrongest results pertain to the maximumminority share. The data show a slight shiftof high-achievement minority students awayfrom high-minority schools, contrary towhat might have been expected. Taken asa whole, we believe our analysis of the SATtakers data base suggests that the elimina-tion of affirmative action had little or noeffect on the application behavior of highlyqualified minority students in California orTexas.
Summary
The case for preserving or eliminatingaffirmative action depends on many fac-tors. One issue is whether the eliminationof racial preferences in college admissionwould indirectly harm the educational out-comes of highly qualified minorities by di-verting the most able black and Hispanicstudents away from elite colleges and uni-versities. In this paper we have used the
AFFIRMATIVE ACTION AND HIGHLY QUALIFIED MINORITIES 433
REFERENCES
recent experiences in California and Texasto analyze the effects of ending affirmativeaction on the critical first step of the col-lege choice process—the decision of whereto apply. We used a simple difference-in-differences research design to measure rela-tive changes in the probability that minor-ity SAT takers sent their test results to selec-tive public institutions after affirmative ac-tion was ended in the two states. Changesin the number of students who send SATscores to a given institution are very highlycorrelated with changes in the numberwho actually apply, and we have littlereason to doubt that changes in the prob-ability of sending SAT scores to selectivepublic colleges accurately reflect changesin the probability of applying to thesecolleges.
Our main finding is that the eliminationof race-based admissions preferences inCalifornia and Texas had little or no effecton the decisions of highly qualified minori-ties to submit their SAT scores (and pre-sumably apply) to the selective institutionsin the two states. This is true whether weuse SAT scores or high school grades todefine highly qualified candidates. It isalso true whether we focus on minoritystudents generally or treat black and His-panic students separately. Moreover, theend of affirmative action had no appre-ciable impact on other characteristics ofthe list of schools designated by minority
test takers to receive their scores, includingthe minimum quality of the schools in thelist.
Our findings suggest that the applica-tion decisions of highly qualified minoritystudents are not very sensitive to changes inthe racial and ethnic composition of thestudent bodies at selective public collegesand universities caused by ending affirma-tive action. The data do not allow us to tellwhether this is because minority studentsare relatively unconcerned about the broaddemographic characteristics of their po-tential peer group, or because any suchconcerns are outweighed by the perceivedadvantages of attending more selective in-stitutions. At a minimum, however, fearthat ending affirmative action would causea diversion of highly qualified minority stu-dents away from the elite colleges and uni-versities appears to be unfounded.
Our results further suggest that minorityapplicants were not “seduced” to apply toelite schools because of affirmative actionwhen race-based affirmative action policeswere permitted in California and Texas.Instead, the fact that their SAT-sendingbehavior did not change after the elimina-tion of affirmative action suggests that mi-nority applicants thought they deservedconsideration for admission at top schoolsirrespective of affirmative action. In thisrespect, affirmative action did not have ascarring effect on minority students.
Ashenfelter, Orley. 1978. “Estimating the Effect ofTraining Programs on Earnings.” Review of Econom-ics and Statistics, Vol. 6, No. 1 (February), pp. 47–57.
Bowen, William G., and Derek Bok. 1998. The Shapeof the River: Long Term Consequences of ConsideringRace in College and University Admissions. Princeton,N.J.: Princeton University Press.
Brewer, Dominic, Eric Eide, and Ronald G. Ehrenberg.1999. “Does It Pay to Attend an Elite College?Cross-Cohort Evidence on the Effects of CollegeType on Earnings.” Journal of Human Resources, Vol.34, No. 1 (Winter), pp. 104–23.
Bucks, Brian. 2003. “Affirmative Access versus Affir-mative Action: How Have Texas’ Race-Blind Poli-cies Affected College Outcomes?” Unpublished
Working Paper, University of Texas at Dallas GreenCenter for the Study of Science and Society, Febru-ary.
Card, David, and Alan B. Krueger. 2004. “Would theElimination of Affirmative Action Affect HighlyQualified Minority Applicants? Evidence from Cali-fornia and Texas.” National Bureau of EconomicResearch Working Paper 10366. Cambridge, Mass.:NBER, March.
Clark, Melissa A. 2003. “Selection Bias in CollegeAdmissions Test Data.” Unpublished Manuscript,Princeton University Department of Economics,May.
Dale, Stacy Berg, and Alan B. Krueger. 2002. “Esti-mating the Payoff to Attending a More Selective

434 INDUSTRIAL AND LABOR RELATIONS REVIEW
College: An Application of Selection on Observablesand Unobservables.” Quarterly Journal of Economics,Vol. 117, No. 4 (November), pp. 1491–1528.
Fuller, Winship C., Charles F. Manski, and David A.Wise. 1982. “New Evidence on the Economic Deter-minants of Postsecondary Schooling Choices.” Jour-nal of Human Resources, Vol. 17, No. 3 (Summer), pp.477–98.
Kane, Thomas J. 1998. “Racial and Ethnic Prefer-ences in College Admissions.” In Christopher Jencksand Meredith Phillips, eds., The Black-White TestScore Gap. Washington, D.C.: Brookings InstitutionPress.
Kohn, Meier G., Charles F. Manski, and David S.Mundel. 1976. “An Empirical Investigation ofFactors Influencing College-Going Behavior.” An-nals of Economic and Social Measurement, Vol. 5 (Fall),pp. 391–419.
Long, Mark. 2002. “College Applications and theEffect of Affirmative Action.” Unpublished workingpaper, George Washington University, Departmentof Economics, August.
National Association for College Admission Counsel-ing. 2001. “Affirmative Action in College Admis-sion.” Issue Paper, Summer. Washington, D.C.
Rothstein, Jesse M. 2004. “College PerformancePredictions and the SAT.” Journal of Econometrics,Vol. 121 (July–August), pp. 297–317.
Sharp, John. 1999. Disparity in Texas Higher Education:Recruitment, Admissions, Retention, and Financial Aid,Vols. 1 and 2. Austin: Texas Comptroller of PublicAccounts.
Steele, Claude M., and Joshua Aronson. 1998. “Ste-reotype Threat and the Test Performance of Aca-demically Successful African Americans.” In Chris-
topher Jencks and Meredith Phillips, eds., The Black-White Test Score Gap. Washington, D.C.: BrookingsInstitution Press.
Texas Higher Education Coordinating Board. 1998–2001. “First-Time Undergraduate Applicant, Ac-ceptance, and Enrollment Information for Sum-mer/Fall.” Austin, Texas: Texas Higher EducationCoordinating Board. Available at http://www.thecb.state.tx.us/reports/.
Thomas, M. Kathleen. 2002. “Where College-BoundTexas Students Send Their SAT and ACT Scores:Does Race Matter?” Unpublished Manuscript, Uni-versity of Texas at Dallas Green Center for the Studyof Science and Society, February.
Tienda, Marta, Kevin T. Leicht, Teresa Sullivan,Michael Maltese, and Kim Lloyd. 2003. “Closingthe Gap?: Admissions and Enrollments at the TexasPublic Flagships before and after Affirmative Ac-tion.” Unpublished working paper, Princeton Uni-versity Department of Sociology, January. Availableat http://www.texastop10.princeton.edu/publica-tions/tienda012103.pdf.
Turner, M. E., and A. R. Pratkanis. 1994. “AffirmativeAction as Help: A Review of Recipient Reactions toPreferential Selection and Affirmative Action.” Basicand Applied Psychology, Vol. 15, pp. 43–69.
University of California Office of the President. 1998.Information Digest. Oakland: University of Califor-nia Office of the President. Available at http://www.ucop.edu/sas/infodigest/.
University of California Office of the President. 2003.“University of California Applications, Admissions,and Enrollment of California Resident Freshmenfor Fall 1995 Through 2002.” Available at http://www.ucop.edu/news/factsheets/flowfrc9502.pdf.