Industrial Designs - wipo.int · 112 INDUSTRIAL DESIGNS HIGHLIGHTS Figure 17. Application design...
32
111 INDUSTRIAL DESIGNS Industrial Designs Highlights Applications rebounded to 872,800 An estimated 872,800 applications were filed worldwide in 2015. With annual growth of 2.3%, industrial design applications worldwide rebounded after experiencing a sharp drop of 10.2% in 2014 (figure 15). This decline was due mainly to a pronounced decrease in filings in China, which has accounted for about two-thirds of the world total since 2010. The 2015 recovery resulted mainly from filing increases in China, the Republic of Korea and the U.S. Compared to 2014, those three offices received between 3,500 and 4,500 additional filings each. The total number of designs contained in applications (design count) increased modestly by 0.6% to about 1.14 million in 2015 (figure 16). Designs contained in non-resident applications increased by 1.8%, a faster increase than for those contained in resident applica- tions (+0.4%). Design count In an industrial design application or registration, some offices allow applications to contain more than one design for the same good or in the same class – others allow only one design per application. To capture the differences in application filing systems across offices, one needs to compare their respective application and registration design counts. Designs in applications filed in China accounted for half the global total The State Intellectual Property Office of China (SIPO) received applications containing a total of 569,059 designs, up 0.8% from 2014. Designs in applications filed by residents increased by 0.6% and accounted for 97% of SIPO’s total, while those filed by non-residents grew by 9%. SIPO remained by far the office with the largest design count, receiving half of all designs in applications filed worldwide in 2015. It was followed by the European Union Intellectual Property Office (EUIPO; 98,162) and the Korean Intellectual Property Office (KIPO; 72,458). The top 20 offices combined accounted for 90% of designs in total applications. 1 Of these offices, 11 saw increases in application design counts. The of- fices of the Islamic Republic of Iran (+33.8%), China, Hong Kong (SAR) (+15.7%), the U.S. (+13.4%) and India (+10.5%) saw double-digit growth. Seven of the nine offices that saw declines in design counts were located in Europe, such as the offices of the Russian Federation (-17.9%), Ukraine (-11.2%), France (-9.8%) and Germany (-7.5%). The offices of Brazil (-8.4%) and Turkey (-6%) also received fewer design counts in 2015 than the previous year. 1. Design count data for the office of Italy were not available for 2015. In 2014, the office of Italy ranked seventh in the world on this measure. Figure 15. Industrial design applications worldwide 0 250,000 500,000 750,000 1,000,000 Applications 2001 2003 2005 2007 2009 2011 2013 2015 Application year Source: Standard figure C1. Figure 16. Number of designs in industrial design applications worldwide 0 400,000 800,000 1,200,000 Design count 2005 2007 2009 2011 2013 2015 Application year Source: Standard figure C2.
Transcript of Industrial Designs - wipo.int · 112 INDUSTRIAL DESIGNS HIGHLIGHTS Figure 17. Application design...

111
INDU
STRI
AL D
ESIG
NS
Industrial Designs
Highlights
Applications rebounded to 872,800
An estimated 872,800 applications were filed worldwide in 2015. With annual growth of 2.3%, industrial design applications worldwide rebounded after experiencing a sharp drop of 10.2% in 2014 (figure 15). This decline was due mainly to a pronounced decrease in filings in China, which has accounted for about two-thirds of the world total since 2010. The 2015 recovery resulted mainly from filing increases in China, the Republic of Korea and the U.S. Compared to 2014, those three offices received between 3,500 and 4,500 additional filings each.
The total number of designs contained in applications (design count) increased modestly by 0.6% to about 1.14 million in 2015 (figure 16). Designs contained in non-resident applications increased by 1.8%, a faster increase than for those contained in resident applica-tions (+0.4%).
Design count
In an industrial design application or registration, some offices allow applications to contain more than one design for the same good or in the same class – others allow only one design per application. To capture the differences in application filing systems across offices, one needs to compare their respective application and registration design counts.
Designs in applications filed in China accounted for half the global total
The State Intellectual Property Office of China (SIPO) received applications containing a total of 569,059 designs, up 0.8% from 2014. Designs in applications filed by residents increased by 0.6% and accounted for 97% of SIPO’s total, while those filed by non-residents grew by 9%. SIPO remained by far the office with the largest design count, receiving half of all designs in applications filed worldwide in 2015. It was followed by the European Union Intellectual Property Office (EUIPO; 98,162) and the Korean Intellectual Property Office (KIPO; 72,458).
The top 20 offices combined accounted for 90% of designs in total applications.1 Of these offices, 11 saw increases in application design counts. The of-fices of the Islamic Republic of Iran (+33.8%), China, Hong Kong (SAR) (+15.7%), the U.S. (+13.4%) and India (+10.5%) saw double-digit growth. Seven of the nine offices that saw declines in design counts were located in Europe, such as the offices of the Russian Federation (-17.9%), Ukraine (-11.2%), France (-9.8%) and Germany (-7.5%). The offices of Brazil (-8.4%) and Turkey (-6%) also received fewer design counts in 2015 than the previous year.
1. Design count data for the office of Italy were not available for 2015. In 2014, the office of Italy ranked seventh in the world on this measure.
Figure 15. Industrial design applications worldwide
0
250,000
500,000
750,000
1,000,000
Appli
catio
ns2001 2003 2005 2007 2009 2011 2013 2015
Application year
Source: Standard figure C1.
Figure 16. Number of designs in industrial design applications worldwide
0
400,000
800,000
1,200,000
Desig
n cou
nt
2005 2007 2009 2011 2013 2015
Application year
Source: Standard figure C2.

112
INDU
STRI
AL D
ESIG
NS
HIGHLIGHTS
Figure 17. Application design counts for the top 10 offices, 2015
0
150,000
350,000
550,000
Desig
n cou
nt
China
EUIPO
Republic
of Kore
a
Germany
Turkey
United S
tates o
f Americ
aJap
anSpai
nFran
ce
Switzerlan
d
Resident Non-resident
Source: Standard figure C10.
The contribution of non-resident designs was the pri-mary driver of growth at six of the top 20 offices and had a positive impact overall on the rates of 12 offices. This contribution was particularly high in China, Hong Kong (SAR) and Morocco. The increase in resident and non-resident design counts contributed at a similar level to overall growth at the offices of Australia, SIPO and the United States Patent and Trademark Office (USPTO).
The top 20 list features 11 offices located in high-income countries, six in upper middle-income countries and three in lower middle-income countries. The offices of all upper middle-income countries combined received 58.1% of all designs contained in applications filed in 2015 (figure 18). China accounted for the vast major-ity of this share, with the other upper middle-income countries generating only 8.4% of the world total. The share of high-income countries stood at 37.6%. Offices of lower middle-income countries received 4.1% of the total, and those of low-income countries only 0.2%.
Between 2005 and 2015, average annual growth was 13.3% for China and 3.7% for the other upper middle-income countries. Over the same period, offices in high-income (+1.5%), lower middle-income (+1.7%) and low-income (-3.6%) countries had much lower growth rates. Asia accounted for a large majority (68%) of all designs in applications filed worldwide in 2015 (figure 19). It was followed by Europe (24.5%) and North America (4%).
Of all geographical regions, Asia (+9.4%) and North America (+4.3%) had the highest average annual growth between 2005 and 2015. In contrast, Africa (-0.8%),
Europe (+0.9%), Latin America & the Caribbean (LAC; -0.2%) and Oceania (+0.5%) had average annual growth rates close to zero.
Equivalent design count
Designs in applications filed at regional offices are equivalent to multiple designs in applications filed in the respective member states of those offices. To calculate the number of equivalent designs for the African Intellectual Property Organization (OAPI, which has 17 member states), the Benelux Office for Intellectual Property (3) and EUIPO (28), each design is multiplied by the corresponding number of member states. However, the African Regional Intellectual Property Organization (ARIPO) does not register industrial designs with automatic region-wide applicability. Thus, for this office, each application is counted as one application abroad if the applicant does not reside in a member state or as one resident application and one application abroad if the applicant resides in a member state.
China topped the list by origin
Applications received by offices from resident and non-resident applicants are referred to as office data, whereas applications filed by applicants at a national/regional office (resident applications) or at foreign offices (applications abroad) are referred to as origin data. Here, industrial design statistics based on the origin of the residence of the first-named applicant are reported to complement the picture of industrial design activity worldwide.
Applicants from China had the highest equivalent de-sign counts in 2015, with 729,340 (map 3). They were followed by applicants residing in Germany (573,268),

113
INDU
STRI
AL D
ESIG
NS
HIGHLIGHTS
Italy (284,093), the U.S. (278,814) and France (212,376). Equivalent designs in applications filed abroad ac-counted for between 89% and 96% of the total for applicants from all of these countries, except for those from China, whose designs in applications filed at SIPO accounted for 76% of the total.
Among the top 20 origins, 13 saw their equivalent design counts decrease compared to 2014, includ-ing double-digit drops for Turkey (-13.9%), Bulgaria (-12.9%), Germany (-11.6%) and the Netherlands (-11%). The sharpest increases came from applicants re-siding in Denmark (+16.7%), Poland (+10.4%) and China (+8.3%).
European origins dominated the top 20 ranking, with 15 countries, followed by four located in Asia and one in North America. In terms of income categories, 17 belonged to the high-income group, and there were three upper middle-income countries – Bulgaria, China and Turkey – included in this list of top origins.
Applicants from Germany (509,658), Italy (274,142) and the U.S. (256,183) had the highest number of equivalent designs in applications filed abroad. Six of the top 10 or-igins in terms of equivalent designs in applications filed abroad saw growth in 2015. Applicants from China saw the sharpest increase (+42.2%), overtaking the United Kingdom (U.K.) to rank sixth. In contrast, Germany (-12.2%) experienced the most pronounced decline.
Figure 18. Application design counts by income group
2005
High-income: 57.8% Upper middle-income: 35.8%Lower middle-income: 6.1% Low-income: 0.4%
2015
High-income: 37.6% Upper middle-income: 58.1%Lower middle-income: 4.1% Low-income: 0.2%
Source: Standard table C7.
Figure 19. Application design counts by region
2005
Asia: 49.3% Europe: 39.7%North America: 4.7% Africa: 2.7%LAC: 2.4% Oceania: 1.2%
2015
Asia: 68.0% Europe: 24.5%North America: 4.0% Africa: 1.4%LAC: 1.3% Oceania: 0.7%
Source: Standard table C8.

114
INDU
STRI
AL D
ESIG
NS
Adjusting for GDP and population
The Republic of Korea had the highest resident de-sign count per 100 billion US dollars (USD) of gross domestic product (GDP) in 2015 (figure 20). It was fol-lowed by China and Turkey. This top three ranking is unchanged from 2014. Most of the remaining 17 were European countries, except Morocco (at number 6) and Madagascar (15) from Africa, and Japan (20) from
Asia. In Europe, the three countries with the highest resident design count per unit of GDP were Germany (4), Luxembourg (5) and Spain (7). Similarly, the Republic of Korea remained by far the country with the highest resident design count per million population in 2015. It was followed by Germany and Switzerland. China overtook Austria to rank in sixth position. As with resident design counts per unit of
Industrial design applications filed since 1883
Between 1883 and the early 1950s, the Japan Patent Office (JPO) and the USPTO averaged similar numbers of applica-tions, rarely exceeding 10,000. The JPO received the largest number of applications from the 1950s to the late 1990s, reaching about 50,000 annual filings at its peak. SIPO began receiving applications in 1985 and saw unprecedented growth, from 640 in 1985 to 660,000 in 2013. It experienced its first drop in 2014. KIPO surpassed the JPO in 2004, and has
remained the second-largest office since then. In 2012, the USPTO moved ahead of the JPO to become the third largest. The fifth-largest office is the EUIPO, which began receiving applications in 2003 and reached a plateau in its number of filings, at around 25,000, in 2013. Unlike the other four offices, the EUIPO has a multiple design system. Applications filed at the EUIPO contained 98,162 designs in 2015.
Trend in industrial design applications for the top five offices
~~~~
25,000
50,000
75,000
100,000
700,000
Appli
catio
ns
1883 1890 1900 1910 1920 1930 1940 1950 1960 1970 1980 1990 2000 2015
Application year
China Republic of Korea United States of America Japan EUIPO
Source: Standard figure C9.
Map 3. Equivalent design counts by origin, 2015
300,000 - 799,999100,000 - 299,99910,000 - 99,9991,000 - 9,9991 - 999No data
Source: Standard figure C16.
HIGHLIGHTS

115
INDU
STRI
AL D
ESIG
NS
GDP, Brazil, India and the U.S. do not appear among the top 20 origins. Compared with 2005, the resident design count per million population in 2015 sharply increased for China, Portugal and the Republic of Korea, but dropped dramatically for China, Hong Kong (SAR), Japan, Belgium and the Czech Republic.
Furnishing and articles of clothing were the most recorded classes
The Locarno classification includes 32 classes of in-dustrial designs. In 2015, the classes that accounted for the largest shares of the world total were furnishings (9.4%), articles of clothing (8.3%) and packages and containers (7%).
Grouping the Locarno classes into 12 industry sectors shows that applications filed at most of the top 10 of-fices are concentrated in three sectors, although these three sectors vary from office to office. For example, textiles and accessories appeared as the main sector at the EUIPO and the offices of Australia, Germany, India and the Republic of Korea. The tools and machines sector accounted for the largest share in Canada and the Russian Federation. By contrast, the most recorded sector was ICT and audiovisual in China Hong Kong (SAR), and furniture and household goods in Turkey. Among the top 15 origins, France, Germany, Turkey and the U.K. had most applications belonging to one of the three following sectors: advertising, furniture and household goods, and textiles and accessories. In fact, the furniture and household goods sector and the
textiles and accessories sector both appeared among the top three sectors for 11 of the top 15 origins in 2015. The textiles and accessories sector also accounted for the largest share of the total for eight of the top 15 origins, including Austria, India, Italy, the Republic of Korea and Spain.
Sharp increase in registrations
An estimated 729,800 industrial designs were regis-tered worldwide in 2015, up 21.3% on 2014. This sharp increase was mainly due to strong growth in registra-tions at SIPO, which registered 482,659 industrial designs – about 121,000 more than in 2014, and 96% of which related to resident applicants. As a result, applications registered to residents increased much faster worldwide (+23.6%) than those registered to non-residents (+8.1%).
About 989,400 designs were contained in applica-tions registered in 2015, up 14.6% on 2014. Designs contained in resident registrations increased by 16.8%, while those contained in non-resident registrations increased by 5.1%. China accounted for nearly half of all designs in applications registered worldwide, and the top 20 offices combined recorded nearly 90% of the total. Among these offices, five saw double-digit growth, including the Russian Federation (+46.2%), China (+33.5%) and the U.S. (+16.9%). By contrast, eight experienced decreases compared to 2014, with the sharpest falls in Canada (-8.2%), Spain (-4.6%) and Switzerland (-4.1%).
Figure 20. Resident application design counts per 100 billion USD GDP for the top 10 origins
0
1,000
2,000
3,000
4,000
Resid
ent d
esign
coun
t
Republic
of Kore
aChin
aTurk
ey
Germany
Luxem
bourg
Morocco Spai
nUkra
ine
Bulgaria
Switzerlan
d
2005 2015
Source: Standard figure C25.
HIGHLIGHTS

116
INDU
STRI
AL D
ESIG
NS
Industrial designs in force rose to 3.4 million
In 2015, 3.4 million industrial design registrations were in force worldwide, representing annual growth of 2.8%. With 1.24 million active industrial design registra-tions, China accounted for 36% of the world total. The Republic of Korea (318,027), the U.S. (293,596), Japan (251,121) and the EUIPO (182,853) completed the list of the top five offices.2
Among the top 20 offices, the Russian Federation (+12.6%), Indonesia (+12.1%) and Turkey (+9.5%) saw the sharpest increases, whereas active registrations decreased most markedly in Malaysia (-23%), Spain (-20.6%) and at the EUIPO (-13%).
Hague filings grew sharply
The Hague System offers applicants an advanta-geous route for seeking industrial design protection internationally as an alternative to using the Paris Convention for the Protection of Industrial Property to pursue industrial design rights in different countries. For further information and statistics on this System, see the Hague Yearly Review, 2016.
In 2015, the Hague System received 4,111 international applications, up 40.6% on 2014. These applications contained 16,435 designs, representing annual growth of 13.8%. The increase in international applications in 2015 was the fastest since 2008. This growth was partly due to the accessions to the System of the Republic of Korea in 2014 and of Japan and the U.S. in 2015.
With 3,453 designs in applications, applicants resid-ing in Germany remained the largest users of the Hague System. They were followed by applicants from Switzerland (3,316 designs), France (1,317), the Republic of Korea (1,282) and Italy (1,186). Combined, these five origins accounted for 64% of the total. Three of these five origins experienced growth in filings. There was sharp growth in the number of designs in interna-tional applications originating from applicants residing in the Republic of Korea, which became a Hague mem-ber in July 2014: design counts jumped from 125 in the second half of 2014 to 1,282 in 2015. Applicants from Italy (+30.9%) and Switzerland (+4%) also saw growth. By contrast, designs in filings from Germany and France decreased by 10.7% and 15.5%, respectively.
2. Active industrial design registration data for the office of France were not available for 2015. In 2014, the office of France ranked second in the world.
With 1,132 designs in applications, Samsung Electronics of the Republic of Korea displaced Swatch AG of Switzerland (511 designs) to become the largest user of the Hague System in 2015. Fonkel Meubelmarketing of the Netherlands (438), Volkswagen of Germany (418) and Procter & Gamble of the U.S. (369) completed the list of the top five applicants.
Since 2010, the European Union has received the larg-est number of designs contained in designations each year; it recorded 13,354 designs in 2015. It was followed by Switzerland (9,525) and Turkey (6,207). Twelve of the top 20 designated Hague members recorded double-digit annual growth.
In 2015, 54% of non-resident applications filed at offices of Hague members were filed via the Hague System – an increase of just 0.4 percentage points on the 2014 share of 53.6%.3
3. The JPO and the USPTO are not included in this calculation as their countries became member of the Hague System in the course of 2015.
HIGHLIGHTS

117
INDU
STRI
AL D
ESIG
NS
Standard figures and tablesIndustrial design applications and registrations worldwide 118C1 Trend in industrial design applications worldwide 118C2 Trend in application design counts worldwide 118C3 Resident and non-resident application design counts worldwide 119C4 Trend in industrial design registrations worldwide 119C5 Trend in registration design counts worldwide 120C6 Resident and non-resident registration design counts worldwide 120
Industrial design applications and registrations by office 121C7 Application design counts by income group 121C8 Application design counts by region 121C9 Trend in industrial design applications for the top five offices 121C10 Application design counts for the top 20 offices, 2015 122C11 Contribution of resident and non-resident application design counts to total growth for the top 20 offices, 2014-15 122C12 Application design counts for offices of selected low- and middle-income countries, 2015 123C13 Contribution of resident and non-resident application design counts to total growth for offices of selected
low- and middle-income countries, 2014-15 123C14 Registration design counts for the top 20 offices, 2015 124C15 Registration design counts for offices of selected low- and middle-income countries, 2015 124
Application design counts by origin 125C16 Equivalent application design counts by origin, 2015 125C17 Application design counts for the top 20 origins, 2015 125C18 Application design counts for selected low- and middle-income origins, 2015 126C19 Application design counts abroad for the top 20 origins, 2015 126C20 Application design counts for the top 25 offices and origins, 2015 127C21 Distribution of application design counts for the top 20 offices and selected origins 128
Application design counts by Locarno class 128C22 Application design counts by Locarno class, 2015 128C23 Distribution of application design counts by the top three sectors and for the top 10 offices, 2015 129C24 Distribution of application design counts by the top three sectors and for the top 15 origins, 2015 129
Application design count in relation to GDP and population 130C25 Resident application design count per 100 billion of USD GDP for the top 20 origins 130C26 Resident application design count per million population for the top 20 origins 130
Industrial design registrations in force 131C27 Industrial design registrations in force worldwide 131C28 Industrial design registrations in force for the top 20 offices, 2015 131C29 Industrial design registrations in force in 2015 as a percentage of total registrations 132C30 Average age of industrial design registrations in force at selected offices 132
Industrial design applications and registrations through the Hague System 133C31 Designs contained in Hague international applications by origin, 2015 133C32 Top Hague applicants based on number of designs, 2015 133C33 Trend in designs contained in Hague international applications 134C34 Designs contained in designations in Hague international applications for the top 20 designated Hague members, 2015 134C35 Designs contained in Hague international applications for the top 20 origins, 2015 135C36 Trend in active Hague international registrations 135C37 Designs contained in non-resident applications by filing route for selected Hague members, 2015 136
Statistical tables 136C38 Industrial design applications by office and origin, 2015 136C39 Industrial design registrations by office and origin, and industrial designs in force, 2015 140
118
STANDARD FIGURES AND TABLES
INDU
STRI
AL D
ESIG
NS
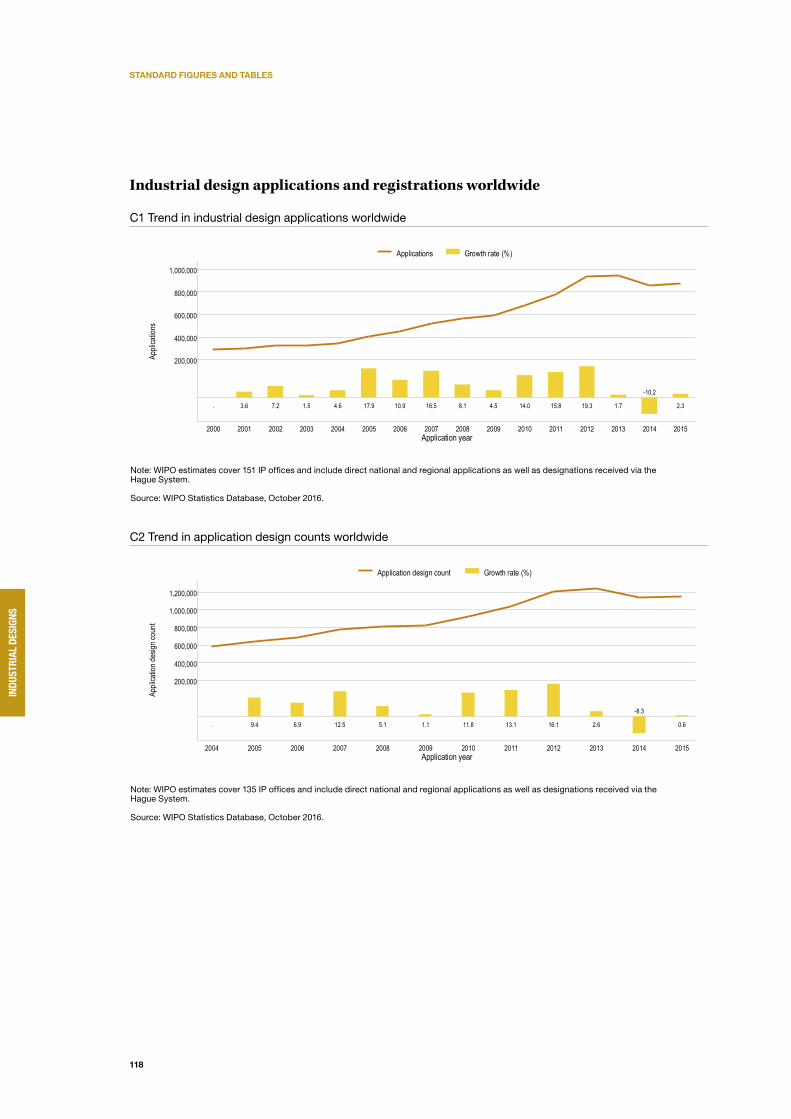
Industrial design applications and registrations worldwide
C1 Trend in industrial design applications worldwide
. 3.6 7.2 1.5 4.6 17.9 10.9 16.5 8.1 4.5 14.0 15.8 19.3 1.7
-10.2
2.3
200,000
400,000
600,000
800,000
1,000,000
Appli
catio
ns
2000 2001 2002 2003 2004 2005 2006 2007 2008 2009 2010 2011 2012 2013 2014 2015
Applications Growth rate (%)
Application year
Note: WIPO estimates cover 151 IP offices and include direct national and regional applications as well as designations received via the Hague System.
Source: WIPO Statistics Database, October 2016.
C2 Trend in application design counts worldwide
. 9.4 6.9 12.5 5.1 1.1 11.8 13.1 16.1 2.6
-8.3
0.6
200,000
400,000
600,000
800,000
1,000,000
1,200,000
Appli
catio
n des
ign co
unt
2004 2005 2006 2007 2008 2009 2010 2011 2012 2013 2014 2015
Application design count Growth rate (%)
Application year
Note: WIPO estimates cover 135 IP offices and include direct national and regional applications as well as designations received via the Hague System.
Source: WIPO Statistics Database, October 2016.

119
STANDARD FIGURES AND TABLES
INDU
STRI
AL D
ESIG
NS
C3 Resident and non-resident application design counts worldwide
Non-resident share (%)
29.4 25.1 23.3 22.1 20.1 16.2 15.3 15.0 14.2 14.5 15.6 15.7
200,000
400,000
600,000
800,000
1,000,000
Appli
catio
n des
ign co
unt
2004 2005 2006 2007 2008 2009 2010 2011 2012 2013 2014 2015Application year
Resident Non-resident
Note: WIPO estimates cover 135 IP offices and include direct national and regional applications as well as designations received via the Hague System.
Source: WIPO Statistics Database, October 2016.
C4 Trend in industrial design registrations worldwide
.
-1.1
10.4 5.0
-5.6
5.5 9.6 14.6 2.5 25.2 19.7 9.9 16.5
-6.5 -6.2
21.3
200,000
400,000
600,000
800,000
Regis
tratio
ns
2000 2001 2002 2003 2004 2005 2006 2007 2008 2009 2010 2011 2012 2013 2014 2015
Registrations Growth rate (%)
Registration year
Note: WIPO estimates cover 146 IP offices and include registrations issued for direct applications and designations received via the Hague System.
Source: WIPO Statistics Database, October 2016.

120
STANDARD FIGURES AND TABLES
INDU
STRI
AL D
ESIG
NS
C5 Trend in registration design counts worldwide
. 1.1 0.7 11.9 2.9 9.3 16.2 7.2 14.8
-1.7 -7.6
14.6
200,000
400,000
600,000
800,000
1,000,000
Regis
tratio
n de
sign
coun
t
2004 2005 2006 2007 2008 2009 2010 2011 2012 2013 2014 2015
Registration design count Growth rate (%)
Registration year
Note: WIPO estimates cover 130 IP offices and include registrations issued for direct applications and designations received via the Hague System.
Source: WIPO Statistics Database, October 2016.
C6 Resident and non-resident registration design counts worldwide
Non-resident share (%)
30.9 27.7 27.8 27.2 25.3 20.4 17.8 16.8 16.0 17.3 19.0 17.4
200,000
400,000
600,000
800,000
Regis
tratio
n de
sign
coun
t
2004 2005 2006 2007 2008 2009 2010 2011 2012 2013 2014 2015Registration year
Resident Non-resident
Note: WIPO estimates cover 130 offices and include registrations issued for direct applications and designations received via the Hague System.
Source: WIPO Statistics Database, October 2016.

121
STANDARD FIGURES AND TABLES
INDU
STRI
AL D
ESIG
NS
Industrial design applications and registrations by office
C7 Application design counts by income groupNumber of designs
in applications Resident share (%) Share of world total (%)Average
growth (%)
Income group 2005 2015 2005 2015 2005 2015 2005-15
High-income 372,500 430,800 71.7 73.8 57.8 37.6 1.5
Upper middle-income 230,600 665,700 85.7 92.9 35.8 58.1 11.2
...Upper middle-income without China 67,200 96,600 68.7 69.2 10.4 8.4 3.7
Lower middle-income 39,100 46,500 45.8 59.2 6.1 4.1 1.7
Low-income 2,600 1,800 20.1 40.3 0.4 0.2 -3.6
World 644,800 1,144,800 74.9 84.3 100.0 100.0 5.9
Note: WIPO estimates cover 135 offices. Each category includes the following number of IP offices: high-income (52), upper middle-income (38), lower middle-income (35) and low-income (10). European Union Intellectual Property Office data are allocated to the high-income group because most European Union member states are high-income countries. African Intellectual Property Organization data are similarly allocated to the low-income group.
Source: WIPO Statistics Database, October 2016.
C8 Application design counts by regionNumber of designs
in applications Resident share (%) Share of world total (%)Average
growth (%)
Region 2005 2015 2005 2015 2005 2015 2005-15
Africa 17,700 16,300 37.2 54.1 2.7 1.4 -0.8
Asia 317,900 778,100 87.4 92.1 49.3 68.0 9.4
Europe 255,700 281,000 67.8 73.2 39.7 24.5 0.9
Latin America & the Caribbean 15,300 15,000 41.9 46.7 2.4 1.3 -0.2
North America 30,200 46,000 50.0 50.9 4.7 4.0 4.3
Oceania 8,000 8,400 46.1 37.7 1.2 0.7 0.5
Total 644,800 1,144,800 74.9 84.3 100.0 100.0 5.9
Note: WIPO estimates are based on data covering 135 offices and include the following number of offices: Africa (22), Asia (38), Europe (42), Latin America & the Caribbean (26), North America (2) and Oceania (5).
Source: WIPO Statistics Database, October 2016.
C9 Trend in industrial design applications for the top five offices
150,000
300,000
450,000
600,000
750,000
Appli
catio
ns
1883 1890 1900 1910 1920 1930 1940 1950 1960 1970 1980 1990 2000 2010 2015
Application year
China Republic of Korea United States of America Japan EUIPO
15,000
30,000
45,000
60,000
75,000
Appli
catio
ns
1992 1994 1996 1998 2000 2002 2004 2006 2008 2010 2012 2014
Application year
Note: EUIPO is the European Union Intellectual Property Office. Data are based on the numbers of applications filed; that is, differences between single-design and multiple-design filing systems across IP offices are not taken into account. The top five offices were selected based on their 2015 totals.
Source: WIPO Statistics Database, October 2016.

122
STANDARD FIGURES AND TABLES
INDU
STRI
AL D
ESIG
NS
C10 Application design counts for the top 20 offices, 2015
Non-resident share (%)3.1 30.1 9.1 20.1 15.6 43.6 18.2 3.4 6.1 60.3
569,059
98,162 72,458 56,499 45,852 40,128 30,351 17,855 13,997 12,242
Appli
catio
n des
ign co
unt
China
EUIPO
Republic
of Kore
a
Germany
Turkey
United S
tates o
f Americ
aJap
anSpai
nFran
ce
Switzerlan
d
Office
Resident Non-resident
Non-resident share (%).. 33.6 42.7 59.8 45.5 56.4 37.3 86.4 74.2 24.2
11,85610,290
7,488 7,0246,039 6,002 5,950 5,846 5,182
4,461
Appli
catio
n des
ign co
unt
Iran (Is
lamic R
epublic
of) India
Ukraine
Australi
aBraz
il
Russian
Feder
ation
Morocco
Canada
China, H
ong Kong
SAR
Thailan
d
Office
Resident Non-resident Total
.. indicates not available.
Note: EUIPO is the European Union Intellectual Property Office. Application design count data for Italy and the United Kingdom were not available.
Source: WIPO Statistics Database, October 2016.
C11 Contribution of resident and non-resident application design counts to total growth for the top 20 offices, 2014-15
0.5 0.3
-0.9
0.84.1
1.8
-2.6-4.9 -5.2
-0.8
6.5 6.9
-0.2
2.3
-3.2
0.7
-7.5-2.3
4.6
-9.8
7.13.4
-7.9-3.3
2.9 3.6
-6.1-2.3
-7.8-10.1
0.6
7.1
-1.1
2.5
-3.1
18.8
8.8
0.6
Total growth rate (%)0.8 -0.1 5.9 -7.5 -6.0 13.4 2.1 -2.5 -9.8 -5.2 33.8 10.5 -11.2 6.5 -8.4 -17.9 7.7 1.4 15.7 9.4
0
Cont
ributi
on to
grow
th
China
EUIPO
Republic
of Kore
a
Germany
Turkey
United S
tates o
f Americ
aJap
anSpai
nFran
ce
Switzerlan
d
Iran (Is
lamic R
epublic
of) India
Ukraine
Australi
aBraz
il
Russian
Feder
ation
Morocco
Canada
China, H
ong Kong
SAR
Thailan
d
Office
Contribution of resident application design count Contribution of non-resident application design count
Note: EUIPO is the European Union Intellectual Property Office. This figure shows total growth in application design counts broken down by the respective contributions of resident and non-resident filings. For example, design counts in Australia grew by 6.5%, and resident applicants contributed 2.9 percentage points to this total growth. The resident and non-resident breakdown was not available for the office of the Islamic Republic of Iran.
Source: WIPO Statistics Database, October 2016.

123
STANDARD FIGURES AND TABLES
INDU
STRI
AL D
ESIG
NS
C12 Application design counts for offices of selected low- and middle-income countries, 2015
Non-resident share (%)56.8 33.3 36.3 63.1 64.4 91.8 85.8 98.0 51.1 96.53,999 3,972
2,885
1,960 1,762 1,5781,235 1,197 1,103 886Ap
plica
tion d
esign
coun
t
Mexico
Indone
sia
Viet Nam
South A
frica
Malaysi
aTuni
sia
Georgia
Bosnia a
nd Herz
egovin
a
Philippi
nes
Armenia
Office
Resident Non-resident
Non-resident share (%)97.5 62.8 50.1 25.6 5.1 47.8 63.4 91.3 0.5 80.6853
799718
489428 387 358
230 206124Ap
plica
tion d
esign
coun
t
Kyrg
yzstan OAPI
Colombia
Pakista
n
Uzbekis
tanBela
rus Peru
Guatem
ala
Madagas
carARIPO
Office
Resident Non-resident
Note: ARIPO is the African Regional Intellectual Property Organization. OAPI is the African Intellectual Property Organization. The selected offices are from different world regions and income groups (low-income, lower middle-income and upper middle-income). Where available, data for all offices are in the statistical table at the end of this section.
Source: WIPO Statistics Database, October 2016.
C13 Contribution of resident and non-resident application design counts to total growth for offices of selected low- and middle-income countries, 2014-15
-1.1 -0.9
3.1 3.4 3.96.7
-2.5
1.8
-10.6
4.2
-2.5
13.69.2
20.5
-3.3
0.6
-21.5
3.30.0
17.2
-3.6
17.0
-7.9
3.5
15.19.3
-19.9
7.5 9.7
-6.1
6.6
-24.1
8.53.7
-12.5
-23.6
1.0
-1.5-4.5
-15.0
Total growth rate (%)-2.0 6.5 10.6 -0.7 -6.4 11.1 29.7 -2.7 -18.2 17.2 13.4 -4.4 24.4 -12.4 3.6 -17.5 12.2 -36.1 -0.5 -19.5
0
Cont
ributi
on to
grow
th
Mexico
Indone
sia
Viet Nam
South A
frica
Malaysi
aTuni
sia
Georgia
Bosnia a
nd Herz
egovin
a
Philippi
nes
Armenia
Kyrgyzs
tan OAPI
Colombia
Pakista
n
Uzbekis
tanBela
rus Peru
Guatem
ala
Madagas
carARIPO
Office
Contribution of resident application design count Contribution of non-resident application design count
Note: ARIPO is the African Regional Intellectual Property Organization. OAPI is the African Intellectual Property Organization. The selected offices are from different world regions and income groups (low-income, lower middle-income and upper middle-income). Where available, data for all offices are in the statistical table at the end of this section. This figure shows total growth in design counts broken down by the respective contributions of resident and non-resident filings. For example, the design count in Indonesia grew by 6.5%, and resident applicants contributed 3.1 percentage points to this growth.
Source: WIPO Statistics Database, October 2016.
124
STANDARD FIGURES AND TABLES
INDU
STRI
AL D
ESIG
NS
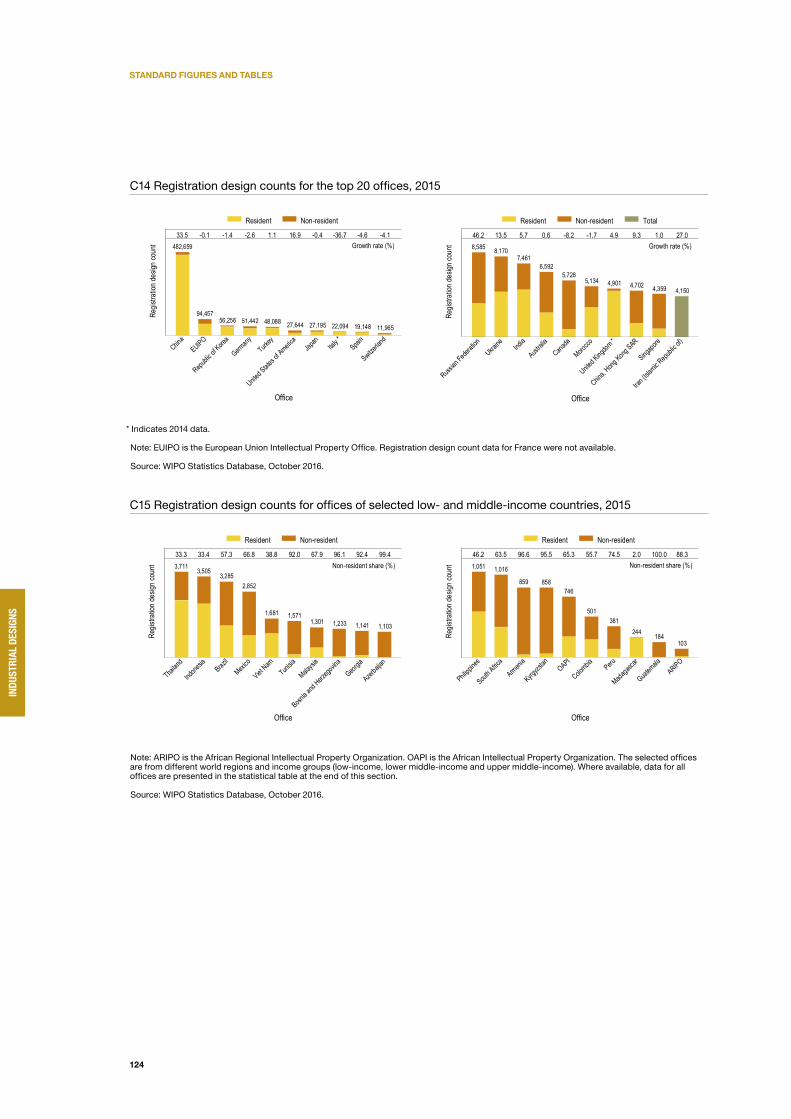
C14 Registration design counts for the top 20 offices, 2015
Growth rate (%)33.5 -0.1 -1.4 -2.6 1.1 16.9 -0.4 -36.7 -4.6 -4.1
482,659
94,45756,256 51,442 48,088 27,644 27,195 22,094 19,148 11,965
Regis
tratio
n de
sign
coun
t
Chin
aEUIPO
Republic
of Kore
a
Germany
Turkey
United S
tates o
f Americ
aJap
anItal
y *Spai
n
Switzerlan
d
Office
Resident Non-resident
Growth rate (%)46.2 13.5 5.7 0.6 -8.2 -1.7 4.9 9.3 1.0 27.08,585 8,170
7,4616,592
5,7285,134 4,901 4,702 4,359 4,150
Regis
tratio
n de
sign
coun
t
Russian
Feder
ation
Ukraine Ind
ia
Australi
aCana
da
Morocco
United K
ingdom
*
China, H
ong Kong
SAR
Singapo
re
Iran (Is
lamic R
epublic
of)
Office
Resident Non-resident Total
* Indicates 2014 data.
Note: EUIPO is the European Union Intellectual Property Office. Registration design count data for France were not available.
Source: WIPO Statistics Database, October 2016.
C15 Registration design counts for offices of selected low- and middle-income countries, 2015
Non-resident share (%)33.3 33.4 57.3 66.8 38.8 92.0 67.9 96.1 92.4 99.43,711 3,505
3,2852,852
1,681 1,5711,301 1,233 1,141 1,103
Regis
tratio
n de
sign
coun
t
Thailan
d
Indone
siaBraz
ilMexi
co
Viet Nam
Tunisia
Malaysi
a
Bosnia a
nd Herz
egovin
a
Georgia
Azerbai
jan
Office
Resident Non-resident
Non-resident share (%)46.2 63.5 96.6 95.5 65.3 55.7 74.5 2.0 100.0 88.31,051 1,016
859 858746
501381
244 184103
Regis
tratio
n de
sign
coun
t
Phili
ppines
South A
frica
Armenia
Kyrgyzs
tan OAPI
Colombia Peru
Madagas
car
Guatem
alaARIPO
Office
Resident Non-resident
Note: ARIPO is the African Regional Intellectual Property Organization. OAPI is the African Intellectual Property Organization. The selected offices are from different world regions and income groups (low-income, lower middle-income and upper middle-income). Where available, data for all offices are presented in the statistical table at the end of this section.
Source: WIPO Statistics Database, October 2016.

125
STANDARD FIGURES AND TABLES
INDU
STRI
AL D
ESIG
NS
Application design counts by origin
C16 Equivalent application design counts by origin, 2015
300,000 - 799,999100,000 - 299,99910,000 - 99,9991,000 - 9,9991 - 999No data
Note: Equivalent application design count includes resident applications and applications filed abroad. The origin of an industrial design application is determined by the residence of the first-named applicant. Applications filed at some regional offices are considered equivalent to multiple applications in the member states of those offices. See the glossary for the full definition of equivalent application.
Source: WIPO Statistics Database, October 2016.
C17 Application design counts for the top 20 origins, 2015
Growth rate (%)1.7 5.5 -7.2 8.9 9.4 -6.3 -1.1 10.8 -9.8 -4.2
565,915
75,979 75,302 52,566 49,736 40,197 39,544 35,505 27,502 21,710
Ap
plica
tion d
esign
coun
t
Chin
a
Republic
of Kore
a
Germany
United S
tates o
f Americ
aItal
y *Turk
eyJap
an
Switzerlan
dFran
ceSpai
n
Origin
Resident Abroad
Growth rate (%)89.3 10.0 -6.6 -4.6 -6.7 1.2 -4.4 -16.1 2.2 12.28,780
7,1906,067
4,947 4,652 4,237 3,978 3,820 3,801 3,570
Ap
plica
tion d
esign
coun
t
Iran (Is
lamic R
epublic
of) *
India
Austria
Ukraine
Netherla
nds
Australi
aSwede
nBraz
il
Morocco
Thailan
d
Origin
Resident Abroad
* Indicates 2014 data.
Note: Data are based on absolute count, not equivalent count. Application design counts by origin include resident applications and applications filed abroad. The origin of an industrial design application is determined by the residence of the first-named applicant. An application filed at a regional office is considered a resident filing if the applicant is a resident of one of that office’s member states.
Source: WIPO Statistics Database, October 2016.
126
STANDARD FIGURES AND TABLES
INDU
STRI
AL D
ESIG
NS
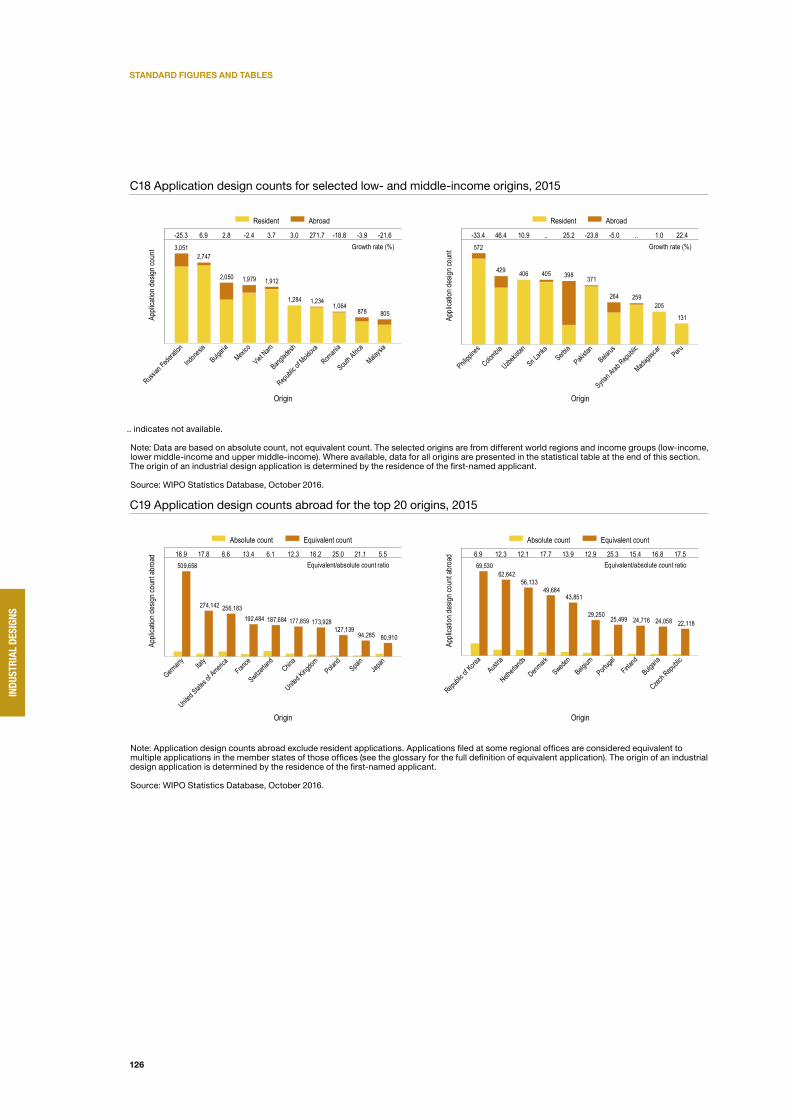
C18 Application design counts for selected low- and middle-income origins, 2015
Growth rate (%)-25.3 6.9 2.8 -2.4 3.7 3.0 271.7 -18.8 -3.9 -21.63,051
2,747
2,050 1,979 1,912
1,284 1,2341,064
878 805Appli
catio
n des
ign co
unt
Russ
ian Fe
deratio
n
Indone
sia
Bulgaria
Mexico
Viet Nam
Banglad
esh
Republic
of Mold
ova
Romani
a
South A
frica
Malaysi
a
Origin
Resident Abroad
Growth rate (%)-33.4 46.4 10.9 .. 25.2 -23.8 -5.0 .. 1.0 22.4572
429 406 405 398 371
264 259205
131Appli
catio
n des
ign co
unt
Philippi
nes
Colombia
Uzbekis
tan
Sri Lank
aSerb
ia
Pakista
nBela
rus
Syrian A
rab Repu
blic
Madagas
car Peru
Origin
Resident Abroad
.. indicates not available.
Note: Data are based on absolute count, not equivalent count. The selected origins are from different world regions and income groups (low-income, lower middle-income and upper middle-income). Where available, data for all origins are presented in the statistical table at the end of this section. The origin of an industrial design application is determined by the residence of the first-named applicant.
Source: WIPO Statistics Database, October 2016.
C19 Application design counts abroad for the top 20 origins, 2015
Equivalent/absolute count ratio16.9 17.8 8.6 13.4 6.1 12.3 16.2 25.0 21.1 5.5509,658
274,142 256,183192,484 187,684 177,859 173,928
127,13994,285 80,910
Appli
catio
n des
ign co
unt a
broa
d
Germany Ital
y
United S
tates o
f Americ
aFran
ce
Switzerlan
dChin
a
United K
ingdom Pola
ndSpai
nJap
an
Origin
Absolute count Equivalent count
Equivalent/absolute count ratio6.9 12.3 12.1 17.7 13.9 12.9 25.3 15.4 16.8 17.569,530
62,64256,133
49,68443,851
29,250 25,499 24,716 24,058 22,118
Appli
catio
n des
ign co
unt a
broa
d
Repu
blic of
Korea
Austria
Netherla
nds
Denmark
Sweden
Belgium
Portugal
Finland
Bulgaria
Czech R
epublic
Origin
Absolute count Equivalent count
Note: Application design counts abroad exclude resident applications. Applications filed at some regional offices are considered equivalent to multiple applications in the member states of those offices (see the glossary for the full definition of equivalent application). The origin of an industrial design application is determined by the residence of the first-named applicant.
Source: WIPO Statistics Database, October 2016.

127
STANDARD FIGURES AND TABLES
INDU
STRI
AL D
ESIG
NS
C20
Ap
plic
atio
n d
esig
n co
unts
for
the
top
25 o
ffice
s an
d or
igin
s, 2
015
Offic
e
Ori
gin
China
EUIPO
Republic of Korea
Germany
Turkey
United States of America
Japan
Spain
France
Switzerland
Iran (Islamic Republic of)
India
Ukraine
Australia
Brazil
Morocco
Russian Federation
Canada
China, Hong Kong SAR
Thailand
Norway
Singapore
Mexico
Indonesia
Viet Nam
Aus
tral
ia18
3 31
2 15
2
323
50
5 26
2
2,82
1 23
8
61
22
1 3
32
3 4
8
Aus
tria
62
2,21
4 7
2,27
2 26
13
9 16
10
7 19
29
17
23
18
3
13
7 5
Bra
zil
30
209
10
1 93
14
8
7 3,
289
15
3 5
17
5
Chi
na55
1,48
1 6,
047
251
4,10
5 53
1,
687
333
228
45
1 13
8 22
20
9 68
63
78
37
9 66
59
98
36
53
44
Chi
na, H
ong
Ko
ng S
AR
700
17
254
272
56
4 9
8 79
6
12
59
1,33
5 2
10
7 12
9
Den
mar
k13
5 1,
803
24
1 72
19
7 47
1
152
32
1 31
13
25
16
21
19
7 4
12
2
Fran
ce66
3 6,
752
256
37
520
690
308
6 13
,140
81
2 20
1 25
8 10
9 18
4 43
6 15
5 12
6 12
5 8
259
286
91
22
26
Ger
man
y1,
623
18,4
40
395
45,1
70
661
1,58
8 45
3 1
36
1,65
8 35
9 21
4 20
9 24
5 15
2 47
2 19
4 33
6 7
354
201
131
47
34
Ind
ia36
74
1
1 3
105
1 1
5 6,
829
5 2
6 1
8 16
8
2 1
9 13
2
Ind
one
sia
3 1
86
1 2
2,65
1
Ital
y54
9 9,
950
64
2,44
7 12
7 59
5 14
0 17
18
2 14
5 12
11
5 11
0 19
2 10
3 10
7 1
6 8
57
46
37
Jap
an3,
827
2,45
0 1,
184
86
131
2,51
5 24
,818
16
14
71
43
8 24
27
8 22
6 1
276
180
272
411
8 19
3 17
2 50
5 35
2
Mo
rocc
o34
1
12
1 1
13
3 3,
728
Net
herla
nds
252
1,94
9 28
0 1
40
218
177
1 8
137
17
77
110
2 11
9 17
83
17
96
99
31
Po
land
6 4,
694
3 13
8 8
43
2 1
39
1 74
3
39
2
Rep
ublic
of K
ore
a2,
818
2,18
6 65
,891
23
82
2,
575
616
5 14
13
8
1 13
8 17
4 27
8 93
14
0 51
3
74
137
71
172
Rus
sian
Fed
erat
ion
25
88
8 3
25
5 17
6
144
5 1
2,61
6 8
1 2
Sp
ain
139
3,44
8 17
11
0 39
15
7 23
17
,249
31
46
22
9
23
28
67
62
13
17
1 22
4
33
3
Sw
eden
210
1,56
5 50
11
28
32
4 81
19
15
60
7
81
59
11
76
82
20
6 76
1
34
8 3
Sw
itzer
land
840
5,78
1 1,
195
790
1,96
5 53
8 51
5 11
69
4,
858
164
1,25
3 13
9 11
7 1,
074
208
192
637
20
1,10
2 1,
291
82
43
18
Tha
iland
16
44
9 2
2 26
11
4
9 3
1 1
2 3,
383
1 8
3 9
10
Turk
ey36
43
7 11
62
38
,713
46
8
11
19
15
1 47
6
7 30
4
15
9 1
3
Ukr
aine
88
14
3 15
12
1
2 2
18
4,28
9 18
52
2
14
18
1
Uni
ted
Kin
gd
om
696
6,27
4 18
0 34
12
9 1,
252
176
1 47
24
3 8
355
138
1 18
3 17
1 87
14
52
71
67
13
Uni
ted
Sta
tes
of A
mer
ica
3,95
2 8,
376
1,62
3 22
3 34
4 22
,631
1,
622
4 13
3 55
1 87
7 74
1,
798
1,07
3 30
70
3 3,
260
990
155
109
257
1,14
5 19
8 23
1
Unk
now
n/O
ther
s1,
443
14,2
79
953
627
2,89
2 4,
076
878
319
439
3,64
8 11
,856
56
5 1,
062
50
4 14
8 42
2 36
6 1,
134
595
346
1,85
9 1,
688
1,85
3 10
6 1,
894
Tota
l56
9,05
9 98
,162
72
,458
56
,499
45
,852
40
,128
30
,351
17
,855
13
,997
12
,242
11
,856
10
,290
7,
488
7,02
4 6,
039
5,95
0 6,
002
5,
846
5,18
2 4,
461
4,15
3 4,
262
3,99
9 3,
972
2,8
85
Not
e: E
UIP
O is
the
Eur
op
ean
Uni
on
Inte
llect
ual P
rop
erty
Offi
ce. D
ata
are
bas
ed o
n ab
solu
te c
ount
, not
eq
uiva
lent
cou
nt.
Sou
rce:
WIP
O S
tatis
tics
Dat
abas
e, O
cto
ber
201
6.

128
STANDARD FIGURES AND TABLES
INDU
STRI
AL D
ESIG
NS
C21 Distribution of application design counts for the top 20 offices and selected origins
0
10
20
30
40
Shar
e of
appli
catio
n des
ign co
unt (
%)
Australi
aBraz
ilChin
aEUIPO
France
Germany Ind
iaJap
an
Republic
of Kore
a
Russian
Feder
ation
Spain
Switzerlan
dTurk
eyUkra
ine
United S
tates o
f Americ
a
Office
Austria China D.P.R. of Korea France Germany ItalyJapan Republic of Korea Switzerland United Kingdom United States of America
Note: EUIPO is the European Union Intellectual Property Office. D.P.R. of Korea is the Democratic People’s Republic of Korea. Data are based on absolute count, not equivalent count.
Source: WIPO Statistics Database, October 2016.
Application design counts by Locarno class
C22 Application design counts by Locarno class, 2015
Share (%)
9.4 8.3 7.0 6.0 5.8 5.3 5.2 4.9 4.7 4.6
30,346
26,608
22,640
19,276 18,76017,131 16,791 15,723 15,008 14,954
Appli
catio
n des
ign co
unt
Class 6
Class 2
Class 9
Class 1
4
Class 2
6
Class 2
5
Class 3
2
Class 1
2
Class 1
1Clas
s 7
Locarno class
Note: See Annex D for definitions. These figures are based on data from 103 IP offices. Class data were not available for the offices of China, Japan and the U.S.
Source: WIPO Statistics Database, October 2016.

129
STANDARD FIGURES AND TABLES
INDU
STRI
AL D
ESIG
NS
C23 Distribution of application design counts by the top three sectors for the top 10 offices, 2015
0
20
40
60
Shar
e of
appli
catio
n des
ign co
unt (
%)
Australi
aCana
da
China, H
ong Kong
SAREUIPO
France
Germany Ind
ia
Republic
of Kore
a
Russian
Feder
ation
Turkey
Office
Advertising Construction Furniture and household goods ICT and audiovisualPackaging Textiles and accessories Tools and machines Transport
Note: EUIPO is the European Union Intellectual Property Office. A concordance table produced by the Organisation for Economic Co-operation and Development (OECD) was used to convert the 32 classes into 12 industry sectors (see Annex D for definitions). The top three sectors and top 10 offices were selected based on their 2015 totals. Data for several large offices are missing or unavailable, including the offices of China, Japan and the U.S.
Source: WIPO Statistics Database, October 2016.
C24 Distribution of application design counts by the top three sectors for the top 15 origins, 2015
0
20
40
60
80
Shar
e of
appli
catio
n des
ign co
unt (
%)
Austria
China
France
Germany Ind
ia Italy
Japan
Netherla
ndsPola
nd
Republic
of Kore
aSpai
n
Switzerlan
dTurk
ey
United K
ingdom
United S
tates o
f Americ
a
Origin
Advertising Construction Electricity and lightning Furniture and household goods ICT and audiovisualPackaging Textiles and accessories Tools and machines Transport
Note: A concordance table produced by the Organisation for Economic Co-operation and Development (OECD) was used to convert the 32 classes into 12 industry sectors (see Annex D for definitions). The top three sectors and top 15 origins were selected based on their 2015 totals. These figures are based on data from 103 IP offices. Class data were not available for the offices of China, Japan and the U.S.
Source: WIPO Statistics Database, October 2016.

130
STANDARD FIGURES AND TABLES
INDU
STRI
AL D
ESIG
NS
Application design count in relation to GDP and population
C25 Resident application design count per 100 billion of USD GDP for the top 20 origins
3,517 3,7
86
2,049
3,001
2,604
2,596
1,728
1,774
471
1,452
1,449
1,087 1,3
59
1,344
1,221
1,064
319
1,015
898
847
727 799 98
779
8 1,111
616
596
585
566 83
355
0 825
546
Resid
ent a
pplic
ation
desig
n co
unt
per 1
00 bi
llion U
SD G
DP
Republic
of Kore
aChin
aTurk
ey
Germany
Luxem
bourg
Morocco Spai
nUkra
ine
Bulgaria
Switzerlan
d
Portugal
Austria
Denmark
France
Madagas
carCypr
usCroa
tiaFinla
nd
Czech R
epublic
Japan
Origin
2005 2015
Note: GDP data are in constant 2011 US PPP dollars. Origins were selected if they had a GDP greater than 25 billion PPP dollars and received resident applications containing more than 100 designs. Due to space constraints, only the top 20 origins that fulfil these criteria are presented.
Sources: WIPO Statistics Database and World Bank, October 2016.
C26 Resident application design count per million population for the top 20 origins
898
1,302
655 78
1
586
395 49
2
363 44
6
116
402
368
372
319 347
359
298
8527
1
243
219
207 28
019
5
392
183 213
164
168
155
139
143 168
128
125
Resid
ent a
pplic
ation
desig
n co
unt
per m
illion
popu
lation
Republic
of Kore
a
Germany
Switzerlan
dTurk
eySpai
nChin
aAust
ria
Denmark
France
Portugal
Sweden
Finland
Bulgaria Jap
an
China, H
ong Kong
SAR
Czech R
epublic
Netherla
nds
Singapo
re
Belgium Isra
el
Origin
2005 2015
Note: Origins were selected if they had a population greater than five million and received resident applications containing more than 100 designs. Due to space constraints, only the top 20 origins that fulfil these criteria are presented.
Sources: WIPO Statistics Database and World Bank, October 2016.

131
STANDARD FIGURES AND TABLES
INDU
STRI
AL D
ESIG
NS
Industrial design registrations in force
C27 Industrial design registrations in force worldwide
. 8.9 5.1
-0.0
2.8
1,000,000
2,000,000
3,000,000
4,000,000
Regis
tratio
ns in
force
2011 2012 2013 2014 2015
Registrations in force Growth rate (%)
Year
Note: WIPO estimates cover 97 IP offices and include direct national and regional applications as well as designations received via the Hague System. Data refer to the number of industrial design registrations in force and not the number of designs contained in registrations.
Source: WIPO Statistics Database, October 2016.
C28 Industrial design registrations in force for the top 20 offices, 2015
Growth rate (%)7.3 5.6 .. 3.2 0.1 -13.0 9.5 -1.0 -3.3 ..
1,238,406
318,027 304,000 293,596 251,121182,853
98,554 56,266 50,674 49,556
Regis
tratio
ns in
force
China
Republic
of Kore
a
France
*
United S
tates o
f Americ
aJap
anEUIPO
Turkey
Germany
Australi
aInd
ia *
Office
Growth rate (%)
2.0 6.7 3.7 12.1 12.6 -20.6 -3.8 6.8 -0.0 -23.0
43,11039,954
36,21231,206
28,697 27,91424,192
15,575 14,581 12,968Regis
tratio
ns in
force
Unite
d King
domCana
da
China, H
ong Kong
SAR
Indone
sia
Russian
Feder
ation
Spain
Mexico
South A
frica
Singapo
re
Malaysi
a
Office
.. indicates not available.* Indicates 2014 data.
Note: EUIPO is the European Union Intellectual Property Office. Data refer to the number of industrial design registrations in force and not the number of designs contained in registrations. Registration in force data were not available for Brazil or Italy.
Source: WIPO Statistics Database, October 2016.

132
STANDARD FIGURES AND TABLES
INDU
STRI
AL D
ESIG
NS
C29 Industrial design registrations in force in 2015 as a percentage of total registrations
2.2 2.4 1.64.5 4.8 4.8 5.9 7.5 9.0 10.6 8.6 6.6
9.3
16.9
32.5 30.9
38.8
32.7
50.653.7
58.261.0
71.1
80.5
90.6 92.8 93.5
87.5
Perc
entag
e of r
egist
ratio
ns
1988 1989 1990 1991 1992 1993 1994 1995 1996 1997 1998 1999 2000 2001 2002 2003 2004 2005 2006 2007 2008 2009 2010 2011 2012 2013 2014 2015Registration year
Note: Percentages are calculated using the number of industrial designs registered in year t and in force in 2015 divided by the total number of industrial designs registered in year t. The graph is based on data from 74 offices (including most large offices, with the exception of Brazil, France, Italy and Japan) for which a breakdown of industrial design registrations in force by year of registration was available.
Source: WIPO Statistics Database, October 2016.
C30 Average age of industrial design registrations in force at selected offices
9.3
10.3
8.6 8.88.2
8.67.8 7.7 7.6
6.3
7.66.9 6.9
5.0
6.8 6.9 6.7
5.56.5
5.76.4
5.1
6.25.4 5.3
4.45.2
4.24.7 4.4 4.5 4.3 4.3
2.3 2.6
Aver
age a
ge of
des
igns i
n for
ce (y
ears
)
Austria
Spain
Benelux
United K
ingdom
Germany
Turkey
United S
tates o
f Americ
a
South A
frica
Mexico
Malaysi
a
Russian
Feder
ation
Thailan
d
Australi
aEUIPO
Canada
Republic
of Kore
aUkra
ineChin
a
Office
2011 2015
Note: EUIPO is the European Union Intellectual Property Office.
Source: WIPO Statistics Database, October 2016.

133
STANDARD FIGURES AND TABLES
INDU
STRI
AL D
ESIG
NS
Industrial design applications and registrations through the Hague System
C31 Designs contained in Hague international applications by origin, 2015
1,000 - 3,999200 - 99960 - 19920 - 591 - 19No data
Source: WIPO Statistics Database, October 2016.
C32 Top Hague applicants based on number of designs, 2015
111111120122128143147153156
179183
369418
438511
1,132
Designs in Hague applications
Candy Polstermöbel (Germany)Harry Winston (Switzerland)
Centek (United Kingdom)Impress Tech (Cyprus)
Kronoplus Technical (Switzerland)Wenko-Wenselaar (Germany)
Cartier Creation Studio (Switzerland)Legero (Austria)
Thomas Sabo (Germany)Gillette (United States of America)
Thun (Italy)Procter & Gamble (United States of America)
Volkswagen (Germany)Fonkel Meubelmarketing (Netherlands)
Swatch (Switzerland)Samsung Electronics (Republic of Korea)
Appli
cant
Source: WIPO Statistics Database, October 2016.

134
STANDARD FIGURES AND TABLES
INDU
STRI
AL D
ESIG
NS
C33 Trend in designs contained in Hague international applications
.
-8.2
2.5
-46.0 -24.7 -17.9 -15.9
19.7 38.8 3.5 24.2 4.2 3.5 5.8 9.6 13.8
0
5,000
10,000
15,000
20,000
25,000
Desig
ns in
appli
catio
ns
2000 2001 2002 2003 2004 2005 2006 2007 2008 2009 2010 2011 2012 2013 2014 2015
Designs in applications Growth rate (%)
Application year
Source: WIPO Statistics Database, October 2016.
C34 Designs contained in designations in Hague international applications for the top 20 designated Hague members, 2015
Growth rate (%)16.2 -7.1 -2.5 17.1 16.4 -4.8 .. .. 12.2 19.9
13,354
9,525
6,207
3,509 3,012 2,852 2,591 2,459 2,055 1,570
Desig
ns in
desig
natio
ns in
Hag
ue ap
plica
tions
Europea
n Unio
n
Switzerlan
dTurk
eyNorw
ayUkra
ine
Singapo
re
Republic
of Kore
a
United S
tates o
f Americ
a
Morocco
T F Y R of Mace
donia
Hague member
Growth rate (%)-9.7 27.5 14.1 1.8 23.3 .. 27.6 41.9 23.1 19.1
1,550 1,519 1,501 1,4911,412
1,227 1,212 1,202 1,141 1,137
Desig
ns in
desig
natio
ns in
Hag
ue ap
plica
tions
M
onaco
Montene
groTuni
sia
Liecht
enstein
Bosnia a
nd Herz
egovin
aJap
anOman
Albania
Azerbai
janSerb
ia
Hague member
.. indicates not available.
Note: TFYR of Macedonia is The Former Yugoslav Republic of Macedonia. No growth rate is given for Japan, the Republic of Korea or the U.S., as they are new Hague members and so no historical data are available for comparison.
Source: WIPO Statistics Database, October 2016.

135
STANDARD FIGURES AND TABLES
INDU
STRI
AL D
ESIG
NS
C35 Designs contained in Hague international applications for the top 20 origins, 2015
Growth rate (%)-10.7 4.0 -15.5 .. 30.9 .. 125.0 44.5 .. 96.5
3,453 3,316
1,317 1,282 1,186 1,039765
497 411 391
Desig
ns in
Hag
ue ap
plica
tions
Germany
Switzerlan
dFran
ce
Republic
of Kore
aItal
y
United S
tates o
f Americ
a
Netherla
ndsAust
riaJap
an
United K
ingdom
Origin
Growth rate (%)76.5 -42.9 36.6 47.1 61.4 71.7 52.9 81.4 .. -83.2
286
244 235 228213
182159 156
125 117
Desig
ns in
Hag
ue ap
plica
tions
S
weden
Turkey
Spain
Denmark
Luxem
bourg
Belgium
Norway
Czech R
epublic
Cyprus
Liecht
enstein
Origin
.. indicates not available.
Note: Origin is defined as the country of the stated residence of the applicant in an international application. No growth rate is given for Japan, the Republic of Korea and the U.S., as they are new Hague members and so no historical data are available for comparison.
Source: WIPO Statistics Database, October 2016.
C36 Trend in active Hague international registrations
-6.8 -6.9 -6.9 -2.2 -2.2
0.3 1.2 0.7 2.6 2.3 3.3
0
10,000
20,000
30,000
40,000
Activ
e reg
istra
tions
2005 2006 2007 2008 2009 2010 2011 2012 2013 2014 2015
Active registrations Growth rate (%)
Year
Source: WIPO Statistics Database, October 2016.

136
STANDARD FIGURES AND TABLES
INDU
STRI
AL D
ESIG
NS
C37 Designs contained in non-resident applications by filing route for selected Hague members, 2015
Hague share (%)18.1 4.9 78.2 78.4 34.4 88.0 75.5 84.7 87.9 98.2
29,541
11,3297,384 7,139 6,567
3,538 3,468 3,199 2,222 1,541
Appli
catio
n des
ign co
unt
Euro
pean U
nion
Germany
Switzerlan
dTurk
ey
Republic
of Kore
aNorw
ay
Singapo
reUkra
ine
Morocco
Monaco
Hague members
Direct non-resident Hague non-resident
Hague share (%)98.4 99.3 99.0 99.7 99.7 99.0 94.9 91.6 93.3 94.51,449 1,395 1,357
1,228 1,173 1,096 1,060 1,038 999 987
Appli
catio
n des
ign co
unt
Tunisia
T F Y R of Mace
donia
Montene
gro
Liecht
enstein
Bosnia a
nd Herz
egovin
a
Azerbai
janGeor
giaEgyp
t
Republic
of Mold
ovaSerb
ia
Hague members
Direct non-resident Hague non-resident
Note: TFYR of Macedonia is The Former Yugoslav Republic of Macedonia.
Source: WIPO Statistics Database, October 2016.
Statistical tables
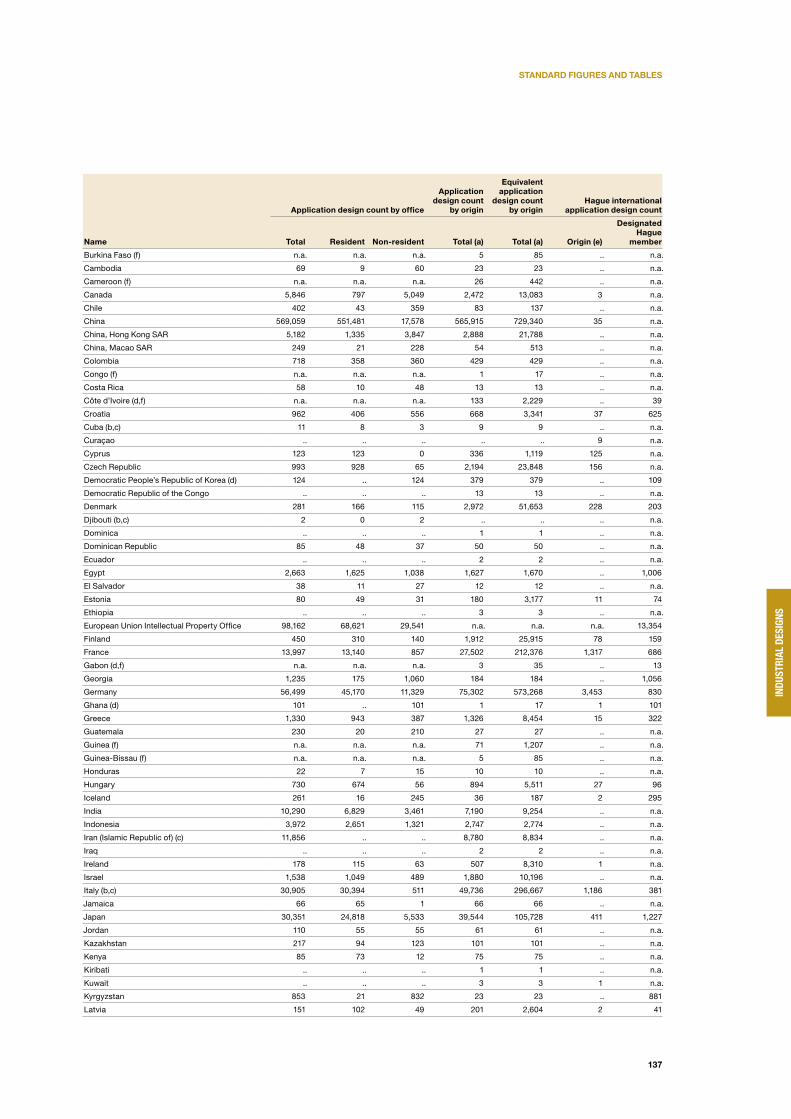
C38 Industrial design applications by office and origin, 2015
Application design count by office
Application design count
by origin
Equivalent application
design count by origin
Hague international application design count
Name Total Resident Non-resident Total (a) Total (a) Origin (e)
Designated Hague
member
Afghanistan .. .. .. 1 1 .. n.a.
African Intellectual Property Organization 799 297 502 n.a. n.a. n.a. 438
African Regional Intellectual Property Organization 124 24 100 n.a. n.a. n.a. n.a.
Albania (b,c) 855 14 841 306 1,169 2 1,202
Algeria (b,c) 920 825 95 825 825 .. n.a.
Andorra .. .. .. 3 84 .. n.a.
Angola .. .. .. 1 1 .. n.a.
Antigua and Barbuda 1 0 1 .. .. .. n.a.
Argentina 1,581 1,016 565 1,048 1,102 .. n.a.
Armenia 886 31 855 59 59 .. 880
Australia 7,024 2,821 4,203 4,237 12,661 4 n.a.
Austria 2,170 989 1,181 6,067 65,845 497 n.a.
Azerbaijan 1,107 11 1,096 13 67 .. 1,141
Bahamas (b,c) 24 23 1 65 470 .. n.a.
Bahrain 64 3 61 8 8 .. n.a.
Bangladesh 1,376 1,284 92 1,284 1,284 .. n.a.
Barbados 4 1 3 132 942 .. n.a.
Belarus 387 202 185 264 264 .. n.a.
Belgium n.a. n.a. n.a. 2,261 30,689 182 n.a.
Belize (d) 733 .. 733 11 11 .. 773
Benelux 1,593 1,159 434 n.a. n.a. n.a. 399
Benin (d,f) n.a. n.a. n.a. 8 136 4 43
Bermuda .. .. .. 9 198 .. n.a.
Bhutan .. .. .. 1 1 .. n.a.
Bolivia (Plurinational State of) (b,c) 60 26 34 27 27 .. n.a.
Bosnia and Herzegovina 1,197 24 1,173 32 86 3 1,412
Botswana (b,c) 93 12 81 12 12 .. 61
Brazil 6,039 3,289 2,750 3,820 9,463 .. n.a.
Brunei Darussalam (b,c) 92 4 88 7 7 .. 103
Bulgaria 758 620 138 2,050 25,544 47 125
137
STANDARD FIGURES AND TABLES
INDU
STRI
AL D
ESIG
NS
Application design count by office
Application design count
by origin
Equivalent application
design count by origin
Hague international application design count
Name Total Resident Non-resident Total (a) Total (a) Origin (e)
Designated Hague
member
Burkina Faso (f) n.a. n.a. n.a. 5 85 .. n.a.
Cambodia 69 9 60 23 23 .. n.a.
Cameroon (f) n.a. n.a. n.a. 26 442 .. n.a.
Canada 5,846 797 5,049 2,472 13,083 3 n.a.
Chile 402 43 359 83 137 .. n.a.
China 569,059 551,481 17,578 565,915 729,340 35 n.a.
China, Hong Kong SAR 5,182 1,335 3,847 2,888 21,788 .. n.a.
China, Macao SAR 249 21 228 54 513 .. n.a.
Colombia 718 358 360 429 429 .. n.a.
Congo (f) n.a. n.a. n.a. 1 17 .. n.a.
Costa Rica 58 10 48 13 13 .. n.a.
Côte d’Ivoire (d,f) n.a. n.a. n.a. 133 2,229 .. 39
Croatia 962 406 556 668 3,341 37 625
Cuba (b,c) 11 8 3 9 9 .. n.a.
Curaçao .. .. .. .. .. 9 n.a.
Cyprus 123 123 0 336 1,119 125 n.a.
Czech Republic 993 928 65 2,194 23,848 156 n.a.
Democratic People’s Republic of Korea (d) 124 .. 124 379 379 .. 109
Democratic Republic of the Congo .. .. .. 13 13 .. n.a.
Denmark 281 166 115 2,972 51,653 228 203
Djibouti (b,c) 2 0 2 .. .. .. n.a.
Dominica .. .. .. 1 1 .. n.a.
Dominican Republic 85 48 37 50 50 .. n.a.
Ecuador .. .. .. 2 2 .. n.a.
Egypt 2,663 1,625 1,038 1,627 1,670 .. 1,006
El Salvador 38 11 27 12 12 .. n.a.
Estonia 80 49 31 180 3,177 11 74
Ethiopia .. .. .. 3 3 .. n.a.
European Union Intellectual Property Office 98,162 68,621 29,541 n.a. n.a. n.a. 13,354
Finland 450 310 140 1,912 25,915 78 159
France 13,997 13,140 857 27,502 212,376 1,317 686
Gabon (d,f) n.a. n.a. n.a. 3 35 .. 13
Georgia 1,235 175 1,060 184 184 .. 1,056
Germany 56,499 45,170 11,329 75,302 573,268 3,453 830
Ghana (d) 101 .. 101 1 17 1 101
Greece 1,330 943 387 1,326 8,454 15 322
Guatemala 230 20 210 27 27 .. n.a.
Guinea (f) n.a. n.a. n.a. 71 1,207 .. n.a.
Guinea-Bissau (f) n.a. n.a. n.a. 5 85 .. n.a.
Honduras 22 7 15 10 10 .. n.a.
Hungary 730 674 56 894 5,511 27 96
Iceland 261 16 245 36 187 2 295
India 10,290 6,829 3,461 7,190 9,254 .. n.a.
Indonesia 3,972 2,651 1,321 2,747 2,774 .. n.a.
Iran (Islamic Republic of) (c) 11,856 .. .. 8,780 8,834 .. n.a.
Iraq .. .. .. 2 2 .. n.a.
Ireland 178 115 63 507 8,310 1 n.a.
Israel 1,538 1,049 489 1,880 10,196 .. n.a.
Italy (b,c) 30,905 30,394 511 49,736 296,667 1,186 381
Jamaica 66 65 1 66 66 .. n.a.
Japan 30,351 24,818 5,533 39,544 105,728 411 1,227
Jordan 110 55 55 61 61 .. n.a.
Kazakhstan 217 94 123 101 101 .. n.a.
Kenya 85 73 12 75 75 .. n.a.
Kiribati .. .. .. 1 1 .. n.a.
Kuwait .. .. .. 3 3 1 n.a.
Kyrgyzstan 853 21 832 23 23 .. 881
Latvia 151 102 49 201 2,604 2 41

138
STANDARD FIGURES AND TABLES
INDU
STRI
AL D
ESIG
NS
Application design count by office
Application design count
by origin
Equivalent application
design count by origin
Hague international application design count
Name Total Resident Non-resident Total (a) Total (a) Origin (e)
Designated Hague
member
Lebanon .. .. .. 23 185 .. n.a.
Liechtenstein 1,289 61 1,228 531 6,552 117 1,491
Lithuania 421 87 334 185 2,183 14 331
Luxembourg n.a. n.a. n.a. 1,100 20,548 213 n.a.
Madagascar 206 205 1 205 205 .. n.a.
Malaysia 1,762 627 1,135 805 859 4 n.a.
Maldives .. .. .. 1 1 .. n.a.
Mali (d,f) n.a. n.a. n.a. 24 328 .. 14
Malta (b,c) 10 10 0 207 4,986 1 n.a.
Marshall Islands .. .. .. 2 2 .. n.a.
Mauritania (f) n.a. n.a. n.a. 1 17 .. n.a.
Mauritius .. .. .. 6 6 .. n.a.
Mexico 3,999 1,729 2,270 1,979 3,059 .. n.a.
Monaco 1,587 46 1,541 166 3,190 2 1,550
Mongolia (b,c) 930 257 673 257 257 .. 840
Montenegro 1,365 8 1,357 8 8 .. 1,519
Morocco 5,950 3,728 2,222 3,801 3,866 9 2,055
Namibia (d) 96 1 95 29 72 1 87
Nepal 35 16 19 16 16 .. n.a.
Netherlands n.a. n.a. n.a. 4,652 58,761 765 n.a.
New Zealand 1,329 345 984 717 3,174 1 n.a.
Nicaragua (b,c) 9 0 9 .. .. .. n.a.
Niger (d,f) n.a. n.a. n.a. .. .. .. 13
Nigeria .. .. .. 20 101 .. n.a.
Norway 4,153 615 3,538 1,450 7,508 159 3,509
Oman (d) 1,185 5 1,180 5 5 4 1,212
Pakistan 489 364 125 371 371 1 n.a.
Panama 97 19 78 48 183 .. n.a.
Papua New Guinea 39 3 36 10 10 .. n.a.
Peru 358 131 227 131 131 .. n.a.
Philippines 1,103 539 564 572 599 .. n.a.
Poland (d) 62 1 61 5,080 131,834 117 98
Portugal 1,950 1,862 88 2,869 28,303 51 n.a.
Qatar .. .. .. 7 34 .. n.a.
Republic of Korea 72,458 65,891 6,567 75,979 135,421 1,282 2,591
Republic of Moldova 2,206 1,207 999 1,234 1,346 .. 1,035
Romania 1,016 830 186 1,064 6,869 8 228
Russian Federation 6,002 2,616 3,386 3,051 5,427 .. n.a.
Rwanda 69 5 64 5 5 .. 57
Saint Lucia .. .. .. 1 1 .. n.a.
Saint Vincent and the Grenadines (b,c) 2 0 2 .. .. .. n.a.
Samoa (b,c) 20 15 5 23 23 .. n.a.
San Marino .. .. .. 12 336 .. n.a.
Sao Tome and Principe (d) 50 .. 50 .. .. .. 55
Saudi Arabia 824 321 503 333 333 .. n.a.
Senegal (d,f) n.a. n.a. n.a. 23 391 .. 43
Serbia 1,109 122 987 398 688 27 1,137
Seychelles .. .. .. 39 93 .. n.a.
Singapore 4,262 794 3,468 1,366 4,444 29 2,852
Sint Maarten (Dutch Part) .. .. .. .. .. 1 n.a.
Slovakia 258 201 57 401 4,075 14 n.a.
Slovenia (d) 402 19 383 358 5,380 63 455
South Africa 1,960 723 1,237 878 2,125 .. n.a.
Spain 17,855 17,249 606 21,710 114,982 235 393
Sri Lanka 457 390 67 405 405 .. n.a.
Sudan (c) 173 .. .. 545 545 .. n.a.
Suriname (d) 73 .. 73 .. .. .. 65
Swaziland .. .. .. 59 59 .. n.a.

139
STANDARD FIGURES AND TABLES
INDU
STRI
AL D
ESIG
NS
Application design count by office
Application design count
by origin
Equivalent application
design count by origin
Hague international application design count
Name Total Resident Non-resident Total (a) Total (a) Origin (e)
Designated Hague
member
Sweden 848 821 27 3,978 46,237 286 n.a.
Switzerland 12,242 4,858 7,384 35,505 192,542 3,316 9,525
Syrian Arab Republic 326 251 75 259 259 .. 91
T F Y R of Macedonia 1,443 48 1,395 111 273 6 1,570
Tajikistan 131 0 131 .. .. .. 150
Thailand 4,461 3,383 1,078 3,570 4,766 .. n.a.
Togo (f) n.a. n.a. n.a. 4 68 .. n.a.
Trinidad and Tobago 40 18 22 20 20 .. n.a.
Tunisia 1,578 129 1,449 136 325 14 1,501
Turkey 45,852 38,713 7,139 40,197 52,236 244 6,207
Ukraine 7,488 4,289 3,199 4,947 7,559 34 3,012
United Arab Emirates (b,c) 804 91 713 252 1,742 .. n.a.
United Kingdom .. .. .. 10,756 180,202 391 n.a.
United States of America 40,128 22,631 17,497 52,566 278,814 1,039 2,459
Uruguay 57 8 49 10 10 .. n.a.
Uzbekistan 428 406 22 406 406 .. n.a.
Venezuela (Bolivarian Republic of) .. .. .. 14 14 .. n.a.
Viet Nam 2,885 1,839 1,046 1,912 3,478 .. n.a.
Yemen 8 4 4 4 4 .. n.a.
Zambia (b,c) 40 29 11 29 29 .. n.a.
Zimbabwe .. .. .. 1 1 .. n.a.
Others/Unknown .. .. .. 26,497 56,392 150 n.a.
Total (2015 estimates) 1,144,800 964,500 180,300 1,144,800 n.a. 16,435 74,220
a. Design count by origin is incomplete, as some offices do not report the origin of applications.b. 2014 data are reported for application design count by office.c. 2014 data are reported for application design count by origin.d. Only Hague designation data are available and/or the office has not reported the origin of applications, so design count by office and origin data may be incomplete.e. Origin is defined as the country of the stated address of residence of the applicant in an international application.f. The African Intellectual Property Organization (OAPI) is the competent office for processing applications.n.a. indicates not applicable
.. indicates not available
Source: WIPO Statistics Database, October 2016.
Attribution Non-Commercial No-Derivatives 3.0 IGO License(CC BY-NC-ND IGO)

140
STANDARD FIGURES AND TABLES
INDU
STRI
AL D
ESIG
NS
C39 Industrial design registrations by office and origin, and industrial designs in force, 2015
Registration design count by office
Registration design count
by origin
Equivalent registration
design count by origin
Hague international registration
design countIn force
by office
Name Total Resident Non-resident Total (a) Total (a) Origin (e) Total
African Intellectual Property Organization 746 259 487 n.a. n.a. n.a. ..
African Regional Intellectual Property Organization 103 12 91 n.a. n.a. n.a. 741
Albania (b,c) 848 6 842 296 1,159 1 23
Algeria (b,c,e) 121 115 6 117 117 .. 2,017
Andorra .. .. .. 6 87 .. ..
Angola .. .. .. 1 1 .. ..
Argentina 1,482 899 583 918 945 .. ..
Armenia 859 29 830 62 197 .. 343
Australia 6,592 2,516 4,076 4,022 13,769 4 50,674
Austria 2,690 1,203 1,487 5,070 60,150 367 10,226
Azerbaijan 1,103 7 1,096 9 63 .. 202
Bahamas (b,c) 24 23 1 40 337 .. ..
Bahrain 38 3 35 4 4 .. 1,484
Bangladesh 771 681 90 681 681 .. ..
Barbados 3 1 2 88 817 .. ..
Belarus 388 191 197 288 288 .. 1,584
Belgium n.a. n.a. n.a. 1,987 29,873 176 n.a.
Belize (d) 733 .. 733 235 235 .. ..
Benelux 1,596 1,167 429 n.a. n.a. n.a. 4,168
Benin (d,f) n.a. n.a. n.a. 5 85 .. ..
Bermuda .. .. .. 12 120 .. ..
Bhutan .. .. .. 1 1 .. ..
Bolivia (Plurinational State of) (b,c,e) 56 23 33 24 24 .. 550
Bosnia and Herzegovina 1,233 48 1,185 56 110 3 370
Botswana (b,c) 84 4 80 6 6 .. ..
Brazil 3,285 1,402 1,883 2,106 7,803 .. ..
Brunei Darussalam (d) 91 .. 91 3 3 .. ..
Bulgaria 523 470 53 1,890 24,979 42 2,380
Burkina Faso (f) n.a. n.a. n.a. 4 68 .. ..
Cambodia 99 31 68 32 32 .. ..
Cameroon (f) n.a. n.a. n.a. 20 340 .. ..
Canada 5,728 785 4,943 2,287 13,519 3 39,954
Chile 427 30 397 62 89 .. 2,542
China 482,659 464,807 17,852 477,272 633,127 22 1,238,406
China, Hong Kong SAR 4,702 1,360 3,342 2,777 21,245 .. 36,212
China, Macao SAR 120 12 108 39 309 .. 842
Colombia 501 222 279 275 275 .. 3,943
Costa Rica 34 3 31 8 8 .. 599
Côte d’Ivoire (d,f) n.a. n.a. n.a. 123 2,091 .. ..
Croatia 873 322 551 571 2,677 29 5,109
Cuba (b,c,e) 8 4 4 6 6 .. 51
Curaçao .. .. .. .. .. 9 ..
Cyprus 123 123 0 364 1,120 124 62
Czech Republic 1,033 1,022 11 2,185 23,812 105 3,355
Democratic People’s Republic of Korea (d) 124 .. 124 10 10 .. ..
Democratic Republic of the Congo .. .. .. 6 6 .. ..
Denmark 211 98 113 2,788 47,473 191 1,415
Djibouti (b,c,e) 2 0 2 .. .. .. 9
Dominican Republic (e) 50 11 39 12 12 .. 321
Ecuador .. .. .. 2 2 .. ..
Egypt 1,627 646 981 651 678 1 ..
El Salvador 28 6 22 7 7 .. 553
Estonia 77 48 29 203 3,092 11 1,327
European Union Intellectual Property Office 94,457 66,359 28,098 n.a. n.a. n.a. 182,853
Finland 292 190 102 1,856 23,861 55 2,528
France (d,e) 518 32 486 13,887 192,832 1,239 304,000
Gabon (d,f) n.a. n.a. n.a. 2 34 .. ..
Georgia 1,141 87 1,054 88 88 .. 259

141
STANDARD FIGURES AND TABLES
INDU
STRI
AL D
ESIG
NS
Registration design count by office
Registration design count
by origin
Equivalent registration
design count by origin
Hague international registration
design countIn force
by office
Name Total Resident Non-resident Total (a) Total (a) Origin (e) Total
Germany 51,442 39,389 12,053 69,094 552,766 3,144 56,266
Ghana (d) 101 .. 101 1 17 1 ..
Greece 1,400 1,048 352 1,368 7,767 8 1,491
Guatemala 184 0 184 2 2 .. 450
Guinea (f) n.a. n.a. n.a. 61 1,037 .. ..
Guinea-Bissau (f) n.a. n.a. n.a. 4 68 .. ..
Honduras 11 1 10 1 1 .. 266
Hungary 782 726 56 924 4,785 28 4,090
Iceland 260 16 244 41 192 5 794
India (e) 7,461 4,801 2,660 5,116 6,997 .. 49,556
Indonesia 3,505 2,334 1,171 2,350 2,377 .. 31,206
Iran (Islamic Republic of) (c,e) 4,150 .. .. 3,169 3,169 .. 11,221
Iraq .. .. .. 1 1 .. 29
Ireland 149 104 45 523 8,569 1 1,066
Israel 1,744 1,068 676 1,764 9,891 .. ..
Italy (b,c) 22,094 21,566 528 36,223 258,487 1,123 ..
Jamaica 71 70 1 70 70 .. ..
Japan 27,195 21,966 5,229 36,441 103,543 252 251,121
Jordan 87 29 58 33 33 .. 2,113
Kazakhstan 282 94 188 99 99 .. 1,004
Kenya 57 52 5 52 52 .. ..
Kuwait .. .. .. 3 3 1 ..
Kyrgyzstan 858 39 819 39 39 .. 145
Latvia 120 71 49 157 2,290 2 393
Lebanon .. .. .. 19 181 .. ..
Liechtenstein (b,c) 1,490 67 1,423 1,759 25,978 109 85
Lithuania 395 72 323 173 2,171 11 319
Luxembourg n.a. n.a. n.a. 1,000 18,049 178 n.a.
Madagascar 244 239 5 239 239 .. 1,382
Malaysia 1,301 418 883 594 621 4 12,968
Mali (d,f) n.a. n.a. n.a. 19 259 .. ..
Malta (b,c) 10 8 2 248 5,787 1 76
Mauritius .. .. .. 19 35 .. ..
Mexico 2,852 948 1,904 1,180 2,287 .. 24,192
Monaco 1,594 55 1,539 129 1,992 2 400
Mongolia (b,c) 754 76 678 76 76 .. 1,053
Montenegro 1,406 8 1,398 8 8 .. 117
Morocco 5,134 3,020 2,114 3,092 3,157 14 ..
Myanmar .. .. .. 4 4 .. ..
Namibia (d) 96 1 95 27 70 1 ..
Nepal 1 0 1 .. .. .. 10
Netherlands n.a. n.a. n.a. 4,833 59,480 612 n.a.
New Zealand 1,317 293 1,024 677 3,053 1 10,194
Nicaragua (b,c,e) 17 0 17 5 5 .. 114
Niger (d,f) n.a. n.a. n.a. .. .. .. ..
Nigeria .. .. .. 10 91 .. ..
Norway 4,030 536 3,494 1,365 7,477 149 9,039
Oman (d) 1,185 5 1,180 19 19 4 ..
Pakistan 309 238 71 241 241 .. 5,712
Panama 104 21 83 45 180 .. 496
Papua New Guinea 28 1 27 5 5 .. 4
Peru 381 97 284 99 99 .. 2,734
Philippines 1,051 565 486 598 652 .. ..
Poland (d) 60 1 59 4,746 119,566 108 10,516
Portugal 2,124 1,957 167 2,809 24,112 41 4,445
Qatar .. .. .. 8 35 .. ..
Republic of Korea 56,256 49,967 6,289 59,901 120,796 1,083 318,027
Republic of Moldova 1,481 544 937 567 679 2 3,386
Romania 1,565 1,363 202 1,598 7,376 4 4,120

142
STANDARD FIGURES AND TABLES
INDU
STRI
AL D
ESIG
NS
Registration design count by office
Registration design count
by origin
Equivalent registration
design count by origin
Hague international registration
design countIn force
by office
Name Total Resident Non-resident Total (a) Total (a) Origin (e) Total
Russian Federation 8,585 3,405 5,180 3,950 6,299 .. 28,697
Rwanda 69 5 64 5 5 .. 140
Samoa 1 1 0 5 5 .. 19
San Marino .. .. .. 4 112 .. ..
Sao Tome and Principe (d) 50 .. 50 .. .. .. ..
Saudi Arabia 869 348 521 369 639 .. 3,535
Senegal (d,f) n.a. n.a. n.a. 20 340 .. ..
Serbia 1,020 66 954 339 629 23 3,875
Seychelles .. .. .. 47 101 .. ..
Singapore 4,359 829 3,530 1,422 4,581 40 14,581
Sint Maarten (Dutch Part) .. .. .. .. .. 1 ..
Slovakia 301 259 42 466 5,328 17 859
Slovenia (d) 402 19 383 371 5,933 62 ..
South Africa 1,016 371 645 514 1,691 .. 15,575
Spain 19,148 18,537 611 22,719 110,726 174 27,914
Sri Lanka 246 179 67 185 185 .. ..
Sudan (c,e) 111 .. .. 247 247 .. 120
Suriname (d) 73 .. 73 .. .. .. ..
Swaziland .. .. .. 2 2 .. ..
Sweden 506 485 21 3,793 44,297 285 5,547
Switzerland 11,965 4,703 7,262 34,834 175,374 3,183 9,688
Syrian Arab Republic 154 114 40 125 125 .. ..
T F Y R of Macedonia 1,397 12 1,385 75 237 7 2,706
Tajikistan 135 0 135 .. .. .. 48
Thailand 3,711 2,476 1,235 2,616 3,858 .. 12,453
Togo (f) n.a. n.a. n.a. 4 68 .. ..
Trinidad and Tobago (b,c) 57 29 28 31 31 .. ..
Tunisia 1,571 126 1,445 133 322 .. ..
Turkey 48,088 40,907 7,181 42,293 53,144 234 98,554
Ukraine 8,170 4,599 3,571 5,306 7,918 42 12,041
United Arab Emirates (b,c) 368 6 362 145 1,765 .. ..
United Kingdom (b,c) 4,901 4,697 204 13,343 166,698 340 43,110
United States of America 27,644 14,354 13,290 41,673 259,613 805 293,596
Uruguay 47 5 42 6 6 .. 659
Uzbekistan 318 271 47 271 271 .. 502
Vanuatu .. .. .. 2 56 .. ..
Venezuela (Bolivarian Republic of) .. .. .. 9 9 .. ..
Viet Nam 1,681 1,029 652 1,195 2,788 .. 9,401
Yemen 8 4 4 4 4 .. 38
Zambia (b,c) 22 15 7 15 15 .. ..
Others/Unknown .. .. .. 25,757 48,215 .. ..
Total (2015 estimates) 989,400 817,100 172,300 989,400 n.a. 14,484 3,402,900
a. Design count by origin is incomplete, as some offices do not report the origin of registrations.b. 2014 data are reported for registration design counts by office.c. 2014 data are reported for registration design counts by origin.d. Only Hague designation data are available and/or the office has not reported the origin of registrations, so design count by office and origin data may be incomplete.e. Origin is defined as the country of the stated address of residence of the holder in an international registration.f. The African Intellectual Property Organization (OAPI) is the competent office for registering applications.n.a. indicates not applicable
.. indicates not available
Source: WIPO Statistics Database, October 2016.
Attribution Non-Commercial No-Derivatives 3.0 IGO License(CC BY-NC-ND IGO)