INDUCED SPUTUM FOR ASSESSMENT OF AIRAW Y …
90
Department of Medicine, Division of Pulmonary Medicine Division of Allergy Skin and Allergy Hospital Helsinki University Central Hospital Helsinki, Finland INDUCED SPUTUM FOR ASSESSMENT OF AIRWAY INFLAMMATION IN PATIENTS WITH COPD, ASTHMA AND ASTHMA-LIKE SYMPTOMS by Paula Rytilä Academic dissertation To be publicly discussed, by the permission of the Medical Faculty of the University of Helsinki, in the Auditorium of Skin and Allergy Hospital, Meilahdentie 2, Helsinki, on February 8 Th 2002, at 12 noon. Helsinki 2002
Transcript of INDUCED SPUTUM FOR ASSESSMENT OF AIRAW Y …

Department of Medicine,Division of Pulmonary Medicine
Division of AllergySkin and Allergy Hospital
Helsinki University Central HospitalHelsinki, Finland
INDUCED SPUTUM FOR ASSESSMENT OF AIRWAY
INFLAMMATION IN PATIENTS WITH COPD,
ASTHMA AND ASTHMA-LIKE SYMPTOMS
by
Paula Rytilä
Academic dissertation
To be publicly discussed, by the permission of the Medical Faculty of the University ofHelsinki, in the Auditorium of Skin and Allergy Hospital, Meilahdentie 2, Helsinki, on
February 8 Th 2002, at 12 noon.
Helsinki 2002

2
Supervised by:
Docent Tari Haahtela, MD, PhDDivision of AllergyDepartment of MedicineHelsinki University Central HospitalHelsinki, Finland
Professor Lauri A. Laitinen, MD, PhDDivision of Pulmonary MedicineDepartment of MedicineHelsinki University Central HospitalHelsinki, Finland
Reviewed by:
Professor Markku M. Nieminen, MD, PhDDepartment of Respiratory MedicineTampere University Central HospitalTampere, Finland
Docent Henrik Riska, MD, PhDDepartment of Respiratory DiseasesJorvi HospitalEspoo, Finland
Opponent at the Dissertation:
Ratko Djukanovic MD, DM, FRCPDepartment of MedicineSouthampton University General HospitalSouthampton, United Kingdom
ISBN 952-91-4320-6 (Print)ISBN 952-10-0287-5 (PDF)htpp://ethesis.helsinki.fiYliopistopaino, Helsinki
´

3
To my family

4
5
CONTENTS
LIST OF ORIGINAL PUBLICATIONS..................................................................... 7
ABBREVIATIONS........................................................................................................ 8
ABSTRACT ................................................................................................................... 9
INTRODUCTION ...................................................................................................... 10
REVIEW OF THE LITERATURE ........................................................................... 11
DEFINITIONS ............................................................................................................ 11Chronic obstructive pulmonary disease (COPD) ................................................ 11Asthma ................................................................................................................. 11Asthma-like symptoms, chronic cough with eosinophilic bronchitis ................. 12
ASSESSMENT OF AIRWAY INFLAMMATION ................................................... 13Direct measurement of airway inflammation ...................................................... 13Indirect measurement of airway inflammation ................................................... 16
INDUCED SPUTUM ................................................................................................. 17Sputum induction ................................................................................................. 17Sputum processing ............................................................................................... 19Spontaneous versus induced sputum ................................................................... 22Comparison between direct measurements of airway inflammation .................. 23Clinical applications of assessment of induced sputum ..................................... 23Induced sputum in children ................................................................................. 23Induced sputum in other diseases ........................................................................ 24
AIMS OF THE STUDY .............................................................................................. 25
SUBJECTS AND METHODS ................................................................................... 26
STUDY POPULATIONS AND DESIGNS.............................................................. 26Study I .................................................................................................................. 26Study II ................................................................................................................. 27Study III ............................................................................................................... 27Study IV ............................................................................................................... 28Study V ................................................................................................................. 30
METHODS ................................................................................................................... 30Lung function measurements ............................................................................... 30Skin prick tests ..................................................................................................... 31Sputum induction ................................................................................................. 32Sputum processing ............................................................................................... 32Fluid-phase measurements ................................................................................... 36Statistical analyses ............................................................................................... 36
RESULTS ..................................................................................................................... 38
CLINICAL CHARACTERISTICS OF SUBJECTS................................................ 38

6
Reversibility of lung-function measurements and airway responsiveness ......... 38Symptoms ............................................................................................................. 39Measurements relating to blood and serum ......................................................... 39
INDUCED SPUTUM ............................................................................................... 40Safety of sputum induction .................................................................................. 40Success of sputum induction ............................................................................... 41Sputum total and differential cell counts at baseline .......................................... 42Sputum fluid-phase measurements ...................................................................... 47Normal values for inflammatory markers: sensitivity and specificity ................ 47Correlation between results ................................................................................. 48
TREATMENT EFFECT ........................................................................................... 50Study III : Follow-up in patients with respiratory symptoms ............................. 50Study IV ............................................................................................................... 52
DISCUSSION .............................................................................................................. 54
STUDY POPULATIONS AND METHODS ........................................................... 54Clinical characteristics of subjects ...................................................................... 54Sputum induction ................................................................................................. 55
INFLAMMATORY MARKERS .............................................................................. 57COPD ................................................................................................................... 57Asthma ................................................................................................................. 59Eosinophilic bronchial inflammation without asthma or COPD ........................ 60Correlations between different inflammatory markers ....................................... 61
EFFECTS OF TREATMENT ................................................................................... 62CLINICAL IMPLICATIONS ................................................................................... 63FUTURE DIRECTIONS .......................................................................................... 64
SUMMARY .................................................................................................................. 66
CONCLUSIONS.......................................................................................................... 68
ACKNOWLEDGEMENTS ........................................................................................ 69
REFERENCES ............................................................................................................ 71
ORIGINAL PUBLICATIONS ................................................................................... 91

7
LIST OF ORIGINAL PUBLICATIONS
This thesis is based on the following original publications, referred to in the text bymeans of the Roman numerals. The original communications are reproduced by permis-sion of the copyright holders. Some unpublished data are also included in the thesis.
I Rytilä PH, Lindqvist AE, Laitinen LA. Safety of sputum induction in chronicobstructive pulmonary disease of various degrees of severity. Eur Resp J 2000;15: 1116-1119.
II Peleman RA, Rytilä PH, Kips JC, Joos GF, Pauwels RA. Cellularcharacteristics of induced sputum in COPD. Eur Resp J 1999; 13: 839-843.
III Rytilä P, Metso T, Heikkinen K, Saarelainen P, Helenius IJ, Haahtela T.Airway inflammation in patients with symptoms suggesting asthma but withnormal lung function. Eur Res J 2000; 16: 824-830.
IV Rytilä P, Pelkonen AS, Metso T, Nikander K, Haahtela T, Turpeinen M.Inflammatory cells in induced sputum in children with newly detected asthmaand the effect of anti-inflammatory treatment. Submitted.
V Rytilä P, Metso T, Petäys T, Sohlman A, Työlahti H, Kohonen-Jalonen P,Kiviniemi P, Haahtela T. Eosinophilic airway inflammation as an underlyingmechanism of undiagnosed prolonged cough in primary health care patients.Resp Med 2002; 96: 52-58.

8
ABBREVIATIONS
APAAP Alkaline phosphatase anti-alkaline phosphatase
ATS American Thoracic Society
AUC Area under curve
BAL Bronchoalveolar lavage
BDP Beclomethasone dipropionate
COPD Chronic obstructive pulmonary disease
CTAB Cetyl-N,N,N-trimethylammonium bromide
DLCO/VA Diffusion capacity for carbon monoxide per litre/lung (alveolar)volume
DTE Dithioethreitol
DTT Dithiothreitol
ECP Eosinophilic cationic protein
EPO Eosinophil peroxidase
EPX Eosinophil protein X
ERS European Respiratory Society
FEV1
Forced expiratory volume in one second
FVC Forced vital capacity
HNL Human neutrophilic lipokalin
MBP Major basic protein
MDI Metered dose inhaler
MGG May-Grünwald-Giemsa
MPO Myeloperoxidase
NO Nitric oxide
NOS Nitric oxide synthase
PBS Phosphate buffered saline
PCR Polymerase chain reaction
PD15
FEV1
Dose of histamine provoking a 15% fall in FEV1
PD20
PEF Dose of histamine provoking a 20% fall in PEF
PEF Peak expiratory flow
PIFTHB
Peak inspiratory flow though Turbuhaler®
ROC Receiver operator characteristics
SEM Standard error of mean
TBS Tris-buffered saline
VC Vital capacity

9
ABSTRACT
Sputum induction by inhalation of hypertonic saline using an ultrasonic nebulizer is anon-invasive procedure allowing assessment of airway inflammation. In the studies de-scribed in this thesis, we used a method of sputum induction in patients with chronic ob-structive pulmonary disease (COPD), asthma, respiratory symptoms suggestive of asth-ma, prolonged cough, and healthy persons. Subjects were recruited from the outpatientclinics of two University Hospitals and from primary care. Both adults and children tookpart. Sputum cells associated with inflammation on cytospins or smears and markers ofeosinophil and neutrophil activation were studied at baseline and after anti-inflammatorytreatment.
Sputum induction was found to be a safe and reproducible method allowing study ofairway inflammation even when disease was severe. Since inhalation of hypertonic salinecan result in bronchoconstriction, there should be pre-treatment with a bronchodilator,and lung function should be monitored during sputum induction.
Marked sputum neutrophilia was noted in patients with COPD. However, there was asubgroup of COPD patients with eosinophilic airway inflammation. Immunostaining re-vealed very few lymphocytes.
A patient group with symptoms suggestive of asthma and signs of airway eosi-nophilia but no significant airflow limitation was characterised. The degree of eosi-nophilic airway inflammation was less pronounced than in asthma. The patients respond-ed to treatment with inhaled steroids. There is no agreed definition or diagnostic criteriafor this condition. Its occurrence and the effects of various kinds of treatments need sys-tematic studies.
The method of sputum induction studied can be safely and successfully used in as-sessing airway inflammation in children with newly detected asthma. Six months oftreatment with inhaled budesonide improved lung function, controlled asthma well, anddecreased numbers of sputum eosinophils. Regular treatment with low doses of inhaledsteroid for 18 months resulted in further clinical improvement but the results were notsignificantly different from those obtained using treatment during exacerbations only.
Eosinophilic airway inflammation is fairly commonly associated with prolongedcough in primary care, even in patients not suffering from asthma or COPD, or in whomno other cause of cough is known to be present. Induced sputum samples obtained inhealth centres could be studied in a central laboratory. Detection of eosinophilic airwayinflammation could aid decisions regarding treatment.

10
INTRODUCTION
A recent advance to extend our understanding of asthma, COPD and other airway diseaseshas been introduction of a direct, relatively non-invasive, method of induction of sputumproduction involving subjects inhaling hypertonic saline (Pin et al. 1992a). The cellular andnon-cellular compositions of sputum depend on many biological processes within the respi-ratory system. Determination of sputum composition is a valuable tool in studying suchprocesses (Gibson et al. 1989a). Since the late 1980s sputum induction has become one ofthe most widely used methods for the study of airway inflammation in disease. A PubMedsearch of abstracts containing the key words asthma or COPD and induced sputum resultedin identification of more than 400 articles published during the last 10 years. They includeseveral editorials and reviews. An international group of researchers has formed a taskforce, supported by the European Respiratory Society (Djukanovic 2000), to evaluate themerits of techniques of sputum induction and processing of samples and suggest ways ofimproving them.
The importance of measuring airway inflammation in chronic respiratory conditionssuch as asthma, COPD and prolonged cough has recently been emphasised (Gibson2000). The Finnish National Asthma Programme in 1994 and the COPD Programme in1998 stressed the importance of early diagnosis and treatment of these diseases (Haahtelaand Laitinen 1996, Laitinen and Koskela 1999). Asthma often begins in childhood andmay become persistent by adulthood. It is important to evaluate airway inflammation inchildren to determine what role it may play in the genesis of asthma. A simple method al-lowing characterisation of airway inflammation is therefore likely to be valuable.
Several research groups have used sputum induction in characterising patients withchronic cough (Gibson et al. 1989b, Brightling et al. 1999a, Fujimura et al. 2000). Eosi-nophilic airway inflammation characteristic of asthma is common in such patients. How-ever, little is known about the occurrence of this condition, its natural history, or the ef-fects of various anti-inflammatory treatments.
The studies described in this thesis were designed to allow investigation of clinicalapplications of sputum induction method in various patient populations. We wanted to as-sess how safe, successful and reproducible the method might be, and to compare inflam-matory cells and mediators in sputum from patients with COPD, asthma and chronic res-piratory symptoms suggesting asthma. We also investigated use of the method in childrenwith asthma and analysed the effects of various anti-inflammatory treatments on markersin sputum. One aim was to relate inflammatory changes to such clinical characteristic ofpatients as their symptoms and airway function.

11
REVIEW OF THE LITERATURE
DEFINITIONS
Chronic obstructive pulmonary disease (COPD)
COPD is a major cause of morbidity and mortality. The main factor associated with it iscigarette smoking. Clinically, COPD is defined as a disorder characterised by the exist-ence of airflow obstruction associated with chronic bronchitis or emphysema. The air-flow obstruction is generally progressive and irreversible but may be accompanied by air-way hyperresponsiveness, and may be partly reversible (ATS 1987a and 1995). Threedisorders have, historically, been included in COPD: emphysema, peripheral airways dis-ease and chronic bronchitis. Any patient can have from one to three of these conditions.Emphysema is defined anatomically as destructive enlargement of the airspace distal tothe terminal bronchiole, primarily the alveolar area, without obvious fibrosis (Snider etal. 1985). Various morphological abnormalities have been identified in peripheral airwaysdisease. They include inflammation of the terminal and respiratory bronchioles, fibrosisof airway walls with consequent narrowing, and goblet cell metaplasia of the bronchialepithelium (ATS 1995). Chronic bronchitis has been defined clinically as the condition ofsubjects with cough and excessive mucus secretion occurring on most days for at leastthree months of the year for at least two successive years (ATS 1987a).
Chronic bronchitis can occur with or without airway obstruction. Approximately50% of heavy smokers develop mucous hypersecretion. A minority, perhaps only 10 to15%, develops chronic airflow obstruction (US Surgeon General 1984). Bronchoscopicstudies of subjects with COPD have shown increased total numbers of cells and neu-trophils in bronchoalveolar lavage (BAL) fluid (Martin et al. 1985, Thompson et al.1989). In studies of bronchial biopsy samples, subjects with chronic bronchitis werefound to have increased numbers of macrophages and activated T lymphocytes (Saetta etal. 1993). It has recently been have suggested that eosinophilic airway inflammation con-tributes to airflow obstruction in some patients with COPD, and that the short-term ef-fects of oral prednisolone are a result of modification of this feature of the inflammatoryresponse (Chanez et al. 1997, Pizzichini et al. 1998a, Brightling et al. 2000a).
Asthma
Asthma is a major chronic airway disease, the prevalence of which is increasing in Fin-land and throughout the world (ISAAC 1998, Haahtela et al. 1990, Pallasaho et al. 2000,Kilpeläinen 2001). Asthma affects people of all ages and places considerable burdens onhealth-care budgets (Weiss et al. 1992, Haahtela et al. 2001). Asthma is currently definedas a chronic inflammatory airway disease in which many cells, in particular mast cells,eosinophils, and T lymphocytes, play roles. In susceptible individuals, the inflammationcauses recurrent episodes of wheezing, breathlessness, chest tightness and cough. Thesymptoms are usually associated with variable airflow limitation that is at least partly re-versible, spontaneously or with treatment. Chronic airway inflammation is associated
12
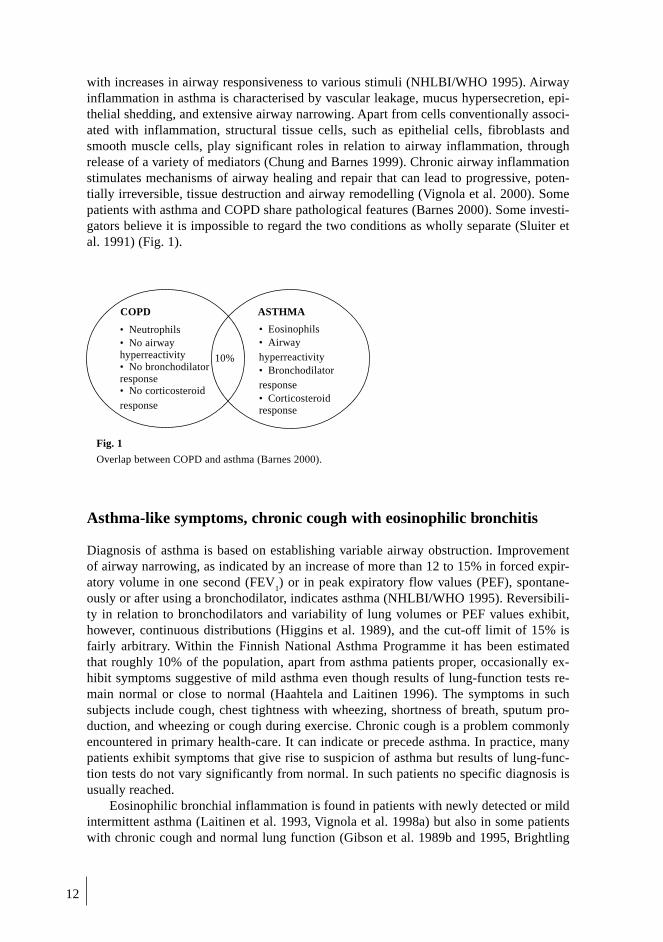
with increases in airway responsiveness to various stimuli (NHLBI/WHO 1995). Airwayinflammation in asthma is characterised by vascular leakage, mucus hypersecretion, epi-thelial shedding, and extensive airway narrowing. Apart from cells conventionally associ-ated with inflammation, structural tissue cells, such as epithelial cells, fibroblasts andsmooth muscle cells, play significant roles in relation to airway inflammation, throughrelease of a variety of mediators (Chung and Barnes 1999). Chronic airway inflammationstimulates mechanisms of airway healing and repair that can lead to progressive, poten-tially irreversible, tissue destruction and airway remodelling (Vignola et al. 2000). Somepatients with asthma and COPD share pathological features (Barnes 2000). Some investi-gators believe it is impossible to regard the two conditions as wholly separate (Sluiter etal. 1991) (Fig. 1).
Asthma-like symptoms, chronic cough with eosinophilic bronchitis
Diagnosis of asthma is based on establishing variable airway obstruction. Improvementof airway narrowing, as indicated by an increase of more than 12 to 15% in forced expir-atory volume in one second (FEV
1) or in peak expiratory flow values (PEF), spontane-
ously or after using a bronchodilator, indicates asthma (NHLBI/WHO 1995). Reversibili-ty in relation to bronchodilators and variability of lung volumes or PEF values exhibit,however, continuous distributions (Higgins et al. 1989), and the cut-off limit of 15% isfairly arbitrary. Within the Finnish National Asthma Programme it has been estimatedthat roughly 10% of the population, apart from asthma patients proper, occasionally ex-hibit symptoms suggestive of mild asthma even though results of lung-function tests re-main normal or close to normal (Haahtela and Laitinen 1996). The symptoms in suchsubjects include cough, chest tightness with wheezing, shortness of breath, sputum pro-duction, and wheezing or cough during exercise. Chronic cough is a problem commonlyencountered in primary health-care. It can indicate or precede asthma. In practice, manypatients exhibit symptoms that give rise to suspicion of asthma but results of lung-func-tion tests do not vary significantly from normal. In such patients no specific diagnosis isusually reached.
Eosinophilic bronchial inflammation is found in patients with newly detected or mildintermittent asthma (Laitinen et al. 1993, Vignola et al. 1998a) but also in some patientswith chronic cough and normal lung function (Gibson et al. 1989b and 1995, Brightling
10%
COPD ASTHMA
• Neutrophils• No airwayhyperreactivity• No bronchodilatorresponse• No corticosteroidresponse
• Eosinophils• Airwayhyperreactivity• Bronchodilatorresponse• Corticosteroidresponse
Fig. 1
Overlap between COPD and asthma (Barnes 2000).
13
et al. 1999a, Carney et al. 1997, Brightling and Pavord 2000). The term eosinophilicbronchitis has also been used in relation to subjects with asthma-like symptoms related towork but no asthma proper, and with sputum eosinophils (Lemière et al. 1997). Other re-searchers have used the term eosinophilic tracheobronchitis (Fujimura et al. 2000). Pa-tients with chronic cough responsive to corticosteroids have been found to resemble pa-tients with asthma in relation to gene expression of some cytokines found in cells in BALfluid (Gibson et al. 1998a), and in relation to various inflammatory mediator concentra-tions (Brightling et al. 2000b).
ASSESSMENT OF AIRWAY INFLAMMATION
Airway inflammation is considered to be a major cause of exacerbations in asthma andCOPD and of permanent structural alterations of the airways in these conditions (Vignolaet al. 2000). Consensus guidelines state that treatment of asthma should be directed pri-marily towards minimisation of inflammation (NHLBI 1997). However, it has not so farbeen possible in clinical practice to measure airway inflammation directly. The presenceand nature of airway inflammation have been deduced from indirect measurements, e.g.of lung function, and from symptoms, results of physical examination and the effects oftreatment. The association between degree of lung-function abnormality and underlyinginflammation is not straightforward (Crimi et al. 1998). Correspondingly, in patients withCOPD there is a need to discover markers that would allow prediction of long-term re-sponse to treatment with inhaled corticosteroids (Pauwels et al. 1999, Brightling et al.2000a). Patients with chronic cough cannot be diagnosed as suffering from eosinophilicbronchitis unless airway inflammation has been studied (Carney et al. 1997).
Asthma often begins in childhood. It may become persistent by adulthood. There isan increasing tendency to treat it preventively with inhaled corticosteroids, in both chil-dren and adults (NHLBI 1997). The rationale is that the inflammatory process is similarin children and adults. However, airway inflammation in childhood asthma has not beenso well characterised as in adults.
Direct measurement of airway inflammation
Bronchial biopsies and bronchoalveolar lavage (BAL)
Use of rigid or fibre-optic bronchoscopy to obtain bronchial biopsy samples or performBAL, segmental allergen challenge, and bronchial brushing has contributed significantlyto current knowledge relating to asthma and COPD (Jarjour et al. 1998). It has beenshown to be feasible to measure airway inflammation via bronchial biopsy samples andBAL fluid. Results of measurements have been shown to be responsive to change (Laitin-en et al. 1992, Djukanovic et al. 1992a). However, it is difficult to quantify changes ob-served in relation to bronchial biopsy samples, and reproducibility has been reported tobe poor (Ward et al. 1995, Richmond et al. 1996). The invasiveness of the procedure, as-sociated costs, and restriction of its use to subjects with mild or moderate and stable dis-ease make bronchoscopy unsuitable for monitoring airway inflammation in clinical prac-tice (Djukanovic et al. 1991, Workshop Summary and Guidelines 1991, Jarjour et al.1998) (Table 1).

14
Table 1. Advantages and disadvantages of bronchial biopsy, BAL fluid examination, induced spu-tum examination and exhaled NO determination (modified from Workshop Summary and Guide-lines 1991, Jarjour et al. 1998, Djukanovic 2000, Jatakanon et al. 1999a)
Advantages Disadvantages
Bronchoscopy • Allows biopsy and BAL: samples
can be obtained from mucosal
tissue and of cells and mediators
from airway lumen
• Provides information on structural
changes (relating to epithelium,
basement membrane, lamina
propria)
• Can be followed by
immunohistochemistry, in situ
hybridisation, electron microscopy
• Can be followed by segmental
allergen challenge
• Allows the use of bronchial wash
(cells for in vitro study)
• Requires trained personnel and
expensive equipment
• Invasive
• Cannot be undertaken repeatedly or
in severe disease
• BAL fluid
• relates to only one segment of the
distal lung
• there is mixing of contents of
alveolar and bronchial compartments
• is primarily saline
• can be contaminated with blood
• Biopsy samples
• can only be obtained from the
larger airways
• cell count reproducibility is low
Induced sputum • Relatively non-invasive• Allows samples to be obtained
from several proximal airways
• Can be undertaken repeatedly
• Safe even in severe disease
• No expensive equipment required
• Allows study of large patient
populations
• Risk of bronchoconstriction
• Success rate around 80%
• Processing methods fairly
laborious
• Results not available immediately
Exhaled NO
determination
• Non-invasive
• Use of rapid detectors allows results
to be obtained immediately
• Can be done repeatedly
• Safe even in severe disease
• Quick
• Allows study of large patient
populations
• Equipment needed is expensive
• Determination is flow-dependent
• Contamination with nasal material
is possible
• Only one mediator is detected
• Method is very sensitive to steroid
administration
Exhaled air
Exhaled air contains many substances. In the past few years there has been intense researchinto the role played by nitric oxide (NO) in the physiology and pathology of airway diseas-es and its clinical significance in respiratory diseases (Kharitonov and Barnes 2000). TheNO molecules originate from L-arginine and are converted to L-citrullin by the NO-syn-
15
thase enzyme (NOS). One of the isoforms of this enzyme, inducible NOS, is induced by cy-tokines. Levels of NO, which can be determined using chemiluminescence analysers, arehigh in air exhaled by asthmatic patients (Alving et al. 1993, Kharitonov et al. 1994) but de-crease after steroid treatment (Kharitonov et al. 1996, Berlyne et al. 2000). Preliminary re-ports relating to measurements of other inflammatory mediators and markers in exhaledbreath condensate has recently been published (Montuschi et al. 1999).
Sputum
History
Sputum is defined as expectorated lower respiratory secretions (Hargreave et al. 1997,Dorland’s Illustrated Medical Dictionary 1988). Hippocrates considered sputum to beone of the four essential humours of the body. Sputum contains bronchial secretions fromthe respiratory epithelium and submucosal gland cells. Ciliary beating and the coughmechanism primarily control clearance of these secretions. Sputum also contains inflam-matory cells that have migrated from the blood through the vascular endothelium andacross respiratory tissue into the bronchial lumen (Hansel and Walker 1992).
Over 100 years ago, Gollasch found eosinophilic leukocytes in sputum from asthmat-ic patients (Gollasch 1889, Ellis 1908). Sputum from asthmatic patients occasionally alsocontains clusters formed by eosinophils, so-called Charcot-Leyden crystals (Dor et al.1984). It has been known for a long time that bronchial epithelium is damaged in asthma.Curschmann found clusters of shedded epithelial cells in acute asthma in 1885 (Cur-schmann 1885). He also noted the presence of corkscrew-shaped twists of condensedmucus (Curschmann’s spirals). The clusters of epithelial cells were later called Creola’sbodies (Naylor 1962). From the 1950s to 1980s, many investigators analysed sputum mi-croscopically and measured fluid-phase components of sputum in attempts to diagnoseasthma and chronic bronchitis, and assess disease severity (Brown 1958, Chodosh et al.1962, Chodosh 1970, Turnbull et al. 1977, O´Connell et al. 1978, Viera and Prolla 1979,Dor et al. 1984). However, the methods used were considered difficult and unreliable.
In the 1950s, sputum testing was developed in connection with diagnosis of lungcancer and tuberculosis. Since not all patients could provide sputum samples spontane-ously, some were asked to inhale hypertonic saline, to allow demonstration of malignantcells (Bickermann et al. 1958) or tuberculosis bacteria in sputum specimens. In relationto asthma, international interest in sputum testing arose after it was observed that epithe-lial damage and inflammatory changes are present even in early-stage asthma (Laitinen etal. 1985). In 1992, Pin et al. induced sputum production with the help of hypertonic sa-line to allow determination of eosinophilic inflammation in asthmatic patients.
Cleland (1964) identified dithiothreitol (DTT) and its isomer, dithioethreitol (DTE),as agents with low redox potentials, which could reduce and split mucoprotein disulphidebonds. Shah and Dye (1965) showed treatment with DTT and DTE allowed dispersion ofsputum before processing of smears and cultures for mycobacteria. The agents were notused to process sputum for cell examination until 1978 (Wooton and Dulfano 1978).From 1989, Gibson et al. demonstrated that cell counts using smears of sputum selectedfrom saliva were reproducible and allowed demonstration of asthmatic inflammation.However, it is difficult to identify different types of cell in smears without using specialstains (Pin et al. 1992a). In subsequent developments, DTT or DTE have been used to

16
disperse mucus, cytospins have been made from cell suspensions, and fluid phases havebeen collected for measurement of molecular components (Hansel et al. 1991, Virchow etal. 1992, Fahy et al. 1993a, Popov et al. 1994).
Induced sputum
Sputum production is induced to allow collection of adequate samples of secretions fromthe lower airways for assessment of airway inflammation in patients unable to producesputum spontaneously. It has been shown that inhalation of isotonic or hypertonic solu-tions via an ultrasonic nebulizer induce production of small amounts of secretions fromthe airways. These secretions can be expectorated and analysed. The mechanisms under-lying the process are largely unknown. It is believed that increased osmolarity of airwaylining fluid increases vascular permeability in the bronchial mucosa and production ofmucus by submucosal glands. Hypertonic saline has been shown to increase bronchovas-cular permeability in rat trachea (Umeno et al. 1990) but there is no information abouthow the mucous-secreting cells in the airways are stimulated. It has been shown thatclearance of secretions from the airways in human beings is increased after administra-tion of a hypertonic saline aerosol (Pavia et al. 1978). Our clinical experience is that sa-line inhalation induces coughing, which helps clear the pre-existing sputum from air-ways. Details of the induced sputum method are discussed below.
Indirect measurement of airway inflammation
Clinical features
Direct indices of airway inflammation can correlate with clinical parameters such assymptoms, degree and variability of airflow limitation, and airway responsiveness (Vir-chow et al. 1992, Pizzichini et al. 1996a, Gibson et al. 1992, Pin et al. 1993, Keatings etal. 1997a). However, correlation is not universal and changes in these parameters may notbe similar or simultaneous (Pizzichini et al. 1997a). Correlations between clinical param-eters can vary considerably (Kendrick et al. 1993) or be conflicting (Siersted et al. 1996).It is difficult to judge the nature or degree of airway inflammation from clinical parame-ters (Prameswaran et al. 2000a).
Peripheral blood
Peripheral blood eosinophilia is often found in asthma. Correlations have been observedbetween it and severity of symptoms, degree of airflow limitation and airway responsive-ness to methacholine or histamine (Bousquet et al. 1990, Ulrik 1995). More recently, ithas been suggested that the state of activation of blood eosinophils, as measured by levelsof eosinophil activation markers, e.g. eosinophilic cationic protein (ECP), might be a use-ful indirect marker of airway inflammation (Griffin et al. 1991, Juntunen-Backman et al.1993). However, results of analyses relating to sputum may reflect inflammatory process-es more accurately than results of blood and serum measurements (Pizzichini et al.1996b, Metso et al. 1996, Sorva et al. 1997, Piacentini et al. 1999).

17
INDUCED SPUTUM
Sputum induction
Induction of sputum production involves the subject inhaling saline solution. The subjectis instructed to expectorate the small amount of secretions produced in the airways into asterile plastic container. Various issues that need to be considered in relation to this pro-cedure are listed in Table 2. Although no standard method for the induction of sputumhas been agreed, consensus regarding induction of sputum production in asthma has re-cently been proposed (Kips et al. 1998). A future European Respiratory Society TaskForce document will review the matter (Djukanovic 2000). One reason why standardisa-tion of procedure is desirable is that inhalation of hypertonic saline can cause asthmaticsto suffer airway constriction (Smith and Anderson 1989). The mechanism of the effect isunknown but it may involve activation of airway mast cells (Gravelyn et al. 1988) or sen-sory nerve endings (Makker and Holgate 1993). Safety procedures include measurementof lung function before and during sputum induction, and pre-treatment with a short-act-ing β
2-agonist.
Table 2. Issues relating to sputum induction (based on unpublished data of the European Respira-tory Society Task Force on Induced Sputum)
Facilities, equipment and personnel• Quiet room with water supply and ventilation• Ultrasonic nebulizer, spirometer or peak-expiratory-flow
(PEF) meter, safety equipment,• Sterile saline solutions, sputum cup, freezer in which to
store the sample• Experienced nurse, medical supervision
Pre-treatment with bronchodilators• For safety reasons pre-treat with 200 to 400 µmg of
inhaled salbutamolPulmonary function monitoring
• For safety reasons monitor FEV1 or PEF
• No agreed protocol: monitor before and after inductionof sputum production, at least, and always if adverseeffects appear
Nebulizer output• Ultrasonic nebulizer preferred, several models exist• Output varies between 0.21 and 4.6 ml/min
Concentration of saline solution• Different concentrations have been used (0.9, 3, 4, 5%)• Increasing concentrations or constant concentration
Duration of inhalation• Should be standardised and reported• Duration of between 10 and 30 minutes have been
reported
18
Pre-treatment with bronchodilators
Although some investigators have not pre-treated patients, because they wished to studythe functional response of airways to the bronchoconstricting stimulus (Iredale et al.1994, Bacchi et al. 1997, Gibson et al. 1998b), most have given short-acting β
2-agonists
beforehand, to prevent excessive bronchoconstriction (Pin et al. 1992a, Jatakanon et al.1998a, Wong and Fahy 1997). Severe asthma exacerbation, leading to death in an asth-matic subject undergoing a distilled-water challenge, has been reported (Saetta et al.1995). Safety reasons apart, excessive bronchoconstriction after a few minutes of inhala-tion of hypertonic solution can necessitate interruption of induction and collection of aninsufficient amount of sputum.
In the original studies of sputum induction, few side effects were reported, and nofalls in FEV
1 (Pin et al. 1992a, Fahy et al. 1993a). The safety of sputum induction has
been assessed in patients with asthma in a number of studies (Pizzichini et al. 1997a,Wong and Fahy 1997, de la Fuente et al. 1998, Grootendorst et al. 1999, Hunter at al.1999, ten Brinke et al. 2001) but information on patients with COPD is scarce (Maestrelliet al. 1996, Keatings et al. 1996, Bhowmilk et al. 1998). Pre-treatment with inhaledsalbutamol has not always prevented bronchocontriction in asthma (de la Fuente et al.1998). It has been shown that pre-treatment with a β
2-agonist did not alter the cellular
constituents of induced sputum (Popov et al. 1995, Cianchetti et al. 1999).
Pulmonary function monitoring during induction
No standard approach to pulmonary-function monitoring during sputum induction hasbeen suggested but many authors measure pulmonary function every five to 10 minutes,and every time symptoms occur (Iredale et al. 1994, Bacchi et al. 1997, Pin et al. 1992a,Jatakanon et al. 1998b, Maestrelli et al. 1994). Various methods have been used: most in-vestigators have used spirometers, some PEF meters (Wong and Fahy 1997). It has beensuggested that lung function should be measured within the first minute of sputum induc-tion, to identify subjects who may be unusually sensitive to hypertonic saline (Pizzichiniet al. 1997a).
Concentration of saline solution and nebulizer output
The concentration of saline used for sputum induction has ranged from normal to 5%(Iredale et al 1994, Wong and Fahy 1997, Bacchi et al. 1997). Some investigators changeconcentration during the procedure, starting with 3%, increasing to 4% and 5% (Pin et al.1992a, Pizzichini et al. 1996a). It has been suggested that sputum production should notbe induced in asthmatic patients with an FEV
1 following bronchodilator administration of
less than 1 l or 60% of the predicted value (Wong and Fahy 1997, Kips et al. 1998). Anaerosol of normal saline followed by one of hypertonic saline has, however, been safelyused in patients with severe exacerbations of asthma (Pizzichini et al. 1997a). Saline con-centration and nebulizer output would be expected to influence the safety, tolerability andsuccess rate of the procedure, and the cellular and biochemical characteristics of the spu-tum induced. Hypertonic saline seems to be more effective than normal saline in relationto induction of sputum production (Popov et al. 1995). No differences have been found

19
between cell compositions of sputum induced by use of isotonic saline, hypertonic salineand different concentrations of saline (Popov et al. 1995, Bacchi et al. 1997). In onestudy, jet nebulizers were compared with ultrasonic nebulizers. The success rate washighest with the latter (Popov et al. 1995). Success with ultrasonic nebulizers with rela-tively low outputs has been found to be similar to those with high-output nebulizers(Hunter et al. 1999).
Duration of inhalation
It has been found in at least two studies that the cellular and biochemical constituents ofinduced sputum change during induction (Holtz et al. 1998a, Gershman et al. 1999a).Neutrophils and eosinophils are prominent in samples collected early during induction.Lymphocytes and macrophages are more prominent in samples collected later. Mucinconcentrations are higher in samples collected early than in those collected late, and sur-factant concentrations are higher in samples collected later than in earlier samples (Holtzet al. 1998a, Gershman et al. 1999). The results of these studies suggest that differentcompartments of the respiratory tract are sampled at different times during sputum induc-tion. Central airways are sampled early, peripheral airways and alveoli later (Moodley etal. 2000).
Protocols for sputum induction differ in relation to schedules of sputum collection.Subjects may be asked to stop inhalation at regular intervals to produce sputum, or tostop only when an urge to cough is felt. Methods of sputum expectoration also differ. Insome protocols subjects are required to spit saliva into one container before coughingsputum into another (Gershman et al. 1996). Some authors have suggested that the firstsputum sample should be discarded and that only subsequent samples obtained after sa-line inhalation should be collected and analysed (Jatakanon et al. 1998a).
Sequential sputum induction
In several studies sputum production has been induced sequentially, after intervals ofonly a few hours (Pin et al. 1992b, Nordenhäll et al. 2000). However, it has been suggest-ed that frequent repetition of sputum induction can result in late airway inflammation andaffect differential cell counts in the later inductions (Pavord 1998, Richter et al. 1999).Some authors have reported that induction of sputum eight to 24 hours after a first induc-tion results in more neutrophils being found in the second sputum sample (Kips et al.1995, Nightingale et al. 1998, Holtz et al. 1998b). No effects on eosinophils or other cellsassociated with inflammation were seen. It has been shown that methacholine challengedoes not alter sputum eosinophil counts but may increase sputum neutrophil percentages(Spavanello et al. 1999, Gershman and Fahy 1999).
Sputum processing
Methods of sputum processing for cell counting and fluid-phase measure-ments
Two methods have mainly been used for processing induced sputum (Fig. 2). The first in-

20
volves selecting all of the more dense portions (plugs) from expectorated samples (Pin etal. 1992a, Pizzichini et al. 1996a), the second processing the entire expectorate, consist-ing of sputum plus saliva (Fahy et al. 1993a). Recent modifications to this method in-clude separate collection of saliva and sputum (Gershman et al. 1996, Keatings et al.1996, Louis et al. 1997). Data on whether differential cell counts differ between the twomethods are conflicting. In one study a higher percentage of eosinophils in the sputumprocessed using the selection method than in sputum processed using the entire expecto-rate was reported (Spanevello et al. 1998). However, in other studies this was not found(Peleman et al. 1995, Gershman et al. 1996, Pizzichini et al. 1996b). Both methods haveshown to yield reproducible cell counts and results relating to certain fluid phase markers(in´t Veen et al. 1996, Pizzichini et al. 1996a).
Total and differential cell counts
Total numbers of cells have been counted manually, in a haemocytometer, and cell viabil-ity has been determined using the trypan-blue exclusion method by most investigators(Fahy et al. 1993a, Pizzichini et al. 1996a). Automated methods for total cell countingand differential cell counting have been investigated and found to be unreliable (Hanselet al. 1991, Popov et al. 1994). Differential cell counting involves counting a minimum of400 non-squamous cells on May-Grünwald-Giemsa (MGG)-stained slides. Results arereported as proportions of eosinophils, neutrophils, macrophages, lymphocytes and bron-chial epithelial cells. Metachromatic staining, in which both basophils and mast cells areidentified, has been performed using the toluidine blue staining method (Fahy et al.1993a, Pizzichini et al. 1996a, Popov et al. 1996a, Spanevello et al. 1998). Immunocyto-chemistry can be used in relation to sputum cells (Girbis-Gabardo et al. 1994), and candiscriminate between basophils and mast cells (Gavreau et al. 2000).
Sputum cell counts have been shown to be valid, reliable and responsive to change(Pin et al 1992a, Popov et al. 1994, Claman et al. 1994, Pizzichini et al. 1996b, in´t Veenet al. 1996, Spanevello et al. 1997, Ward et al. 1998). Recently, normal values for a largepopulation of healthy controls have been obtained (Belda et al. 2000, Spavenello et al.2000). In some studies in situ hybridisation has been undertaken in relation to cells in in-duced sputum samples (Olivenstein at al. 1999, Profita et al. 2000). Polymerase chain re-action (PCR)-technique has also been employed (Gelder et al. 1995, Fireman et al.1999a). Flow cytometry has been used to study lymphocyte subsets in sputum (Kidney etal. 1996, Louis et al. 1997).
Fluid-phase measurements
Numerous inflammatory mediators have been measured in the fluid phase of sputum.They include cytokines, chemokines, granulocyte proteins, markers of vascular leakage,eicosanoids and proteases (Fahy et al. 1993b, Tomaki et al. 1995, Keatings et al. 1996,Vignola et al. 1998b and 1999, Louis et al. 1997, Pavord et al. 1999, Tanaka et al. 2000,Purokivi et al. 2000). Many of the assay methods used to measure these soluble media-tors have been developed for serum or culture fluid. The reproducibilities, precisions andvalidities of many of these measurements in sputum have not been investigated (Kelly etal. 2000, Stockley and Bayley 2000).
In many studies the roles played by eosinophils and neutrophils in asthma and COPD

21
process sputum within 2 hours
process the whole sputumselect plugs
Fig. 2.
Sputum processing
Homogenisation•Add DTT (10% Sputolysin solution)
•time: 10-30 minutes
•temperature 4-37°C
•shaking water bath or tube rocker
Centrifugation•300-500G
•time: 5-10 minutes
Filtration•48-52 � mnylon mesh
Perform total cell count•hemocytometer
•viability with trypan blue
Make cytospins•Giemsa stain
•Toluidine blue stain
Cell differential count
RELEASED MARKERSTOTAL MARKERS
Homogenisation•Add DTT (10% Sputolysin solution) and CTAB
•time: 15+60 minutes
•temperature 25°C
•tube rocker
Centrifugation•800G
•time: 10 minutes
Make smears•Methylene eosin stain
Semiquantitive cell count
Aspirate supernatant and store in freezer
Make fluid phase measurements
References: Pin et al. 1992a, Fahy et al. 1993, Pizzichini et al. 1996, in´t Veen et al. 1996,
Keatings et al. 1996, Louis et al. 1997, Metso et al. 2001.
22
have been studied. After activation, eosinophils can release granule-derived proteins, themost cytotoxic of which are eosinophilic cationic protein (ECP) and major basic protein(MBP). Other markers of eosinophil activation include eosinophil protein X (EPX) andeosinophil peroxidase (EPO) (Venge et al. 1999). Myeloperoxidase (MPO) is a proteinreleased from primary (azurophil) granules of neutrophils, and can serve as a marker ofneutrophil activation. Human neutrophil lipokalin (HNL) is another protein that has re-cently been isolated and purified from secondary neutrophil granules (Xu et al. 1994). Itsfunction remains unknown but it may prove a better and more specific marker of neu-trophil activation than MPO.
Simplification of sputum-processing
Sputum processing to allow preparation of cytospin slides and differential cell countingis laborious, and can only be undertaken in larger laboratories. A prerequisite for reliablepreparation of cytospin slides and measurement of inflammatory markers is immediateprocessing of sputum (Grebski et al. 1998, Louis et al. 1999). We therefore modified apreviously validated sputum-processing method (Pizzichini et al. 1996a) to improve itsclinical applicability (Metso et al. 2001) (Fig. 2). Sputum induction and collection ofsputum plugs is the same for both methods. Sputum plugs are first treated with DTT thenwith the cationic detergent CTAB (cetyl-N,N,N-trimethylammonium bromide). DTTtreatment is necessary because liquefaction of sputum plugs prior to CTAB treatment iswanted. Detergent is added to lyse cells and liberate any biochemical markers engulfedby cells. We chose CTAB as detergent because sticky proteins like ECP can be efficientlyrecovered from cell pellets by a one-hour CTAB treatment, as shown by Carlson et al.(1994).
Our method allows sputum specimens for measurement of biochemical markers to befrozen and stored after collection. Specimens can therefore be obtained in one place (e.g.a health-care centre), and processed and analysed elsewhere (e.g. in a central laboratory).This method for sputum processing gives results similar to those obtained using the refer-ence method (Metso et al. 2001). By measuring one eosinophil activation marker, ECP,and one neutrophil marker, MPO, using commercially available kits, eosinophilic andneutrophilic airway inflammation can be studied with reasonable accuracy. Incubation ofreference protein with DTT and CTAB showed no negative effects on marker assays. Re-covery of four markers (eosinophil markers ECP and EPO, neutrophil markers MPO andHNL) ranged from 96.6% to 102.1%. The advantage of our method (which measures to-tal markers) over the reference method (which measures released markers) is its relativesimplicity. Even a small laboratory which does not have cytocentrifuge can use it. Num-bers of cells associated with inflammation can be studied semiquantitatively in smearsprepared using eosin/methylene-blue staining prior to freezing (Hansel 1949).
Spontaneous versus induced sputum
Some asthmatics, particularly those suffering acute exacerbations or experiencing severesymptoms, and COPD patients can produce sputum spontaneously. It has been shownthat spontaneous sputum samples contain percentages of cells and mediators associatedwith inflammation similar to those found in induced sputum samples (Pizzichini et al.1996c, Bhowmik et al. 1998). However, the viabilities of cells in spontaneous sputumsamples is considerably lower than that of cells in induced sputum samples (Pizzichini et

23
al. 1996, Bhowmik et al. 1998), perhaps because mucus secretion stays longer in the air-ways in the first case. Distinction between different types of cells associated with inflam-mation is therefore more difficult.
Comparison between direct measurements of airway inflammation
There have been few direct comparisons in relation to asthma and COPD of results ob-tained following bronchoscopy and through study of induced sputum samples (Fahy et al.1995a, Maestrelli et al. 1995, Grootendorst et al. 1997, Keatings et al. 1997a, Pizzichiniet al. 1998b, Rutgers et al. 2000). The results of these studies allow the conclusion thatthere are marked differences between the two methods, i.e. they complement each otheras research tools (Djukanovic 2000) (Table 1). Differential cell counts obtained usingBAL fluid and induced sputum samples differ even when the volume of physiological sa-line is limited to achieve so-called bronchial wash (Fahy et al. 1995a, Keatings et al.1997). However, in asthma, eosinophil counts correlate with each other (Grootendorst etal. 1997). Higher concentrations of several mediators have been found in sputum samplesthan in BAL fluid (Fahy et al.1995a) but they correlate better than differential cell counts(Rutgers et al. 2000).
In several studies in asthmatics good correlations have been found between numbersof sputum eosinophils and levels of exhaled NO both in adults and children (Jatakanon etal. 1998b, Mattes et al. 1999). Correlation was poorer in steroid-treated asthmatics (Pia-centini et al. 1999, Berlyne at al. 2000). Poor correlation between numbers of eosinophilsin bronchial biopsy samples and levels of exhaled NO has been reported (Lim et al.2000).
Clinical applications of assessment of induced sputum
Induced sputum cell counts can accurately discriminate between eosinophilic and non-eosinophilic airway inflammation, and help guide therapy (Jayaram et al. 2000). Studieson large numbers of subjects can be conducted using induced-sputum methods (Louis etal. 2000a), something that is clearly not easy when bronchoscopy is used. By studyingsubjects with varying degrees of disease severity, insights into determinants of diseasepersistence and severity can be gained.
It has been argued that sputum eosinophils are more responsive to intervention thanblood measurements but not as hypersensitive as exhaled NO levels (Jatakanon et al.1999a). Induced sputum samples have been used to study anti-inflammatory effects oforal and inhaled corticosteroids in adult asthma (Claman et al. 1994, Fahy and Boushey1998, Lim et al. 1999, Jatakanon et al. 1999a, Gershman et al. 2000, Metso et al. 2000).They have also been used in studies of other anti-inflammatory drugs, such as leukotrieneantagonists (Pizzichini et al. 1999a), theophylline (Louis et al. 2000b) and novel agentssuch as anti-IgE antibodies (Fahy et al. 1997). They have been employed in clinical trialsof various combinations of treatment (Kips et al. 2000). Reports of studies of effects oftreatment in COPD patients have been published (Keatings et al. 1997b, Pizzichini et al.1998a, Brightling et al. 2000a).
Induced sputum in children
Induced sputum has been used to study asthma in children since the technique was firstdescribed, in 1992 (Pin et al. 1992b). The method has particular advantages in the study

24
of asthma in childhood because it is relatively non-invasive. In some studies (Gibson etal. 1998b, Oh et al. 1999) hypertonic saline challenge has been used to assess airway re-sponsiveness and to induce sputum production. In other studies, pre-treatment with bron-chodilators has been employed, and sputum induction has been found safe.
Most studies in which sputum production has been induced in children have beencross-sectional, with the asthma in a stable state or the patients suffering acute exacerba-tions (Twaddel et al. 1996, Cai et al. 1998, Gibson et al. 1999, Grootendorst et al. 1999,Piacentini et al. 1999, Wilson et al. 2000, Norzila et al. 2000). In children with stableasthma, numbers of eosinophils and mast cells were found to be higher than normal. Dur-ing acute exacerbations, numbers of neutrophils, mast cells and eosinophils were higherthan normal (Twaddel et al. 1996). No data relating to airway inflammation shortly afterdiagnosis of childhood asthma or from controlled trials of the effects of various anti-in-flammatory treatments are available. Children with cystic fibrosis have been found tohave intense sputum neutrophilia (DeBoeck et al. 2000).
Induced sputum in other diseases
Processes like gastroesophageal reflux and left ventricular heart failure lead to accumula-tions of lipids or haemosiderin in sputum macrophages. It has recently been suggestedthat detection of these markers in sputum macrophages could indicate the existence ofone or other of these diseases (Parameswaran et al. 2000b, Leigh et al. 1999). In intersti-tial lung diseases, such as sarcoidosis and idiopathic pulmonary fibrosis, lymphocytesobtained from BAL fluid and induced sputum samples have been studied by means offlow-cytometry. Results were similar with the two methods of obtaining the lymphocytes(Fireman et al. 1999b, D´Ippolito et al. 1999). Induced sputum has been also been usedto assess for example exposure to hazardous dust, and pulmonary involvement in Crohn´sdisease (Fireman et al. 1999a and 2000).
25
AIMS OF THE STUDY
1. To assess the safety, success rate and reproducibility of sputum induction in patientswith COPD of varying severities, and to characterise airway inflammation in them.
2. To test the hypothesis that eosinophilic airway inflammation is common in patientswith prolonged respiratory symptoms suggestive of asthma, irrespective of lungfunction, and to investigate the effects of anti-inflammatory treatment with inhaledcorticosteroid in such patients.
3. To assess airway inflammation in children of five to 10 years of age shortly afterdiagnosis of asthma, and to investigate the effects of treatment with regular or periodicinhaled corticosteroid.
4. To test a simplified method of analysis of induced sputum in primary health-care andto assess airway inflammation in patients with prolonged cough.

26
SUBJECTS AND METHODS
STUDY POPULATIONS AND DESIGNS
Three hundred and eighty-one subjects participated in the studies. All of the patients andcontrols were Caucasian. Local Ethics Committees had approved the studies. All subjectsgave consent to participation in the studies. In study IV, informed consent was given bysignatures of parents and children over seven years of age. The main characteristics ofthe study populations are shown in Table 3.
Table 3. Diagnoses, clinical data and baseline lung function in patients and control subjects.
Studies and Diagnoses Sex Age Atopic* Smokers* FEV1(f/m) (years) (% of predicted)†
Study ICOPD (n = 28) 9/19 60 (51 - 68) 1 (4%) 28 (100%) 53 (28 - 60)Study IICOPD (n = 21) 2/19 61 (45 - 76) 0 (0%) 21(100%) 54 (23 - 80)Healthy controls (n = 16) 2/14 30 (22 - 53) 0 (0%) 0 (0%) ndStudy IIIRespiratory symptoms (n = 36) 33/3 39 (19 - 60) 19 (53%) 8 (22%) 95 (74 - 119)Asthma (n = 25) 16/9 38 (15 - 75) 14 (56%) 9 (36%) 79 (57 - 105)Healthy controls (n = 43) 27/16 36 (23 - 54) 10 (23%) 4 (9%) 98 (77 - 212)Study IVAsthma (n = 60) 25/35 8 (5 - 10) 37 (62%) 0 (0%) 91 (69 - 116)Healthy controls (n = 17) 10/7 9 (5 - 13) 7 (41%) 0 (0%) 95 (79 - 118)Study VProlonged cough (n = 82) 25/57 46 (16 - 85) 12 (15%) 23 (28%) 82 (41 - 111)Healthy controls (n = 53) 43/10 42 (25 - 61) 9 (17%) 3 (6%) nd
Data are expressed as means and ranges, and numbers and percentages*, COPD = chronic obstructivepulmonary disease, f = female, m = male, nd = not done†Reference values from Viljanen (Viljanen 1982) studies I, III and V, European Community for Coal and Steel
(Quanjer et al. 1993) study II, Polgar and Prodmadhat (Polgar and Prodmadhat 1971) study V.
Study I
The study population consisted of 28 patients, clinically diagnosed as suffering fromsymptomatic COPD (ATS 1995), with an average smoking history of 52 pack-years(range 20 to 103 pack-years) (Table 3). Two (7%) were former smokers, all of the oth-ers current smokers. For inclusion in the study patients had to meet the following crite-ria: 1) FEV
1 before bronchodilator administration of less than 70% of the predicted
value (Viljanen 1982), 2) less than 10% reversibility from FEV1 before bronchodilator
administration in response to a short-acting β2-agonist (200 µg of Ventoline®‚ 0.1 mg,
GlaxoSmithKline, UK). Patients who were being treated for disease exacerbation orwho had needed antibiotic treatment for a respiratory-tract infection during the six

27
weeks preceding the study were excluded. Four patients (14%) used inhaled steroids(beclomethasone or budesonide, mean dose 900 µg/day, range 800 to 1200 µg/day)and two (7%) took theophylline orally. None were on regular oral steroid treatment.Five (18%) had been given a short-acting β
2-agonist and three (11%) an anticholiner-
gic as rescue medication. None of the subjects used long-acting bronchodilators.Two weeks before sputum induction, spirometry was undertaken and reversibility of
FEV1 assessed. Patients measured PEF every morning and evening for one to two weeks
before sputum induction. They also recorded daily symptoms (cough, sputum production,shortness of breath) on a scale ranging from 0 to 4. Patients were allowed to continuetheir usual medication for COPD except that short-acting bronchodilators were not al-lowed during the four hours before induction.
Study II
Twenty-one patients with COPD took part in this prospective study. The FEV1 of each
before bronchodilator administration had to be less than 80% of the predicted value(Quanjer et al. 1993) with less than 10% reversibility from FEV
1 before bronchodilator
administration in response to a short-acting β2-agonist (400 µg of salbutamol, Ventoline‚
0.1 mg). All of the patients were former smokers, who had stopped smoking at least oneyear before entry into the study. They had smoked for a mean of 37.0 pack-years (range20 to 60 pack-years). All except one of the patients were on inhaled steroid treatment(beclomethasone or budesonide, < 1000 µg/day). The 16 healthy controls were selectedfrom hospital employees, had never smoked, and had normal pulmonary function. Noneof the subjects had had a respiratory-tract infection within the four weeks preceding thestudy.
Subjects visited the laboratory three times. During the first visit, subject characteris-tics were documented and lung function (spirometry and diffusion capacity) measure-ments were made. Subsequently, subjects underwent sputum induction, at the same timeof the day, on 2 days, 10 days apart. Results of spirometry were recorded before and afterthe induction.
Study III
The study population consisted of 36 consecutive patients with respiratory symptomssuggestive of asthma referred to the Outpatient Clinic of the Department of Allergy, Skinand Allergy Hospital, Helsinki University Central Hospital during the period October1996 to March 1997. Twenty-five patients who had been diagnosed as asthmatic duringthe same period and 43 healthy individuals were recruited into control groups.
For inclusion in the study, patients with respiratory symptoms suggestive of asthmahad to be symptomatic at the time they were studied. We included only patients who hadreported at least two of six respiratory symptoms (cough, chest tightness with wheezing,shortness of breath, sputum production, wheezing or cough on exercise, disturbed sleep)for more than two months but not for more than one year. Each of the six symptoms wasgraded on a scale ranging from 0 (asymptomatic) to 9 (most severe discomfort). Patientswho had been treated with anti-inflammatory asthma medication (corticosteroids, diso-dium cromoglycate, nedocromil sodium or theophylline) or who had used H
2-blockers
were excluded. Patients had to have normal chest and sinus X-rays, and normal serum C-reactive protein values. The healthy subjects exhibited no respiratory symptoms and hadno history of chronic pulmonary disease. Patients or healthy subjects who had had a clin-
28
ically diagnosed respiratory infection during the preceding eight weeks were excluded.None of the smokers included had a history of chronic bronchitis (ATS 1995).
Patients were considered asthmatic in this study if they exhibited, during restingflow-volume spirometry, an increase of 12% or more in FEV
1 15 minutes after inhalation
of 200 µg of salbutamol (Buventol Easyhaler® 100 µg/dose, Orion Pharma, Espoo, Fin-land), or if PEF varied by more than 12% between morning and evening on at least threedays during a two-week follow-up period. They also had to exhibit increased bronchialresponsiveness to inhaled histamine (Sovijärvi et al. 1993). Patients who did not displaysignificant airflow variability and were not hyperresponsive were diagnosed as exhibitingrespiratory symptoms. All of the healthy subjects had normal lung function.
Subjects visited the laboratory three times. During the first visit, subject characteris-tics were documented and lung function measured. Patients measured PEF every morn-ing and evening for one to two weeks. One week after the first visit, bronchial respon-siveness to inhaled histamine was measured. A week later sputum was induced.
Follow-up
To study the effects of treatment with inhaled steroid and the course of respiratory symp-toms, the 36 patients without variable airway obstruction were allotted at random to inhale,on a single-blind basis, beclomethasone dipropionate (BDP), 400 µg b.i.d., from a multi-dose powder inhaler (Beclomet Easyhaler® 200 µg/dose, Orion Pharma, Espoo, Finland), orplacebo (lactose) for the first three months. Randomisation was performed using a compu-terised list based on a block size of 10. Compliance was checked by collecting the dry pow-der inhalers after the three-month treatment period and checking whether they had beenused adequately. After the first three-month period patients were allowed to take sympto-matic medication if needed (inhaled salbutamol, Buventol Easyhaler® 100 µg/dose). Symp-toms, lung function, and blood and sputum samples were studied at three months and afterone year. Patients with asthma and normal subjects were not followed-up.
Study IV
The study population consisted of 60 children (five to 10 years of age) with newly diag-nosed asthma, and 17 healthy control subjects (Table 3). The asthmatic children wererandomly selected from 180 subjects participating in a study of early pharmacologicaltreatment of childhood asthma (Turpeinen 2000). All of the asthmatic children had tohave a history of asthma symptoms, defined as cough, wheeze or decreased tolerance toexercise, during the preceding month at least. They had to meet at least one of the follow-ing inclusion criteria during the preceding month:
1) Abnormal diurnal variation in PEF (≥ 20%). Assessment of variation was based onrecords in written diaries kept by the patient or the patient’s parents. Variation in PEFwas calculated by the investigator as 100 x (PEF evening - PEF morning)/ average PEF .2) Bronchial reversibility of ≥ 15% as measured by PEF or FEV
1 in response to 0.50 mg
of inhaled terbutaline (Bricanyl Turbuhaler® 0.25 mg/dose, AstraZeneca, London UK,Sweden). 3) A fall of ≥ 15% in FEV
1 during an exercise test conducted in accordance
with methods used at the clinic. Patients were excluded if they exhibited asthmatic symp-toms only during the pollen season, if there was a history of passive smoking at home, orif hairy pets had been kept at home during the previous months. They were also excluded

29
if they had previously required maintenance treatment for asthma, had ever been treatedwith inhaled corticosteroids for more than 60 days, or had had moderate to severe atopicdermatitis (extent more than 15%). Before the study, patients were not allowed to havebeen given an inhaled, nasal or oral corticosteroids, inhaled disodium cromoglycate or in-haled nedocromil during the preceding two months, or a long-acting β
2-agonist during
the preceding month. The healthy control subjects exhibited no respiratory symptoms andhad normal lung function. None of the children had had symptoms of a respiratory tractinfection within the four weeks preceding the study.
Cross-sectional study (baseline)
Patients and healthy controls were evaluated in relation to various baseline parametersduring a four-week run-in period. During this time all of the children paid three visits tothe outpatient unit. During the first visits, a physical examination was performed, and thechildren and parents were interviewed. Flow-volume spirometry and skin-prick testswere performed. The children were instructed about use of an electronic home spirome-ter. Lung function and symptom scores were monitored twice daily at home throughoutthe study. During the second visit, a histamine challenge test was performed. During thethird visit, at least one week after the second visit, flow-volume spirometry was under-taken and sputum was induced, blood samples were taken, and data for baseline measure-ments were downloaded from the home spirometer.
Longitudinal study (treatment)
After the baseline evaluation, children with asthma were randomised to three treatmentgroups. In the double-blind study, children received 1) budesonide 400 µg b.i.d. for onemonth (Pulmicort Turbuhaler 400 µg/dose, AstraZeneca), 200 µg b.i.d. for five months(Pulmicort Turbuhaler 200 µg/dose), followed by 100 µg b.i.d. for 12 months (Pulmi-cort Turbuhaler 100 µg/dose) (n=19) or 2) the same treatment as the first group for thefirst six months, thereafter placebo for 12 months (n=20). A third group of patients re-ceived in an open study disodium cromoglycate 10 mg t.i.d. for 18 months (pressurisedmetered dose inhaler with a valved spacer device, Lomudal with Fisonair , Fisons, UK)(n=21). A patient in any treatment group who experienced an asthma exacerbation wastreated with budesonide, 400 µg b.i.d (Pulmicort Turbuhaler 400 µg/dose), for twoweeks, as a replacement for their normal treatment. Exacerbation of asthma was suspect-ed if asthma symptoms were not controlled by up to six inhalations of terbutaline (Brica-nyl Turbuhaler , 0.25 mg/dose, AstraZeneca) over 24 hours. In such cases, the patientwas examined at the clinic, where lung function measurements were performed. A deci-sion about whether a patient needed treatment for an exacerbation was made by the in-vestigator, who was blind in relation to budesonide treatment but not to cromoglycatetreatment. Compliance with dosing regimes was checked by recording peak inspiratoryflow by means of a Turbuhaler (PIF
TBH) with a pneumotachograph, and by weighing re-
turned Lomudal canisters during each visit to the clinic. During the study period of 18months, compliance with treatment instructions gradually declined in each group, from90% to 55% (Turpeinen 2000).

30
Study V
Eighty-two consecutive patients not known to suffer from asthma or any other chronicrespiratory disease were enrolled into the study in six health-care centres in the Helsinkiarea of Finland, between November 1997 and February 1998. Each centre serves a popu-lation of about 30 000. One physician from each centre participated into the study andwas specially trained in the Skin and Allergy Hospital, Helsinki University Central Hos-pital. Patients complaining of coughing daily for more than one month were eligible forenrolment into the study. Patients had to be symptomatic at the time they were studiedand were carefully questioned about respiratory symptoms other than cough. Patients be-ing treated with anti-inflammatory asthma medication (corticosteroids, disodium cromo-glycate, nedocromil sodium, theophylline, leukotriene antagonists) or who were usingangiotensin-converting-enzyme inhibitors were excluded. Patients who had suffered froma respiratory infection during the preceding six weeks or who had symptoms of rhinitisor gastro-oesophageal reflux were also excluded. Patients had to have normal chest andsinus X-rays, and normal serum C-reactive protein values. Fifty-three healthy controlsubjects with no history of asthma or other respiratory symptoms were recruited from thestaff of the Skin and Allergy Hospital, Helsinki University Central Hospital.
Physicians were asked to complete a questionnaire regarding the symptoms and med-ical history of each patient. Participants were subjected to careful physical examination.PEF values were recorded for all patients and control subjects (highest value from threesuccessful attempts in each case). If the physician suspected asthma on the basis of theresults of these examinations, variability of PEF values measured mornings and eveningsover a two-week period was recorded. When feasible, spirometry was performed. Sputumwas induced within a week of the consultation.
METHODS
Lung function measurements
Spirometry
Various spirometers were used (Studies I and IV Spirotrac III®, Vitalograph, Ltd., Buck-ingham, UK; study II Expirograph , Godart, Bilthoven, Netherlands; studies III and VMedikro 905®, Medikro Oy, Kuopio, Finland). At least three forced expiratory volumecurves were obtained that were technically correct according to ATS acceptability criteria(less than 5% variability, ATS 1987b) or ERS acceptability criteria (less than 4% variabil-ity, Quanjer et al. 1993). Reference values were those of Viljanen (1982) in studies I, IIIand V, European (Quanjer et al. 1993) in study II, and those of Polgal and Promadhat(1971) in study IV. Reversibility of FEV
1 as determined by means of spirometry was
measured in studies I, III and V 15 minutes after inhalation of 200 µg of salbutamol(Ventoline MDI with Volumatic or Buventol Easyhaler ).
31
Diffusing capacity
Single breath carbon monoxide diffusing capacity (DLCO/VA) was measured (Master-screen PFT®, Erich Jaeger BmbH, Hoechberg, Germany) as described (ATS 1987c) instudy II.
Histamine challenge
Airway responsiveness to histamine, expressed as the histamine dose (mg) resulting in a15% decrease in FEV
1 (PD
15 FEV
1) or a 20% decrease in PEF (PD
20PEF), was deter-
mined using an automated, inhalation-synchronised, dosimetric jet nebulizer (Spira Elec-tro 2®, Respiratory Care Centre, Hämeenlinna, Finland) as previously described (Sovi-järvi et al. 1993, Pelkonen et al. 1997). The maximum dose inhaled histamine was 1.6mg. PD
15 FEV
1 >1.6 mg of histamine is considered normal for adults and PD
20 PEF >1.6
mg of histamine for children.
Peak expiratory flow (PEF)
PEF values were measured at home every morning and evening by means of a MiniWright peak-flow meter (Clement Clarke Int., London, UK) over a two-week follow-upperiod (studies I, III to V). Three measurements were made and the highest value was re-corded. Variation in PEF was calculated by the investigator using the formula 100 x (PEFevening - PEF morning) / average PEF evening and morning.
Home recordings
In study IV, lung function was recorded at home using a Vitalograph Data Storage Spirome-ter (Vitalograph) specially designed for long-term recording and storage of lung-functionparameters, as previously described (Pelkonen et al. 1997 and 2000). The device consists ofa pneumotachograph with a built-in electronic diary. Lung function parameters, includingFVC (forced vital capacity), FEV
1, PEF and PIF
TBH were monitored twice daily. Measure-
ment was repeated up to five times, until the two best sets of values met ATS (1995) repro-ducibility criteria. Children were asked to record symptom scores twice daily (scales 0 to10) and use of rescue medication (Bricanyl Turbuhaler 0.25 mg/dose). The median PIF
TBH
during the last run-in week had to be at least 40 l/min as measured and recorded using a Vi-talograph Data Storage Spirometer and judged by the investigator.
Skin prick tests
Skin prick tests were made using 10 common inhalant allergens (Soluprick SQ, 10 HEP,ALK, Denmark), and positive (histamine dihydrochloride, 10 mg/ml) and negative (sol-vent) control solutions. The allergens used were birch, timothy, meadow fescue, andmugwort pollen; horse, cat, dog and cow danders; the mite Dermatophagoides pteronys-simus; and spores of the mould Cladosporium herbarum. A subject was classified as at-
32
opic if any allergen caused a weal 3 mm or more in diameter and the control solutionsproduced the expected results (Dreborg 1989).
Sputum induction
Various ultrasonic nebulizers and different concentrations of saline were used for sputuminduction (Table 4). Before induction, subjects were asked to blow their noses and rinsetheir mouths. Pre-treatment with a bronchodilator was used in four of the five studies(Table 4). Lung function was monitored by means of FEV
1 or PEF before and after in-
duction in all studies except study I.In study I, 10 minutes after bronchodilator pre-treatment, spirometry was undertaken.
If FEV1 after bronchodilator administration was less than 1 l, normal (0.9%) saline was
used, and FEV1 was
checked every three minutes. If FEV
1 after bronchodilator adminis-
tration was more than 1 l, induction was started with 3% hypertonic saline, and FEV1 was
measured every seven minutes. Inhalation was discontinued if lung function fell by morethan 20% or if troublesome symptoms occurred.
Patients were urged to interrupt inhalation repeatedly to cough sputum into a sterileplastic cup. To minimise salivary contamination, saliva was collected in a separate cup instudy IV (Gershman et al. 1996). Inhalation times in studies III to V were 15 to 20 min-utes. In studies I and II they varied from two to 21 minutes.
Sputum processing
Various sputum-processing methods were used (Table 5). The methods were modifiedfrom those described by Pin et al. (1992a) and Fahy et al. (1993a) and validated by Pizzi-chini et al. (1996a) and in´t Veen et al. (1996).
Studies I and III
The method of sputum examination described by Pizzichini et al. (1996) was used. Brief-ly, all sputum macroscopically free of salivary contamination was selected and treatedwith dithiothreitol (Sputolysin , Boehringer-Calbiochem Corp., LaJolla, Ca, US, diluted10-fold in distilled water). The mixture was incubated for 15 minutes on a roller mixer atroom temperature. An equal volume of phosphate-buffered saline (PBS) was added andincubation was continued for a further five minutes. The mixture was filtered using a 52-µm mesh nylon filter (Nybolt PA-53/35, Seidengaze, Germany). Sputum cells were sepa-rated by centrifugation at 800 g for 10 minutes and sputum supernatant was collected fordeterminations of fluid-phase markers. Cells obtained after centrifugation were resus-pended in 1 ml of PBS and total cell numbers were determined using a haemocytometer.Viability was measured using the trypan-blue (Sigma Chemical, St.Louis, MO, US) ex-clusion test. The cell suspension was cytocentrifuged (Cytospin 3®, Shandon, Astmoor,UK) on to Vectabond-treated (Vectabond® Reagent, Vector Laboratories Inc., CA, US)microscope slides at 300 rpm for five minutes. Slides were air-dried for at least 30 min-utes. One slide was used for differential staining by means of the May-Grünwald-Giemsa(MGG) method. Two slides were fixed using Carnoy’s fixative and stained using toluid-ine blue (Fluka AG, Buchs, Switzerland) for detection of metachromatic cells (basophils,mast cells). At least 400 nonsquamous cells were counted on MGG-stained slides, 1500on toluidine blue-stained slides, using a standard light microscope (Axioskop 20, CarlZeiss, Heidenheim, Germany).
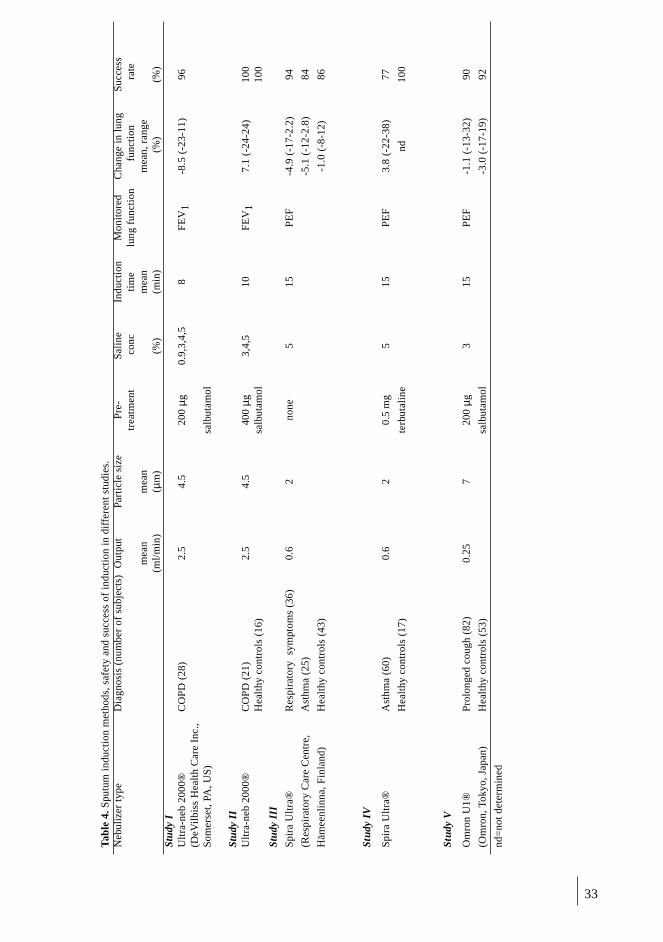
33
Tab
le 4
. Spu
tum
ind
ucti
on m
etho
ds, s
afet
y an
d su
cces
s of
ind
ucti
on i
n di
f fer
ent
stud
ies.
Neb
uliz
er t
ype
Dia
gnos
is (
num
ber
of s
ubje
cts)
Out
put
Part
icle
siz
eP
re-
Sal
ine
Indu
ctio
nM
onit
ored
Cha
nge
in l
ung
Suc
cess
trea
tmen
t c
onc
tim
elu
ng f
unct
ion
fun
ctio
n r
ate
mea
nm
ean
mea
nm
ean,
ran
ge(m
l/m
in)
( µm
)(%
)(m
in)
(%
)(%
)St
udy
IU
ltra
-neb
200
0®C
OP
D (
28)
2.5
4.5
200
µg0.
9,3,
4,5
8F
EV
1-8
.5 (
-23-
11)
96(D
eVil
biss
Hea
lth
Car
e In
c.,
Som
erse
t, PA
, US
)sa
lbut
amol
Stud
y II
Ult
ra-n
eb 2
000®
CO
PD
(21
)2.
54.
540
0 µg
3,4,
510
FE
V1
7.1
(-24
-24)
100
Hea
lthy
con
trol
s (1
6)sa
lbut
amol
100
Stud
y II
I
Spi
ra U
ltra
®R
espi
rato
ry s
ympt
oms
(36)
0.6
2no
ne5
15P
EF
-4.9
(-1
7-2.
2)94
(Res
pira
tory
Car
e C
entr
e,A
sthm
a (2
5)-5
.1 (
-12-
2.8)
84
Häm
eenl
inna
, Fin
land
)H
ealt
hy c
ontr
ols
(43)
-1.0
(-8
-12)
86
Stud
y IV
Spi
ra U
ltra
®A
sthm
a (6
0)0.
62
0.5
mg
515
PE
F3.
8 (-
22-3
8)77
Hea
lthy
con
trol
s (1
7)te
rbut
alin
end
100
Stud
y V
Om
ron
U1®
Pro
long
ed c
ough
(82
)0.
257
200
µg3
15P
EF
-1.1
(-1
3-32
)90
(Om
ron,
Tok
yo, J
apan
)H
ealt
hy c
ontr
ols
(53)
salb
utam
ol-3
.0 (
-17-
19)
92
nd=
not
dete
rmin
ed
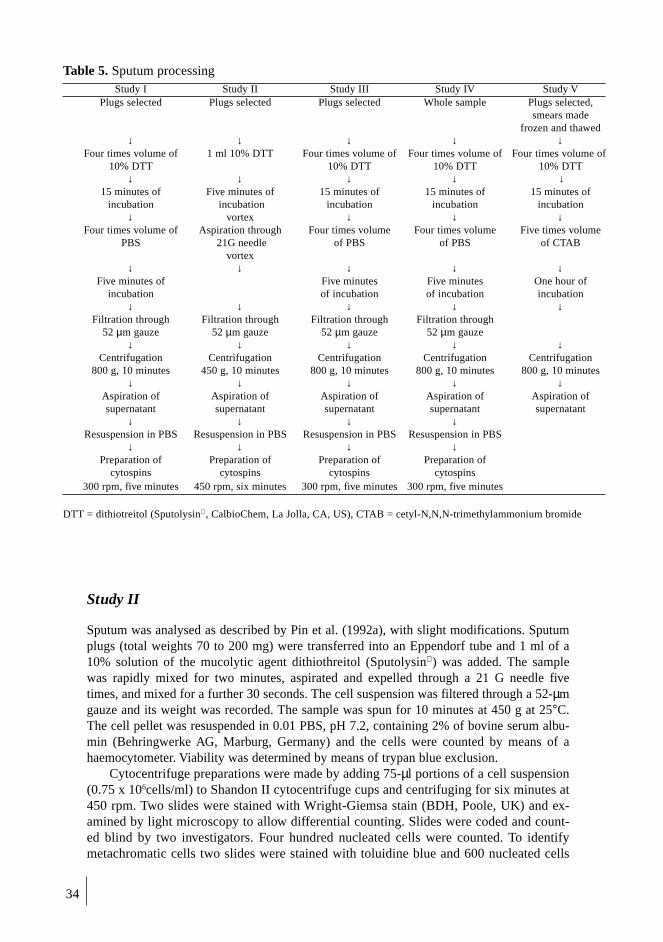
34
Table 5. Sputum processingStudy I Study II Study III Study IV Study V
Plugs selected Plugs selected Plugs selected Whole sample Plugs selected,smears made
frozen and thawed↓ ↓ ↓ ↓ ↓
Four times volume of 1 ml 10% DTT Four times volume of Four times volume of Four times volume of10% DTT 10% DTT 10% DTT 10% DTT
↓ ↓ ↓ ↓ ↓15 minutes of Five minutes of 15 minutes of 15 minutes of 15 minutes of
incubation incubation incubation incubation incubation↓ vortex ↓ ↓ ↓
Four times volume of Aspiration through Four times volume Four times volume Five times volumePBS 21G needle of PBS of PBS of CTAB
vortex↓ ↓ ↓ ↓ ↓
Five minutes of Five minutes Five minutes One hour ofincubation of incubation of incubation incubation
↓ ↓ ↓ ↓ ↓Filtration through Filtration through Filtration through Filtration through
52 µm gauze 52 µm gauze 52 µm gauze 52 µm gauze↓ ↓ ↓ ↓ ↓
Centrifugation Centrifugation Centrifugation Centrifugation Centrifugation800 g, 10 minutes 450 g, 10 minutes 800 g, 10 minutes 800 g, 10 minutes 800 g, 10 minutes
↓ ↓ ↓ ↓ ↓Aspiration of Aspiration of Aspiration of Aspiration of Aspiration ofsupernatant supernatant supernatant supernatant supernatant
↓ ↓ ↓ ↓Resuspension in PBS Resuspension in PBS Resuspension in PBS Resuspension in PBS
↓ ↓ ↓ ↓Preparation of Preparation of Preparation of Preparation of
cytospins cytospins cytospins cytospins300 rpm, five minutes 450 rpm, six minutes 300 rpm, five minutes 300 rpm, five minutes
DTT = dithiotreitol (Sputolysin , CalbioChem, La Jolla, CA, US), CTAB = cetyl-N,N,N-trimethylammonium bromide
Study II
Sputum was analysed as described by Pin et al. (1992a), with slight modifications. Sputumplugs (total weights 70 to 200 mg) were transferred into an Eppendorf tube and 1 ml of a10% solution of the mucolytic agent dithiothreitol (Sputolysin ) was added. The samplewas rapidly mixed for two minutes, aspirated and expelled through a 21 G needle fivetimes, and mixed for a further 30 seconds. The cell suspension was filtered through a 52-µmgauze and its weight was recorded. The sample was spun for 10 minutes at 450 g at 25°C.The cell pellet was resuspended in 0.01 PBS, pH 7.2, containing 2% of bovine serum albu-min (Behringwerke AG, Marburg, Germany) and the cells were counted by means of ahaemocytometer. Viability was determined by means of trypan blue exclusion.
Cytocentrifuge preparations were made by adding 75-µl portions of a cell suspension(0.75 x 10⁶cells/ml) to Shandon II cytocentrifuge cups and centrifuging for six minutes at450 rpm. Two slides were stained with Wright-Giemsa stain (BDH, Poole, UK) and ex-amined by light microscopy to allow differential counting. Slides were coded and count-ed blind by two investigators. Four hundred nucleated cells were counted. To identifymetachromatic cells two slides were stained with toluidine blue and 600 nucleated cells
35
per slide were counted. The remaining slides were kept at -80°C for further immunocyto-chemical staining.
Immunocytochemical analysis
Cell surface markers were demonstrated by immunocytochemical staining with themonoclonal mouse antibodies CD3 (all T cells), CD4 (helper T cells), CD8 (suppresser Tcells), CD 20 (all B cells), CD25 (activated T cells), CD 45 (all leukocytes), CD 68 (mac-rophages), and Ber-Mac3 (activated macrophages) (all from Dako, Dakopatts, Copenha-gen, Denmark) using the alkaline phosphatase anti-alkaline phosphatase (APAAP) meth-od in accordance with the suppliers’ instructions (Cordell et al. 1984). Briefly, slidesbearing frozen cells were thawed and fixed with 4% paraformaldehyde, pH 7.2, for fiveminutes at room temperature. After fixation, preparations were rinsed with 0.05 M TRIS-buffered saline, pH 7.35, (TBS) and incubated with primary antibody diluted in TBS(1:100 for all antibodies expect 1:50 for CD20) in a moist chamber at room temperaturefor 30 minutes. Secondary rabbit anti-mouse antibody and mouse APAAP complex (bothfrom Dako) diluted 1/25 in TBS were applied to slides for 30 minutes in each case. Addi-tional incubations of secondary antibody and APAAP-complex were then undertaken for10 minutes. Washing between steps was done with TBS. Endogenous alkaline phos-phatase activity was blocked with levamisole and the signal was developed with Fast RedViolet substrate for 20 minutes, giving an intense red coloration. The substrate was pre-pared from 0.2 M TRIS/HCL-buffer, pH 8.5, 25 ml; distilled water 15 ml; levamisole 15mg; naphthol AS-BI phosphate 5 mg; dimethylformamide 0.5 ml, and Fast Red Violet 40mg (all from Sigma Chemical, St. Louis, MO, US). Mayer’s haematoxylin (Sigma Chem-ical) was used for counterstaining, and the slides were mounted with a water-basedmounting medium (Glycergel, Dako). Four hundred nucleated cells were counted usingbright-field microscopy. Positive cells were expressed as percentages of intact, round, nu-cleated cells, ignoring squamous epithelial cells. Mouse IgG1 (Dako) was used as a nega-tive control in all of the experiments. Cytocentrifuge preparations made from peripheralblood leukocytes separated using a Ficoll-Paque (Pharmacia, New Jersey, US) gradientwere used as positive controls. For anti-CD25 staining positive controls, leukocytes werestimulated with phytohaemagglutinin in culture for 48 hours.
Study IV
We used a sputum processing method modified from the one described by Fahy and col-leagues (Fahy et al. 1993) and validated by in´t Veen et al. (1996). Briefly, an entire spu-tum sample was weighted and treated with an equal volume of dithiothreitol (Sputolysin10%, Calbiochem Corp.) and PBS. The samples were gently mixed and incubated in ashaker at room temperature. The resulting suspension was centrifuged at 800 g for 10minutes, and the supernatant was aspirated and stored in Eppendorf tubes at -200C forlater assay. The cell pellet was resuspended, and viabilities and absolute numbers of cellsper milligram of sputum processed were calculated by means of trypan-blue exclusion,using a haemocytometer. Coded cytospins were prepared and stained using MGG stainand toluidine blue, to obtain differential cell counts. Four hundred nonsquamous cellswere counted on the MGG-stained slides, 1500 cells on toluidine-blue-stained slides. Asputum sample was considered adequate if it had less than 80% of squamous epithelialcell contamination from saliva (in´t Veen et al. 1996).
36
Study V
Sputum handling in primary health care
Sputum samples were transferred to Petri dishes and examined against a dark surface.The more viscous parts were collected, using forceps, and mixed. Some of each samplewas used to make two smears, which were air-dried. The rest was transferred into a pre-weighed tube and frozen at –20 °C.
Sputum analysis in the laboratory
Frozen sputum samples and air-dried slides were sent to the Skin and Allergy Hospital,where further analyses were undertaken. Samples were processed using the method pre-viously described and validated (Metso et al. 2001). Briefly, each sample was thawed andtreated with a DTT (diluted 10-fold with distilled water) and a detergent (0.5% cetyl-N,N,N-trimethylammonium bromide, 0.4% human serum albumin, 100 mM PBS, pH7.2). After incubation for one hour cells were lysed, and markers inside and outside thecells released and solubilized. Sputum supernatant was separated from cell debris by cen-trifugation and frozen at -200C for later assay.
Air-dried slides were stained using eosin and methylene blue. Cell proportions wereassessed semi-quantitatively, on a scale from 0 to 4, modified from previously describedscales (O´Connell et al. 1978). Eosinophils were graded as 0 = none or occasional, 1 =scanty, 2 = moderate, 3 = numerous, or 4 = predominant. The approximate values of thegrades were 0 = eosinophils fewer than 1% of all non-squamous cells, 1 = eosinophilsone to 5% of all non-squamous cells, 2 = eosinophils five to 10% of all non-squamouscells, 3 = eosinophils 10 to 50% of all non-squamous cells, and 4 = eosinophils morethan 50% of all non-squamous cells. A sample was considered adequate and originatingfrom the lower airways if it contained macrophages and fewer than 50% of squamous ep-ithelial cells.
Fluid-phase measurements
Concentrations (µg/l) in thawed serum and sputum supernatants of two markers of eosi-nophil activation, eosinophil cationic protein (ECP) and eosinophil peroxidase (EPO),and of two markers of neutrophil activation, myeloperoxidase (MPO) and human neu-trophil lipocalin (HNL), were measured. ECP and MPO concentrations were determinedusing commercially available immunoassay kits (Pharmacia). EPO and HNL concentra-tions were determined using prototype kits (Pharmacia CAP System FEIA, Pharmacia)as previously described (Helenius et al. 1998). All analyses were blind in relation to clin-ical characteristics of subjects.
Statistical analyses
Data are expressed as means plus or minus the standard error of the mean (SEM), medi-ans or ranges. In the case of bronchial responsiveness following histamine challenge, ge-ometric means were calculated. Significances of differences between several groups wereassessed using Kruskal-Wallis one-way analysis by ranks. Significances of differencesbetween two groups were assessed using the Mann-Whitney U-test or the χ2-test, as ap-

37
propriate. Wilcoxon´s test relating to paired data was used in determining significancesof differences for follow-up data relating to a given patient. Significances of correlationswere assessed using Spearman´s test. Two-tailed p values below 0.05 were considered toindicate significance.
The reference (normal) range for sputum eosinophils in study III was calculated asthree standard deviations of mean values for the healthy control group. The control groupwas used to establish upper limits of normal ranges (90th percentiles) for sputum ECP,EPO, MPO and HNL values in study V and for numbers of eosinophils in blood and spu-tum in study IV.
In study IV, sensitivities and specificities of results of determinations of numbers ofeosinophils in blood and sputum in relation to diagnoses of asthma were assessed, usingcut-off values relating to the healthy control group. However, since the cut-off valueswere selected arbitrarily (Pizzichini et al. 1997b), the reliability of determinations ofnumbers of blood and sputum eosinophils was assessed by preparing a receiver-operat-ing-characteristic (ROC) curve for each test (Hanley and McNeil 1982). Areas undercurves (AUCs) were compared using the method of Hanley and McNeil (1983). AUCsclosest to 1.0 indicate greatest reliability of diagnosis.
The reproducibility of sputum cell counts was examined by means of repeated-measures analysis of variance with calculation of an intraclass correlation coefficient (theratio of the variance of cell counts between subjects to the total variance in cell counts,including observer and error variance) (Kramer and Feinstein 1981). Values above 0.75indicate high reliability. Intrapatient variability at various time points was also assessed,using a coefficient of reproducibility representing limits within which 95% of the differ-ences are expected to be found (Bland and Altman 1986).

38
RESULTS
CLINICAL CHARACTERISTICS OF SUBJECTS
Baseline clinical characteristics of subjects are shown in Table 3. Most patients withCOPD were male. There were more women than men in the other groups of adults.COPD patients were older than other adult subjects (p < 0.0001). Subjects were regardedas atopic if at least one result of skin-prick testing was positive (see Methods). Numbersand percentages of atopic subjects are shown in Table 3.
Reversibility of lung-function measurements and airwayresponsivenessResults of lung-function measurements at baseline from all studies are shown in Table 3.Results of reversibility testing, PEF follow-up and histamine challenge in studies I, IIIand IV are shown in Table 6.
In study II, mean diffusion capacity was 62 ± 3.4% of that predicted. In study V inprimary care, 13 of 82 patients (16%) were diagnosed as suffering from asthma on thebasis that PEF values varied by more than 20% between morning and evening on threedays during the two-week follow-up period, or that reversibility of FEV
1 exceeded 15%.
In the asthmatic children in study IV, PD20
PEF correlated with baseline FEV1
(r =0.43, p = 0.001), morning PEF (% of predicted) (r = 0.39, p = 0.01), and evening PEF (%of predicted) (r = 0.40, p = 0.01). Atopic asthmatic children were more responsive to his-tamine than non-atopic asthmatic children (PD
20PEF 0.84 ± 0.10 versus 1.21 ± 0.10 mg,
p = 0.009). These two subgroups of asthmatics did not differ from each other in respectof other lung function measurements.
Table 6. Bronchodilator responses, PEF-variability and airway responsiveness at baseline in stu-dies I, III and IV
Studies and Diagnoses Reversibility of Variability of PEF Airway responsivenessFEV1 (%) (%) mg*
Study ICOPD (n = 28) 2.5 (-7.4 - 9.9) 8.9 (1.9 - 39) ndStudy IIIRespiratory symptoms (n = 36) 2.5 (0 - 6.0) 5.2 (0 - 11) > 1.6Asthma (n = 25) 11.2 (11 - 60) 21.1 (11 - 60) 0.40 (0.02 - 1.25)Healthy controls (n = 43) nd nd > 1.6Study IVAsthma (n = 60) nd 10.4 (3.1 - 25) 0.92 (0.02 - 1.6)Healthy controls (n = 17) nd 0.3 (0 - 1) 1.50 (0.41 - 1.6)
Data expressed as means and ranges, nd = not determined* In study III PD15 is the dose of histamine provoking a 15% fall in FEV1. In study IV PD20, is the dose ofhistamine provoking a 20% fall in PEF (Sovijärvi et al. 1993)
39
Symptoms
Different questionnaires and scales relating to symptoms were used in each study. Re-sults are therefore not comparable between studies. In study III, patients with asthma hadhigher total symptom scores (p = 0.005) than patients with respiratory symptoms sugges-tive of asthma. They also had higher individual scores relating to wheezing (p < 0.0001),shortness of breath (p = 0.006), and exercise symptoms (p = 0.0003). Duration of symp-toms was similar in both groups (mean nine months).
In study IV, at baseline 23 asthmatic children (38%) complained only of cough. Thir-ty-seven (62%) had experienced both coughing and wheezing. Children who wheezedwere significantly more hyperresponsive to histamine than children who did not(PD
20PEF of 1.23 ± 0.10 versus 0.84 ± 0.01 mg, p = 0.009). Children who wheezed also
had more sputum eosinophils than those with just cough (7.8 ± 2.0 versus 1.2 ± 0.5 %,p = 0.02). The mean duration of symptoms for all asthmatic children was 10 months(range one to 72 months). The three treatment groups in study IV did not differ fromeach other at baseline.
In study V, the mean duration of cough in primary health care patients was 11months (range one to 96 months). It was 15 months for asthmatics, and 10 months forother patients. Forty patients (49%) reported marked sputum production, 38 (46%)wheezing or cough on exercise, 30 (37%) disturbed sleep, 28 (34%) shortness of breath,and 23 (28%) chest tightness with wheezing. Asthmatics more often experienced sputumproduction (p = 0.03, χ2-test), and chest tightness with wheezing (p = 0.04) than patientswith prolonged cough without asthma.
Measurements relating to blood and serum
In study III, asthma patients had significantly higher blood eosinophil counts and higherconcentrations of serum EPO than patients with respiratory symptoms (p = 0.002, p =0.008), and healthy individuals (p < 0.0001 in both cases) (Table 7). Patients with respi-ratory symptoms also had higher blood eosinophil counts and higher concentrations ofserum EPO than healthy individuals (p = 0.01, p = 0.02, respectively). Atopic asthmaticshad higher blood eosinophil counts than non-atopic asthmatics (0.51 versus 0.27 x 10⁹/l,p = 0.04). In study V, serum ECP was highest (mean 12.0 mmg/l, range 4-26 mmg/l) inpatients with chronic cough who had been diagnosed as suffering from asthma.
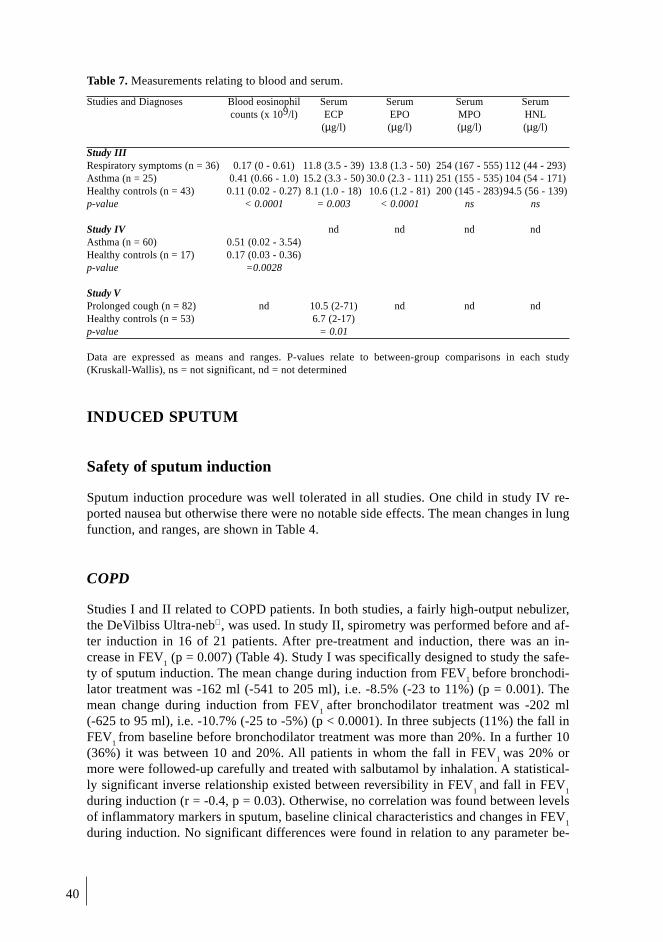
40
Table 7. Measurements relating to blood and serum.
Studies and Diagnoses Blood eosinophil Serum Serum Serum Serumcounts (x 109/l) ECP EPO MPO HNL
(µg/l) (µg/l) (µg/l) (µg/l)
Study IIIRespiratory symptoms (n = 36) 0.17 (0 - 0.61) 11.8 (3.5 - 39) 13.8 (1.3 - 50) 254 (167 - 555) 112 (44 - 293)Asthma (n = 25) 0.41 (0.66 - 1.0) 15.2 (3.3 - 50) 30.0 (2.3 - 111) 251 (155 - 535) 104 (54 - 171)Healthy controls (n = 43) 0.11 (0.02 - 0.27) 8.1 (1.0 - 18) 10.6 (1.2 - 81) 200 (145 - 283)94.5 (56 - 139)p-value < 0.0001 = 0.003 < 0.0001 ns ns
Study IV nd nd nd ndAsthma (n = 60) 0.51 (0.02 - 3.54)Healthy controls (n = 17) 0.17 (0.03 - 0.36)p-value =0.0028
Study VProlonged cough (n = 82) nd 10.5 (2-71) nd nd ndHealthy controls (n = 53) 6.7 (2-17)p-value = 0.01
Data are expressed as means and ranges. P-values relate to between-group comparisons in each study(Kruskall-Wallis), ns = not significant, nd = not determined
INDUCED SPUTUM
Safety of sputum induction
Sputum induction procedure was well tolerated in all studies. One child in study IV re-ported nausea but otherwise there were no notable side effects. The mean changes in lungfunction, and ranges, are shown in Table 4.
COPD
Studies I and II related to COPD patients. In both studies, a fairly high-output nebulizer,the DeVilbiss Ultra-neb , was used. In study II, spirometry was performed before and af-ter induction in 16 of 21 patients. After pre-treatment and induction, there was an in-crease in FEV
1 (p = 0.007) (Table 4). Study I was specifically designed to study the safe-
ty of sputum induction. The mean change during induction from FEV1 before bronchodi-
lator treatment was -162 ml (-541 to 205 ml), i.e. -8.5% (-23 to 11%) (p = 0.001). Themean change during induction from FEV
1 after bronchodilator treatment was -202 ml
(-625 to 95 ml), i.e. -10.7% (-25 to -5%) (p < 0.0001). In three subjects (11%) the fall inFEV
1 from baseline before bronchodilator treatment was more than 20%. In a further 10
(36%) it was between 10 and 20%. All patients in whom the fall in FEV1
was 20% ormore were followed-up carefully and treated with salbutamol by inhalation. A statistical-ly significant inverse relationship existed between reversibility in FEV
1 and fall in FEV
1
during induction (r = -0.4, p = 0.03). Otherwise, no correlation was found between levelsof inflammatory markers in sputum, baseline clinical characteristics and changes in FEV
1
during induction. No significant differences were found in relation to any parameter be-

41
tween female and male subjects, or between patients on inhaled steroids and steroid-na-ive patients. Three female patients (11%) had FEV
1 values after bronchodilator treatment
of less than 1 l (mean 0.87 l, range 0.81 to 0.94 l, on average 36% of predicted values,range 34 to 38%), and sputum was induced in these patients using only 0.9% saline.Mean changes in FEV
1 in these patients were -60 ml (-118 to 53 ml), i.e. -7.2% (-15 to
7%) from baseline before bronchodilator treatment and -120 ml (-188 to 17 ml), i.e.-13.7% (-20 to 2%) from baseline after bronchodilator treatment.
Asthma
Studies III to V involved patients with asthma (Table 4). Two types of low-output ultra-sonic nebulizers were used, the Omron U1 and Spira Ultra . In study III, there was nopre-treatment. Asthma patients exhibited small but statistically significant (p = 0.007)falls in PEF values during induction. In studies IV and V, pre-treatment was undertaken.No significant fall in PEF values was noted. In study IV, there were weak correlations be-tween percentage change in PEF during sputum induction and mean PEF (% of predict-ed) as recorded by patients at home (r = -0.32, p = 0.03) and variability between morningand evening PEF values (r = 0.35, p = 0.01).
Respiratory symptoms suggestive of asthma, chronic cough, and healthycontrolsStudy III involved patients with respiratory symptoms suggestive of asthma. The low-output nebulizer Spira Ultra was used, with no pre-treatment. Like the patients withasthma proper, patients with respiratory symptoms suggestive of asthma exhibited asmall but statistically significant fall in PEF during induction (p = 0.005). In study V, pa-tients with chronic cough exhibited no fall in PEF values (Table 4). Healthy controlswere included in all but study II. All three types of ultrasonic nebulizer were used. Nosignificant fall in lung function was observed (Table 4).
Success of sputum induction
In studies I, II, III and IV, a sputum sample was considered adequate if squamous epithe-lial cell contamination was less than 80% on MGG-stained cytospin slides (in‘t Veen etal. 1996). In study V smears were examined. A sample was considered adequate andoriginating from the lower airways if it contained macrophages and fewer than 50% ofsquamous epithelial cells. Overall, sputum induction at baseline was successful in 82%of cases. Success rates in individual studies and for different patient groups at baselineare shown in Table 4. In study III, the success rate in patients with respiratory symptomsafter three months of treatment was 87%. After one year it was 81%. In study IV, the suc-cess rate in relation to five-year old children was 67%. It was 75% for six-year old chil-dren, 86% for children from seven to 10 years of age, and 100% for children over 10years of age. After six months of treatment it was 68%, after 18 months 60%. There wasno significant correlation between age and extent of squamous epithelial cell contamina-tion, and there were no significant differences between boys and girls. Success rates didnot differ significantly between different types of nebulizer.
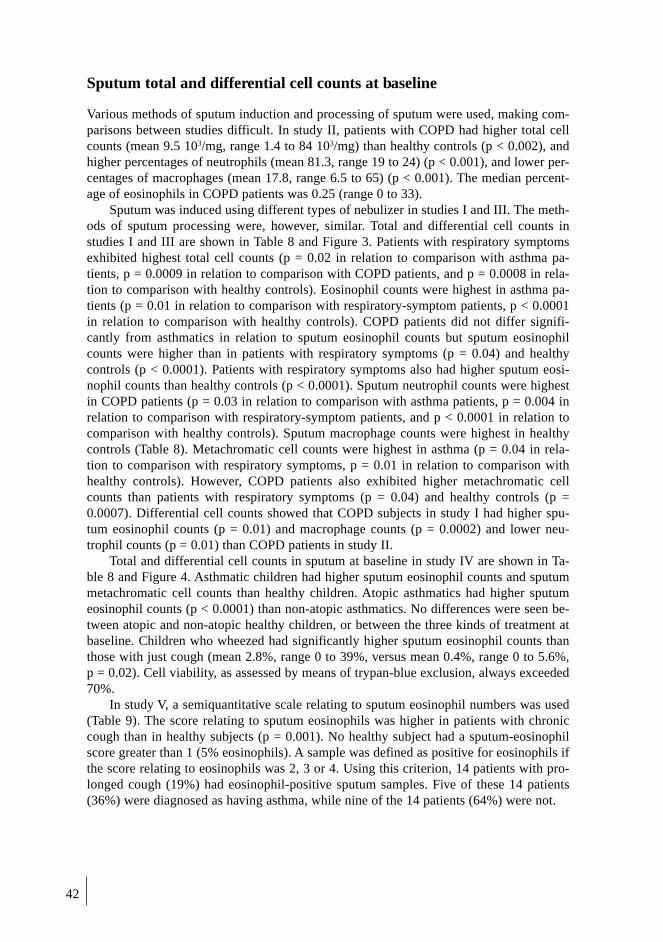
42
Sputum total and differential cell counts at baseline
Various methods of sputum induction and processing of sputum were used, making com-parisons between studies difficult. In study II, patients with COPD had higher total cellcounts (mean 9.5 103/mg, range 1.4 to 84 103/mg) than healthy controls (p < 0.002), andhigher percentages of neutrophils (mean 81.3, range 19 to 24) (p < 0.001), and lower per-centages of macrophages (mean 17.8, range 6.5 to 65) (p < 0.001). The median percent-age of eosinophils in COPD patients was 0.25 (range 0 to 33).
Sputum was induced using different types of nebulizer in studies I and III. The meth-ods of sputum processing were, however, similar. Total and differential cell counts instudies I and III are shown in Table 8 and Figure 3. Patients with respiratory symptomsexhibited highest total cell counts (p = 0.02 in relation to comparison with asthma pa-tients, p = 0.0009 in relation to comparison with COPD patients, and p = 0.0008 in rela-tion to comparison with healthy controls). Eosinophil counts were highest in asthma pa-tients (p = 0.01 in relation to comparison with respiratory-symptom patients, p < 0.0001in relation to comparison with healthy controls). COPD patients did not differ signifi-cantly from asthmatics in relation to sputum eosinophil counts but sputum eosinophilcounts were higher than in patients with respiratory symptoms (p = 0.04) and healthycontrols (p < 0.0001). Patients with respiratory symptoms also had higher sputum eosi-nophil counts than healthy controls (p < 0.0001). Sputum neutrophil counts were highestin COPD patients (p = 0.03 in relation to comparison with asthma patients, p = 0.004 inrelation to comparison with respiratory-symptom patients, and p < 0.0001 in relation tocomparison with healthy controls). Sputum macrophage counts were highest in healthycontrols (Table 8). Metachromatic cell counts were highest in asthma (p = 0.04 in rela-tion to comparison with respiratory symptoms, p = 0.01 in relation to comparison withhealthy controls). However, COPD patients also exhibited higher metachromatic cellcounts than patients with respiratory symptoms (p = 0.04) and healthy controls (p =0.0007). Differential cell counts showed that COPD subjects in study I had higher spu-tum eosinophil counts (p = 0.01) and macrophage counts (p = 0.0002) and lower neu-trophil counts (p = 0.01) than COPD patients in study II.
Total and differential cell counts in sputum at baseline in study IV are shown in Ta-ble 8 and Figure 4. Asthmatic children had higher sputum eosinophil counts and sputummetachromatic cell counts than healthy children. Atopic asthmatics had higher sputumeosinophil counts (p < 0.0001) than non-atopic asthmatics. No differences were seen be-tween atopic and non-atopic healthy children, or between the three kinds of treatment atbaseline. Children who wheezed had significantly higher sputum eosinophil counts thanthose with just cough (mean 2.8%, range 0 to 39%, versus mean 0.4%, range 0 to 5.6%,p = 0.02). Cell viability, as assessed by means of trypan-blue exclusion, always exceeded70%.
In study V, a semiquantitative scale relating to sputum eosinophil numbers was used(Table 9). The score relating to sputum eosinophils was higher in patients with chroniccough than in healthy subjects (p = 0.001). No healthy subject had a sputum-eosinophilscore greater than 1 (5% eosinophils). A sample was defined as positive for eosinophils ifthe score relating to eosinophils was 2, 3 or 4. Using this criterion, 14 patients with pro-longed cough (19%) had eosinophil-positive sputum samples. Five of these 14 patients(36%) were diagnosed as having asthma, while nine of the 14 patients (64%) were not.

43
Tab
le 8
. Spu
tum
mea
sure
men
ts i
n th
e fo
ur a
dult
stu
dy g
roup
s (s
tudi
es I
and
III
) an
d in
chi
ldre
n (s
tudy
IV
).
AD
UL
TS
CH
ILD
RE
N
Res
pira
tory
Hea
lthy
p-va
lue*
Hea
lthy
p-va
lue†
CO
PD
Ast
hma
sym
ptom
spe
rson
sA
sthm
ape
rson
s
(n=
27)
(n=
21)
(n=
34)
(n=
37)
(n=
46)
(n=
17)
Tota
l ce
lls,
(10
6 )0.
28 (
0.04
- 1
2)0.
40 (
0.01
- 3
.6)
0.74
(0.
1 -
27)
0.29
(0.
04 -
4.0
)<
0.00
12.
18 (
0.10
- 4
0)1.
80 (
0.06
- 1
5) n
s
Eos
inop
hils
(%
)1.
7 (0
- 1
1)2.
8 (0
- 9
0)0.
4 (0
- 2
1)0
(0 -
0.9
)<
0.00
011.
1 (0
- 3
9)0
(0 -
0.4
) 0
.000
1
Neu
trop
hils
(%
)60
(38
- 8
9)26
(0
- 82
)35
(0
- 90
)28
(1.
5 -
86)
0.00
0519
(0
- 87
)26
(12
- 8
8) n
s
Lym
phoc
ytes
(%
)0
(0 -
4)
0.3
(0 -
1.9
)0
(0 -
2.9
)0
(0 -
3.6
)ns
0.3
(0 -
2.9
)0
(0 -
1.3
) n
s
Mac
roph
ages
(%
)36
(9.
3 -
62)
32 (
7 -
99)
55 (
10 -
99)
65 (
13 -
98)
0.00
374
(11
- 9
8)72
.3 (
12 -
86)
ns
Epi
thel
ial
cell
s (%
)0
(0 -
16)
0 (0
- 2
0)0
(0 -
10)
0.3
(0 -
47)
0.00
60
(0 -
4)
0.3
(0 -
3.3
) n
s
Met
acro
mat
ic c
ells
(%
)0
(0 -
1)
0 (0
- 4
.2)
0 (0
- 0
.13)
0 (0
- 0
.07)
0.00
50
(0 -
0.6
)0
(0 -
0)
0.0
4
Squ
amou
s ce
lls
(%)
5.5
(0 -
35)
4.6
(0 -
70)
9.4
(0 -
70)
6.3
(0 -
67)
ns22
(0
- 75
)40
(1
- 76
)ns
EC
P (
µg/l
)38
2 (3
6 -
4460
)47
6 (2
3 -
5647
)15
5 (1
1 -
6419
)73
.4 (
18 -
153
0)<
0.00
01-
--
EP
O (
µg/l
)-
30 (
3.2
- 29
27)
15 (
2.5
- 10
04)
4.5
(2.5
- 4
01)
<0.
0001
--
-
MP
O (
µg/l
)96
52 (
531
- 45
540)
72 (
72 -
234
0)72
(72
- 1
359)
72 (
72 -
103
)<
0.00
01-
--
HN
L (
mg/
l)-
6.6
(1.2
- 2
3)6.
4 (0
.8 -
76)
4.0
(0.8
- 2
1)ns
--
-D
ata
are
expr
esse
d as
med
ians
and
ran
ge ,
*p-v
alue
bet
wee
n al
l ad
ult
grou
ps, K
rusk
al-W
alli
s te
st, †
p-va
lue
betw
een
the
two
chil
dren
gro
ups,
Man
n-W
hitn
ey U
- te
st,
-=no
t de
term
ined
, ns=
not
sign
ific
ant
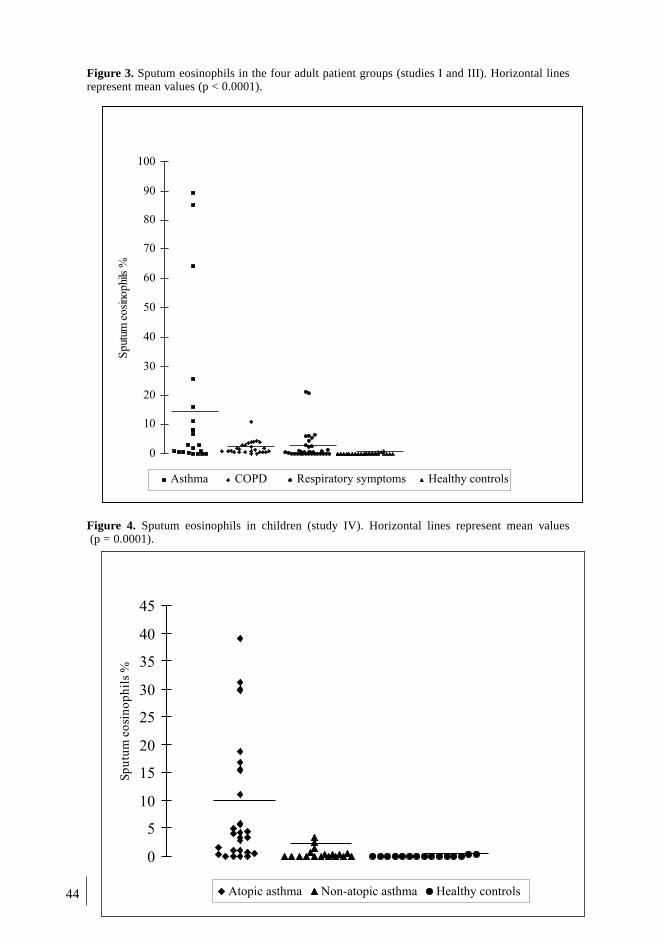
44
Figure 3. Sputum eosinophils in the four adult patient groups (studies I and III). Horizontal linesrepresent mean values (p < 0.0001).
Figure 4. Sputum eosinophils in children (study IV). Horizontal lines represent mean values (p = 0.0001).
0
10
20
30
40
50
60
70
80
90
100
Sput
umeo
sino
phi
ls%
Asthma COPD Respiratory symptoms Healthy controls
0
5
10
15
20
25
30
35
40
45
Sp
utu
meo
sin
op
hil
s%
Atopic asthma Non-atopic asthma Healthy controls
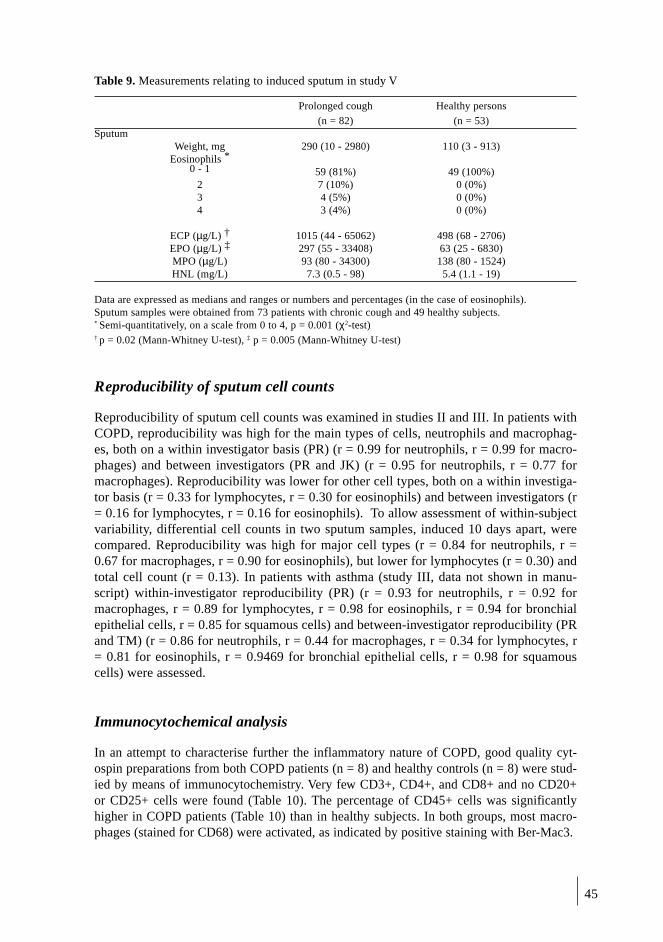
45
Table 9. Measurements relating to induced sputum in study V
Prolonged cough Healthy persons
(n = 82) (n = 53)Sputum
Weight, mg 290 (10 - 2980) 110 (3 - 913)Eosinophils *
0 - 1 59 (81%) 49 (100%)2 7 (10%) 0 (0%)3 4 (5%) 0 (0%)4 3 (4%) 0 (0%)
ECP (µg/L) † 1015 (44 - 65062) 498 (68 - 2706)EPO (µg/L) ‡ 297 (55 - 33408) 63 (25 - 6830)MPO (µg/L) 93 (80 - 34300) 138 (80 - 1524)HNL (mg/L) 7.3 (0.5 - 98) 5.4 (1.1 - 19)
Data are expressed as medians and ranges or numbers and percentages (in the case of eosinophils).Sputum samples were obtained from 73 patients with chronic cough and 49 healthy subjects.* Semi-quantitatively, on a scale from 0 to 4, p = 0.001 (χ2-test)† p = 0.02 (Mann-Whitney U-test), ‡ p = 0.005 (Mann-Whitney U-test)
Reproducibility of sputum cell counts
Reproducibility of sputum cell counts was examined in studies II and III. In patients withCOPD, reproducibility was high for the main types of cells, neutrophils and macrophag-es, both on a within investigator basis (PR) (r = 0.99 for neutrophils, r = 0.99 for macro-phages) and between investigators (PR and JK) (r = 0.95 for neutrophils, r = 0.77 formacrophages). Reproducibility was lower for other cell types, both on a within investiga-tor basis (r = 0.33 for lymphocytes, r = 0.30 for eosinophils) and between investigators (r= 0.16 for lymphocytes, r = 0.16 for eosinophils). To allow assessment of within-subjectvariability, differential cell counts in two sputum samples, induced 10 days apart, werecompared. Reproducibility was high for major cell types (r = 0.84 for neutrophils, r =0.67 for macrophages, r = 0.90 for eosinophils), but lower for lymphocytes (r = 0.30) andtotal cell count (r = 0.13). In patients with asthma (study III, data not shown in manu-script) within-investigator reproducibility (PR) (r = 0.93 for neutrophils, r = 0.92 formacrophages, r = 0.89 for lymphocytes, r = 0.98 for eosinophils, r = 0.94 for bronchialepithelial cells, r = 0.85 for squamous cells) and between-investigator reproducibility (PRand TM) (r = 0.86 for neutrophils, r = 0.44 for macrophages, r = 0.34 for lymphocytes, r= 0.81 for eosinophils, r = 0.9469 for bronchial epithelial cells, r = 0.98 for squamouscells) were assessed.
Immunocytochemical analysis
In an attempt to characterise further the inflammatory nature of COPD, good quality cyt-ospin preparations from both COPD patients (n = 8) and healthy controls (n = 8) were stud-ied by means of immunocytochemistry. Very few CD3+, CD4+, and CD8+ and no CD20+or CD25+ cells were found (Table 10). The percentage of CD45+ cells was significantlyhigher in COPD patients (Table 10) than in healthy subjects. In both groups, most macro-phages (stained for CD68) were activated, as indicated by positive staining with Ber-Mac3.

46
Table 10. Cell-surface markers in induced sputum in study II.
Parameter COPD patients Healthy subjectsCD3 (%) 1.8 ± 0.7 2.1 ± 0.5CD4 (%) 0.1 ± 0.1 2.1 ± 0.2CD8 (%) 0.3 ± 0.1 0.4 ± 0.2CD45 (%)* 80.5 ± 5.5 52.6 ± 6.1CD68(%)* 17.9 ± 4.8 71.2 ± 4.5Ber-Mac3 (%) 10.1 ± 2.2 47.4 ± 7.4
Ber-Mac3/CD68 56 66
Values are expressed as means ± SEMs, n = 8 for both groups, calculated as percentages of non-squamouscells. Percentages of activated macrophages are expressed in relation to total numbers of macrophages.
* p < 0.05 Mann-Whitney U-test
Sputum fluid-phase measurements
Results of fluid-phase measurements in studies I and III are shown in Table 8. ECP valueswere highest in asthma patients (p = 0.002 in comparison with healthy controls). COPD pa-tients also had high ECP values (p < 0.0001 in comparison with healthy controls). Bothasthmatics and patients with respiratory symptoms had higher sputum EPO levels thanhealthy controls (p < 0.0001) but they did not differ significantly from each other. MPO val-ues were highest in COPD patients (p < 0.0001 in comparison with all other groups).
In study V, sputum EPO and ECP levels were higher in patients with prolongedcough than in healthy subjects (Table 9). Values for the sputum neutrophil markers MPOand HNL were not significantly different between patients and controls. There were nosignificant differences in levels of inflammatory markers between smokers and non-smokers or atopic and non-atopic subjects in any group. If smokers were excluded fromthe analysis differences were essentially unaffected.
Normal values for inflammatory markers: sensitivity and specificity
In study III, the normal upper limit (mean + 3 SD) for percentage of sputum eosinophils(0.7) was calculated on the basis of values in sputum from healthy subjects. Fourteenasthma patients (67%) who produced samples for sputum analysis exhibited high per-centages of sputum eosinophils, as opposed to 13 patients with respiratory symptoms(38%) and one healthy subject (3%). Receiver operating characteristic curves for percent-ages of eosinophils, and ECP and EPO levels in sputum and blood were examined. Areasunder curves relating to each test revealed that percentage of sputum eosinophils (AUC0.88) was the most sensitive and specific marker in the case of asthmatics. AUCs for oth-er markers were Ex-EPO 0.87, B-eos 0.84, S-EPO 0.83, S-ECP 0.76, and Ex-ECP 0.75.In patients with respiratory symptoms the best marker was sputum EPO level (AUC0.80). AUCs for other markers were Ex-eos 0.67, S-EPO 0.67, B-eos 0.66, ex-ECP 0.61,and S-ECP 0.58. None of the differences were statistically significant, however.
In study IV, the upper reference limit in healthy subjects for blood eosinophils was0.35 x 109/l, for the percentage of eosinophils in sputum 0.31. On the basis of these val-ues the sensitivity of determination of blood eosinophils for diagnosis of asthma was42% and the specificity was 93%. The corresponding figures relating to determination ofsputum eosinophils were 70% and 88% (Table 11). ROC curves relating to blood andsputum eosinophil determinations were examined. AUCs relating to sputum eosinophildetermination (0.77) and blood eosinophil determinations (0.76) were similar.
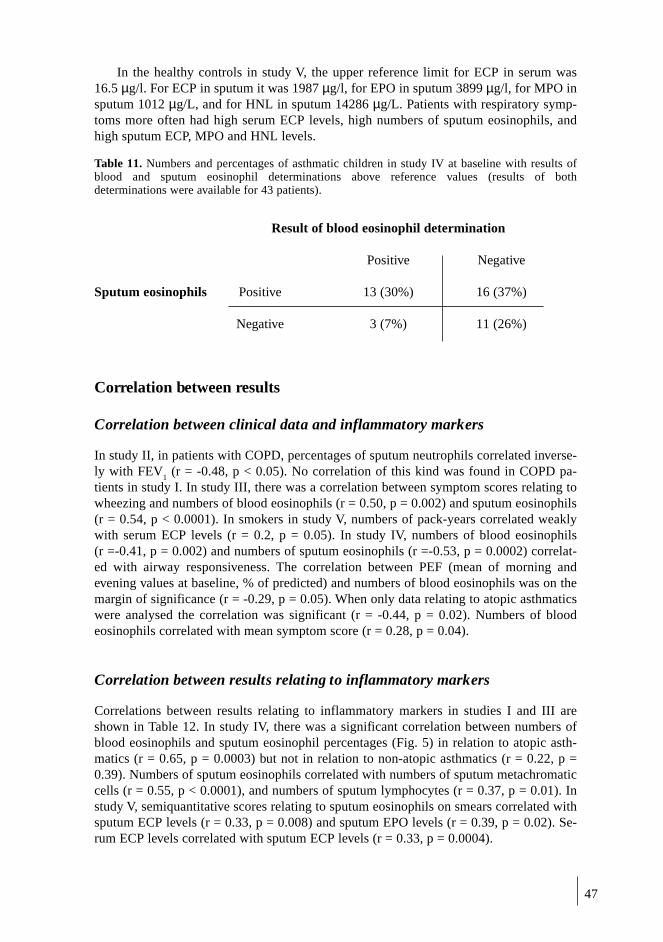
47
In the healthy controls in study V, the upper reference limit for ECP in serum was16.5 µg/l. For ECP in sputum it was 1987 µg/l, for EPO in sputum 3899 µg/l, for MPO insputum 1012 µg/L, and for HNL in sputum 14286 µg/L. Patients with respiratory symp-toms more often had high serum ECP levels, high numbers of sputum eosinophils, andhigh sputum ECP, MPO and HNL levels.
Table 11. Numbers and percentages of asthmatic children in study IV at baseline with results ofblood and sputum eosinophil determinations above reference values (results of bothdeterminations were available for 43 patients).
Result of blood eosinophil determination
Positive Negative
Sputum eosinophils Positive 13 (30%) 16 (37%)
Negative 3 (7%) 11 (26%)
Correlation between results
Correlation between clinical data and inflammatory markers
In study II, in patients with COPD, percentages of sputum neutrophils correlated inverse-ly with FEV
1 (r = -0.48, p < 0.05). No correlation of this kind was found in COPD pa-
tients in study I. In study III, there was a correlation between symptom scores relating towheezing and numbers of blood eosinophils (r = 0.50, p = 0.002) and sputum eosinophils(r = 0.54, p < 0.0001). In smokers in study V, numbers of pack-years correlated weaklywith serum ECP levels (r = 0.2, p = 0.05). In study IV, numbers of blood eosinophils(r =-0.41, p = 0.002) and numbers of sputum eosinophils (r =-0.53, p = 0.0002) correlat-ed with airway responsiveness. The correlation between PEF (mean of morning andevening values at baseline, % of predicted) and numbers of blood eosinophils was on themargin of significance (r = -0.29, p = 0.05). When only data relating to atopic asthmaticswere analysed the correlation was significant (r = -0.44, p = 0.02). Numbers of bloodeosinophils correlated with mean symptom score (r = 0.28, p = 0.04).
Correlation between results relating to inflammatory markers
Correlations between results relating to inflammatory markers in studies I and III areshown in Table 12. In study IV, there was a significant correlation between numbers ofblood eosinophils and sputum eosinophil percentages (Fig. 5) in relation to atopic asth-matics (r = 0.65, p = 0.0003) but not in relation to non-atopic asthmatics (r = 0.22, p =0.39). Numbers of sputum eosinophils correlated with numbers of sputum metachromaticcells (r = 0.55, p < 0.0001), and numbers of sputum lymphocytes (r = 0.37, p = 0.01). Instudy V, semiquantitative scores relating to sputum eosinophils on smears correlated withsputum ECP levels (r = 0.33, p = 0.008) and sputum EPO levels (r = 0.39, p = 0.02). Se-rum ECP levels correlated with sputum ECP levels (r = 0.33, p = 0.0004).

48
Tab
le 1
2. C
orre
lati
ons
betw
een
diff
eren
t in
flam
mat
ory
mar
kers
in
stud
ies
I an
d II
I.S-
EC
PS-
EP
OE
x-eo
sE
x-E
CP
Ex-
EP
OE
x-ne
utro
Ex-
MP
OE
x-H
NL
B-e
osC
: -
C:
-C
: -
nsns
nsns
nsA
: r=
0.45
, p=
0.03
A:
r=0.
84, p
<0.
001
A:
r=0.
52, p
=0.
02R
: ns
R:
r=0.
50, p
=0.
005
R:
r=0.
56, p
=0.
0008
H:
r=0.
40, p
=0.
01H
: r=
0.64
, p<
0.00
01H
:ns
AL
L:
AL
L:
AL
L:
r=0.
49, p
<0.
0001
r=0.
74, p
<0.
0001
r=0.
59, p
<0.
0001
S-E
CP
C:
-C
: -
nsns
nsns
nsA
: r=
0.63
, p=
0.00
2A
: ns
R:
r=0.
61, p
=0.
004
R:
nsH
: r=
0.69
, p<
0.00
01H
: ns
AL
L:
AL
L:
r=0.
89, p
<0.
0001
r=0.
30, p
=0.
007
S-E
PO
C:
-ns
C:
-ns
nsns
A:
r=0.
53, p
=0.
02A
: ns
R:
nsR
: ns
H:
nsH
: ns
AL
L:
AL
L:
r=0.
45, p
<0.
0001
r=0.
35, p
=0.
001
Ex-
eos
C:n
sC
:ns
ns n
sns
A:
r=0.
87, p
<0.
0001
A:
r=0.
57, p
=0.
01R
: ns
R:
nsH
: ns
H:
nsA
LL
:A
LL
:r=
0.43
, p<
0.00
01r=
0.50
, p<
0.00
01E
x-E
CP
C:
-C
: r=
0.43
, p=
0.03
C:
r=0.
82, p
<0.
0001
C:
-A
: r=
0.63
, p=
0.00
2A
: ns
A:
nsA
: ns
R:
r=0.
70, p
<0.
0001
R:
r=0.
51, p
=0.
002
R:
r=0.
42, p
=0.
02R
: r=
0.84
, p<
0.00
01H
: ns
H:
r=0.
53, p
=0.
001
H:
nsH
: r=
0.53
, p=
0.00
1A
LL
:A
LL
:A
LL
:A
LL
:r=
0.63
, p<
0.00
01r=
0.48
, p<
0.00
01r=
0.61
, p<
0.00
01r=
0.61
, p<
0.00
01E
x-E
PO
nsC
: -
C:
-A
: ns
A:
nsR
: ns
R:
nsH
: ns
H:
nsA
LL
:A
LL
:r=
0.52
8, p
=0.
0003
r=0.
28, p
=0.
01E
x-C
: r=
0.43
, p=
0.03
C:
-ne
utro
A:
nsA
: ns
R:
nsR
: r=
0.62
, p=
0.00
06H
: ns
H:
r=0.
60, p
=0.
0002
AL
L:
AL
L:
r=0.
47, p
<0.
0001
r=0.
54, p
<0.
0001
Ex-
C:
-M
PO
A:
nsR
: ns
H:
nsA
LL
:r=
0.29
, p=
0.05
C =
CO
PD
, A =
ast
hma,
R =
pat
ient
s w
ith
resp
irat
ory
sym
ptom
s, H
= h
ealt
hy c
ontr
ols,
r =
Spe
arm
an r
ank
corr
elat
ion,
- =
not
det
erm
ined
, ns=
not
sig
nifi
cant

49
Fig. 5. Correlation between numbers of blood eosinophils and numbers of sputum eosinophils inasthmatic children at baseline (study IV), r = 0.56, p < 0.0001.
TREATMENT EFFECT
Study III : Follow-up in patients with respiratory symptoms
Of the 36 patients with respiratory symptoms, 31 (86%) were re-examined at threemonths and one year. Four of the five patients unavailable for re-examination had re-ceived placebo.
At three months, cough and total symptom scores, and numbers of blood eosinophilsin the BDP-treated group had decreased significantly from baseline (Fig. 6). In the place-bo-treated group only total symptom score had decreased significantly. Cough score de-creased to a significantly greater extent in the BDP-treated group than in the placebo-treated group (p < 0.05).
After one year, 17 of 31 patients with respiratory symptoms (55%) continued to ex-hibit symptoms but have normal lung function. Four patients (13%), two in the BDPgroup and two in the placebo group, had developed asthma. Another 10 (32%), six in theBDP and four in the placebo group, were free from symptoms, i.e. they did not meet thecriteria relating to symptoms. In the BDP-treated group total symptom score had de-creased from 9.9 to 5.7, in the placebo group from 11.8 to 7.0. Two of the patients (bothin the placebo group) who had developed asthma had received treatment with inhaledsteroid after the first three-month period and were omitted from the one-year analysis. Atone year, the mean percentage of eosinophils in sputum had decreased in the BDP-treatedgroup from 3.0 at baseline to 1.3, in the placebo group from 2.3 at baseline to 0.3 (Fig.6). Of the 29 patients that were included in one-year analysis, 11 of those 28 with ade-quate sputum sample (39%) had increased sputum eosinophils at the start of the study. At
0
0,2
0,4
0,6
0,8
1
1,2
1,4
1,6
1,8
2
0 10 20 30 40
Sputum eosinophils (%)
Blo
od
eosi
no
ph
ils
x1
09
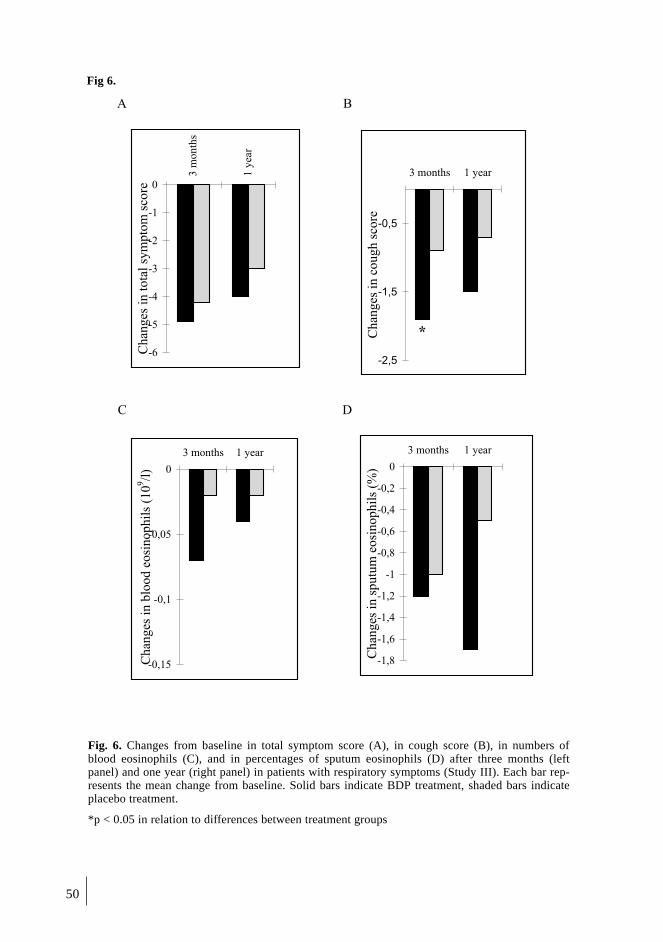
50
Fig 6.
A B
C D
-2,5
-1,5
-0,5
3 months 1 year
Chan
ges
inco
ugh
score
*
-0,15
-0,1
-0,05
0
3 months 1 year
Ch
ang
esin
blo
od
eosi
no
ph
ils
(10
9/l
)
-1,8
-1,6
-1,4
-1,2
-1
-0,8
-0,6
-0,4
-0,2
0
3 months 1 year
Chan
ges
insp
utu
meo
sinophil
s(%
)
-6
-5
-4
-3
-2
-1
03
mo
nth
s
1y
ear
Chan
ges
into
tal
sym
pto
msc
ore
Fig. 6. Changes from baseline in total symptom score (A), in cough score (B), in numbers ofblood eosinophils (C), and in percentages of sputum eosinophils (D) after three months (leftpanel) and one year (right panel) in patients with respiratory symptoms (Study III). Each bar rep-resents the mean change from baseline. Solid bars indicate BDP treatment, shaded bars indicateplacebo treatment.
*p < 0.05 in relation to differences between treatment groups

51
one year, in 50% of them eosinophils persisted. Of the 17 patients (61%) that had no spu-tum eosinophils at the first examination, 33% showed sputum eosinophils at one year.
Study IV
Six months of treatment
After six months of treatment with budesonide, children had significantly fewer exacer-bations than those treated with cromoglycate (p < 0.01, Table 13). FEV
1 had improved in
both groups but only in the budesonide group was the predicted change from baseline interms of percentage of predicted FEV
1 (with adjustment for child’s height) significant.
Symptoms (p < 0.001) and use of rescue medication (p < 0.01) decreased significantlyfrom baseline in the budesonide-treated groups (Table 13).
At six months, adequate sputum samples were obtained from 41/60 children (68%).Representative samples at both baseline and six months were obtained from 34 children(23 in the two budesonide groups, 11 in the cromoglycate group). Numbers of sputumeosinophils decreased significantly in the budesonide groups (p = 0.003), but not in thecromoglycate group (Table 13). Numbers of blood eosinophils and of sputum cells otherthan eosinophils did not change significantly in any group. The three children who hadhad more than 10% of eosinophils in sputum at baseline in the cromoglycate group expe-rienced three, four and four exacerbations over the six-month period, and therefore re-ceived treatment with budesonide by inhalation for about two months. Of the five pa-tients with high percentages (> 10) of eosinophils in sputum in the budesonide groups,one experienced one exacerbation during the months of treatment, the others none.
Eighteen months of treatment
After 18 months of treatment, the number of exacerbations was highest in the cromogly-cate group (Table 13), significantly different from the number in the group that had re-ceived regular treatment with budesonide at low doses (p < 0.05). No subject in the lattergroup had to withdraw from the study because of hospitalisation as a result of asthma.Two children in the placebo group, in which budesonide was used only during exacerba-tions, were hospitalised between six and 18 months of treatment, and three children inthe cromoglycate group.
FEV1 had improved in all groups but only in the group that had received regular
treatment with budesonide was the change from baseline in terms of percentage of pre-dicted FEV
1 significant (p = 0.02, Table 13). Symptoms and use of rescue medication had
decreased in all groups in comparison with baseline but not in comparison with findingsat six months. Hyperresponsiveness to histamine did not decrease in any group in com-parison with baseline.
At 18 months, adequate sputum samples were obtained from 36/60 children (60%).Representative samples at both baseline and 18 months were obtained from 32 children(10 in the group treated regularly with budesonide, 12 in the group that received budeso-nide during exacerbations, and 10 in the cromoglycate group). Numbers of blood eosi-nophils and differential counts of sputum cells were not significantly different from thoseat baseline or six months (Table 13).
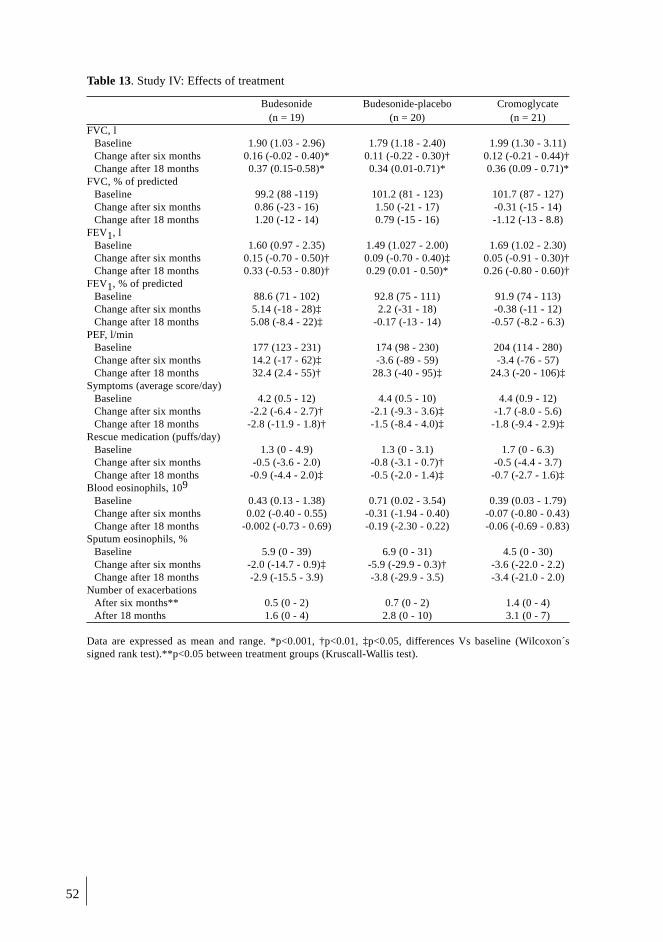
52
Table 13. Study IV: Effects of treatment
Budesonide Budesonide-placebo Cromoglycate(n = 19) (n = 20) (n = 21)
FVC, lBaseline 1.90 (1.03 - 2.96) 1.79 (1.18 - 2.40) 1.99 (1.30 - 3.11)Change after six months 0.16 (-0.02 - 0.40)* 0.11 (-0.22 - 0.30)† 0.12 (-0.21 - 0.44)†Change after 18 months 0.37 (0.15-0.58)* 0.34 (0.01-0.71)* 0.36 (0.09 - 0.71)*
FVC, % of predictedBaseline 99.2 (88 -119) 101.2 (81 - 123) 101.7 (87 - 127)Change after six months 0.86 (-23 - 16) 1.50 (-21 - 17) -0.31 (-15 - 14)Change after 18 months 1.20 (-12 - 14) 0.79 (-15 - 16) -1.12 (-13 - 8.8)
FEV1, lBaseline 1.60 (0.97 - 2.35) 1.49 (1.027 - 2.00) 1.69 (1.02 - 2.30)Change after six months 0.15 (-0.70 - 0.50)† 0.09 (-0.70 - 0.40)‡ 0.05 (-0.91 - 0.30)†Change after 18 months 0.33 (-0.53 - 0.80)† 0.29 (0.01 - 0.50)* 0.26 (-0.80 - 0.60)†
FEV1, % of predictedBaseline 88.6 (71 - 102) 92.8 (75 - 111) 91.9 (74 - 113)Change after six months 5.14 (-18 - 28)‡ 2.2 (-31 - 18) -0.38 (-11 - 12)Change after 18 months 5.08 (-8.4 - 22)‡ -0.17 (-13 - 14) -0.57 (-8.2 - 6.3)
PEF, l/minBaseline 177 (123 - 231) 174 (98 - 230) 204 (114 - 280)Change after six months 14.2 (-17 - 62)‡ -3.6 (-89 - 59) -3.4 (-76 - 57)Change after 18 months 32.4 (2.4 - 55)† 28.3 (-40 - 95)‡ 24.3 (-20 - 106)‡
Symptoms (average score/day)Baseline 4.2 (0.5 - 12) 4.4 (0.5 - 10) 4.4 (0.9 - 12)Change after six months -2.2 (-6.4 - 2.7)† -2.1 (-9.3 - 3.6)‡ -1.7 (-8.0 - 5.6)Change after 18 months -2.8 (-11.9 - 1.8)† -1.5 (-8.4 - 4.0)‡ -1.8 (-9.4 - 2.9)‡
Rescue medication (puffs/day)Baseline 1.3 (0 - 4.9) 1.3 (0 - 3.1) 1.7 (0 - 6.3)Change after six months -0.5 (-3.6 - 2.0) -0.8 (-3.1 - 0.7)† -0.5 (-4.4 - 3.7)Change after 18 months -0.9 (-4.4 - 2.0)‡ -0.5 (-2.0 - 1.4)‡ -0.7 (-2.7 - 1.6)‡
Blood eosinophils, 109
Baseline 0.43 (0.13 - 1.38) 0.71 (0.02 - 3.54) 0.39 (0.03 - 1.79)Change after six months 0.02 (-0.40 - 0.55) -0.31 (-1.94 - 0.40) -0.07 (-0.80 - 0.43)Change after 18 months -0.002 (-0.73 - 0.69) -0.19 (-2.30 - 0.22) -0.06 (-0.69 - 0.83)
Sputum eosinophils, %Baseline 5.9 (0 - 39) 6.9 (0 - 31) 4.5 (0 - 30)Change after six months -2.0 (-14.7 - 0.9)‡ -5.9 (-29.9 - 0.3)† -3.6 (-22.0 - 2.2)Change after 18 months -2.9 (-15.5 - 3.9) -3.8 (-29.9 - 3.5) -3.4 (-21.0 - 2.0)
Number of exacerbationsAfter six months** 0.5 (0 - 2) 0.7 (0 - 2) 1.4 (0 - 4)After 18 months 1.6 (0 - 4) 2.8 (0 - 10) 3.1 (0 - 7)
Data are expressed as mean and range. *p<0.001, †p<0.01, ‡p<0.05, differences Vs baseline (Wilcoxon´ssigned rank test).**p<0.05 between treatment groups (Kruscall-Wallis test).

53
DISCUSSION
STUDY POPULATIONS AND METHODS
Clinical characteristics of subjects
We used internationally accepted criteria to select COPD and asthma patients (ATS 1995,NHBI 1997, Warner et al. 1998). These criteria are based on findings relating to symp-toms and results of lung-function measurements. In the case of patients with chronic res-piratory symptoms suggestive of asthma, the criteria for inclusion were symptoms thatmade the clinician suspect asthma even though lung function did not meet the criteria al-lowing a diagnosis of asthma. It could be argued that the patients classed as sufferingfrom respiratory symptoms were in fact suffering from mild asthma. Diagnosis of mildasthma can be difficult, since results of measurements of lung function can remain nor-mal for long periods, or may be conflicting (Siersted et al. 1996). To exclude asthmaticsfrom the group of patients classed as suffering from respiratory symptoms, low PEF andFEV
1 variability criteria (12%) and absence of increased bronchial responsiveness were
used. In patients diagnosed as suffering from respiratory symptoms, FEV1 increased on
average by only 2.5% 15 minutes after inhaling salbutamol in the bronchodilatation test.Mean variability between morning and evening was 5.2% during PEF monitoring, and noincreased responsiveness to inhaled histamine was detected.
In study V, on the basis of results of clinical examinations and lung-function tests, 13of 82 patients with persistent cough (16%) were diagnosed for the first time as sufferingfrom asthma. However, since no PEF follow-up or spirometry was undertaken in 15 sub-jects, the possibility cannot be excluded that some of these subjects would have met thecriteria for asthma. The incidence of asthma may therefore have been slightly underesti-mated. Taking into account the prevalence of asthma in the study population that under-went lung-function testing, two or three subjects with asthma might have been missed.Lung function was however tested in all patients with eosinophilic airway inflammation.Since the study was carried out in patients attending for primary care, airway responsive-ness could not be measured, nor could gastroscopy with 24-hour pH measurement be un-dertaken (McGarvey et al. 1999).
All of the COPD patients were previous or current smokers. Mean pack-years were 52and 37 in studies I and II, respectively. Most COPD patients were male. Smoking has beenfound to be commoner in men than in women in both Belgium and Finland. COPD patientswere also significantly older than the patients in the other groups. In study II, the healthycontrols were matched for sex but not for age. We found no correlation between age and re-sults of any measurements made. In the other studies, age- and sex-matching of patients andcontrols were better. In study IV, the control children were slightly older than the asthmaticchildren. This is one reason why the success rate in relation to induction of sputum produc-tion was better in the healthy controls than in the asthmatic children.
No differences were found between smokers and non-smokers in any other diseasegroups or in the healthy controls. Numbers of pack-years in relation to these subjectswere significantly lower than numbers for the COPD patients, and none of the smokers instudies III and V were diagnosed (on the basis of results relating to lung function and du-ration of symptoms) as suffering from chronic bronchitis or COPD (ATS 1995).
54
Sputum induction
Safety
One of the aims of the studies reported here was to assess the safety of sputum induction,especially in patients with COPD. In study I, the mean fall in FEV
1 during induction from
baseline before bronchodilator administration was 8.5%, that from baseline after bron-chodilator administration 10.7%. In study II, there were no falls in lung function duringsputum induction. In both studies all patients tolerated the procedure for induction ofsputum production well. No major side effects were reported but airway obstruction oc-curred as a result of the induction procedure. Similar high-output nebulizers and similarconcentrations of hypertonic saline were used in the two studies. In study II, subjectswere pre-treated with 400 µg of inhaled salbutamol. In study I, 200 µg of inhaled salb-utamol were used. Baseline lung function in the COPD patients was similar in both stud-ies. However, in study II all patients except one were treated with inhaled steroids. Onlyfour of the patients (14%) in study I were treated in this way. All patients in the secondstudy were former smokers. Only two patients in study I had stopped smoking. These dif-ferences could partly explain the different responses in the two studies. It is not clearwhether extent of bronchial obstruction depends on the amount of expectorate, the degreeof hypertonicity of the inhaled saline, the total amount inhaled or the rate of delivery, orif bronchconstriction could be prevented by pre-treatment with higher doses of inhaledsalbutamol (Popov et al. 1995, Bacchi et al. 1997, Pavord 1998).
Pre-treatment with a bronchodilator did not prevent declines in FEV1, especially in
COPD patients with little or no FEV1 reversibility. Falls in FEV
1 during sputum induction
correlated inversely with degree of reversibility in FEV1. This indicates that COPD pa-
tients with appreciable FEV1 reversibility may gain most from bronchodilator treatment
to prevent bronchoconstriction. Airway hyperreactivity and reversibility of airway ob-struction are thought to be characteristic of asthma but can also be present in COPD. In-creased airway responsiveness in smokers is a risk factor for accelerated decline in FEV
1
with time, and hence for development of COPD (Ricjken et al. 1995). Disease severity asassessed by symptom scores or results of lung-function measurements was not associatedwith severity of bronchoconstriction. No correlations were found between degrees ofneutrophilic or eosinophilic airway inflammation and falls in FEV
1 during induction.
Our results relating to safety of sputum induction in COPD patients are similar to re-sults reported by others. Keatings et al. (1996) found a small but statistically significantfall in FEV
1 during induction in 17 COPD patients. Maestrelli et al. (1996) studied 33 pa-
tients with at least 10 pack-years of smoking history, 14 of whom exhibited airway ob-struction. Falls in FEV
1 of more than 20% were detected in only two subjects following
inhalation of hypertonic saline. In a study by Bhowmik et al. (2000) in 27 COPD patientsa mean fall of 11.7% in FEV
1 was found
during induction. Only one patient experienced a
fall in FEV1 of more than 20%.
In study III, sputum production was induced without pre-treatment in patients withasthma or chronic respiratory symptoms suggestive of asthma. In these patients therewere also small falls in lung function during sputum induction. The greatest fall in PEFwas 17%. De la Fuente et al. (1998) found sputum induction to be safe even in patientswith uncontrolled asthma, with falls in FEV
1 that never exceeded 20%. However, the pro-
cedure had to be stopped in 23% of cases because of the patients reporting side effects.Changes in FEV
1 were significantly more marked in patients with severe asthma than in
those less affected but there was no association between extent of control of the disease

55
and poor tolerance of the procedure. In a study by Wong et al. (1997) 78 asthmatics withbaseline FEV
1 after bronchodilator administration of more than 60% of predicted FEV
1
were studied. Fourteen per cent exhibited bronchocontriction of more than 20%, another8% falls of 10 to 20%. The greatest fall in FEV
1 in their study was 69%. Changes in
FEV1 during sputum induction correlated significantly with baseline lung function and
percentages of eosinophils in induced sputum. In a study by Hunter et al. (1999), a low-output ultrasonic nebulizer was used by 79 patients. A fall of 20% was seen in only threesubjects. In a later study by ten Brinke et al. (2001) it was shown that additional use ofshort-acting β
2-agonist as rescue medication during the days preceding sputum induction
increase the risk for bronchoconstriction.In all of these previous studies on the safety of sputum induction in adult asthmatics
pre-treatment with a bronchodilator was used. We did not treat before induction becausewe were studying patients with mild or moderate asthma (FEV
1 more than 57% in all pa-
tients, mean 79%). The fact that significant falls in lung function occurred during induc-tion of sputum even in mild disease highlights the importance of pre-treatment and moni-toring of lung function during induction.
Sputum induction was found to be safe when asthmatic children were pre-treatedwith a β
2-agonist. This had previously been demonstrated in adolescents with severe sta-
ble asthma (Grootendors et al. 1999), even in acute childhood asthma (Gibson et al.1999, Cai et al. 1998). Like Grootendors et al., we found a weak correlation betweenbaseline PEF values and PEF change during sputum induction. Sputum induction hasbeen shown to be safe in children with cystic fibrosis (De Boeck et al. 2000). When in-ducing sputum in children, those concerned should have experience of evaluation of lungfunction, and of identification and management of adverse effects.
Success of sputum induction
The overall baseline success rate of 82% is similar to rates reported by others (Pizzichiniet al. 1996a, int´Veen et al. 1996, Belda et al. 2000, Spavenello et al. 2000). It was lowerafter anti-inflammatory treatment. In primary care, the rate of success in obtaining ade-quate sputum samples was high (91%).
Sputum production has previously been induced mainly in children of six or moreyears of age. We included 15 five-year-old children. Ten of them (67%) produced ade-quate sputum samples. Success rate improved with age. It was 77% for the entire groupat baseline, 68% after six months of treatment and 60% after 18 months of treatment.These rates are slightly better than rates reported by others in children on asthma medica-tion (Wilson et al. 2000).
Sputum processing
Various sputum-processing methods were used in the studies described in this thesis. Themain difference related to selection of sputum masses from saliva as opposed to use ofentire expectorates. Selection of sputum results in squamous cell contamination beingless than that found when whole expectorate is used. In consequence, cell counting iseasier and quicker. Slides prepared from selected masses of sputum are, for example, bet-ter suited to immunocytochemical analysis than slides prepared from entire expectorate.

56
Concentrations of substances in the fluid phase are unaffected by the presence of saliva,and accurate correction for dilution is possible. A disadvantage is that selection takestime. Use of entire expectorate is quicker. We used selection in every study except studyIV. The latter was a longitudinal study to assess the effects of various anti-inflammatorytreatment strategies in children with asthma over 18-month periods. We felt it would bedifficult to select sputum after effective treatment over such a lengthy period. Contamina-tion of sputum with squamous epithelial cells was relatively high. The reproducibility ofsputum cell counts was high in all patient groups using the selection method.
Recently, reference values for sputum differential cell counts in sputum selectedfrom saliva have been published (Belda et al. 2000, Spavenello et al. 2000). Induced spu-tum samples from more than 200 control subjects in the studies mentioned were rich inmacrophages and neutrophils, poor in eosinophils, lymphocytes, metachromatic cells andbronchial epithelial cells. Percentages of various types of cells were similar to thosefound in our control groups.
INFLAMMATORY MARKERS
COPD
Differential cell counts relating to COPD patients revealed very high numbers of neu-trophils and high concentrations of MPO compared to those relating to other patientgroups and healthy controls. Our findings are in line with previous findings of high per-centages of intraluminal neutrophils (Thompson et al. 1989). It has been shown in studiesconducted using BAL that this neutrophilia increases significantly with severity of air-way obstruction (Martin et al. 1985, Linden at al. 1993). This observation is in agreementwith our finding of an inverse correlation between percentages of neutrophils in inducedsputum and findings relating to FEV
1 (study II). Similar results have been published by
others (Keatings et al. 1996, Balzano et al. 1999). However, findings in the other COPDstudy reported here (study I) were different. It has also been shown that increased levelsof neutrophils in sputum correlate with rapid declines in lung function over 15-year fol-low-up periods (Stânescu et al. 1996). Neutrophils probably pass into the airway lumenbecause chemotactic factors are released by other airway cells, such as macrophages, Tlymphocytes and epithelial cells (Richman-Eisenstat et al. 1993, Keatings et al. 1996). Ithas been shown that there is increased expression of adhesion molecules, such as E-se-lectin on vessels and ICAM-1 on basal epithelial cells, in the bronchial mucosa of pa-tients with chronic bronchitis with airway obstruction. This suggests such molecules areinvolved in origination of the disease (DiStefaro et al. 1994).
When cytocentrifuge preparations were stained with a macrophage marker (CD68),the percentage of positive cells was lower in COPD patients (17.9 ± 4.8) than in healthycontrols (71.2 ± 4.5). In both groups most macrophages were activated, as evidenced bythe high percentages of macrophages expressing the antigen M130, as recognised by theantibody Ber-Mac 3 (Law et al. 1993)
Numbers of eosinophils in sputum were high in stable COPD patients. We and othershave previously published similar results (Balzano et al. 1999, Pizzichini et al. 1998a,

57
Brightling et al. 2000a, Metso et al. 2001). Lacoste et al. (1993) have demonstrated high-er numbers of eosinophils in blood, BAL fluid and bronchial biopsy specimens fromCOPD patients than in normal subjects. However, the eosinophils were not degranulatedas they are in asthma. The mechanisms by which eosinophils pass into airways in asthmaand COPD may differ, since IL-5 expression has been found only in asthma patients (Sa-etta et al. 1996).
The role played by eosinophils and value of anti-inflammatory medication in COPDremain unclear, despite large multicentre trials relating to use of inhaled steroids (Pau-wels et al. 1999, Burge et al. 2000). Results of some studies suggest that COPD patientswith airway eosinophilia may respond better to corticosteroid treatment than COPD pa-tients without airway eosinophilia (Chanez et al. 1997, Pizzichini et al. 1998a, Brightlinget al. 2000a). In another study on inhaled and oral glucocorticoids in COPD no clinicaleffects were seen, and none of the levels of inflammatory markers that were measured al-tered (Keating et al. 1997c). Some of the stable chronic bronchitis patients evaluated intheir study also exhibited sputum eosinophilia. Eosinophils accounted in some cases foras many as 10% of all inflammatory cells present. In a later study by the same group(Culpitt et al. 1999), no changes in clinical parameters, numbers of sputum cells, and lev-els of IL-8, proteases or antiproteases were found after one month of steroid treatment athigh dose by inhalation. All of the 13 subjects exhibited low numbers of sputum eosi-nophils.
Saetta et al. (1994) have demonstrated marked airway eosinophilia during exacerba-tions of chronic bronchitis. Patients with frequent exacerbations have higher baseline IL-6 and IL-8 cytokine levels than other patients (Saetta et al. 1996). Determination of cy-tokine levels may allow prediction of frequency of future exacerbations (Bhowmik et al.2000).The effect of glucocorticoids has been shown to be better in relation to treatmentof exacerbations of COPD (Niewoehner et al. 1999). Further studies are needed to estab-lish if there are sub-populations of COPD patients in whom eosinophils play a role inorigination of the disease, and in whom exacerbations might be worse than in other pa-tients. The role of airway eosinophilia in disease progression is also unclear (Lebowitz etal. 1995).
The low numbers of lymphocytes on Wright-Giemsa-stained slides is reflected in theresults of immunocytochemical analyses: only 2.1% and 1.8% of CD3-positive lym-phocytes were seen in healthy controls and COPD patients, respectively. These low per-centages of lymphocytes make it difficult to draw conclusions about the role played bylymphocytes in origination of the disease. In addition, very few CD4- and CD8- and noCD20- or CD25-positive cells were detected. It has been shown that dithiothreitol doesnot reduce the reactivity of target molecules for immunocytochemistry after 10 minutesof treatment (Girbis-Gabardo et al. 1994) but treatment for more than 20 minutes reducesnumbers of EG-2 positive cells (Popov et al. 1994). Since we exposed the cells to dithio-threitol for no more than five minutes, the low numbers of positively staining cells arenot likely to have been a result of mucolytic treatment. Flow-cytometric analysis of spu-tum lymphocytes is probably the best approach in relation to induced sputum.

58
Asthma
High numbers of eosinophils and markers of eosinophil activation (EPO and ECP) werefound in blood and sputum from patients with asthma, both adult and children. All of theasthma patients we studied had been newly diagnosed as suffering from the disease,which had therefore not been previously treated with anti-inflammatory medication. Wefound good correlation between numbers of blood and sputum eosinophils in both adultsand children with asthma. Peripheral blood eosinophilia discriminated at baseline be-tween patients with asthma and healthy controls almost as well as discovery of high num-bers of sputum eosinophils. Results of previous studies in adult asthmatics suggest thatthe presence of high numbers of eosinophils in induced sputum samples discriminatespatients with asthma from control subjects better than results of determination of periph-eral blood eosinophils (Pizzichini et al. 1997b). We found determination of numbers ofeosinophils in sputum to be better than determination of numbers of eosinophils in bloodfor detecting asthma in children but the difference is not statistically significant. At base-line, 30% of asthmatic children exhibited normal numbers of eosinophils in blood buthad unusually high numbers of eosinophils in sputum. Only 5% of asthmatic children ex-hibited normal numbers of eosinophils in sputum and high levels of eosinophils in blood.
Atopic patients with asthma had significantly higher numbers of eosinophils in bloodthan non-atopic asthmatics. Numbers of eosinophils in sputum did not differ significantlybetween adult asthmatics with and without atopy. However, atopic children with asthmahad significantly larger numbers of eosinophils in sputum than non-atopic children withasthma. It has been shown in adults that atopic subjects without asthma and patients withseasonal allergic rhinitis can exhibit airway eosinophilia even without natural exposure tothe allergens concerned (Djukanovic et al. 1992b, Foresi et al. 1997, Vignola and Chanez2001). Avoidance of allergens by children with asthma can significantly reduce the eosi-nophilic phase of airway inflammation, and bronchial hyperresponsiveness (Piancentiniet al. 1996). The atopic children in our study IV were not exposed to any animals or to-bacco smoke at home. Only three (8%) were allergic to house-dust mites. Sixteen (43%)suffered from allergic rhinitis. However, it has been shown that children can be exposedto significant amounts of cat and dog allergens in the environment (Lönnqvist et al. 1999,Partti-Pellinen et al. 2000). Most baseline blood and sputum samples were collected out-side the pollen season, but 12 samples (15%) were collected during summer months. Thelatter were found not to differ significantly from samples collected during winter. Wefound no significant differences between atopic and non-atopic healthy controls.
The role played by neutrophils in the progress of asthmatic inflammation is contro-versial. In some studies it has been reported that neutrophils are important in chronic se-vere asthma in adults (Jatakanon et al. 1999c) and children (Marquet et al. 1999). It haseven been suggested that there are at least two phenotypes of severe asthma, in whicheosinophils are either present or absent (Wenzel et al. 1999). Children with acute asthmaexhibit intense airway inflammation, in which neutrophils, eosinophils and mast cells areinvolved (Twaddel et al. 1996, Gibson et al. 1999). In the studies reported here, which re-late to mild or moderate asthma, numbers of sputum neutrophils were not higher thannormal. We found no correlation between numbers of sputum neutrophils and severity ofdisease. In a study by Turner et al. (1995) asthma patients who had suffered clinical exac-erbation exhibited no greater than 4% airway eosinophilia but signs of neutrophilic in-flammation were evident. Similar results were found by Fahy et al. (1995b). SputumHNL and MPO values were not higher than normal in asthmatic patients.
Numbers of metachromatic cells in sputum were higher than normal in patients with
59
asthma and in patients with COPD, and correlated with numbers of eosinophils. Tryptaseis a serine endoprotease selectively released from mast cells. It has been shown that asth-matics with increased levels of tryptase in sputum had higher sputum eosinophil countsthan normal (Bettiol et al. 1999).
Eosinophilic bronchial inflammation without asthma or COPD
We have suggested use of the term ”asthma-like inflammation” to describe the conditionsuffered by patients with chronic respiratory symptoms suggestive of asthma, but normallung function, and signs of eosinophilic bronchial inflammation. The term would coverthe same kind of characteristics of inflammation (e.g. presence of eosinophils) as thosefound in asthma but with a lesser degree of eosinophilic inflammation than in patients di-agnosed as suffering from asthma.
Gibson et al. (1989b and 1995) described a condition in which chronic cough was as-sociated with eosinophilic bronchitis. The condition presents as chronic productive coughwithout no other asthma symptoms and normal spirometric findings. Airway responsive-ness to methacholine was normal but sputum eosinophil counts were abnormally high.They could be restored to normal by treatment with corticosteroid. The study populationwas chosen on the basis of percentage of eosinophils in sputum (minimum 10). The con-dition was fairly rare. Of 180 new referrals to the clinic concerned only seven met the cri-teria established. The main difference between our patients and patients with eosinophilicbronchitis would seem to be the existence of other symptoms suggestive of asthma. Pa-tients with eosinophilic bronchitis produce sputum but experience no wheezing, dysp-noea, or chest tightness. Cough was the main symptom in our patients but all also exhi-bited some other respiratory symptom. The differences may seem minor but serve to em-phasise the need for thorough clinical characterisation of patients in descriptive studies.
Recently, it has been suggested that the limit for diagnosis of eosinophilic bronchitisshould be 3% of eosinophils in sputum (Carney et al. 1997, Brightling et al. 1999a). Onlyseven of 34 patients with respiratory symptoms suggestive of asthma in the study report-ed here met this criterion indicating marked eosinophilia. In our experience percentagesof eosinophils in the sputum of healthy, truly asymptomatic individuals are very low(mean 0.07). Thirty-eight per cent of patients with respiratory symptoms and 67% of pa-tients with asthma in the study reported here exhibited eosinophilia, when this was de-fined as a percentage (0.7) of eosinophils in sputum more than three standard deviationsabove the normal mean. Recently published reference values for percentages of eosi-nophils in sputum have been around 1% (Belda et al. 2000, Spanevello et al 2000).
In a recent study, the prevalence of eosinophilic bronchitis in 91 patients with isolat-ed chronic cough was 12% (Brightling et al. 1999a). Brightling et al. modified a previ-ously validated protocol for the study of chronic cough (Irwin et al. 1990). In study V,eosinophils were found in sputum in 19% of patients with chronic cough in primary care.Concentrations of the markers of eosinophil activation, ECP and EPO, were more oftenabnormally high in serum and sputum in patients with chronic cough than in healthy in-dividuals. Thirty-six per cent of those who had eosinophils in sputum were diagnosed assuffering from asthma, 64% were not.
Several groups have studied patients with chronic respiratory symptoms (mainlycough) and airway eosinophilia. A Japanese group has used the term atopic cough andeosinophilic tracheobronchitis to describe the conditions suffered by patients with corti-
60
costeroid-responsive non-productive cough, eosinophilia in induced sputum and bronchi-al biopsy samples, normal spirometric values, normal airway responsiveness and in-creased cough response to inhaled capsaicin (Fujimura et al. 2000). The term eosi-nophilic bronchitis has also been used in relation to subjects with asthma-like symptomsrelated to work and eosinophils in sputum but no asthma proper (Lemière et al. 1997).Higher than normal numbers of mast cells and eosinophils have been found in BAL fluidfrom patients with chronic non-productive cough caused by gastro-oesophageal reflux(McGarvey et al. 1999). A Swedish group has used the term ”sensory hyperreactivity” inrelation to patients with cough, asthma-like symptoms and a positive response to the cap-saicin provocation test (Millqvist et al. 1998). The subjects had normal lung function.The nature of any airway inflammation present in such patients has yet to be studied.
All of our asthma patients exhibited increased bronchial responsiveness to inhaledhistamine except for those with respiratory symptoms suggestive of asthma. This findingis in accordance with the results of inflammatory cells in sputum and suggests that rela-tively severe inflammatory processes in asthmatic subjects could have led to airway re-structuring (remodelling) and increased bronchial responsiveness that were mostly lack-ing in the patients with just asthma-like inflammation. In ”classic” asthma, two factorsmay affect functional outcome: a Th-2-mediated inflammation involving mast cells andeosinophils, and airway-wall restructuring involving changes in airway epithelial, vascu-lar, fibroblast, neural and smooth-muscle cell phenotypes. It has been shown that eosi-nophilic bronchitis is associated with airway inflammation and increased release of va-soactive and bronchoconstricting mediators (Brightling et al. 2000b). Levels of exhaledNO have been shown to be higher than normal in eosinophilic bronchitis (Berlyne et al.2000). Gibson et al. (1998a) have shown similar extents of BAL eosinophilia and cy-tokine gene expression in patients with asthma and eosinophilic bronchitis. Niimi et al.(1998) showed that numbers of eosinophils in bronchial biopsy samples from patientswith increased bronchial responsiveness were the same in both so-called ”cough variantasthma” and in traditional asthma. It has been suggested that a possible reason for thedifference in airway responsiveness in patients with eosinophilic bronchitis and asthma isthat the epithelium remains intact in eosinophilic bronchitis (Brightling et al. 2000b). Wefound no differences in numbers of epithelial cells in induced sputum samples in patientswith asthma and respiratory symptoms suggestive of asthma. Further studies of bronchialbiopsy material are required.
Airway eosinophilia can occur in otherwise healthy individuals during and after viralinfection (Trigg et al. 1996). We tried to exclude the effects of viral infection by includ-ing only patients with no signs of respiratory infection during the preceding eight weeks.Numbers of neutrophils, and levels of the markers of neutrophil activation HNL andMPO, were no higher than normal in our patients with respiratory symptoms suggestiveof asthma. It has been shown that chronic dry cough can exist with higher than normalnumbers of neutrophils and levels of cytokines associated with neutrophil chemotaxis(Jatakanon et al. 1999b).
Correlations between different inflammatory markers
In adults, numbers of blood eosinophils correlated best with serum EPO levels, in allgroups studied (no data available for COPD patients). Numbers of blood eosinophils cor-related less well with serum ECP levels and numbers of eosinophils in sputum but thecorrelations were statistically significant. In children with asthma, we found good corre-
61
lation between numbers of eosinophils in blood and sputum. Numbers of eosinophils insputum correlated significantly with sputum EPO and ECP levels. When patients weredivided into groups according to diagnosis, a correlation was found only in relation toasthmatics. Numbers of neutrophils in sputum correlated with sputum MPO and HNLlevels. They correlated with ECP levels better than numbers of eosinophils in sputumoverall, in all groups of patients except asthmatics. Levels of sputum ECP correlatedstrongly with sputum MPO and HNL levels. These correlations suggests that factorswhich prime neutrophils may also affect eosinophils. Venge et al. (1997) have reporteduptake of ECP by neutrophils. This could partly explain the correlation observed, since ithas been suggested that ECP occupies the same locations as MPO in secondary granulesof neutrophils (Sur et al. 1998).
Levels of sputum EPO and HNL have been measured in only a few previous studies.Keatings et al. (1997b) found values similar to ours in asthma and COPD patients. Aslightly different sputum-handling method was used. It has been suggested that ECP andEPO are released by different mechanisms, and that EPO might be the more sensitive in-dicator of allergic inflammation (Karawajczyk et al. 1995, Metso et al. 2002).
The value of measuring inflammatory markers is questionable, given that countinginflammatory cells yields similar results. Sputum processing to obtain cytospin slides anddifferential cell counting are, however, laborious, and suitable only for research purposes.Counting from smears gives only semiquantitative results. We have therefore been tryingto develop sputum processing and devise a simple method of measuring ECP and MPOlevels that could be applied in primary health-care settings (Metso et al. 2001).
EFFECTS OF TREATMENT
In the patients with respiratory symptoms suggestive of asthma, three months of treat-ment with inhaled BDP suppressed symptoms and resulted in declines in numbers ofeosinophils to greater extents than treatment with placebo. The difference between resultsof treatment was significant in relation to the most important symptom, cough. In asthma,eosinophilic inflammation has been found to be reversed or suppressed contemporane-ously with improvement in lung function through treatment with inhaled steroid (Dju-kanovic et al. 1992a, Jatakanon et al. 1999a). In eosinophilic bronchitis, treatment withinhaled steroid has been shown to suppress symptoms and decrease numbers of eosi-nophils in sputum (Gibson et al. 1995, Brightling et al. 2000c). However, the studies ineosinophililic bronchitis were not placebo controlled.
The 60 asthmatic children who participated in study IV had been randomly selectedfrom 180 subjects participating in a study of early pharmacological intervention in child-hood asthma (Turpeinen 2000). In the latter study, treatment with budesonide resulted in50% fewer exacerbations than treatment with disodium cromoglycate treatment over an18-month period. In our study, lung function, symptoms, use of rescue medication andnumbers of eosinophils in sputum did not alter statistically significantly in the cromogly-cate group during the first six months. In some patients in the cromoglycate group therewere marked decreases in numbers of eosinophils in sputum. However, there had beensupportive treatment with inhaled budesonide by inhalation during exacerbations. Eight-een of 21 children (86%) who started with cromoglycate needed at least one two-weekcourse of budesonide during the 18 months of the study.
Six months of treatment with inhaled budesonide decreased numbers of eosinophils

62
in sputum with contemporaneous improvement clinical status but no significant changesin numbers of eosinophils in blood. This finding suggests that determinations of numbersof eosinophils in sputum may be a better means of following-up results of treatment thandeterminations of numbers of eosinophils in blood.
After six months of treatment, children who had received budesonide were dividedinto two groups of equal sizes. In one group the children continued with a low dose ofbudesonide regularly, in the other the children received placebo and inhaled budesonideonly during exacerbations. No significant differences were seen between the two groupsat 18 months. This suggests that after clinical improvement has been seen during regulartreatment with inhaled steroid, periodic treatment might be sufficient to keep mild child-hood asthma under control. However, all these patients should controlled regularly bytheir physician.
CLINICAL IMPLICATIONS
There is general consensus as regards how moderate and severe asthma should be treated,less agreement concerning treatment of mild asthma. Commencement of anti-inflamma-tory therapy is not usually recommended until the patient has tried the effect of a short-acting β
2-agonist several times per week (NHLBI 1995). This situation has arisen largely
because not enough is known about the natural history of astma. It is also not clearwhether patients with just respiratory symptoms suggestive of asthma will develop asth-ma proper. In the study reported here, four patients (13%) developed asthma during ayear of follow-up. The first three months of treatment received by these subjects differed.In a Finnish study of children from seven to 12 years of age who had symptoms sugges-tive of asthma but normal lung function, 33% developed clinical asthma during a two-year follow-up period (Remes at al. 1998). Early detection of eosinophilic inflammationwould improve results of treatment with anti-inflammatory medication. This could affectdisease progress and the risk of developing chronic asthma. In general practice, bronchialinflammation that may underlay symptoms is usually not characterised. Clinical judge-ment is based on indirect information concerning bronchial status. In consequence, thecondition from which symptomatic patients with no apparent lung-function abnormalityare suffering is not diagnosed appropriately and courses of antibiotics, expectorants, anti-tussives, antihistamines and β
2-agonists, which will essentially have no effect on process-
es involving eosinophils, are prescribed.The natural course of eosinophilic airway inflammation is not yet known. Many pa-
tients may never develop asthma but follow-up studies are needed (Brightling et al.1999b). Three months of inhaled BDP in patients with respiratory symptoms did not pre-vent the development of asthma in all patients in our study. On the other hand, eosi-nophilic inflammation can heal spontaneously, especially if it has been caused by expo-sure to an allergen, which ceases. Effective treatment of these patients may require pre-scription of a course of inhaled steroids for two to three months. COPD patients in whoseeosinophils are found experience relatively rapid declines in lung function (Lebowitz etal. 1995) and can benefit from anti-inflammatory therapy (Pizzichini et al. 1998a, Bright-ling et al. 2000a).
Inflammatory changes such as infiltration of inflammatory cells into the mucosa, andthickening of the basement membrane are visible in mucosal biopsy specimens takenduring endoscopic examination of the lungs in early stages of asthma, before dysfunction

63
has become permanent (Laitinen et al. 1993). Mucosal inflammation obviously existswell before development of pulmonary dysfunction. The interval between mucosal in-flammation and initial symptoms and development of dysfunction is unknown. There areindications that symptoms of mucosal inflammation need to exist for at least a year be-fore increased bronchial susceptibility to constriction can be demonstrated by means ofchallenge testing (Sovijärvi et al. 1993). We assessed asthmatics in whom duration ofsymptoms had been fairly short (less than a year). It has been found in our clinic thatasthma can be diagnosed somewhat late in both adults and children (Haahtela et al.1999). Even in the early stages of asthma in the studies reported here, there was markedeosinophilic airway inflammation, which demonstrates the importance of early interven-tion in asthma (Haahtela et al. 1991 and 1994).
We found no correlations between duration or severity of symptoms and levels of in-flammatory markers in sputum. The only symptom that correlated with sputum eosi-nophilia was wheezing, seen in both asthmatics and patients with respiratory symptomssuggestive of asthma. Children with just recurrent cough are at lesser risk of developingasthma than children with both cough and wheeze (Wright et al. 1996). In the study re-ported here recurrent cough without wheeze was present in 38% of asthmatic children.Although there were no significant differences in atopic status or baseline lung functionbetween the children who had both cough and wheezing and children who had justcough, children in the latter group were less responsive to histamine and exhibited lesseosinophilic airway inflammation. However, children with just cough met the reversibili-ty criterion for asthma, and did not respond differently to the anti-inflammatory asthmamedication used in this study from children with wheezing.
Determination of changes in numbers of eosinophils in sputum has been shown to bea potentially useful means of predicting loss of control of asthma, as reflected by loss ofairway function (Jatakanon et al. 2000). However, some exacerbations appear to occurvia an eosinophil-independent mechanism (in´t Veen et al. 1999). Assessment of the na-ture of an exacerbation could improve decisions regarding treatment.
A wide variety of relationships between clinical and functional parameters and re-sults of measurements on induced sputum samples from patients with asthma has beendescribed (Rosi and Scano 1999). The relationship between severity of asthma as definedby symptoms and results of lung-function tests and numbers of eosinophils in sputum isat best weak (Iredale et al. 1994, Ronchi et al. 1997). Symptoms, results of lung-functiontests and bronchial hyperresponsiveness cannot predict determinations relating to cells insputum or biochemical parameters. This demonstrates the specific role that sputumanalysis can play in the assessment and monitoring of asthma.
FUTURE DIRECTIONS
Attempts have been made to devise a simplified method of sputum induction for use inepidemiological studies (Gibson et al. 1998c). The procedure needs to be simplified fur-ther if it is to be applicable in clinical practice (Metso et al. 2001). It remains to be seenwhether sputum analysis could be used daily at general practitioner level. Results of spu-tum analysis can lead to better characterisation of asthma and COPD phenotypes, and ofmechanisms underlying chronic cough. They can be used to assess or predict responsesto treatments. Future studies will show whether asthma management with the aim of nor-malising numbers of eosinophils in sputum results in better outcomes than standard ap-

64
proaches, in which the aim of treatment is suppression of symptoms. (Sont et al. 1999).Analysis of induced sputum samples can help with choice of additional therapy for asth-ma patients with persistent symptoms who are taking inhaled steroids (Pizzichini et al.1999b). Sputum induction could be used in relation to other airway diseases, such as tu-berculosis, other infections and lung cancer, to evaluate inflammatory mechanisms andaltered gene expression, for example (Fleming et al. 1999). Induced sputum samples canalso be used to obtain airway cells for in vitro culture, allowing study of their functionaland phenotypic characteristics (Hamzaoui et al. 2000).

65
SUMMARY
The aim in study I was to assess safety of sputum induction in patients with COPD ofdifferent severities. The subjects were 28 smokers with a mean baseline FEV
1 of 1.8 L
(53% of the predicted) and mean reversibility of 2.5%. After pre-medication with 200 µgof salbutamol, sputum was induced using increasing concentrations of saline in an ultra-sonic nebulizer. The procedure was well tolerated. No patient reported a major side ef-fect. However, the mean change during induction
from FEV
1 before bronchodilator ad-
ministration was -8.5% and from the FEV1
after bronchodilator administration -10.7%.Three subjects (11%) exhibited falls of more than 20% from baseline FEV
1. A further 10
(36%) experienced falls of 10 to 20%. Patients with the greatest reversibility of airwayobstruction benefited most from bronchodilator pre-treatment because a statistically sig-nificant inverse relationship between reversibility in FEV
1 and fall in FEV
1 during induc-
tion was found.In study II, sputum was induced in 21 COPD patients with a mean FEV
1 of 1.6 L
(54% of the predicted) and 16 healthy controls. Success rates, safety of the method, re-producibility of cell counts and differences in cell counts were investigated in bothgroups. All subjects produced adequate sputum samples. Induction did not alter spiromet-ric values. Marked sputum neutrophilia was noted in patients with COPD. Both within-investigator and between-investigator cell-count reproducibility were high for major celltypes. In patients with COPD, an inverse correlation was noted between percentages ofneutrophils and FEV
1 values. Immunostaining revealed very few lymphocytes.
In study III, we tested the hypothesis that eosinophilic airway inflammation ispresent in many patients who present with respiratory symptoms suggestive of asthmabut normal lung function. Thirty-six consecutive patients of this kind were studied.Twenty-five asthmatics and 43 healthy volunteers served as controls. Signs of eosi-nophilic inflammation were studied in blood and induced sputum samples. Patients withrespiratory symptoms were treated on a single-blind basis with inhaled beclomethasonedipropionate (BDP) (800 µg daily) or with placebo for three months. They werere-examined at three months and one year. Patients with respiratory symptoms had highernumbers of blood and sputum eosinophils than healthy individuals but degrees of eosi-nophilic inflammation were less than in asthmatics. Three months of treatment with BDPsignificantly reduced total symptom scores, cough scores, and numbers of eosinophils inblood. For cough, the improvement was significantly greater than that achieved with pla-cebo. Of 31 patients followed-up for one year, 17 (55%) still exhibited symptoms but hadnormal lung function. Four patients (13%) had developed asthma. Ten (32%) had becomesymptom-free.
Study IV took the form of a double-blind randomised study in 60 children, five to 10years of age, with newly diagnosed asthma Thirty-nine children received budesonide(800 µg/day) for one month, 400 µg/day for five months, and budesonide (n = 19) (200µg/day) or placebo (n = 20) for 12 months. Patients in a third group (n = 21) were treatedwith disodium cromoglycate (30 mg/day) for 18 months. Asthma exacerbations in allgroups were treated with budesonide (800 µg/day) for two weeks. At baseline, a controlgroup of 17 healthy children was studied. Diaries were used to record respiratory symp-toms and lung function throughout the study. Airway inflammation was assessed by ex-amination of induced sputum samples. At baseline, the asthmatic children had more eosi-nophils in blood and sputum than the controls, and more metachromatic cells in sputum.
66
Eosinophilic inflammation was most pronounced in children with atopic asthma. Aftersix months of treatment, the children who had been treated with budesonide had had sig-nificantly fewer exacerbations than those treated with cromoglycate. Treatment withbudesonide significantly improved lung function, decreased symptoms, use of rescuemedication and numbers of eosinophils in sputum. Regular treatment with inhaled bude-sonide for 18 months resulted in further improvements in lung function and symptomsbut the changes were not significantly different from those in the other two groups.
In study V, using simplified methods of sputum induction and processing of sputumsamples, we determined whether eosinophilic airway inflammation was associated withprolonged cough. Eighty-two patients who had had cough for more than one month wereenrolled into the study, from six primary-health-care centres. Patients with known pulmo-nary disease, including asthma and COPD, whose cough was known to have anothercause, or who had recently suffered a respiratory infection were excluded. Fifty-threehealthy individuals served as controls. Sputum production was induced by inhalation of3% saline. Inflammatory cells in smears were studied semi-quantitatively. Concentrationsof eosinophil cationic protein (ECP), eosinophil peroxidase (EPO), myeloperoxidase(MPO) and human neutrophilic lipocalin (HNL) were determined. Sputum inductionproved safe and adequate samples were obtained from 91%. Sputum eosinophilia (eosi-nophils accounting for more than 5% of all cells in smears) was present in 14 patientswith prolonged cough (19%) but in no healthy individual. Five of the 14 individuals(36%) who exhibited sputum eosinophilia appeared to have asthma, while nine of the 14(64%) did not. Concentrations of ECP and EPO were higher in patients with prolongedcough than in healthy individuals.
67
CONCLUSIONS
• Sputum induction by inhalation of hypertonic saline can result in bronchial
obstruction. Our results highlight the importance of pre-treatment with
bronchodilators and monitoring of lung function during sputum induction. If
appropriate methods are used sputum induction is a safe and reproducible method
allowing to study airway inflammation in various respiratory diseases.
• Marked sputum neurophilia is present in patiens with COPD. However, there is a
subgroup of COPD patiens with eosinophilic airway inflammation.
• Patients exist who have symptoms suggestive of asthma and signs of
eosinophilic bronchial inflammation but no significant airflow limitation. Such
patients respond to treatment with inhaled steroid. The condition from which they
suffer has no agreed definition or diagnostic criteria. Its occurrence and effects of
treatments on it have not been systematically studied.
• Sputum induction can be safely and successfully used in studying airway
inflammation in children with newly diagnosed asthma. Evidence of eosinophilic
inflammation can be seen in induced sputum samples, especially in atopic
asthmatics. Six months of treatment with inhaled budesonide controlled asthma
well, decreased numbers of eosinophils in sputum and improved lung function.
Regular treatment with low doses of inhaled steroid for 18 months resulted in
further clinical improvement but results were equally good with periodic treatment
during exacerbations only. The results may indicate a new strategy for treatment of
newly detected mild childhood asthma, in which regular therapy with inhaled
steroids may, if effective, be followed by treatment at intervals.
• Eosinophilic airway inflammation is a fairly common cause of chronic cough in
primary care, even in patients not suffering from asthma or COPD, or in whom no
other cause of cough is known to exist. Induced sputum samples obtained in health
centres can be studied in central laboratories. Detection of eosinophilic airway
inflammation could aid decisions regarding treatment.

68
ACKNOWLEDGEMENTS
This study was carried out in the Divisions of Allergy and Pulmonary Medicine of theDepartment of Medicine of Helsinki University Central Hospital, Finland, and the De-partment of Respiratory Diseases of the University Hospital of Ghent, Belgium.
I owe warmest thanks to my supervisor, Professor Lauri A. Laitinen MD, Chief ExecutiveOfficer of the Helsinki and Uusimaa Hospital Federation and former Head of the Depart-ment of Medicine, for providing me with the opportunity to engage in both clinical workand research. I am grateful for his support throughout. I am most grateful to my other su-pervisor, Docent Tari Haahtela MD, Head of the Division of Allergy, Skin and Allergy Hos-pital, for clear guidance regarding the conduct of my work. I wish to thank him for provid-ing inspiration relating to my research and excellent facilities for pursuing ideas. I am par-ticularly grateful for his patient guidance in connection with scientific writing.
I should like to thank Professor Romain Pauwels MD, Head of the Department of Respi-ratory Diseases of the University Hospital of Ghent, for allowing me to work in his de-partment while conducting studies in Belgium, and for his support and advice. ProfessorBrita Stenius-Aarniala MD and Professor Pentti Tukiainen MD, of the Division of Pul-monary Medicine of Helsinki University Central Hospital, and Professor Anna-Mari Ran-ki MD, of the Skin and Allergy Hospital are thanked for providing opportunities to workin their departments and conduct studies.
I wish to thank Professor Markku M. Nieminen MD and Docent Henrik Riska MD, ex-perts appointed by the Faculty of Medicine of the University of Helsinki, for reviewingthis thesis and giving me valuable advice during its final preparation.
I most sincerely thank Professor Johan Kips MD for providing inspiration and sharing hisknowledge, and Dr. Renaat Peleman MD for advice and his contribution to my everydaywork in the laboratory in Ghent. I also wish to thank Professor Gillian Bullock PhD andProfessor Guy Joos MD for their valuable advice. I am most grateful to my colleagueTuula Metso PhD for friendship, criticism and for her invaluable help. I also wish tothank other co-authors, namely the skilled paediatricians Anna Pelkonen MD andMarkku Turpeinen MD, Ari Lindqvist MD, who taught me so much about Good ClinicalPractice, the experienced clinicians Katri Heikkinen MD and Pekka Saarelainen MD, andIlkka Helenius MD, Kurt Nikander BSc and Drs Tuula Petäys, Airi Sohlman, HarriTyölahti, Paula Kohonen-Jalonen, Pirjo Kiviniemi, of the Espoo and Vantaa Health CareCentres, to whom thanks are also due for patient recruitment.
I thank Professor Per Venge MD, Uppsala, Sweden, and Dr. Christer Peterson PhD, Phar-macia Upjohn Diagnostics, Uppsala, Sweden, for their help with analysis of inflammato-ry markers. Matti Silvasti LicPharm, of Orion Pharma, Kuopio is thanked for his helpwith provision of study medication. Professor Seppo Sarna, PhD is thanked for givingadvice on statistical methods. Edmund Gordon, BSc is thanked for linguistic revision ofthe final version of this thesis.
69
I wish to thank all personnel of the Allergy and Pulmonary Medicine Divisions of Helsin-ki University Central Hospital, but especially Marja Tokoi for sharing her experience andproviding help in the laboratory. I also wish particularly to thank Ilona Kuistio, TuulaKoljonen, Leena Ingelin-Kuortti, Kerstin Ahlskog, Eija Repo and Minna Veneranta, forproviding technical assistance. I thank all colleagues, junior and senior, for their supportof and interest in the research projects undertaken by my colleagues and me.
I should like to express gratitude to the personnel of the Department of Respiratory Dis-eases of the University Hospital of Ghent. In particular, I wish to thank those working inthe Immunology Laboratory for their assistance and support. I also wish to thank all ofmy friends who made the years in Belgium memorable.
I thank all patients and controls who volunteered to participate in these studies and thusmade them possible.
Finally, I should like to thank my family and friends for their continual support. I espe-cially wish to thank my parents, Hannele and Pauli Rytilä, for giving me a firm ground-ing for life, and for their continual love and support. I also wish to thank my sisters, Tuu-la and Tiina and their families. Special thanks are due to Maire and Kaarlo Ruhanen fortaking such good care of my children whenever needed. I thank my dear husband Kimmofor sharing with me the ups and downs of life and for his love and encouragement. I alsowish to thank our lovely princesses Hanna and Sonja for filling my life with love andhappiness.
This study was supported by grants from the Finnish Association for Allergy and Immu-nology, the Finnish Allergy Research Foundation, the Finnish Anti-Tuberculosis Associa-tion Foundation, the Finnish Medical Society Duodecim, the Foundation of Helsinki Uni-versity Central Hospital, Hengitysliitto Heli, the Ida Montin Foundation, the Vieno andLaina Kivi Foundation, the Vlaamse Gemeenschap Brussels, and AstraZeneca Researchand Development.
Espoo, December 2001
Paula Rytilä

70
REFERENCES
Alving K, Weitzberg E, Lundberg JM. Increased amount of nitric oxide in exhaled air
of asthmatics. Eur Resp J 1993;6:1368-1370.
American Thoracic Society. Standards for the diagnosis and care of patients with chronic
obstructive pulmonary disease (COPD) and asthma. Am Rev Respir Dis
1987a;136:225-244.
American Thoracic Society. Standardisation of spirometry - update 1987. Am Rev Respir
Dis 1987b;136:1285-1298.
American Thoracic Society. Single breath carbon monoxide diffusing capacity (transfer
factor). Am Rev Respir Dis 1987c;136:1299-1307.
American Thoracic Society. Standards for the diagnosis and care of patients with chronic
obstructive pulmonary disease (COPD) and asthma. Am J Respir Crit Care Med
1995;152:S77-S120.
Bacci E, Cianchetti S, Paggiaro PL, Carnevali S, Bancalari L, Dente FL, Di Franco A,
Giannini D, Vagaggini B, Giuntini C. Comparison between hypertonic and isotonic
saline-induced sputum in the evaluation of airway inflammation in subjects with
moderate asthma. Clin Exp Allergy 1997;26:1395-1400.
Bacci E, Cianchetti S, Ruocco L, Bartoli ML, Dente FL, Di Franco A, Giannini D,
Vagaggini B, Morelli MC, Paggiaro PL. Eosinophil markers in blood and induced
sputum in asthmatic subjects before and after budesonide treatment. Clin Exp Allergy
1998;28:1237-1243.
Balzano G, Stefanelli F, Iorio C, De Felice A, Melillo EM, Martucci M, Melillo G.
Eosinophilic inflammation in stable chronic obstructive pulmonary disease.
Relationship with neutrophils and airway function. Am J Respir Crit Care Med
1999;160:1486-1492.
Barnes PJ. Mechanisms in COPD. Differences from asthma. Chest 2000;117:10s-14s.
Belda J, Leigh R, Parameswaran K, O´Byrne P, Sears MR, Hargreave FE. Induced
sputum cell counts in healthy adults. Am J Respir Crit Care Med 2000;161:475-478.
Berlyne GS, Parameswaran K, Kamada D, Efthimiadis A, Hargreave FE. A comparison
of exhaled nitric oxide and induced sputum as markers of airway inflammation. Clin
Exp Allergy 2000;106:638-644.
Bettiol J, Radermecker M, Sele J, Henquet M, Cataldo D, Louis R. Airway mast-cell
activation in asthmatics is associated with selective sputum eosinophilia. Allergy
1999;54:1188-1193.
Bhowmik A, Seemungal TAR, Sapsford RJ, Devalia JL, Wedzicha JA. Comparison of
spontaneous and induced sputum for investigation of airway inflammation in chronic
obstructive pulmonary disease. Thorax 1998;53:953-956.

71
Bhowmik A, Seemungal TA, Sapsford RJ, Wedzicha JA. Relation of sputum
inflammatory markers to symptoms and lung function changes in COPD
exacerbations. Thorax 2000;55:114-120.
Bickerman HA, Sproul EE, Barach AL. An aerosol method of producing bronchial
secretions in human subjects: a clinical technic for the detection of lung cancer. Dis
Chest 1958;33:347-362.
Bland JM, Altman DG. Statistical methods for assessing agreement between two
methods of clinical measurement. Lancet 1986;i:307-310.
Bousquet J, Chanez P, Lacoste JY, Barneon G, Ghavanian N, Enander I, Venge P,
Ahlstedt S, Simony-Lafontaine J, Godadrd P, Michel F-B. Eosinophilic inflammation
in asthma. N Engl J Med 1990;323:1033-1039.
Brightling CE, Ward R, Goh KL, Wardlaw AJ, Pavord ID. Eosinophilic bronchitis is an
important cause of chronic cough. Am J Respir Crit Care Med 1999a;160:406-410.
Brightling CE, Woltmann G, Wardlaw AJ, Pavord ID. Development of irreversible
airflow obstruction in a patient with eosinophilic bronchitis without asthma. Eur Resp
J 1999b;14:1228-1230.
Brightling CE, Monteiro W, Ward R, Parker D, Morgan MDL, Wardlaw AJ, Pavord ID.
Sputum eosinophilia and short-term response to prednisolone in chronic obstructive
pulmonary disease: a randomised controlled trial. Lancet 2000a;356:1480-1485.
Brightling CE, Ward R, Woltmann G, Bradding P, Sheller JR, Dworski R, Pavord ID.
Induced sputum inflammatory mediator concentrations in eosinophilic bronchitis and
asthma. Am J Respir Crit Care Med 2000b;162:878-882.
Brightling CE, Ward R, Wardlaw AJ, Pavord ID. Airway inflammation, airway
responsiveness and cough before and after inhaled budesonide in patients with
eosinophilic bronchitis. Eur Resp J 2000c;15:682-686.
Brightling CE, Pavord ID. Eosinophilic bronchitis - what is it and why is it important?
Clin Exp Allergy 2000;30:4-6.
Brown HM. Treatment of chronic asthma with prednisolone: significance of eosinophils
in sputum. Lancet 1958;ii:1245-1247.
Burke PS, Calverley PMA, Jones PW, Spencer S, Anderson JA, Maslen TK.
Randomised, double blind, placebo controlled study of fluticasone propionate in
patients with moderate to severe chronic obstructive pulmonary disease. The ISOLDE
trial. BMJ 2000;320:1297-1303.
Cai Y, Carty K, Henry RL, Gibson PG. Persistence of sputum eosinophilia in children
with controlled asthma when compared with healthy children. Eur Resp J
1998;11:848-853.
Carlson M, Öberg G, Peterson C, Venge P. Releasability of human hypereosinophilic
eosinophils is related to the density of the cells. Br J Haematol 1994;86:41-47.
Carney IK, Gibson PG, Murree-Allen K, Saltos N, Olson LG, Hensley MJ. A systemic

72
evaluation of mechanisms in chronic cough. Am J Respir Crit Care Med
1997;156:211-216.
Chanez P, Vignola AM, O´Shaugnesse T, Enander I, Li D, Jeffery PK, Bousquet J.
Corticosteroid reversibility in COPD is related to features of asthma. Am J Respir Crit
Care Med 1997;155:1529-1534.
Chodosh S, Zacheo CW, Segal MS. The cytology and histochemistry of sputum cells.
Am Rev Resp Dis 1962;85:635-648.
Chodosh S. Examination of sputum cells. New Eng J Med 1970;282:854-857.
Chung KF, Barnes PJ. Cytokines in asthma. Thorax 1999;54:825-857.
Cianchetti S, Bacci E, Bartoli ML, Ruocco L, Carnevali S, Dente FL, Di Franco A,
Giannini D, Vagaggini B, Paggiaro PL. Effect of β2-agonist pre-treatment on cell
counts and soluble mediator concentrations in hypertonic saline-induced sputum. Clin
Exp Allergy 1999;29:712-718.
Claman DM, Boushey HA, Liu J, Wong H, Fahy JV. Analysis of induced sputum to
examine the effects of prednisone on airway inflammation in asthmatic subjects. J
Allergy Clin Immunol 1994;94:861-869.
Cleland WW. Dithiothreitol, a new protective reagent for SH groups. Biochemistry
1964;3:480-482.
Cordell JL, Falini B, Erber WN, Ghosh AK, Abdulaziz Z, MacDonald S, Pulford KA,
Stein H, Mason DY. Immunoenzymatic labeling of monoclonal antibodies using
immune complexes of alkaline phosphatase and monoclonal anti-alkaline phosphatase
(APAAP complexes). J Histochem Cytochem 1984; 32:219-29.
Crimi E, Spanevello A, Neri M, Ind PW, Rossi GA, Brusasco V. Dissociation between
airway inflammation and airway hyperresponsiveness in allergic asthma. Am J Respir
Crit Care Med 1998;157:4-9.
Culpitt SV, Maziak W, Loukidis S, Nightingale JA, Matthews JL, Barnes PJ. Effect of
high dose inhaled steroid on cells, cytokines, and proteases in induced sputum in
chronic obstructive pulmonary disease. Am J Respir Crit Care Med
1999;160:1635-1639.
Curschmann, H. Einige Bemerkungen über den Bronchialsecret Vorkommenden
Spiralen. Deutsche Arch Klin Med 1885;36:578-585.
D´Ippolito R, Foresi A, Chetta A, Casalini A, Castagnaro A, Leone C, Olivieri D.
Induced sputum in patients with newly diagnosed sarcoidosis. Chest
1999;115:1611-1615.
De Boeck K, Alifier M, Vandeputte S. Sputum induction in young cystic fibrosis
patients. Eur Resp J 2000;16:91-94.
de la Fuente PT, Romagnoli M, Godard P, Bousquet J, Chanez P. Safety of inducing
sputum in patients with asthma of varying severity. Am J Respir Crit Care Med
1998;157:1127-1130.
73
Di Stefaro A, Maestrelli P, Roggeri A, Turato G, Calabro S, Potena A, Mapp CE, Ciaccia
A, Covalev L, Fabbri LM, Saetta M. Upregulation of adhesion molecules in the
bronchial mucosa of subjects with chronic obstructive bronchitis. Am J Respir Crit
Care Med 1994;149:803-810.
Djukanovic R, Wilson JW, Lai CKW, Holgate ST, Howard PH. The safety aspects of
fiberoptic bronchoscopy, bronchoalveolar lavage and endobronchial biopsy in asthma.
Am Rev Respir Dis 1991;143:772-777.
Djukanovic R, Wilson JW, Britten KM, Wilson SJ, Walls AF, Roche WR, Howard PH,
Holgate ST. Effect of inhaled corticosteroid on airway inflammation and symptoms in
asthma. Am Rev Respir Dis 1992a;145:669-74.
Djukanovic R, Lai CKW, Wilson JW, Britten KM, Wilson SJ, Roche WR, Howard PH,
Holgate ST. Bronchial mucosal manifestations of atopy: a comparison of markers of
inflammation between atopic asthmatics, atopic nonasthmatics and healthy controls.
Eur Respir J 1992b;5:538-544.
Djukanovic R. Induced sputum - a tool with great potential but not without problems. J
Allergy Clin Immunol 2000;105:1071-1073.
Dor PJ, Ackerman SJ, Gleich J. Charcot-Leyden crystal proteins and eosinophil granule
major basic protein in sputum of patients with respiratory diseases. Am Rev Respir Dis
1984;130:1072-1077.
Dorland´s Illustrated Medical Dixtionary, 27th ed. Philadelphia: WB Saunders Co.,
1988;1570.
Dreborg S, editor. Skin tests used in type I allergy testing. Position paper. Allergy
1989;44 (Suppl 10):1-59.
Ellis AG. The pathological anatomy of bronchial asthma. Am J Med Sci 1908;36:407-29.
Fahy JV, Liu J, Wong H, Boushey HA. Cellular and biochemical analysis of induced
sputum from asthmatic and from healthy subjects. Am Rev Respir Dis
1993a;147:1126-1131.
Fahy JV, Steiger DJ, Liu J, Basbaum CB, Finkbeiner WE, Boushey HA. Markers of
mucus secretion and DNA levels in induced sputum from asthmatic and from healthy
subjects. Am Rev Respir Dis 1993b;147:1132-1137.
Fahy JV, Wong H, Liu J, Boushey HA. Comparison of samples collected by sputum
induction and bronchoscopy from asthmatic and healthy subjects. Am J Respir Crit
Care Med 1995a;152:53-58.
Fahy JV, Kim KW, Liu J, Boushey HA. Prominent neutrophilic inflammation in sputum
from subjects with asthma exacerbation. J Allergy Clin Immunol 1995b;95:843-852.
Fahy JV, Fleming HE, Wong HH, Lui JT, Su JQ, Reimann J, Fick RB Jr, Boushey HA.
The effect of anti-IgE monoclonal antibody on the early-and late-phase responses to
allergen inhalation in asthmatic subjects. Am J Respir Crit Care Med
1997;155:1828-1834.

74
Fahy JV, Boushey HA. Effect of low-dose beclomethasone dipropionate on asthma
control and airway inflammation. Eur Resp J 1998;11:1240-1247.
Fireman E, Greif J, Schwarz Y, Man A, Ganor E, Ribak Y, Lerman Y. Assessment of
hazardous dust exposure by BAL and induced sputum. Chest 1999a;115:1720-1728.
Fireman E, Topilsky I, Greif J, Lerman Y, Schwarz Y, Man A, Topilsky M. Evaluation of
interstitial lung diseases by induced sputum compared to bronchoalveolar lavage.
Respir Med 1999b;93:827-834.
Fireman Z, Osipov A, Kivity S, Kopelman Y, Sternberg A, Lazarov E, Fireman E. The
use of induced sputum in the assessment of pulmonary involvement in Crohn´s
disease. Am J Gastroenterol 2000;95:730-734.
Fleming HE, Little FF, Schnurr D, Avila PC, Wong H, Liu J, Yagi S, Boushey HA.
Rhinovirus-16 colds in healthy and in asthmatic subjects. Similar changes in upper and
lower airways. Am J Respir Crit Care Med 1999;160:100-108.
Foresi A, Leone C, Pelucchi A, Mastropasqua B, Chetta A, Dippolito R, Marazzini L,
Olivieri D, Giovanni SS. Eosinophils, mast cells and basophils in induced sputum from
patients with seasonal allergic rhinitis and perennial asthma: Relationship to
methacholine responsiveness. J Allergy Clin Immunol 1997;100:58-64.
Fujimura M, Ogawa H, Yasui M, Matsuda T. Eosinophilic tracheobronchitis and airway
cough hypersensitivity in chronic non-productive cough. Clin Exp Allergy
2000;30:41-47.
Gauvreau GM, Lee JM, Watson RM, Irani AMA, Schwartz LB, O’Byrne PM. Increased
numbers of both airway basophils and mast cells in sputum after allergen inhalation
challenge of atopic asthmatics. Am J Respir Crit Care Med 2000;161:1473-1478.
Gelder CM, Thomas PS, Yates DH, Adcock IM, Morrison JF, Barnes PJ. Cytokine
expression in normal, atopic, and asthmatic subjects using the combination of sputum
induction and the polymerase chain reaction. Thorax 1995;50:1033-1037.
Gershman NH, Wong HH, Lui JT, Mahlmeister MJ, Fahy JV. Comparison of two
methods of collecting induced sputum in asthmatic subjects. Eur Resp J
1996;9:2448-2453.
Gershman NH, Liu H, Wong H, Liu JT, Fahy JV. Fractional analysis of sequential
induced sputum samples during sputum induction: evidence that different lung
compartments are sampled at different time points. J Allergy Clin Immunol
1999a;104:322-328.
Gershman NH, Fahy JV. The effect of methacholine challenge on the cellular
composition of induced sputum. J Allergy Clin Immunol 1999b:103:957-959.
Gershman NH, Wong HH, Liu JT, Fahy JV. Low- and high-dose fluticasone propionate
in asthma; effects during and after treatment. Eur Resp J 2000;15:11-18.
Gibson PG, Girgis-Gabardo A, Morris MM, Mattoli S, Kay JM, Dolovich J, Denburg J,
Hargreave FE. Cellular characteristics of sputum from patients with asthma and

75
chronic bronchitis. Thorax 1989a;44:693-699.
Gibson PG, Dolovich J, Denburg J, Ramsdale EH, Hargreave FE. Chronic cough:
eosinophilic inflammation without asthma. Lancet 1989b;i:1346-1348.
Gibson PG, Wong PO, Hepperle MJE, Kline PA, Girbis-Gabardo A, Guyatt G, Dolovich
J, Denburg JA, Ramsdale EH, Hargreave FE. A research method to induce and
examine mild exacerbation of asthma by withdrawal of inhaled corticosteroid. Clin
Exp Allergy 1992;22:525-532.
Gibson PG, Hargreave FE, Girbis-Gabardo A, Morris M, Denburg JA, Dolovich J.
Chronic cough with eosinophilic bronchitis: examination for variable airway
obstruction and response to corticosteroids. Clin Exp Allergy 1995;25:127-132.
Gibson PG, Zlatic K, Scott J, Sewell W, Woolley K, Saltos N. Chronic cough resembles
asthma with IL-5 and granulocyte-macrophage colony-stimulating factor gene
expression in bronchoalveolar cells. J Allergy Clin Immunol 1998a;101:320-326.
Gibson PG, Wlodarczyk J, Hensley MJ, Gleeson M, Henry RL, Cripps AW, Clancy RL.
Epidemiological association of airway inflammation with asthma symptoms and
airway hyperresponsiveness in childhood. Am J Respir Crit Care Med
1998b;158:36-41.
Gibson P, Woolley K, Carty K, Murree-Allen K, Saltos N. Induced sputum eosinophil
cationic protein (ECP) measurement in asthma and chronic obstructive airway disease
(COAD). Clin Exp Allergy 1998c;28:1081-1088.
Gibson PG, Norzila MZ, Fakes K, Simpson J, Henry RL. Pattern of airway inflammation
and its determinants in children with acute severe asthma. Pediatr Pulmonol
1999;28:261-270.
Gibson PG. Monitoring of patients with asthma: An evidence-based approach. J Allergy
Clin Immunol 2000; 106:17-26.
Girbis-Gabardo A, Kanai N, Denburg JA, Hargreave FE, Jordana M, Dolovich J.
Immunocytochemical detection of granulocyte-macrophage colony-stimulating factor
and eosinophil cationic protein in sputum cells. J Allergy Clin Immunol
1994;93:945-947.
Gollasch H. Zur Kenntniss der asthmatischen Sputums. Fortschritte der Medizin
(Berlin) 1889;7:361-365.
Gravelyn TR, Pan PM, Eschenbacher WL. Mediator release in an isolated airway
segment in subjects with asthma. Am Rev Respir Dis 1988;137:641-646.
Grebski E, Grf Ch, Hinz G, Wüthrich D, Medici TC. Eosinophilic cationic protein in
sputum is dependant on temperature and time. Eur Resp J 1998;11:734-737.
Griffin E, Håkansson L, Formgren H, Jörgensen K, Peterson C, Venge P. Blood
eosinophil number and activity in relation to lung function in patients with asthma and
with eosinophilia. J Allergy Clin Immunol 1991;87:548-557.
76
Grootendorst DC, Sont JK, Willems LNA, Kluin-Nelemans JC, Van Krieken JH,
Veselic-Charvat M, Sterk PJ. Comparison of inflammatory cell counts in asthma:
induced sputum versus bronchoalveolar lavage and bronchial biopsies. Clin Exp
Allergy 1997;27:769-779.
Grootendorst DC, van den Bos J-W, Romeijn JJ, Veselic-Charvat M, Duiverman EJ,
Vrijlandt EJ, Sterk PJ, Roldaan AC. Induced sputum in adolescents with severe
stable asthma. Safety and the relationship of cell counts and eosinophilic cationic
protein to clinical severity. Eur Resp J 1999;13:647-653.
Haahtela T, Lindholm H, Björksten F, Koskenvuo K, Laitinen LA. Prevalence of asthma
in Finnish young men. Br Med J 1990;301:266-268.
Haahtela T, Järvinen M, Kava T, Kiviranta K, Koskinen S, Lehtonen K, Nikander K,
Persson T, Reinikainen K, Selroos O. Comparison of a β2-agonist, terbutaline, with an
inhaled corticosteroid, budenoside, in newly detected asthma. N Engl J Med
1991;325:388-392.
Haahtela T, Järvinen M, Kava T, Kiviranta K, Koskinen S, Lehtonen K, Nikander K,
Persson T, Selroos O. Sovijarvi A. Effects of reducing or discontinuing inhaled
budesonide in patients with mild asthma. N Engl J Med 1994;331:700-705.
Haahtela T, Laitinen LA. Asthma Programme in Finland 1994-2004. Report of a working
group. Clin Exp Allergy 1996;26: suppl 1.
Haahtela T. Early treatment of asthma. Allergy 1999;54(Suppl. 49);74-81.
Haahtela T, Klaukka T, Koskela K, Erhola M, Laitinen LA. Working Group of the
Asthma Programme in Finland 1994-2004. Asthma programme in Finland:
a community problem needs community solutions. Thorax 2001;56:806-14.
Hamzaoui A, Brahim MB, Zhioua A, Ayed K, Hamzaoui K. Inflammatory response in
induced sputum mononuclear cells from patients with acute exacerbations of asthma.
Med Inflam 2000;9:147-153.
Hanley JA, McNeil BJ. The meaning and use of area under a receiver operating
characteristic (ROC) curve. Radiology 1982;143:29-36.
Hanley JA, McNeil BJ. A method of comparing the areas under receiver operating
characteristic curves derived from the same cases. Radiology 1983;148:839-843.
Hansel FK. Allergy in relation to otolaryngology. St Paul and Minneapolis, NM: Bruce,
1949.
Hansel TT, Walker C. The migration of eosinophils into sputum of asthmatics: the role of
adhesion molecyles. Clin Exp Allergy 1992;22:345-356.
Hansel TT, Braunstein JB, Walker C, Blaser K, Bruijnzeel PLB, Virchow JC, Virchow C.
Sputum eosinophils from asthmatics express ICAM-1 and HLA-DR. Clin Exp
Immunol 1991;86:271-277.
Hargreave FE, Pizzichini MM, Pizzichini E. Assessment of airway inflammation. In

77
Asthma, edited by Barnes PJ, Grunstein MM, Leff AR, and Woolcock A. Lippincott-
Raven Publishers, Philadelphia, 1997.
Helenius I, Rytilä P, Metso T, Haahtela T, Venge P, Tikkanen HO. Respiratory
symptoms, bronchial responsiveness and cellular characteristics of induced sputum in
elite swimmers. Allergy 1998;53:346-352.
Higgins B, Britton JR, Chinn S, Jones TD, Jenkinson D, Burney PG, Tattesfield AE. The
distribution of peak expiratory flow variability in a population sample. Am Rev Respir
Dis 1989;140:1368-1372.
Holtz O, Jorres RA, Koschyk S, Speckin P, Welker L, Magnussen H. Changes in sputum
composition during sputum induction in healthy and asthmatic subjects. Clin Exp
Allergy 1998a;28:284-292.
Holtz O, Ritcher K, Jorres RA, Speckin P, Mucke M, Magnussen H. Changes in sputum
composition between two inductions performed on consecutive days. Thorax
1998b;53:83-86.
Hunter CJ, Ward R, Woltmann G, Wardlaw AJ, Pavord ID. The safety and success rate of
sputum induction using a low output ultrasonic nebuliser. Respir Med
1999;93:345-348.
in´t Veen JC, de Gouw HW, Smits HH, Son JK, Hiemstra PS, Sterk PJ, Bel EH.
Repeatability of cellular and soluble markers of inflammation in induced sputum of
patients with asthma. Eur Resp J 1996;9:2441-2447.
in ‘t Veen JC, Smits HH, Hiemstra PS, Zwinderman AH, Sterk PJ, Bel EH. Lung
function and sputum characteristics of patients with severe asthma during an induced
exacerbation by double-blind steroid withdrawal. Am J Respir Crit Care Med
1999;160:93-99.
Iredale MJ, Wanklin SA, Phillips IP, Krausz T, Ind PW. Non-invasive assessment of
bronchial inflammation in asthma: no correlation between eosinophilia of induced
sputum and bronchial responsiveness to inhaled hypertonic saline. Clin Exp Allergy
1994;24:940-945.
Irwin RS, Curley FJ, French CL. Chronic cough: the spectrum and frequency of causes,
key components of the diagnostic evaluation, and outcome of specific therapy. Am Rev
Resp Dis 1990;141:640-647.
ISAAC. The International Study of Asthma and Allergies in Childhood Steering
committee. Woldwide variations in prevalence of symptoms of asthma, allergic
rhinoc onjunctivitis and atopic eczema. Lancet 1998;351:1225-1232.
Jarjour NN, Peters SP, Djukanovic R, Calhoun WJ. Investigative use of bronchoscopy in
asthma. Am J Respir Crit Care Med 1998;157:692-697.
Jatakanon A, Lim S, Chung KF, Barnes PJ. An inhaled steroid improves markers of
airway inflammation in patients with mild asthma. Eur Respir J 1998a;12:1084-1088.

78
Jatakanon A, Lim S, Kharitonov SA, Chung KF, Barnes PJ. Correlation between exhaled
nitric oxide, sputum eosinophils and methacholine responsiveness in patients with mild
asthma. Thorax 1998b;53:91-95.
Jatakanon A, Kharitonov S, Lim S, Barnes PJ. Effect of differing doses of inhaled
budesonide on markers of airway inflammation in patients with mild asthma. Thorax
1999a;54:108-14.
Jatakanon A, Lalloo UG, Lim S, Chung KF, Barnes PJ. Increased neutrophils and
cytokines, TNF-α and IL-8, in induced sputum of non-asthmatic patients with chronic
dry cough. Thorax 1999b;234-237.
Jatakanon A, Uasuf C, Maziak W, Lim S, Ching KF, Barnes PJ. Neutrophilic
inflammation in severe persistent asthma. Am J Respir Crit Care Med
1999c;160:1532-1539.
Jatakanon A, Lim S, Barnes PJ. Changes in sputum eosinophils predict loss of asthma
control. Am J Respir Crit Care Med 2000;161:64-72.
Jayaram L, Parameswaran K, Sears MR, Hargerave FE. Induced sputum cell counts:
their usefulness in clinical parctice. Eur Resp J 2000;16:150-158.
Juntunen-Backman K, Järvinen P, Sorva R. Serum eosinophil cationic protein during
treatment of asthma in children. J Allergy Clin Immunol 1993;92:34-38.
Karawajczyk M, Pauksen K, Peterson CG, Eklund E, Venge P. The differential release
of eosinophil granule proteins. Studies on patients with acute bacterial and viral
infections. Clin Exp Allergy 1995;25:713-719.
Keating VM, Collins PD, Scott DM, Barnes PJ. Differences in interleukin-8 and tumour
necrosis factor-alfa in induced sputum from patients with chronic obstructive
pulmonary disease or asthma. Am J Respir Crit Care Med 1996;153:530-534.
Keatings VM, Evans JD, O´Connor BJ, Barnes PJ. Cellular profiles in asthmatic airways:
a comparison of induced sputum, bronchial washings and bronchoalveolar lavage.
Thorax 1997a;53:372-374.
Keatings VM, Barnes PJ. Granulocyte activation markers in induced sputum:
Comparison between chronic obstructive pulmonary disease, asthma and normal
subjects. Am J Respir Crit Care Med 1997b;155:449-453.
Keatings VM, Jatakanon A, Worsdell YM, Barnes PJ. Effects of inhaled and oral
glucorticoids on inflammatory indices in asthma and COPD. Am J Respir Crit Care
Med 1997c;155:542-548.
Kelly MM, Leigh R, Horsewood P, Gleich GJ, Cox G, Hargreave FE. Induced sputum:
validity of fluid-phase IL-5 measurement. J Allergy Clin Immunol 2000;105:1162-
1168.
Kendrick AH, Higgs CMB, Whitfield MJ, Laszo G. Accuracy of perception of severity
of asthma: patients treated in general practice. BMJ 1993;307:422-424.
Kharitonov SA, Yates D, Robbins RA, Logan-Sinclair R, Shinebourne EA, Barnes PJ.

79
Increased nitric oxide in exhaled air of asthmatics. Lancet 1994;343:133-135.
Kharitonov SA, Yates DH, Barnes PJ. Inhaled glucocorticoids decrease nitric oxide in
exhaled air of asthmatic patients. Am J Resp Crit Care Med 1996;153:454-457.
Kharitonov SA, Barnes PJ. Clinical aspects of exhaled nitric oxide. Eur Resp J
2000;16:781-792.
Kilpeläinen M. Asthma and allergic rhinoconjunctivitis among university students -
occurrence and risk factors. Annales Universitatis Turkuensis 2001.
Kidney JC, Wong AG, Efthimiadis A, Morris MM, Sears MR, Dolovich J, Hargreave FE.
Elevated B cells in sputum of asthmatics. Close correlation with eosinophils. Am J
Respir Crit Care Med 1996;153:540-544.
Kips JC, Rytilä PH, Peleman RA, Joos, GF, Pauwels RA. Evaluation of within subject
variability of sputum cell counts [abstract]. Am J Respir Crit Care Med 1995;151
(Suppl. 4):A386.
Kips JC, Fahy JV, Hargreave FE, Ind PW, in´t Veen JCCM. Methods for sputum
induction and analysis of induced sputum: a method for assessing airway inflammation
in asthma. Eur Respir J 1998;11:9s-12s.
Kips JC, O´Connor B, Inman MD, Svensson K, Pauwels RA, O´Byrne PM. A long-term
study of the anti-inflammatory effect of low-dose budesonide plus formoterol versus
high-dose budesonide in asthma. Am J Respir Crit Care Med 2000;161:996-1001.
Kramer MS, Feinstein AR. Clinical biostatistics: LIV. The biostatistics of concordance.
Clin Pharmacil Ther 1981;29:111-123.
Lacoste J-Y, Bousquet J, Chanez P, Van Vyve T, Simony-Lafontaine J, Lequeu N, Vic P,
Enander I, Giodard P, Michel F-B. Eosinophilic and neutrophilic inflammation in
asthma, chronic bronchitis and chronic obstructive pulmonary disease. J Allergy Clin
Immunol 1993;92:537-528.
Laitinen LA, Heino M, Laitinen A, Kava T, Haahtela T. Damage of the airway
epithelium and bronchial reactivity in patients with asthma. Am Rev Respir Dis
1985;31:99-606.
Laitinen A, Haahtela T. A comparative study of the effects of an inhaled corticosteriod,
budesonide, and a β2-agonist, terbutaline, on airway inflammation in newly
diagnosed asthma. A randomised, double-blind, parallel-group controlled trial. J
Allergy Clin Immunol 1992:90:32-42.
Laitinen LA, Laitinen A, Haahtela T. Airway mucosal inflammation even in patients with
newly diagnosed asthma. Am Rev Respir Dis 1993;147:697-704.
Laitinen LA, Koskela K. Chronic bronchitis and chronic obstructive pulmonary disease:
Finnish National Guidelines for Prevention and Treatment 1998-2007. Resp Med
1999;93:297-332.
Law SK, Micklem KJ, Shaw JM, Zhang XP, Dong Y, Willis AC, Mason DY. A new
macrophage differentiation antigen which is a member of the scavenger receptor
80
superfamily. Eur J Immunol 1993;23:2320-2325.
Lebowitz MD, Postma DS, Burrows B. Adverse effects of eosinophilia and smoking on
the natural history of newly diagnosed chronic bronchitis. Chest 1995;108:55-61.
Leigh R, Sharon RF, Efhimiadis A, Hargreave FE, Kitching AD. Diagnosis of
left-ventricular dysfunction from induced sputum examination. Lancet
1999;354:833-834.
Lemière C, Efthimiadis A, Hargreave FE. Occupational eosinophilic bronchitis without
asthma: An unknown occupational airway disease. J Allergy Clin Immunol
1997;100:852-853.
Lim S, Jatakanon A, John M, Gilbey T, O´Connor B, Chung KF, Barnes PJ. Effect of
inhaled budesonide on lung function and airway inflammation. Assessment of
various inflammatory markers in mild asthma. Am J Respir Crit Care Med
1999;159:22-30.
Lim S, Jatakanon A, Meah S, Oates T, Chung KF, Barnes PJ. Relationship between
exhaled nitric oxide and mucosal eosinophilic inflammation in mild to moderately
severe asthma. Thorax 2000;55:184-188.
Linden M, Rasmussen JB, Piitulainen E, Tunek A, Larson M, Tegner H, Venge P,
Laitinen LA, Brattsand R. Airway inflammaton in smokers with non-obstructive and
obstructive chronic bronchitis. Am Rev Respir Dis 1993;148:1226-1232.
Louis R, Shute J, Biagi S, Stanciu L, Marrelli F, Tenor H, Hidi R, Djukanovic R. Cell
infiltration, ICAM-1 expression, and eosinophil chemotactic activity in asthmatic
sputum. Am J Respir Crit Care Med 1997;155:466-472.
Louis R, Shute J, Goldring K, Perks B, Lau LCK, Radermecker M, Djukanovic R. The
effect of processing on inflammatory markers in induced sputum. Eur Respir J
1999;13:660-667.
Louis R, Lau LC, Bron AO, Roldaan AC, Radermecker R, Djukanovic R. The
relationship between airways inflammation and asthma severity. Am J Respir Crit Care
Med 2000a;161:9-16.
Louis R, Bettiol J, Cataldo D, Sele J, Henquet M, Radermecker M. Effect of 4-week
treatment with theophylline on sputum eosinophilia and sputum eosinophil
chemotactic activity in steroid-naive asthmatics. Clin Exp Allergy
2000b;30:1151-1160.
Lönnkvist K, Hallden G, Dahlen SE, Enander I, van-Hage Hamsten M, Kumlin M,
Hedlin G. Markers of inflammation and bronchial reactivity in children with asthma
exposed to animal dander in school dust. Pediatr Allergy Immunol 1999;10:45-52
Maestrelli P, Calcagni PG, Saetta M, Di Stefano A, Hosselet J-J, Santonastaso A, Fabbri
LM, Mapp CE. Sputum eosinophilia after asthmatic responses induced by isocyanates
in sensitized subjects. Clin Exp Allergy 1994;24:29-34.

81
Maestrelli P, Saetta M, Di Stefano A, Calcagni PG, Turano G, Ruggieri MP, Roggeri A,
Mapp CE, Fabbri LM. Comparison of leukocyte counts in sputum, bronchial biopsies,
and bronchoalveolar lavage. Am J Respir Crit Care Med 1995;152:1926-1931.
Maestrelli P, Calcagni PG, Saetta M, Bertin T, Mapp CE, Sanna A, Veriter C, Fabbri LM,
Stanescu D. Integrin upregulation on sputum neutrophils in smokers with chronic
airway obstruction. Am J Respir Crit Care Med 1996;154:1296-1300.
Makker HK, Holgate ST. The contribution of neurogenic reflexes to hypertonic
saline-induced bronchoconstriction in asthma. J Allergy Clin Immunol 1993;92:82-88.
Marquet C, Jouen-Boedes F, Dean TP, Warner O. Bronchoalveolar cell profiles in
children with asthma, infantile wheeze, chronic cough, or cystic fibrosis. Am J Respir
Crit Care Med 1999;159:1553-1540.
Martin TR, Raghu G, Maunder RJ, Spingmeyer SC. The effects of chronic bronchitis
and chronic air-flow obstruction on lung cell populations recovered by
bronchoalveolar lavage. Am Rev Respir Dis 1985;132:254-260.
Mattes J, Storm-van’s Gravesande K, Reining U, Alving K, Ihorst G, Henschen M,
Kuehr J. NO in exhaled air is correlated with markers of eosinophilic airway
inflammation in corticosteroid-dependent childhood asthma. Eur Respir J
1999;13:1391-5.
McGarvey LP, Forsythe P, Heaney LG, MacMahon J, Ennis M. Bronchoalveolar
lavage findings in patients with chronic nonproductive cough. Eur Resp J
1999;13:59-65.
Metso T, Kilpiö K, Björkstén F, Kiviranta K, Haahtela T. Can early asthma be
confirmed with laboratory tests? Allergy 1996;51:226-231.
Metso T, Kilpiö K, Björksten F, Kiviranta K, Haahtela T. Detection and treatment of
early asthma. Allergy 2000;55:505-509.
Metso T, Rytilä P, Peterson C, Haahtela T. Granulocyte markers in induced sputum in
patients with respiratory diseases and healthy persons obtained by two sputum
processing methods. Respiratory Med 2001;95:48-55.
Metso T, Venge P, Haahtela T, Peterson C, Sevéus L. Cell specificity of new
inflammatory markers EPO and HNL in peripheral blood, sputum, and BAL. Thorax
2002, in press.
Millqvist E, Bende M, Löwhagen O. Sensory hyperreactivity - a possible mechanism
underlying cough and asthma-like symptoms. Allergy 1998;53:1208-1212.
Montuschi P, Corradi M, Ciabattoni G, Nightingale J, Kharitonov SA, Barnes PJ.
Increased 8-isoprostane, a marker of oxidative stress, in exhaled condensate of asthma
patients. Am J Respir Crit Care Med 1999;160:216-220.
Moodley YP, Krishnan V, Lalloo UG. Neutrophils in induced sputum arise from central
airways. Eur Resp J 2000;15:36-40.
Naylor B. The shedding of the mucosa of the bronchial tree in asthma. Thorax

82
1962;17:69-72.
NHLBI/WHO Workshop Report. Sheffer AL (ed). Global Strategy for Asthma
Management and Prevention. National Institutes of Health, National Heart, Lung and
Blood Institute, Publication No. 95-3659, January 1995.
NHLBI: National Heart, Lung and Blood Institute. National Asthma Education and
Prevention Program. Expert Panel Report 2: Guidelines for the Diagnosis and
Management of Asthma. Bethesda, Md., U.S. 1997. Publication no. 97-4051.
Niewoehner DE, Erbland ML, Deupree RH, Collins D, Gross NJ. Light RW,Anderson P,
Morgan NA. Effect of systemic glucocorticoids of exacerbations of chronic
obctructive pulmonary disease. N Engl J Med 1999;340:1941-1947.
Nightingale JA, Rogers DF, BArnes PJ. Effect of repeated sputum induction on cell
counts in normal volunteers. Thorax 1998;53:87-90.
Niimi A, Amitani R, Suzuki K, Tanaka E, Murayama T, Kuze F. Eosinophilic
inflammation in cough variant asthma. Eur Resp J 1998;11:1064-1069.
Nordenhäll C, Pourazar J, Blomberg A, Levin J-O, Sandström T, Ädelroth E. Airway
inflammation following exposure to diesel exhaust. A study of time kinetics using
induced sputum. Eur Resp J 2000;15:1046-1051.
Norzila MZ, Fakes K, Henry RL, Simpson J, Gibson P. Interleukin-8 secretion and
neutrophil recruitment accompanies induced sputum eosinophil activation in children
with acute asthma. Am J Respir Crit Care Med 2000;161:769-774.
O’Connell JM, Baird LI, Cambell AH. Sputum eosinophilia in chronic bronchitis and
asthma. Respiration 1978;35:65-72.
Oh JW, Lee HB, Kim CR, Yum MK, Koh YJ, Moon SJ, Kang JO, Park IK. Analysis of
induced sputum to examine the effects of inhaled corticosteroid on airway
inflammation in children with asthma. Ann Allergy Asthma Immunol 1999;82:491-6.
Olivenstein R, Taha R, Minshall EM, Hamid QA. IL-4 and IL-5 mRNA expression in
induced sputum of asthmatic subjects: comparison with bronchial wash. J Allergy
Clin Immunol 1999;103:238-145.
Pallasaho P, Lundbäck P, Läspä SL, Jonsson E, Kotaniemi J, Sovijärvi AR, Laitinen
LA. Increasing prevalence of asthma but not chronic bronchitis in Finland? Report
from the FinEsS-Helsinki Study. Resp Med 2000;93:728-809.
Parameawaran K, Pizzichini E, Pizzichini MM, Hussack P, Efthimiadis A, Hargreave FE.
Clinical judgement of airway inflammation versus sputum cell counts in patients with
asthma. Eur Resp J 2000a;15:486-490.
Parameawaran K, Anvari M, Efthimiadis A, Kamada D, Hargreave FE, Allen CJ.
Lipid-laden macrophages in induced sputum as a marker of oropharyngeal reflux and
possible acid aspiration in gastro-esophageal reflux. Eur Resp J 2000b;16:1119-1122.
Partti-Pellinen K, Marttila O, Makinen-Kiljunen S, Haahtela T. Occurrence of dog, cat,
and mite allergens in public transport vehicles. Allergy 2000;55:65-68
83
Pauwels RA, Löfdahl CG, Laitinen LA, Schouten JP, Postma DS, Pride NB, Ohlsson SV.
Long-term treatment with inhaled budesonide in persons with mild chronic obstructive
pulmonary disease who continue smoking. N Engl J Med 1999;340:1948-1953.
Pavia D, Thomson ML, Clarke SW. Enhanced clearance of secretions from the human
lung after the administration of hypertonic saline aerosol. Am Rev Respir Dis
1978;117:199-203.
Pavord ID. Sputum induction to assess airway inflammation: is it an inflammatory
stimulus? Thorax 1998;53:79-80.
Pavord ID, Ward R, Woltmann G, Wardlaw AJ, Sheller JR, Dworski R. Induced sputum
eicosanoid concentrations in asthma. Am J Respir Crit Care Med 1999;160:1905-1909.
Peleman RA, Rytilä PH, Kips JC, Joos, GF, Pauwels RA. Sputum analysis in chronic
obstructive pulmonary disease (COPD): Comparison of two methods [abstract]. Am
J Respir Crit Care Med 1995;151(Suppl. 4):A486
Pelkonen AS, Hakulinen AL, Turpeinen M. Bronchial lability and responsiveness in
schoolchildren born very preterm. Am J Respir Crit Care Med 1997;156:1178-1184.
Pelkonen AS, Nikander K, Turpeinen M. Reproducibility of home spirometry in children
with newly diagnosed asthma. Pediatr Pulmonol 2000;29:34-38.
Piacentini GL, Martinati L, Mignoni S, Boner AL. Influence of allergen avoidance on the
eosinophil phase of airway inflammation in children with allergic asthma. J Allergy
Clin Immunol 1996;97:1079-1084.
Piacentini GL, Bodini A, Costella S, Vicentini L, Mazzi P, Sperandio S, Boner AL.
Exhaled nitric oxide and sputum eosinophil markers of inflammation in asthmatic
children. Eur Respir J 1999;13:1386-90
Pin I, Gibson PG, Kolendowicz R, Girgis-Gabardo A, Denburg JA, Hargreave FE,
Dolovich J. Induced sputum cell counts: a non-invasive method to investigate airway
inflammation in asthma. Thorax 1992a;47:25-29.
Pin I, Freitag AP, O’Byrne PM, Girbis-Garbaro A, Watson RM, Dolovich J, Denburg
JA, Hargreave FE. Changes in the cellular profile of induced sputum after allergen-
induced asthmatic responses. Am Rev Respir Dis 1992b;45:1265-1269.
Pin I, Radford S, Kolendowicz R, Jennigs B, Denburg JA; Hargreave FE, Dolovich J.
Airway inflammation in symptomatic and asymptomatic children with metacholine
hyperresponsiveness. Eur Resp J 1993;6:1249-1256.
Pizzichini E, Pizzichini MM, Efthimiadis A, Evans S, Morris MM, Squillace D, Gleich
GJ, Dolovich J, Hargreave FE. Indices of airway inflammation in induced sputum:
reproducibility and validity of cell and fluid phase measurements. Am J Respir Crit
Care Med 1996a;154:308-317.
Pizzichini E, Pizzichini MM, Efthimiadis A, Hargreave FE, Dolovich J. Measurement of
inflammatory indices in induced sputum: Effects of selection of sputum to minimise
salivary contamination. Eur Respir J 1996b;9:1174-80

84
Pizzichini MM, Popov T, Efthimiadis A, Hussack P, Evans S, Pizzichini E, Dolovich J,
Hargreave FE. Spontaneous and induced sputum to measure indices of airway
inflammation Am J Respir Crit Care Med 1996c;154:866-869.
Pizzichini MM, Pizzichini E, Clelland L, Efthimiadis A, Mahony J, Dolovich J,
Hargreave FE. Sputum in severe exacerbations of asthma. Kinetics of inflammatory
indices after prednisone treatment. Am J Respir Crit Care Med 1997a;155:1501-1508.
Pizzichini E, Pizzichini MM, Efthimiadis A, Dolovich J, Hargreave FE. Measuring
airway inflammation in asthma: eosinophils and eosinophilic cationic protein in
in duced sputum compared with peripheral blood. J Allergy Clin Immunol
1997b;99:539-544.
Pizzichini E, Pizzichini MM, Gibson P, Parameswaran K, Gleich GJ, Berman L,
Dolovich J, Hargreave FE. Sputum eosinophilia predicts benefit from prednisone in
smokers with chronic obstructive bronchitis. Am J Respir Crit Care Med
1998a;158:1511-1517.
Pizzichini E, Pizzichini MM, Kidney JC, Efthimiadis A, Hussack P, Popov T, Cox G,
Dolovich J, O´Byrne P, Hargreave FE. Induced sputum, bronchoalveolar lavage and
blood from mild asthmatics: inflammatory cells, lymphocyte subsets and soluble
markers compared. Eur Resp J 1998b;11:828-834.
Pizzichini E, Leff JA, Reiss TF, Hendeles L, Boulet L-P, Wei LX, Efthimiadis AE, Zhang
J, Hargreave FE. Montelukast reduces airway eosinophilic inflammation in asthma: a
randomised, controlled trial. Eur Resp J 1999a;14:12-18.
Pizzichini MM, Pizzichini E, Clelland L, Efthimiadis A, Pavord I, Dolovich J, Hargreave
FE. Prednisone-dependent asthma: inflammatory indices in induced sputum. Eur
Respir J 1999b;13:15-21.
Polgar G, Promadhat V. Pulmonary function testing in children: techniques and
standards. WB Saunders, Philadelphia 1971; 42-212.
Popov T, Gottschalk R, Kolendowicz R, Dolovich J, Powers P, Hargreave FE. The
evaluation of a cell dispersion method of sputum examination. Clin Exp Allergy
1994;24:778-783.
Popov T, Pizzichini MM, Pizzichini E, Kolendowicz R, Punthakee Z, Dolovich J,
Hargreave FE. Some technical factors influencing the induction of sputum for cell
analysis. Eur Respir J 1995;8:559-565.
Profita M, Sala A, Riccobono L, Paterno A, Mirabella A, Bonanno A, Guerrera D, Pace
E, Bonsignore G, Bousquet J, Vignola AM. 15-lipoxygenase expression and 15(S)-
hydroxyeicoisatetraenoic acid release and reincorporation in induced sputum of
asthmatic subjects. J Allergy Clin Immunol 2000;105:711-16.
Purokivi M, Randell J, Hirvonen M-R, Tukiainen H. Reproducibility of measurements of
exhaled NO, and cell count and cytokine concentrations in induced sputum. Eur Resp J

85
2000;16:242-246.
Quanjer PhH, Tammeling GJ, Cotes JE, Pedersen OF, Peslin R, Yernault J-C. Lung
volumes and forced ventilatory flows. Report Working Party Standardisation of Lung
Function Tests, European Community for Steel and Coal. Official Statement of the
European Respiratory Society. Eur Resp J 1993; 6(Suppl.16): 5-40.
Remes ST, Korppi M, Remes K. Outcome of children with respiratory symptoms
without objective evidence of asthma: a two-year, prospective, follow-up study. Acta
Paediatr 1998;87:165-8.
Richman-Eisenstat JB, Jorens P, Hebert CA, Ueki I, Nadel JA. Interleukin-8: an
important chemoattractant in sputum of patients with chronic inflammatory airway
diseases. Am J Physiol 1993;264:L413-L418.
Richmond I, Booth H, Ward C, Walters EH, Intrasubject variability in airway
inflammation in biopsies in mild to moderate asthma. Am J Respir Crit Care Med
1996;153:899-903.
Richter K, Holz O, Jorres RA, Mucke M, Magnussen H. Sequentially induced sputum in
patients with asthma or chronic obstructive pulmonary disease. Eur Respir J
1999;14:697-701.
Rijcken B, Schouten JP, Xu X, Rosner B, Weiss ST. Airway hyperresponsiveness to
histamine associated with accelerated decline in FEV1. Am J Respir Crit Care Med
1995;151:1377-1382.
Ronchi MC, Piragino C, Rosi E, Stendardi L, Tanini A, Galli G, Duranti R, Scano G. Do
sputum eosinophils and ECP relate to the severity of asthma. Eur Resp J
1997;10:1809-1813.
Rosi E, Scano G. Association of sputum parametrs with clinical and functional
measurements in asthma. Thorax 2000;55:235-238.
Rutgers SR, Timens W, Kaufmann HF, van der Mark ThW, Koëter GH, Postma DS.
Comparison of induced sputum with bronchial wash, bronchoalveolar lavage and
bronchial biopsies in COPD. Eur Resp J 2000;15:109-115.
Saetta M, Di Stefaro A, Maestrelli P, Ferraresso A, Drigo R, Potena A, Ciaccia A, Fabbri
LM. Activated T-lymphocytes and macrophages in bronchial mucosa of subjects with
chronic bronchitis. Am Rev Respir Dis 1993;147:301-306.
Saetta M, Di Stefaro A, Maestrelli P, Turato G, Ruggieri MP, Roggeri A, Calcagni P,
Mapp CE, Ciaccia A, Fabbri LM. Airway eosinophilia in chronic bronchitis during
exacerbations. Am J Respir Crit Care Med 1994;50:646-1652.
Saetta M, Di Stefano A, Turato G, De Caro R, Borghignon D, Holgate ST, Fabbri LM.
Fatal asthma attack during an inhalation challenge with ultrasonically nebulized
distilled water. J Allergy Clin Immunol 1995;95:1285-1287.
Saetta M, Di Stefaro A, Maestrelli P, Turato G, Mapp CE, Pieno M, Zanguochi G, Del
Prete G, Fabbri LM. Airway eosinophilia and expression of interleukin-5 protein in

86
asthma and exacerbations of chronic bronchitis. Clin Exp Allergy 1996;26:766-774.
Shah RR, Dye WE. Use of dithiothreitol to replace N-acetyl-L-cysteine for routine
sputum digestion - decontamination for culture of mycobacteria. Am Rev Respir Dis
1965;94:454.
Siersted HC, Mostgaard G, Hyldebrandt N, Hansen HS, Boldsen J, Oxhøj H.
Interrelationships between diagnosed asthma, asthma like symptoms, and abnormal
airway behaviour in adolescence: the Odense Schoolchild Study. Thorax
1996;51:503-509.
Sluiter HJ, Koeter GH, de Monchy JGR., Postma DS, deVries K, Orie NGM. The Dutch
hypothesis (chronic non-specific lung disease) revisited. Eur Respir J 1991;4:479-489.
Smith CM, Anderson SD. Inhalation provocation tests using non-isotonic aerosols. J
Allergy Clin Immunol 1989;84:781-790.
Snider GL, Kleinerman J, Thurlbeck WM, Begali ZK. The definition of emphysema: a
report of a National Heart, Lung and Blood Institute, Division of Lung Diseases,
Workshop. Am Rev Resp Dis 1985;132:182-185.
Sont JK, Willems LN, Bel EH, van Krieken JH, Vanderbroucke JP, Sterk PJ and the
EMPUL Study Group. Clinical control and histopathologic outcome of asthma when
using airway hyperresponsivness as an additional guide to long-term treatment. Am J
Respir Crit Care Med 1999;159:1043-1051.
Sorva R, Metso T, Turpeinen M, Juntunen-Backman K, Björkstén F, Haahtela T.
Eosinophil cationic protein in induced sputum as a marker of inflammation in
asthmatic children. Pediatr Allergy Immunol 1997;8:45-50.
Sovijärvi ARA, Malmberg P, Reinikainen K, Rytilä P, Poppius H. A rapid dosimetric
method with controlled tidal breathing for histamine challenge. Repeatability and
distribution of bronchial reactivity in a clinical material. Chest 1993;104:164-170.
Spanevello A, Beghè B, Bianchi A, Migliori GB, Ambrosetti M, Neri M, Ind PW.
Comparison of two methods of processing induced sputum: selected versus entire
sputum. Am J Respir Crit Care Med 1998;157:665-668.
Spanevello A, Vignola AM, Bonanno A, Confalonieri E, Crimi E, Brusasco V. Effect of
methacholine challenge on cellular composition of sputum induction. Thorax
1999;54:37-39.
Spanevello A, Confalonieri M, Sulutto F, Romano F, Balzano G, Migliori GB, Bianchi
A, Michetti G. Induced sputum cellularity. Reference values and distribution in normal
volunteers. Am J Respir Crit Care Med 2000;162:1172-1174.
Stanescu D, Sanna A, Veriter C, Kostianev S, Calcagni PG, Fabbri LM, Maestrelli P.
Airways obstruction, chronic expectoration, and rapid decline in FEV1 in smokers are
associated with increased levels of sputum neutrophils. Thorax 1996;51:267-271.
Stockley RA, Bayley DL. Validation of assays for inflammatory mediators in sputum.
Eur Respir J 2000;15:778-781.

87
Sur S, Glitz DG, Kita H, Kujawa SM, Peterson EA, Weiler DA, Kephart GM, Wagner
JM, George TJ, Gleich GJ, Leiferman KM. Localization of eosinophil-derived
neurotoxin and eosinophil cationic protein in neutrophilic leukocytes. J Leukoc Biol
1998;63:715-722.
Tanaka H, Miyazaki N, Oashi K, Tanaka S, Ohmichi M, Abe S. Sputum matrix
metalloproteinase-9: tissue inhibitor of metalloproteinase-1 ratio in acute asthma.
J Allergy Clin Immunol 2000;105:900-905.
ten Brinke A, de Lange C, Zwinderman AH, Rabe KF, Sterk PJ. Sputum induction in
severe asthma by a standardized protocol. Predictors of excessive bronchocontriction.
Am J Respir Crit Care Med 2001;164:749-753.
Thompson AB, Daughton D, Robbins RA, Ghafouri MA, Oehlerking M, Rennard SI.
Intraluminal airway inflammation in chronic bronchitis. Am Rev Respir Dis
1989;140:1527-1537.
Tomaki M, Ichinose M, Miura M, Hirayama Y, Yamauchi H, Nakajima N, Shirato K.
Elevated substance P content in induced sputum from patients with asthma and
patients with chronic bronchitis. Am J Respir Crit Care Med 1995;151:613-617.
Trigg CJ, Nicholson KG, Wang JH, Ireland DC, Jordan S, Duddle JM, Hamilton S,
Davies RJ. Bronchial inflammation and the common cold: a comparison of atopic and
non-atopic individuals. Clin Exp Allergy 1996;26:665-676.
Turnbull LS, Turnbull LW, Leitch AG, Crofton JW, Kay AB. Mediators of
immediate-type hypersensitivity in sputum from patients with chronic bronchitis and
asthma. Lancet 1977;i:526-529.
Turner MO, Hussack P, Sears MR, Dolovich J, Hargreave FE. Exacerbations of asthma
without sputum eosinophilia. Thorax 1995;50:1057-1061.
Turpeinen M and the HEICA Study Group. Helsinki early intervention childhood asthma
(HEICA) study: inhaled budesonide halved the number of asthma exacerbations
compared with inhaled disodium cromoglycate during 18 months of treatment
[abstract]. Eur Resp J 2000;16(Suppl.31):301s.
Twaddell SH, Gibson PG, Carty K, Woolley K, Henry RL. Assessment of airway
inflammation in children with acute asthma using induced sputum. Eur Respir J
1996;9:2104-8.
Ulrik CS. Perepheral eosinophil counts as a marker of disease activity in intrinsic and
extrinsic asthma. Clin Exp Allergy 1995;25:820-827.
Umeno E, McDonald DM, Nadel JA. Hypertonic saline increases vascular permeability
in the rat trachea by producing neurogenic inflammation. J Clin Invest 1990;85:905-8.
US Surgeon General. The health consequences of smoking: chronic obstructive lung
disease. Public Health Service. Washington, DC. U.S. Goverment printing office 1984.
Ward C, Gardiner PV, Booth H, Walters EH. Intrasubject variability in airway
inflammation sampled by bronchoalveolar lavage in stable asthmatics. Eur Respir J
88
1995;8:1866-1871.
Ward R, Woltmann G, Wardlaw AJ, Pavord ID. Between-observer repeatability of
sputum differential cell counts. Influence of cell viability and squamous cell
contamination. Clin Exp Allergy 1998;29:248-252.
Warner JO, Naspitz CK, editors. Third International Paediatric Consensus Statement on
the Management of Childhood Asthma. Pediatr Pulmol 1998;25:1-17.
Weiss KB, Gergen PJ, Hogdson TA. An economic evaluation of asthma in the United
States. N Engl J Med 1992;326:862-866.
Venge P, Byström L, Carlson M, Håkansson L, Karawacjzyk M, Peterson C, Sevéus L,
Trulson A. Eosinophilic cationic protein (ECP): molecular and biological properties
and the use of ECP as a marker of eosinophil activation in disease. Clin Exp Allergy
1999;29:1172-1186.
Venge P, Byström L, Håkansson L, Moberg L. Eosinophil cationic protein (ECP) is taken
up by and stored in neutrophil granulocytes [abstract]. Allergy Clin Immunol Int
1997;Suppl.4:116.
Wenzel SE, Schwartz LB, Lanmack L, Halliday JL, Trudeau JB, Gibbs RL, Chu HW.
Evidence that severe asthma can be divided pathologically into two inflammatory
subtypes with distinct physiologic and clinical characteristics. Am J Respir Crit Care
Med 1999;160:1001-1008.
Vieira VG, Prolla JC. Clinical evaluation of eosinophils in sputum. J Clin Path
1979;32:1054-1057.
Vignola AM, Chanez P, Campbell AM, Souques F, Lebel B, Enender I, Bousquet J.
Airway inflammation in mild intermittent and in persistent asthma. Am J Respir Crit
Care Med 1998a;157:403-409.
Vignola AM, Bonanno A, Mirabella A, Riccobono L, Mirabella F, Profita M, Bellia V,
Bousquet J, Bonsignore G. Increased levels of elastase and aa1-antitrypsin in sputum
in asthmatic subjects. Am J Respir Crit Care Med 1998b;157:505-511.
Vignola AM, Riccobono L, Mirabella A, et al. Sputum metalloproteinase-9/tissue
inhibitor of metalloproteinase-1 ratio correlates with airflow obstruction in asthma and
chronic bronchitis. Am J Respir Crit Care Med 1999;158:1945-1950.
Vignola AM, Kips J, Bousquet J. Tissue remodeling as a feature of persistent asthma. J
Allergy Clin Immunol 2000;10:1041-53.
Vignola AM, Bousquet J. Rhinitis and asthma: a continuum of disease. Clin Exp Allergy
2001;31:674-677.
Viljanen A. Reference values for spirometric, pulmonary diffusing capacity and body
plethysmographic studies. Scan J Clin Lab Invest 1982;42:1-50.
Wilson NM, Bridge P, Spanevello A, Silverman M. Induced sputum in children:
feasibility, repeatability, and relation of findings to asthma severity. Thorax
2000;55:768-774.
89
Virchow JC, Hölscher U, Virchow C. Sputum ECP levels correlate with parameters of
airflow obstruction. Am Rev Respir Dis 1992;146:604-606.
Wong HH, Fahy JV. Safety of one method of sputum induction in asthmatic subjects. Am
J Respir Crit Care Med 1997;156:299-303.
Wooton OJ, Dulfano MJ. Improved homogenisation techniques for sputum cytology
counts. Ann Allergy 1978;41:150-154.
Workshop summary and guidelines: Investigative use of bronchoscopy, lavage, and
bronchial biopsies in asthma and other airway disease. J Allegy Clin Immunol
1991;58:808-814.
Wright AL, Holberg CJ, Morgan WJ, Taussig LM, Halonen M, Martinez FD. Recurrent
cough in childhood and its relation to asthma. Am J Respir Crit Care Med
1996;153:1249-1265.
Xu SY, Carlson M, Engström A, Garcia R, Peterson CG, Venge P. Purification and
characterisation of a human neutrophil lipocalin (HNL) from the secondary granules of
human neutrophils. Scand J Clin Invest 1994;54:365-376.

90