Induced Seismicity Mitigation Plan
69
Induced Seismicity Mitigation Plan AltaRock Energy, Inc August 3, 2011
Transcript of Induced Seismicity Mitigation Plan

Induced Seismicity Mitigation Plan
AltaRock Energy, Inc
August 3, 2011


TableofContents1 Summary ............................................................................................................................................... 1
2 Background ........................................................................................................................................... 2
2.1 Preliminary Screening ................................................................................................................... 2
2.2 Demonstration Project .................................................................................................................. 3
2.3 Seismicity Background .................................................................................................................. 4
2.4 AltaRock Technology ..................................................................................................................... 8
2.5 Protocol for Induced Seismicity .................................................................................................... 9
3 Pre‐stimulation Activities .................................................................................................................... 10
3.1 Review of Laws and Regulations ................................................................................................. 10
3.1.1 Regulatory Oversight .......................................................................................................... 10
3.1.2 Laws and Regulations Reviewed ......................................................................................... 10
3.2 Communications ......................................................................................................................... 12
3.2.1 Pre‐Stimulation ................................................................................................................... 12
3.2.2 Stimulation .......................................................................................................................... 13
3.2.3 Post‐Stimulation .................................................................................................................. 13
3.3 Seismic Monitoring and Background Seismicity ......................................................................... 14
3.4 Maximum Magnitude Predictions .............................................................................................. 19
3.5 Assessment of Induced Seismicity and Seismic Hazards Risk ..................................................... 21
3.6 Potential Effects of Induced Seismicity ....................................................................................... 24
3.6.1 Populations within the Potential Shake Zone ..................................................................... 24
3.6.2 Vulnerability of Structures .................................................................................................. 25
3.6.3 Damage Claim Procedures .................................................................................................. 27
3.7 Characterize Tectonic and Geologic Setting ............................................................................... 27
3.8 Lessons from Past Injection and EGS Projects ............................................................................ 32
3.9 Recent Injection‐Induced Seismicity Theory ............................................................................... 37
4 Operational Procedures ...................................................................................................................... 38
4.1 Estimated Hydroshear Pressure and Flow Rates ........................................................................ 38
4.2 Step‐Rate Test ............................................................................................................................. 39
4.3 Horizontal Dimensions of EGS Reservoir .................................................................................... 40
4.4 Vertical Dimensions of EGS Reservoir ......................................................................................... 42
4.5 Seismic Monitoring ..................................................................................................................... 43
4.6 Flow‐Back to Reduce Reservoir Pressure and Seismicity ............................................................ 43
4.7 Well Drilling and Circulation Testing ........................................................................................... 45

5 Proposed Controls and Mitigation ...................................................................................................... 46
5.1 Growth, Magnitude and Shaking Limits ...................................................................................... 46
5.2 Exception Reports ....................................................................................................................... 47
5.3 Triggers and Direct Mitigation Actions ....................................................................................... 48
5.4 Indirect Mitigation ...................................................................................................................... 50
6 Conclusion ........................................................................................................................................... 52
7 References .......................................................................................................................................... 53
8 Appendix A – IEA Protocol for Induced Seismicity, Majer et al. (2008) ................................... Attached
9 Appendix B – (Draft) Protocol for Induced Seismicity, Majer et al. (2011) ............................. Attached
10 Appendix C ‐ Compliance Matrices to Induced Seismicity Protocols ................................................. 57
11 Appendix D – Community Outreach Meetings, Presentations and Publications ............................... 58
12 Appendix E – Fugro Report ...................................................................................................... Attached
13 Appendix F – URS Report ‐ Wong et al. (2010) ........................................................................ Attached
14 Appendix G – URS Addendum Report – Wong et al. (2011) .................................................... Attached
15 Appendix H – Structural Assessment of NNVM Assets ............................................................ Attached
16 Appendix I – Geotechnical Assessment of NNVM Assets ........................................................ Attached
17 Appendix J ‐ Damage Claim Form and Instructions ................................................................. Attached
18 Appendix K – Borehole Televiewer Survey Results.................................................................. Attached
19 Appendix L – Borehole Televiewer Log .................................................................................... Attached
20 Appendix M – EGS Site Selection Matrix ................................................................................. Attached
21 Appendix N – DOE Reviewer Comments on ISMP V3 4 Apr 11 ............................................... Attached

TableofFiguresFigure 2‐1. Regional Map Showing Location Of The Newberry EGS Demonstration Well NWG 55‐29 ....... 4
Figure 3‐1. Seismic Energy Recorded On 16 Of 21 Components Of The Currently Installed MSA ............. 16
Figure 3‐2. Final MSA, Including Borehole Installations ............................................................................. 18
Figure 3‐3. Shake Map ................................................................................................................................ 23
Figure 3‐4. Comparison Of PGA Measured At The Geysers To PGA Modeled In Shake Map ..................... 24
Figure 3‐5. Oregon LiDAR Consortium Image From The West Flank Of Newberry Caldera ....................... 29
Figure 3‐6. Rose Diagram Of Lidar Scarps And Fissures .............................................................................. 29
Figure 3‐7. Example Section From BHTV Image .......................................................................................... 31
Figure 3‐8. Basel Stimulation Data. ............................................................................................................. 34
Figure 3‐9. Comparison Of Microseismicity Clouds .................................................................................... 36
Figure 3‐10. Seismogenic Index For Three Different Geothermal Systems ................................................ 37
Figure 4‐1. Estimated Pressure And Flow Rate Ranges For Newberry EGS Demonstration ....................... 39
Figure 4‐2. Cross‐Section And Map Showing Expected EGS Reservoir Area .............................................. 41
Figure 4‐3. Test Equipment To Be Used At Newberry. ............................................................................... 44
Figure 5‐1. Decision Tree For Triggers And Mitigation Actions. ................................................................. 50
TableofTablesTable 2‐1. Comparison Of Quantitative And Qualitative Measures Of Ground Shaking. ............................. 5
Table 2‐2. Worldwide, Annual Counts Of Earthquakes By Magnitude. ........................................................ 6
Table 2‐3. First Eight Of Twelve Levels Of The Modified Mercalli Intensity Scale. ....................................... 7
Table 2‐4. Comparison Of Magnitude And Maximum Mmi. ......................................................................... 8
Table 3‐1. Summary Of Communications And Outreach Plan .................................................................... 14
Table 3‐2. Final MSA Installation Schedule. ................................................................................................ 17
Table 3‐3. Summary of Approaches Used To Estimate Mmax ...................................................................... 20
Table 3‐4. Calculated Probability Of Event Occurrence. ............................................................................. 21
Table 3‐5. Number Of People Outside Area Of Perceivable Shaking .......................................................... 25
Table 3‐6. Number Of Visitors Within Area Of Perceivable Shaking .......................................................... 25
Table 4‐1. Baseline Injection Test Flow Rates And Pressures. .................................................................... 40
Table 4‐2. Step‐Rate Test Flow Rates And Estimated Pressures. ............................................................... 40
Table 4‐3. Contacts For Induced Seismicity Communications .................................................................... 43

Summary Compliance Table
IS Protocol Step (v1, v2) How Step is Addressed Location in This ISMP
Step 1: Perform a preliminary screening evaluation
CalEnergy EIS, Davenport EA, ARE Site Selection criteria analysis
Section 2 – Background
Step 2: Implement an outreach and communication program
ARE public meetings, informational articles in Bend Bulletin, websites, social media sites, daily stimulation and seismicity reporting
Section 3.2 – Communications Section 4.5 – Seismic Monitoring Section 5.2 – Exception Reports Appendix D – Community Outreach Meetings, Presentations, and Publications
Step 5: Educate Stakeholders
Step 4: Establish a Dialogue with Regional Authority
Step 3: Review and select criteria for ground vibration and noise
Building codes‐ Deschutes county, Oregon State Mine Safety
Section 3.1 – Review of Laws and Regulations
Step 1: Review Laws and Regulations
Step 4: Establish local seismic monitoring
Installation of ARE regional and MSA seismic stations
Section 3.3 – Seismic Monitoring and Background Seismicity
Step 6: Establish Microseismic Monitoring Network
Section 4.5 – Seismic Monitoring
Step 5: Quantify the hazard from natural and induced seismic events
URS reports (Appendices F & G), Fugro report (Appendix E), collected background seismicity data, characterized geologic and tectonic setting, considered of previous injection and EGS projects
Section 3.3 – Seismic Monitoring and Background Seismicity Section 3.4 – Maximum Magnitude Predictions Section 3.5 – Assessment of Induced Seismicity and Seismic Hazards Risk Section 3.6 – Potential Effects of Induced Seismicity Section 3.7 – Characterize Tectonic and Geologic Setting Section 3.8 – Lessons from Past Injection and EGS Projects Section 3.9 – Recent Injection‐Induced Seismicity Theory
Step 2: Assess Natural Seismic Hazard Potential
Step 6: Characterize the risk from induced seismic events
Fugro report (Appendix E), evaluated of NB structures, developed damage claim forms
Section 3.4 – Maximum Magnitude Predictions Section 3.5 – Assessment of Induced Seismicity and Seismic Hazards Risk Section 3.6.3 – Damage Claim Procedures Section 5.4 – Indirect Mitigation
Step 3: Assess Induced Seismicity Potential
Step 7: Develop risk‐based mitigation plans
Daily stimulation and seismicity reporting, post‐stimulation public outreach meetings, developed damage claim forms
Section 3.2 – Communications Section 3.6.3 – Damage Claim Procedures Section 4.2 – Step‐Rate Test Section 5 – Proposed Controls and Mitigation
Step 8: Implement Procedure for Evaluating Damage
Step 7: Interact with Stakeholders

1
1 SummaryAn Enhanced Geothermal System (EGS) reservoir is created by inducing shear slip on existing fractures by injecting water at high pressure (“hydroshearing”) into a rock formation. The shear slip increases fracture permeability and generates seismic vibrations, or “induced seismicity”, that can be detected by seismometers and used to map EGS reservoir growth. Most induced seismic events have a magnitude less than 2.0 and are not felt at the surface. However, some EGS projects have generated events large enough to be felt and cause minor damage. Thus, it is critical that EGS projects follow procedures to evaluate, monitor, and mitigate the risk of felt or potentially damaging induced seismicity.
The International Energy Agency (IEA) developed a protocol for addressing induced seismicity during geothermal projects that was adopted by the U.S. Department of Energy (DOE) for EGS demonstration projects (Majer et al., 2008). AltaRock Energy Inc. (AltaRock) has adapted this protocol to the geologic and environmental conditions for its Newberry EGS Demonstration and developed site‐specific controls and mitigation procedures. A recent update to the IEA protocol, now available in draft form (Majer et al., 2011), has also been incorporated into this plan.
A primary component of induced seismicity mitigation is the installation and operation of a seismic monitoring system. Previously there was only one regional seismic station within 25 km (16 miles) of the Demonstration site operated by the Pacific Northwest Seismic Network (PNSN). To improve the coverage of this network, AltaRock added two stations to the PNSN. AltaRock has also installed a local microseismic array (MSA) of seven seismic stations surrounding the target EGS well, NWG 55‐29, that is currently collecting background natural seismicity data. A final MSA, to be operational during and after EGS reservoir creation, has been designed and AltaRock is currently obtaining permits for its installation. AltaRock will also be installing a strong motion seismometer (SMS) at Paulina Lake, about 3 km (1.9 mi) southeast of NWG 55‐29, to measure any ground acceleration (shaking) generated by the Demonstration.
In addition to the seismic monitoring described above, AltaRock has conducted detailed geologic and geophysical investigations of the Demonstration area. An evaluation of the stress state and regional fault and fracture patterns concluded that there is no evidence of recent faulting or other brittle deformation near NWG 55‐29 (Cladouhos et al., 2011). These results suggest that hydroshearing of the small fractures intersected by the well will not trigger slip on any nearby fault. URS Corporation (URS), an independent engineering consultant, prepared an Induced Seismicity and Seismic Hazards Risk Analysis for the Newberry EGS Demonstration (Wong et al., 2010). Based on case histories of other EGS projects, URS assumed a range of 3.5 to 4.0 for the largest magnitude of a seismic event that could be induced by the EGS Demonstration. URS then conducted a cumulative probabilistic seismic hazard analysis to determine the risk due to both natural and induced seismicity. This type of analysis relates the magnitude of a seismic event to the shaking that might occur at nearby locations. Their report concludes that “the results of the probabilistic seismic hazard analysis indicate that there is no difference in hazard at La Pine, Sun River, and the Project site (NWG 55‐29) between the baseline conditions (which incorporates the hazard from both natural tectonic and volcanic seismicity) and the EGS induced seismicity.” AltaRock believes that the model used by URS to evaluate risk, which is based on data from The Geysers geothermal field, overestimates the shaking that might occur at Newberry, and thus represents a cautious approach. The URS model of shaking at Newberry, which assumes an induced seismic event with a magnitude (M) of 3.5 at the target injection well, NWG 55‐29, predicts 0.01 gravity (g) peak ground acceleration (PGA) in La Pine and 0.1 g PGA at Paulina Lake. For natural earthquakes, a PGA of 0.1 g is perceived by humans as strong shaking and the potential for damage is

2
light (Wald et al., 1999). However, it has been observed that perceived shaking and damage due to EGS induced seismicity is typically lower than for natural events (Majer et al., 2007).
For control and mitigation of induced seismicity, this document defines limits (or ‘triggers’) that, if activated, will initiate mitigation actions up to and including stopping injection and immediately flowing the well to reduce reservoir pressure. The triggers will be monitored during hydroshearing and EGS reservoir creation, and throughout the remainder of the Demonstration. These triggers are based on real‐time measurement of seismic activity on the PNSN regional network, the AltaRock MSA and the Paulina Lake SMS. There are three levels of mitigation based on event magnitude or shaking: (1) hold flow rate and pressure constant if a locatable seismic event with 2.0 ≤ M ≤ 2.7 occurs; (2) reduce flow rate and pressure if a seismic event with 2.7 ≤ M ≤ 3.5, or 0.014 g ≤ PGA ≤ 0.028 g on the SMS occurs; and (3) stop injection and flow well to reduce reservoir pressure if a seismic event with M ≥ 3.5 or PGA ≥ 0.028 g on the SMS occurs. Diverter materials will be added to the injected water to shift fluid flow to a different well depth if events are located at a depth of less than 6000 feet or within 500 meters of the Newberry National Volcanic Monument (NNVM). Each trigger level also includes more frequent and detailed reporting and communication activities.
2 BackgroundNewberry Volcano in central Oregon has been an area of ongoing geothermal energy interest since the 1970s. The Newberry Volcano National Monument was created in 1983 to preserve the scenic beauty and the volcanic features inside the Newberry Volcano caldera while providing for geothermal development and other uses on adjacent lands. Land that had been leased for geothermal development inside the caldera was exchanged for land outside the Monument boundaries with the proviso that the presence of the Monument would not preclude development of projects suitable to the site outside the Monument.
2.1 PreliminaryScreeningAltaRock selected the Newberry area and NWG 55‐29 as a highly favorable EGS demonstration site through a screening process and evaluation of previously permitted geothermal activities. In 1994, an Environmental Impact Statement (EIS) was conducted for CE Newberry (CalEnergy) for the “Newberry Geothermal Pilot Project” on the volcano’s western flank. In June 1994, the U.S. Forest Service (FS) and the U.S. Bureau of Land Management (BLM) issued a joint Record of Decision to implement the Newberry Geothermal Pilot Project. The approved project included exploration, development, and production operations for 14 well pads, a 33‐megawatt power plant, a 115‐kV transmission line, and supporting facilities on the west flank of Newberry Volcano, outside of the Newberry National Volcanic Monument. In 1995, CalEnergy drilled four exploration holes, including two production‐size bore holes. The CalEnergy wells showed very high temperatures (over 600°F at 9200 ft), but extremely low permeability and were not productive (Spielman and Finger, 1998).
In 2007, an Environmental Assessment (EA) of the “Newberry Geothermal Exploration Project” was completed for Davenport Newberry, which had acquired adjacent leases in 1997. A Finding of No Significant Impact (FONSI) was issued by BLM and FS for this project, including temperature gradient drilling, geophysical exploration and drilling of two deep exploratory wells. Davenport completed the drilling of exploratory wells NWG 55‐29 and NWG 46‐16 in July and November 2008, respectively. These holes both reached depths of over 10,000 feet and exhibited maximum temperatures of more than 600°F (315°C), but were not commercially productive.
3
In 2007, AltaRock developed a process for selecting sites for EGS demonstration projects. Criteria for site selection includes: (1) temperature at depth; (2) tectonic stress; (3) geology; (4) fracturing and joint spacing; (5) existing resource information; (6) geophysics; (7) social, political and environmental factors, including the ability to secure permits; and (8) economics. Two critical components of criteria #7 are environmental impact and seismic hazard susceptibility. In 2009, as AltaRock prepared a proposal to the DOE under the EGS Demonstration Project FOA that eventually led to this Demonstration, ten potential sites were evaluated using our site selection process (Appendix M). The Newberry Volcano site scored well for many reasons and an agreement was made with Davenport regarding the use of the two wells for the purpose of demonstrating EGS technology developed by AltaRock.
The Newberry site is strong in most of the criteria used for selection, including very high temperatures, extensional stress regime, favorable geology, extensive resource data, and previously successful permitting. The existing EIS and EA suggested that no major obstacles exist to the contemplated demonstration project. Public comments received during Phase I of this Demonstration have indicated a favorable social and political climate. Preliminary screening indicated that the induced seismicity hazard would be low because there are no large, stressed faults in the vicinity of the potential site. The nearest town, La Pine, is about 10 miles (16 km) from the well field and no recorded historic (since 1891) large (M>5.0) earthquakes have occurred within 100 miles (160 km) of the site.
2.2 DemonstrationProjectAltaRock, supported by the U.S. Department of Energy (DOE) Energy Efficiency & Renewable Energy Geothermal Technologies Program Award Number DE‐EE0002777 1 , is now conducting an EGS demonstration at Newberry Volcano. Geoscience investigations indicate that this area is one of the most promising EGS sites in the United States, with a large conductive thermal anomaly yielding high‐temperature wells, but with permeability orders of magnitude less than conventional hydrothermal wells. NWG 55‐29, a geothermal exploration well drilled in 2008 to a total measured depth of 10,060 feet, exhibits a maximum temperature of more than 600°F (315°C), but very low permeability, making it an ideal well for an EGS demonstration (Figure 2‐1).
The goals of the EGS demonstration project include (Osborn et al., 2010):
Stimulate (hydroshear) multiple zones in well NWG 55‐29 using AltaRock’s proprietary diverter technologies
Create an EGS reservoir with a long dimension of approximately 1000 m (3280 ft)
Demonstrate single‐well reservoir testing methods, including tracers
Confirm EGS reservoir viability through production of geofluid from the stimulated well
Drill two production wells to intersect the EGS reservoir
Using NWG 55‐29 as the injector, demonstrate EGS viability through a reservoir circulation test lasting 30‐60 days
1 U.S. Department of Energy, Energy Efficiency and Renewable Energy, Geothermal Technologies Program, Newberry Volcano EGS Demonstration.

4
Figure 2‐1. Regional map showing location of the Newberry EGS Demonstration (Well NWG 55‐29) at the intersection of three structural trends in central Oregon. Colored lines are faults from the USGS Quaternary fold and fault database. The fault ages are coded by color, from oldest to youngest: blue, younger than 1.6 million years; green, younger than 750,000 years; yellow, younger than 130,000 years; and orange, younger than 15,000 years.
2.3 SeismicityBackgroundThis document describes procedures to evaluate, monitor, and mitigate the risk of felt or potentially damaging induced seismicity due to the Newberry EGS Demonstration. The topics and concepts covered in this document are necessarily technical. This subsection provides some basic background on seismicity and earthquakes. For additional information, please see the U.S. Geological Survey online glossary2 and FAQ3 on earthquakes; the material below is derived from these sites, except where noted.
Earthquake – This term is used to describe both sudden slip on a fault, and the resulting ground shaking and radiated seismic energy caused by the slip, or by volcanic or magmatic activity, or other sudden stress changes in the earth (USGS definition). A shaking or trembling of the earth that is volcanic or tectonic in origin (Merriam‐Webster definition).
2 USGS Earthquake Glossary 3 USGS Earthquake FAQ
5
Seismic Waves – When an earthquake occurs, it releases energy in the form of seismic waves that radiate from the earthquake source in all directions. The different types of energy waves shake the ground in different ways and also travel through the earth at different velocities. The fastest wave, and therefore the first to arrive at a given location, is called the P wave. The P wave, or compressional wave, alternately compresses and expands material in the same direction it is traveling. The S wave is slower than the P wave and arrives next, shaking the ground up and down, and back and forth, perpendicular to the direction it is traveling. Surface waves follow the P and S waves.
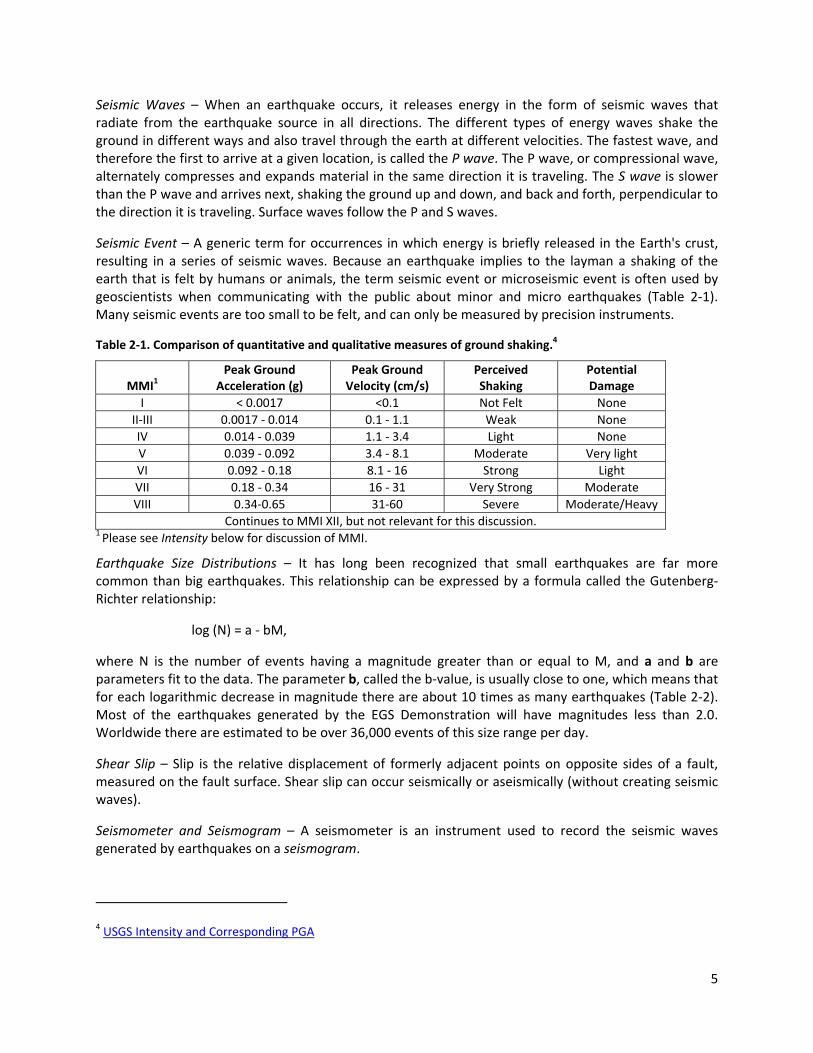
Seismic Event – A generic term for occurrences in which energy is briefly released in the Earth's crust, resulting in a series of seismic waves. Because an earthquake implies to the layman a shaking of the earth that is felt by humans or animals, the term seismic event or microseismic event is often used by geoscientists when communicating with the public about minor and micro earthquakes (Table 2‐1). Many seismic events are too small to be felt, and can only be measured by precision instruments.
Table 2‐1. Comparison of quantitative and qualitative measures of ground shaking.4
MMI1 Peak Ground
Acceleration (g) Peak Ground Velocity (cm/s)
Perceived Shaking
Potential Damage
I < 0.0017 <0.1 Not Felt None
II‐III 0.0017 ‐ 0.014 0.1 ‐ 1.1 Weak None
IV 0.014 ‐ 0.039 1.1 ‐ 3.4 Light None
V 0.039 ‐ 0.092 3.4 ‐ 8.1 Moderate Very light
VI 0.092 ‐ 0.18 8.1 ‐ 16 Strong Light
VII 0.18 ‐ 0.34 16 ‐ 31 Very Strong Moderate
VIII 0.34‐0.65 31‐60 Severe Moderate/Heavy
Continues to MMI XII, but not relevant for this discussion.1 Please see Intensity below for discussion of MMI.
Earthquake Size Distributions – It has long been recognized that small earthquakes are far more common than big earthquakes. This relationship can be expressed by a formula called the Gutenberg‐Richter relationship:
log (N) = a ‐ bM,
where N is the number of events having a magnitude greater than or equal to M, and a and b are parameters fit to the data. The parameter b, called the b‐value, is usually close to one, which means that for each logarithmic decrease in magnitude there are about 10 times as many earthquakes (Table 2‐2). Most of the earthquakes generated by the EGS Demonstration will have magnitudes less than 2.0. Worldwide there are estimated to be over 36,000 events of this size range per day.
Shear Slip – Slip is the relative displacement of formerly adjacent points on opposite sides of a fault, measured on the fault surface. Shear slip can occur seismically or aseismically (without creating seismic waves).
Seismometer and Seismogram – A seismometer is an instrument used to record the seismic waves generated by earthquakes on a seismogram.
4 USGS Intensity and Corresponding PGA

6
Table 2‐2. Worldwide, annual counts of earthquakes by magnitude.5
Class Magnitude Average Annually Daily Average
Great 8 and higher 1
Major 7 – 7.9 15
Strong 6 – 6.9 134
Moderate 5 – 5.9 1319 4
Light 4 – 4.9 13,000 (estimated) 36
Minor 3 – 3.9 130,000 (estimated) 360
Micro 2 – 2.9 1,300,000 (estimated) 3,600
Micro 1 – 1.9 13,000,000 (estimated) 36,000
Seismic Array – Many seismometers are installed in networks or arrays spread across the area of interest to locate seismic events in the region. To determine the location of seismic events, seismologists identify the arrival times of P and S waves on the seismograms of all instruments that have recorded the seismic waves. These arrival times are commonly called P‐picks and S‐picks. Theoretically, 3 P‐picks and 3 S‐picks can be used to triangulate the location of a seismic event. In practice, on a microseismic array like that described below, 5 P‐picks and 2 S‐picks will yield acceptable location accuracy, and 7 P‐picks and 3 S‐picks will yield good location accuracy (Gillian Foulger, personal communication).
Hypocenter and Epicenter – The hypocenter is the point within the earth where an earthquake rupture starts. The epicenter is the point directly above it at the surface of the Earth.
Magnitude – The magnitude of an earthquake is determined from the logarithm of the amplitude of waves recorded on a seismogram at a certain period. The original magnitude scale was the Richter scale, usually denoted as ML.
Moment and Moment Magnitude – Moment is a physical quantity proportional to the slip on the fault times the area of the fault surface that slips; it is related to the total energy released in the seismic event, and is denoted Mo. The moment can be estimated from seismograms. The moment is then converted into a number similar to other earthquake magnitudes by a standard formula. The result is called the moment magnitude (Mw). Moment magnitude provides an estimate of earthquake size that is valid over the entire range of magnitudes, a characteristic that was lacking in previous magnitude scales, like the Richter scale. Therefore, seismologists now prefer the moment magnitude scale and it is common practice to use just magnitude and M to refer to moment magnitude6.
Comparative Energy Release – The formula relating moment magnitude (Mw) to moment (Mo) in dyne‐cm is4:
Mw = log10 (Mo) / 1.5 ‐ 10.7
Practically, this means that for each increase in moment magnitude, there is a 31.6 x (101.5) increase in total seismic energy. That is, an M 3.5 event releases the same amount of energy as about thirty‐two M 2.5 events.
Intensity – The intensity is a number (written as a Roman numeral) describing the severity of an earthquake in terms of its effects on the earth's surface and on humans and their structures. The
5 USGS Earthquake Facts and Statistics 6 USGS Earthquake Magnitude Policy

7
Modified Mercalli Intensity (MMI) scale is most commonly used in the United States. There are many intensities for an earthquake, depending on where the observer is located, unlike the magnitude, which is one number for each earthquake. Table 2‐3 shows the qualitative MMI scale. Table 2‐4 relates the MMI that would be typically felt at the earthquake epicenter to ranges of magnitudes.
Ground Velocity and Acceleration – Ground velocity is a measure of how fast a point on the ground is shaking as a result of the passage of the seismic waves of an earthquake. During an earthquake, ground shaking also produces acceleration, the change from one velocity to another. Ground velocity and acceleration decrease with distance from the earthquake’s epicenter. The peak ground velocity (PGV) and peak ground acceleration (PGA) are the largest velocity and acceleration, respectively, recorded by a particular station during an earthquake. Both PGV and PGA can be used to quantify the potential for damage from an earthquake. Engineers typically use PGV, or particle velocity, while seismologists more commonly use PGA. Ground velocity and acceleration are both measured on special seismometers called Strong Motion Sensors (SMS). PGA is typically quantified with respect to gravity (g). Table 2‐1 compares intensity, peak ground acceleration and peak ground velocity.
Table 2‐3. First eight of twelve levels of the Modified Mercalli Intensity7 scale.
I. Not felt except by a very few under especially favorable conditions.
II. Felt only by a few persons at rest, especially on upper floors of buildings.
III. Felt quite noticeably by persons indoors, especially on upper floors of buildings. Many people do not recognize it as an earthquake. Standing motor cars may rock slightly. Vibrations similar to the passing of a truck. Duration estimated.
IV. Felt indoors by many, outdoors by few during the day. At night, some awakened. Dishes, windows, doors disturbed; walls make cracking sound. Sensation like heavy truck striking building. Standing motor cars rocked noticeably.
V. Felt by nearly everyone; many awakened. Some dishes, windows broken. Unstable objects overturned. Pendulum clocks may stop.
VI. Felt by all, many frightened. Some heavy furniture moved; a few instances of fallen plaster. Damage slight.
VII. Damage negligible in buildings of good design and construction; slight to moderate in well‐built ordinary structures; considerable damage in poorly built or badly designed structures; some chimneys broken.
VIII. Damage slight in specially designed structures; considerable damage in ordinary substantial buildings with partial collapse. Damage great in poorly built structures. Fall of chimneys, factory stacks, columns, monuments, walls. Heavy furniture overturned.
Continues to XII, but not relevant for this discussion.
7 USGS Modified Mercalli Intensity Scale

8
Table 2‐4. Comparison of magnitude and maximum MMI8.
Magnitude Typical Maximum Modified Mercalli Intensity at Epicenter
1.0 ‐ 3.0 I
3.0 ‐ 3.9 II – III
4.0 ‐ 4.9 IV – V
5.0 ‐ 5.9 VI – VII
6.0 ‐ 6.9 VII – IX
7.0 and higher VIII or higher
2.4 AltaRockTechnology9AltaRock uses the term hydroshearing to describe the process of injecting water at high pressure to cause existing fractures to dilate and slip in shear (Cladouhos et al., 2009). A byproduct of shear‐slip is the generation of seismic waves that can be used to map fracture location and size. Hydroshearing is significantly different than tensional fracturing, or hydrofracking, commonly used in the oil and gas industry. Permeability enhancement occurs at lower fluid pressures during hydroshearing because hydroshearing relies on displacement along preexisting fractures, as opposed to hydrofracking that creates entirely new fractures. Hydroshearing opens natural fractures that will dilate and remain open, even when fluid pressure is reduced, because of the irregularities of natural fracture surfaces. In contrast, hydrofracking requires the injection of chemicals and proppants to keep the planar, man‐made fractures open and permeable.
The creation of EGS reservoirs has historically involved the stimulation of a single fracture zone in each well bore. During stimulation the existing fracture with the lowest hydroshearing pressure will open when water is pumped from the surface and pressure is applied in the injection well. Other existing fractures that require a higher hydroshearing pressure are not affected.
The stimulation of multiple fracture zones in a single injection well will significantly increase EGS efficiency. To create multiple fracture sets in a single well requires hydraulic isolation of each fracture network after it has been stimulated. To provide hydraulic isolation for the creation of multiple fractures, a diverter material (a temporary sealant) can be used. After stimulation of the first fracture zone, a diverter material is added to the injected water to temporarily seal off that zone at the borehole. Additional pressure is then applied to the injected water and a second fracture zone is stimulated. After multiple fracture zones are stimulated, injection is discontinued and the well bore is allowed to reheat to the original well temperature. This causes the diverter material to dissolve, leaving all fractures open for circulation and flow during operation of the EGS system.
AltaRock is a pioneer in the use of diverters in geothermal applications. AltaRock has developed, lab‐tested, and patented a portfolio of materials designed for the moderate to high temperatures encountered in geothermal wells. Different diverter materials are used, depending on the temperature conditions in the target well. For lower temperature wells, AltaRock has used commercially available diverters commonly used in oil and gas wells such as BioVert®, a Halliburton product10. Some
8 USGS Magnitude / Intensity Comparison 9 AltaRock holds a portfolio of patents, patent applications, licenses and related proprietary intellectual property regarding its diverter and stimulation technology, materials and methods. 10 Halliburton BioVert® NWB Diverter for Near‐Wellbore Applications

9
information about AltaRock’s diverters for high temperature applications is proprietary, but can be shared with regulatory agencies prior to specific applications. The Evaluation of Water Usage for The Newberry EGS Demonstration11 contains additional detailed information about AltaRock’s diverter technologies.
2.5 ProtocolforInducedSeismicityThe DOE requires that EGS demonstration projects throughout the U.S. follow the guidelines provided by the International Energy Agency (IEA) Protocol for Induced Seismicity Associated with Geothermal Systems (Majer et al., 2008, and provided as Appendix A). This protocol includes the following steps (re‐ordered and grouped below):
Communications
Step 1: Review Laws Evaluate Regulations;
Step 4: Establish a Dialogue with Regional Authority;
Step 5: Educate Stakeholders;
Step 7: Interact with Stakeholders; Technical
Step 6: Establish Microseismic Monitoring Network;
Step 2: Assess Natural Seismic Hazard Potential;
Step 3: Assess Induced Seismicity Potential; and
Step 8: Implement Procedure for Evaluating Damage.
While this document was being revised, the protocol, now authored by the DOE and titled Protocol for Induced Seismicity Associated with Enhanced Geothermal Systems (EGS), was published online in draft form (Majer et al., 2011, and provided as Appendix B). The second protocol is more detailed than the first and includes knowledge of induced seismicity obtained in the intervening three years. The new protocol’s steps are:
Step 1: Perform Preliminary Screening Evaluation
Step 2: Implement an outreach and communication program
Step 3: Identify criteria for ground vibration and noise
Step 4: Establish seismic monitoring
Step 5: Quantify the hazard from natural and induced seismic events
Step 6: Characterize the risk from induced seismic events
Step 7: Develop risk‐based mitigation plans
In addition, the new protocol provides a recommended approach for each of the steps. Because the new protocol was not available until the final preparation of this document, in the second year of the Newberry EGS demonstration, some recommended approaches or language of the new protocol may not be followed here. However, the general steps of both the new and old protocol are satisfied (see Appendix C for compliance matrix to both).
The new protocol, in particular, suggests approaches for estimating the long‐term risk of an EGS project. The Newberry EGS Demonstration is limited to about 21 days of stimulation and up to 77 days of well flow testing. The data gathered during the Demonstration will be critical for calculating the long‐term risk of EGS development at Newberry. However, this mitigation plan and the permits that AltaRock is
11 Evaluation of Water Usage for The Newberry EGS Demonstration

10
currently seeking do not attempt to address the risk beyond the duration of the Demonstration activities.
AltaRock’s Phase I report, currently in preparation, provides the research and analysis involved in project planning, including detailed procedures for seismic monitoring and stimulation to be conducted in Phase II. Here we summarize research and plans most relevant to induced seismicity controls and mitigation.
3 Pre‐stimulationActivities
3.1 ReviewofLawsandRegulations
3.1.1 RegulatoryOversightThe primary federal agencies responsible for regulatory oversight are the BLM, FS and DOE. All three agencies have responsibilities under the National Environmental Policy Act (NEPA) to conduct an environmental analysis and prepare an Environmental Assessment (EA), and make a determination and decision based on the findings of the EA. BLM has responsibility for subsurface activities and management of geothermal operations. BLM also ensures that operations are conducted in accordance with NEPA decisions and mitigation measures defined in the EA to minimize resource impacts.
Because three federal agencies are involved, a lead and cooperating agencies were designated, and each has its own specific purposes for involvement. The primary activity will occur below ground on federal geothermal leases administered by the BLM. Therefore, BLM is acting as the lead agency for the analysis and preparation of the EA, and the FS and DOE are cooperating agencies. The specific roles, responsibilities, and timelines of each agency are outlined in separate Memorandums of Understanding (MOU) between BLM and FS, and BLM and DOE.
In addition to the federal agencies above, several Oregon state agencies have oversight, monitoring, and permitting responsibilities. Oregon Department of Geology and Minerals Industries (DOGAMI) has state authority over geothermal well drilling, Oregon Department of Environmental Quality (DEQ) regulates Underground Injection Control (UIC), and Oregon Department of Water Resources oversees groundwater use and issues water rights permits. Deschutes County is responsible for implementing Oregon statewide building codes for private buildings on leased federal lands.
3.1.2 LawsandRegulationsReviewedAltaRock has conducted a review of relevant federal, state and local laws and regulations, and has determined that laws and regulations are not so restrictive that any effects of induced seismicity would not be allowed. No laws or regulations in Oregon specifically prohibit or regulate induced seismicity. In the absence of laws and regulations relating directly to induced seismicity from EGS activities, AltaRock reviewed laws and regulations relating to activities that could potentially cause vibration or induced seismicity, such as the impounding of reservoirs, and mining and quarrying (Cypser and Davis, 1998), both activities that are not uncommon in Oregon.
The following laws, regulations, and administrative requirements were reviewed. Those relevant to this Demonstration are discussed in more detail below.
National Environmental Policy Act
Noise Control Act, 42 U.S.C. § 4901
Clean Water Act
2009 ORS Chapter 517, Mining and Mining Claims

11
2009 ORS § 540.350, Dams, Dikes and Other Hydraulic Works
2009 ORS Chapter 467, Noise Control
2009 ORS Section 197, Comprehensive Land Use Coordination
2009 ORS § 401.918, Emergency Management and Services, Seismic Safety Policy, Advisory Commission
2009 ORS § 467.120, Agricultural and Forestry Operations, Mining or Rock Processing
2009 ORS § 469.501, Energy Facility Siting, Construction, Operation and Retirement Standards
Oregon Water Resources Department, Division 20, Dam Safety
Oregon Department of Geology and Mineral Industries, Division 20, Geothermal Regulations
Oregon Department of Geology and Mineral Industries, Division 30, Oregon Mined Land Reclamation Act
Oregon Department of Environmental Quality, Administrative Rules, Division 35, Noise Control Regulations
Deschutes County Code (DCC), Chapter 8.08, Noise Control: County Noise Control Ordinances
DCC Chapter 18: County Zoning
DCC Chapter 23.76: County Comprehensive Plan, Energy
City of La Pine, Comprehensive Plan, March 2010
Dams, Reservoirs, Mining and Quarrying
Laws and regulations governing dams do not specifically refer to induced or triggered seismicity or earthquakes, but do prohibit the construction of “any dam, dike or other hydraulic structure or works, the failure of which would result in damage to life or property” (2009 ORS § 540.350, 2009 ORS Chapter 517, Oregon Water Resources Department, OAR Division 20, Dam Safety; emphasis added). Under 2009 ORS § 540.350, governing the building of dams, the commission’s approval of the site and plans does not relieve the owners of liability to damage to life or property. The Oregon Water Resources Department also provides guidelines and rules on dam safety, which includes “hazard ratings” for dams based on the type and extent of damage to people or property that occurs if a dam fails. No information, guidelines or policy were found that suggested that reservoir induced seismicity was a serious concern in Oregon. The focus appears to be on dam failure in the event of natural seismicity and flooding as a result of failure.
Mining and quarrying laws and regulations similarly aim to minimize or eliminate damage to people and property, but do not specifically have regulations directed at induced seismicity (DOGAMI Division 30, 632‐030‐0005, 2009 OAR Chapter 517). For example, Section 632‐030‐0025 of DOGAMI, Division 30 lists requirements for an operating permit, including how to minimize damage to property and people, and 2009 OAR § 517.990 provides that a person who “knowingly and recklessly causes substantial harm to human health or the environment” without a permit is subject not just to civil penalties, but also criminal penalties.
EGS and Strict Liability
AltaRock also reviewed the standard for strict liability in Oregon to determine whether a theory of strict liability would be applied to induced seismicity. While the Newberry EGS Demonstration will likely be held to a high standard of care, it is also likely that if individuals are injured or property is damaged, Oregon courts will apply trespass, negligence or nuisance theory of liabilities rather than strict liability.
Whether an activity is abnormally dangerous is a question decided by the courts, and the standard used is whether an activity is “extraordinary, exceptional, or unusual, considering the locality in which it is

12
carried on; when there is a risk of grave harm from such abnormality; and when the risk cannot be eliminated by the exercise of reasonable care” (Buggsi, Inc. v. Chevron USA, Inc., 857 F. Supp. 1427, 1432 [D. Or. 1994]; see also Tri‐County Metropolitan Transit District v. Time Warner Telecom of Oregon, Dist. Court. D. Or. 2008, finding that drilling under mass transit rail lines in an urban setting was not an ultrahazardous activity).
Several factors suggest that a court may not apply a standard of strict liability to the Newberry EGS Demonstration. For example, the activity is not located in a populated area, and “the existence of a high degree of risk of some harm to persons and property” is shown to be low in subsequent sections of this plan (see Restatement (second) of Torts § 519). Furthermore, the existence of stringent laws and regulations controlling a particular activity are also taken into account, and Oregon does not provide induced seismicity guidelines to other industries such as mining. It is likely, therefore, that Oregon courts would not apply a theory of strict liability to the EGS project.
If individuals are injured or property is damaged, it is likely that the individual could, however, claim compensation under trespass, negligence or nuisance theory of liabilities. A similar conclusion was reached for an analysis of Colorado law and induced seismicity (Cypser, 1996). AltaRock’s research did not reveal any cases under which an individual sought compensation for induced seismicity in Oregon.
Geothermal Energy and Deschutes County
The only statute that AltaRock believes deals directly with induced seismicity from a geothermal project is the Deschutes County Code Chapter 23.76 (County Comprehensive Plan, Section on Energy). This chapter provides that there are geothermal investigations occurring in the County near Newberry Crater and that “problems with objectionable smells from released gases, possible groundwater contamination, earth subsidence or quakes are all hazards to be considered in geothermal energy use” (emphasis added). The chapter further provides that the County’s support for geothermal development shall be conditioned upon satisfactory evidence that sufficient safeguards are provided for “induced seismicity.” This chapter suggests that Deschutes County does not prohibit activity based on the likelihood of induced seismicity.
3.2 Communications
3.2.1 Pre‐Stimulation
Community outreach meetings have been held in La Pine, Sunriver, Bend, and at the Demonstration site to communicate plans with regulatory agencies and local stakeholders, and provide educational opportunities on the Demonstration plans and benefits (Appendix D, Table D1). Two web sites, several social media outlets, and a toll‐free telephone line (1‐855‐USA4EGS) have been established to promote Demonstration communication. We routinely provide project updates to a contact list of over 225 recipients. AltaRock has posted project plans and technical reports to the Demonstration websites12 and social media sites13 to keep the public informed of recent developments, and to relay related information about geothermal energy, enhanced geothermal systems, and related energy issues. These sites will be continuously updated through the lifetime of the Demonstration to keep the public and
12 www.newberrygeothermal.com and www.altarockenergy.com 13 www.facebook.com/NewberryEGS, www.twitter.com/NewberryEGS and www.newberrygeothermal.wordpress.com

13
regulators informed, including frequent text and video updates during periods of major field activities such as stimulation, drilling and flow testing. Additional public meetings will be held shortly after the Environmental Assessment (to which this document will be attached) has been released for public review. Informational kiosks, currently in preparation and describing the methods and uses of geothermal energy, and EGS in particular, will be installed at Lava Lands Visitor Center and Paulina Lake Visitor Center.
To date, AltaRock has also provided more than twenty presentations at public venues and professional meetings, including the outreach meetings mentioned above, the 2010 Geothermal Resources Council Annual Meeting, the Oregon Geothermal Working Group meeting, and the 2011 Stanford Geothermal Workshop. AltaRock meets regularly with county, state and federal elected leaders, and other stakeholders, including environmental groups, to inform them of our progress and plans. Appendix D Tables D2 and D3 list meetings and presentations that have been conducted as of the date of this report.
3.2.2 StimulationBefore well stimulation begins, notices will be published in the local newspapers and contact information (phone numbers, email addresses, websites, etc.) provided for interested citizens to receive more information, ask questions and report concerns. The Demonstration web sites12 will be updated to inform the public that the well stimulation has begun. NNVM visitors, and owners and users of NNVM assets (i.e., lodges and cabins), will be notified of impending stimulation activities, including the potential for subsequent notification of mitigation triggers, procedures for reporting damage and related actions. Public meetings will be held monthly during active Phase II field operations, including a meeting after stimulation is complete, to discuss the results with stakeholders. These public meetings will include presentations to explain preliminary results and the next steps, with time set aside for questions and answers so that the community can voice their concerns.
Additional preparations and notifications will be implemented for users of Road 500, leading to Paulina Peak, due to the history of frequent rock falls along that road. These indirect mitigation actions, to be established in cooperation with FS staff, are detailed below in Section 5.4(2).
3.2.3 Post‐StimulationFollowing well stimulation and flow testing, the results of these operations will be communicated to the public and other stakeholders through our contact list, web sites, social media, press releases, peer‐reviewed publications, and required DOE reporting. Plans for post‐stimulation activities will also be reported, including the potential for cancellation of the project and site reclamation, or continued activities including stage‐gate review and drilling of production wells.
In addition to the public outreach described above, frequent regulatory and technical communications with government agencies and labs will continue throughout the project, with increased frequency during stimulation and well testing, and event‐specific communications in response to mitigation event triggers. The technical communications are described in Sections 4.5, 5.2, 5.3 and 5.4. All communications are summarized in Table 3‐1.
14
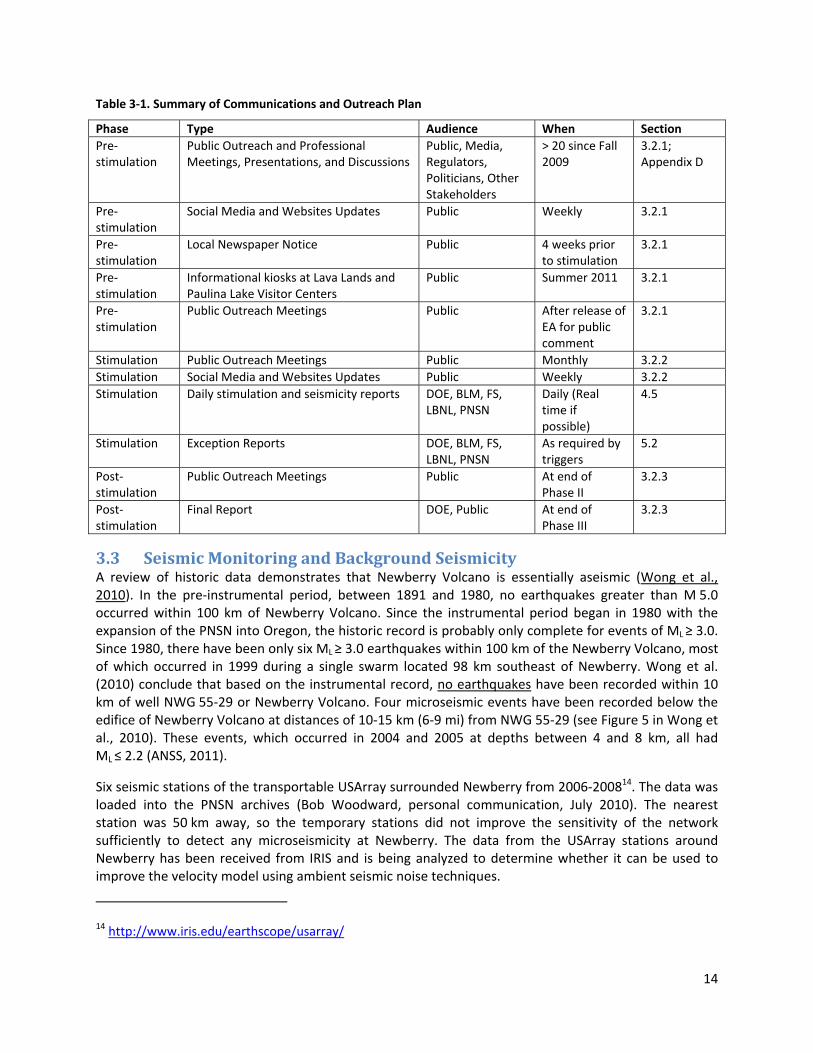
Table 3‐1. Summary of Communications and Outreach Plan
Phase Type Audience When Section
Pre‐stimulation
Public Outreach and Professional Meetings, Presentations, and Discussions
Public, Media, Regulators, Politicians, Other Stakeholders
> 20 since Fall 2009
3.2.1; Appendix D
Pre‐stimulation
Social Media and Websites Updates Public Weekly 3.2.1
Pre‐stimulation
Local Newspaper Notice Public 4 weeks prior to stimulation
3.2.1
Pre‐stimulation
Informational kiosks at Lava Lands and Paulina Lake Visitor Centers
Public Summer 2011 3.2.1
Pre‐stimulation
Public Outreach Meetings Public After release of EA for public comment
3.2.1
Stimulation Public Outreach Meetings Public Monthly 3.2.2
Stimulation Social Media and Websites Updates Public Weekly 3.2.2
Stimulation Daily stimulation and seismicity reports DOE, BLM, FS, LBNL, PNSN
Daily (Real time if possible)
4.5
Stimulation Exception Reports DOE, BLM, FS, LBNL, PNSN
As required by triggers
5.2
Post‐stimulation
Public Outreach Meetings Public At end of Phase II
3.2.3
Post‐stimulation
Final Report DOE, Public At end of Phase III
3.2.3
3.3 SeismicMonitoringandBackgroundSeismicityA review of historic data demonstrates that Newberry Volcano is essentially aseismic (Wong et al., 2010). In the pre‐instrumental period, between 1891 and 1980, no earthquakes greater than M 5.0 occurred within 100 km of Newberry Volcano. Since the instrumental period began in 1980 with the expansion of the PNSN into Oregon, the historic record is probably only complete for events of ML ≥ 3.0. Since 1980, there have been only six ML ≥ 3.0 earthquakes within 100 km of the Newberry Volcano, most of which occurred in 1999 during a single swarm located 98 km southeast of Newberry. Wong et al. (2010) conclude that based on the instrumental record, no earthquakes have been recorded within 10 km of well NWG 55‐29 or Newberry Volcano. Four microseismic events have been recorded below the edifice of Newberry Volcano at distances of 10‐15 km (6‐9 mi) from NWG 55‐29 (see Figure 5 in Wong et al., 2010). These events, which occurred in 2004 and 2005 at depths between 4 and 8 km, all had ML ≤ 2.2 (ANSS, 2011).
Six seismic stations of the transportable USArray surrounded Newberry from 2006‐200814. The data was loaded into the PNSN archives (Bob Woodward, personal communication, July 2010). The nearest station was 50 km away, so the temporary stations did not improve the sensitivity of the network sufficiently to detect any microseismicity at Newberry. The data from the USArray stations around Newberry has been received from IRIS and is being analyzed to determine whether it can be used to improve the velocity model using ambient seismic noise techniques.
14 http://www.iris.edu/earthscope/usarray/
15
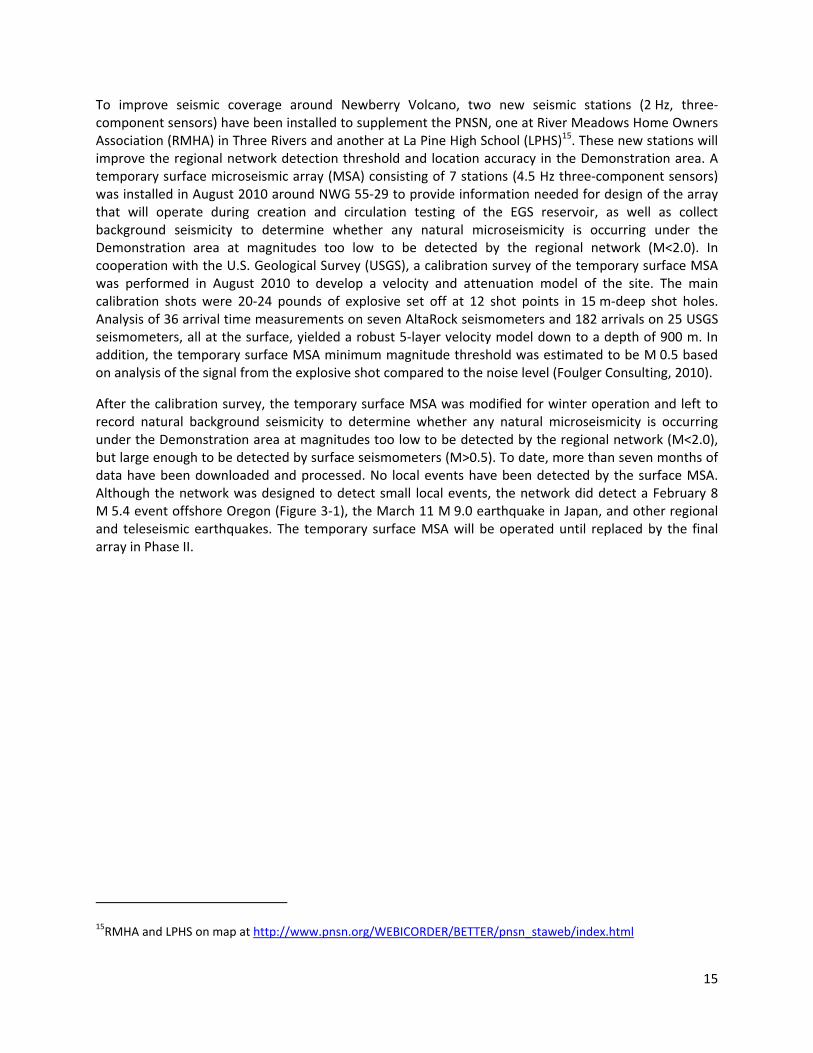
To improve seismic coverage around Newberry Volcano, two new seismic stations (2 Hz, three‐component sensors) have been installed to supplement the PNSN, one at River Meadows Home Owners Association (RMHA) in Three Rivers and another at La Pine High School (LPHS)15. These new stations will improve the regional network detection threshold and location accuracy in the Demonstration area. A temporary surface microseismic array (MSA) consisting of 7 stations (4.5 Hz three‐component sensors) was installed in August 2010 around NWG 55‐29 to provide information needed for design of the array that will operate during creation and circulation testing of the EGS reservoir, as well as collect background seismicity to determine whether any natural microseismicity is occurring under the Demonstration area at magnitudes too low to be detected by the regional network (M<2.0). In cooperation with the U.S. Geological Survey (USGS), a calibration survey of the temporary surface MSA was performed in August 2010 to develop a velocity and attenuation model of the site. The main calibration shots were 20‐24 pounds of explosive set off at 12 shot points in 15 m‐deep shot holes. Analysis of 36 arrival time measurements on seven AltaRock seismometers and 182 arrivals on 25 USGS seismometers, all at the surface, yielded a robust 5‐layer velocity model down to a depth of 900 m. In addition, the temporary surface MSA minimum magnitude threshold was estimated to be M 0.5 based on analysis of the signal from the explosive shot compared to the noise level (Foulger Consulting, 2010).
After the calibration survey, the temporary surface MSA was modified for winter operation and left to record natural background seismicity to determine whether any natural microseismicity is occurring under the Demonstration area at magnitudes too low to be detected by the regional network (M<2.0), but large enough to be detected by surface seismometers (M>0.5). To date, more than seven months of data have been downloaded and processed. No local events have been detected by the surface MSA. Although the network was designed to detect small local events, the network did detect a February 8 M 5.4 event offshore Oregon (Figure 3‐1), the March 11 M 9.0 earthquake in Japan, and other regional and teleseismic earthquakes. The temporary surface MSA will be operated until replaced by the final array in Phase II.
15RMHA and LPHS on map at http://www.pnsn.org/WEBICORDER/BETTER/pnsn_staweb/index.html

16
Figure 3‐1. Seismic energy recorded on 16 of 21 components of the currently installed MSA (7 stations, 3 components each) from M 5.4 regional event that occurred about 230 km off the Oregon coast at a depth of 34 km after 22:00 UTC on February 8, 2011.
The proposed station locations (Figure 3‐2) and required permits for the final MSA will be evaluated as part of the EA. After permitting, AltaRock will proceed with installation of the final MSA consisting of 6‐10 borehole seismometers and 4‐7 surface seismometers. Deployment in boreholes at least 200 m (656 ft) deep is desirable because placing the sensors at depth will improve data quality by reducing ambient noise from surface and near‐surface sources, and by reducing waveform distortion caused by propagation through weathered rocks near the surface. Surface occupancy and disturbance are limited within the NNVM and in the adjacent Special Management Area; therefore, the station coverage to the east of NWG 55‐29 is primarily limited to surface MSA stations rather than borehole installations. Eight stations will be located between the stimulation zone and NNVM to provide accurate locations for seismic events nearest the NNVM, including surface stations NM08 (currently operating), NM41 (proposed for Special Management Area), NM40 (proposed location in NNVM on west rim trail), NM06 (located 570 m east of the stimulation zone), NM22 (located immediately above the stimulation zone), and borehole stations NN19 and NN21 (located just outside the Special Management Area). In addition to these MSA stations, a strong motion sensor (SMS) will be installed at or near the Paulina Lake Visitor Center (PLVC). Any shaking recorded on this sensor is expected to be about 10 times greater than shaking that might occur in La Pine (see Section 3.3), making PLVC a more appropriate SMS monitoring site. As noted above, the currently operating temporary array will be replaced by the permanent MSA after Phase II activities are approved and permitted. A drilling contractor, MSA equipment suppliers and installation team have already been selected and are waiting for approval and permits. Table 3‐2 details the schedule for borehole drilling, seismometer and telemetry installation, and equipment testing.

17
Table 3‐2. Final MSA installation schedule.
Event
Minimum Duration
Week of Completion Details
Procure seismic equipment
13 weeks 13 Starts after approval of ISMP.
Drill five MSA holes1 7 weeks 20 Starts after Phase II activities are approved. Assumes 10 days to drill and complete each hole.
Install Seismic equipment
3‐4 weeks 24 Assumes 16 stations, 1 station installation per day, 1 week to set up communications and data center.
Test MSA 1 week 251Four MSA holes already exist or will be drilled as part of another project.
Accurately determining the location of earthquake epicenters and hypocenters is largely a function of the geometry of the seismic network. To evaluate various proposed network geometries, AltaRock contracted with Foulger Consulting, a globally recognized leader in seismic system design, to model the accuracy of 7 different proposed networks. All simulations of seismic networks with 7‐9 borehole sensors and 0‐4 surface sensors, using different combinations of the locations indicated on Figure 3‐2, yielded initial horizontal location errors of less than 408 m (1340 ft) with an average error of all networks of 218 m (715 ft; Foulger Consulting, 2011). These location errors are a worst case for real‐time, single‐event locations. During the actual stimulation, event locations will be iteratively improved and errors reduced by relative relocation techniques, improved velocity models, and review by seismologists. For now, we take a cautious approach and assume a horizontal accuracy of 400 m. It is important to note that the stimulation zone is limited to an area within 1000 m of NWG 55‐29 (see Section 4.3). Events located outside this radius will trigger mitigation (see Section 5). For example, even an event that is calculated to have occurred 500 meters outside the NNVM boundary, but could actually have occurred up to 400 meters closer, will still trigger mitigation before any impact to NNVM.
Each station will be equipped with batteries, solar panels, and either a 900 MHz telemetry radio or cell phone modem (depending on local conditions) to collect and transmit real‐time, continuous data to an operational center to be auto‐processed. The raw data will also be provided in real‐time via broadband internet connection to Lawrence Berkeley National Laboratory (LBNL) where the data will be archived and displayed to the public on the EGS Induced Seismicity website16. The current MSA plan calls for 16 stations with telemetry, which provides redundancy in the event a station is temporarily out of service. Field seismologists and IT specialists will be on‐contract to ensure that 90% of the stations are operational at all times, and to conduct any station repairs as quickly as possible.
16 LBNL EGS Induced Seismicity Website

18
Figure 3‐2. Final MSA, including borehole installations, shown in relation to planned stimulation zone. Ellipse with 1 km north‐south major axis, centered over the middle of the open‐hole interval, is current prediction of the microseismicity cloud that will be induced and the approximate extent of the EGS reservoir, based on a preliminary stress model. Multiple zones will have different depths, but roughly the same map view. Hatched area is Special Management Area (no surface occupancy) adjacent to NNVM, shown in green. Even if the EGS reservoir grows in an unexpected direction (not north‐south), the map shows sufficient room for an EGS reservoir of any orientation around NWG 55‐29.
Auto‐processing software will be set to auto‐locate events on which 5 or more P‐picks and 2 or more S‐ picks can be made. The operational center will be staffed by seismologists that will refine seismic wave auto‐picks, improve event locations, and track maximum event size and the size distribution of microseismicity (the b‐value), 24 hours a day. The Project Manager will ensure that a seismicity report is transmitted daily to the DOE, BLM, FS, PNSN and LBNL. Trigger and mitigation reports will be prepared and sent to the DOE, BLM, FS, PNSN and LBNL if any triggers are exceeded or mitigation actions taken (see Section 5).
Locations and seismograms of identified seismic events will then be sent via Internet to LBNL. Data sharing and archiving agreements, links, and search tools will ensure that the raw seismic data will be available to the public and scientific community from LBNL17, PNSN18 and the Northern California
17 Lawrence Berkeley National Laboratory, Earth Sciences Division ‐ EGS Earthquake Maps

19
Earthquake Data Center19 (NCEDC) websites. This system will be operational before stimulation begins, and operation will continue throughout the Demonstration.
3.4 MaximumMagnitudePredictionsMaximum magnitudes (Mmax) and earthquake rates are the two most important inputs into seismic hazard analyses. The magnitude of an earthquake is proportional to the area of the fault that slips in an event and the amount of stress that is released (i.e., stress drop). Several conditions must be met for a potentially damaging earthquake to occur. There must be a large enough fault, stresses must be high enough to cause slip, and the fault needs to be pre‐stressed and near failure. As recognized by many, the characteristics of induced seismicity are controlled by the characteristics and distribution of pre‐existing fractures and faults, and the local stress field in the volume of rock surrounding the well where fluid is being introduced (Majer et al., 2007).
Two basic approaches are used to estimate the potential Mmax for Newberry EGS activities, analogs from other EGS and geothermal projects and theoretical models. Because few EGS projects have been undertaken worldwide, finding suitable analogs is challenging. Theoretical approaches depend on an a priori knowledge of the rupture characteristics of future induced seismicity, which requires subsurface characterization of the affected volume of rock around the well. This information is not yet available for Newberry, but will be obtained as further investigations are performed.
Although the number of EGS sites analogous to Newberry Volcano is limited, observations at sites in similar geologic and tectonic settings, such as Fenton Hill, Ogachi and Hijiori, suggest that Mmax may be less than M 3.0 (Wong et al., 2010). In a broader review of Mmax associated with other EGS demonstrations, the highest observed value has been an M 3.7 event in Cooper Basin, Australia, where no damage was reported (Majer et al., 2007; confirmed by Geodynamics reservoir development manager, Robert Hogarth, June 2011). The next largest event was an M 3.4 event in Basel, Switzerland. Although not an EGS site, The Geysers has recorded an M 4.6 earthquake, but this occurred in an extensively exploited geothermal field that has operated for nearly five decades. The first M > 4.0 induced earthquake at The Geysers occurred in 1982, nearly 20 years after geothermal production began (Wong et al., 2010).
To develop site‐specific, theoretical models of Mmax for the Newberry EGS Demonstration, AltaRock commissioned the William Lettis & Associates division of Fugro Consultants (Fugro) in April, 2011. This assessment included additional analysis of LiDAR20 data, updated physical and injection plan parameters, a model incorporating high heat flow at Newberry, and estimates of the probability of the different Mmax levels. Included on the Fugro team was Dan O’Connell, who is also PI on a DOE Geothermal Technologies Program project within the topic area of Seismicity and Reservoir Fracture Characterization. O’Connell’s project is testing a model of induced seismicity and fluid flow with data from the Paradox Valley injection well and the Coso geothermal field21. The Fugro report is included as Appendix E and summarized here.
Additional lineament analyses of LiDAR data did not disclose any significant features within a 1‐km radius of the well that could be activated by EGS stimulation. Within a 5‐km radius, mapped lineaments
18 The Pacific Northwest Seismic Network 19 Northern California Earthquake Data Center will be responsible for long‐term archiving of EGS project data. 20 Light Detection and Ranging, a method for high‐precision topographic mapping. 21 http://www1.eere.energy.gov/geothermal/2010_peer_review_seismicity.html.

20
are associated with drainage and depositional features on the flanks and margins of the Newberry Volcano (Figure 8 of Appendix E). None of these lineaments were identified as faults and, in any case, their orientations make them unlikely to slip in the current stress field determined from the borehole televiewer (BHTV) breakouts and active tectonic features mapped in the broader region (Cladouhos et al., 2011).
Fugro used three alternative approaches to evaluate Mmax for the Newberry EGS Demonstration based on physical properties of the surrounding rock mass and proposed injection process. These approaches provide single‐valued deterministic estimates of Mmax for specific combinations of physical parameters estimated for the site (Table 3‐3).
The first method, taken from Brune (1970), is based on dynamic stress drop, which controls the absolute amplitude of radiated seismic waves, and corresponding ground shaking. For an induced event created by slip on a fault with a 500 m (1640 ft) radius (the radius of the maximum dimension of the proposed EGS reservoir) and a stress drop of 3 MPa, an Mmax of 3.89 is calculated.
The second method, based on McGarr (1976), relates the sums of the seismic moment released in earthquakes to a change in volume. In the case of fluid injection, it is the volume added to the system by injection. Using a crustal rigidity of 3.5 GPa and the planned injected volume of 8 million gallons for a single fracture stage (~30,000 m3), an Mmax of 3.28 is calculated.
The third method, from Leonard (2010), is based on a set of internally consistent scaling relationships between seismic moment and rupture area, length, width, and average displacement. The length of the fault plane of an Mmax event can be constrained to be the target length of the EGS reservoir, 1000 m (3280 ft). The vertical extent of the fault plane can be constrained by the depth to the brittle‐ductile transition below NWG 55‐29, which is an extremely shallow 3.5 km (2.2 mi) due to the high heat flow. Using these constraints on a 50° dipping fault plane, an Mmax of 3.98 is calculated. The three Mmax values calculated by Fugro substantiate the earlier estimate by URS of Mmax ranging from 3.5‐4.0.
Table 3‐3. Summary of the three deterministic approaches used to estimate Mmax. Only highest Mmax estimated by each method is shown in this table. Mmax based on a wider range of input values shown in Appendix E.
Technique Characteristics Highest Mmax
Brune (1970)1 Dynamic stress drop, 500 m (1640 ft) radius, 3 MPa stress drop
3.89
McGarr (1976)2 Injected volume of 30,545 m3 (8 million gallons) 3.24
Leonard (2010)3 Based on fault area 1000 m (3280 ft) strike length and 1473 m (4833 ft) vertical extent limited by shallow (3.5 km) brittle‐ductile transition
3.98
1 Table 3 of Appendix E 2 Table 4 of Appendix E 3 Table 5 of Appendix E
The final approach used by Fugro relies on the ‘seismogenic index’ developed by Shapiro et al. (2010). Shapiro et al. (2007) observed that the number of induced earthquakes with a magnitude larger than a given value increases approximately proportionally with the injected fluid volume. Using the seismicity rate of induced events and the fluid injection rate, Shapiro et al. (2010) derived a seismogenic index. This parameter can be used to compare the induced seismicity effects of injection conducted at different project locations. The Shapiro et al. (2010) analysis is appealing because it provides a
21
probabilistic prediction of maximum magnitude based on a relatively modest amount of site specific information.
Fugro calibrated and tested the Shapiro et al. (2010) method using data from the initial 14‐day injection sequence at the Paradox Valley and found that the observed Mmax = 0.9 falls within the 95% confidence region of the predicted Mmax < 1.2 (Figure 9 of Appendix E). The median prediction of Mmax (4.39) and the observed Mmax (4.3), over a 4‐year long‐term injection in which more than 2 million metric tons (>500 million gallons) of waste were disposed, are also in agreement.
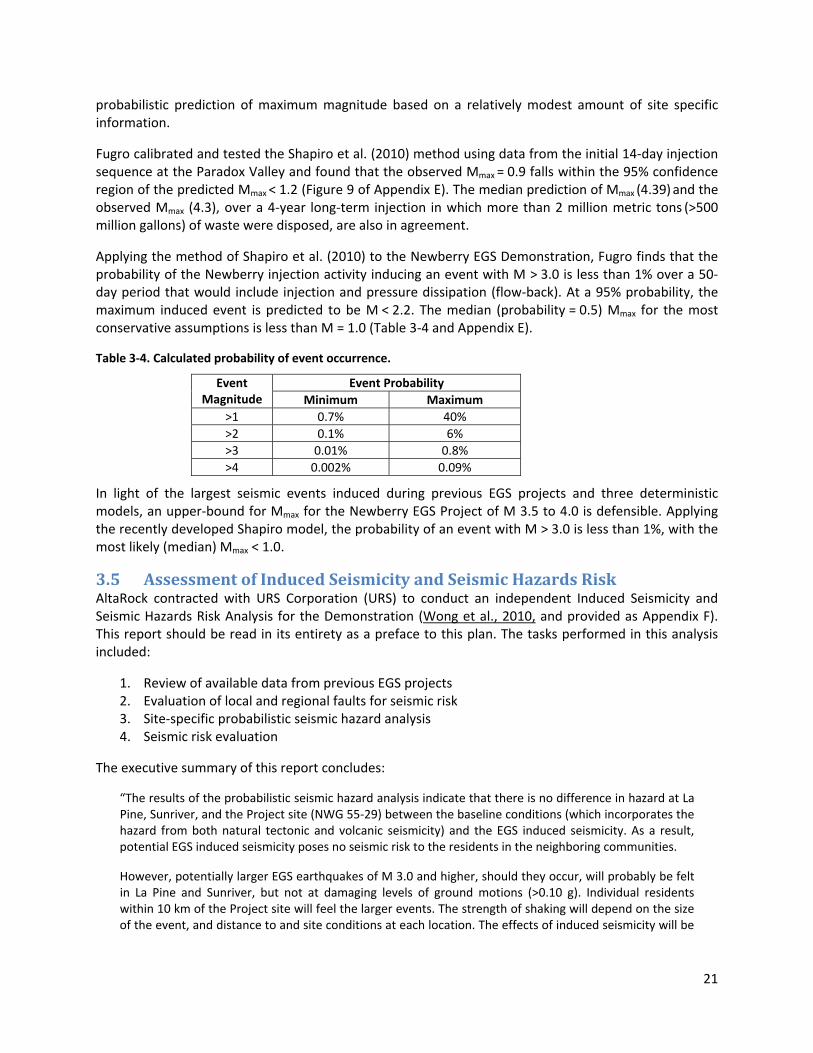
Applying the method of Shapiro et al. (2010) to the Newberry EGS Demonstration, Fugro finds that the probability of the Newberry injection activity inducing an event with M > 3.0 is less than 1% over a 50‐day period that would include injection and pressure dissipation (flow‐back). At a 95% probability, the maximum induced event is predicted to be M < 2.2. The median (probability = 0.5) Mmax for the most conservative assumptions is less than M = 1.0 (Table 3‐4 and Appendix E).
Table 3‐4. Calculated probability of event occurrence.
Event Magnitude
Event Probability
Minimum Maximum
>1 0.7% 40%
>2 0.1% 6%
>3 0.01% 0.8%
>4 0.002% 0.09%
In light of the largest seismic events induced during previous EGS projects and three deterministic models, an upper‐bound for Mmax for the Newberry EGS Project of M 3.5 to 4.0 is defensible. Applying the recently developed Shapiro model, the probability of an event with M > 3.0 is less than 1%, with the most likely (median) Mmax < 1.0.
3.5 AssessmentofInducedSeismicityandSeismicHazardsRiskAltaRock contracted with URS Corporation (URS) to conduct an independent Induced Seismicity and Seismic Hazards Risk Analysis for the Demonstration (Wong et al., 2010, and provided as Appendix F). This report should be read in its entirety as a preface to this plan. The tasks performed in this analysis included:
1. Review of available data from previous EGS projects 2. Evaluation of local and regional faults for seismic risk 3. Site‐specific probabilistic seismic hazard analysis 4. Seismic risk evaluation
The executive summary of this report concludes:
“The results of the probabilistic seismic hazard analysis indicate that there is no difference in hazard at La Pine, Sunriver, and the Project site (NWG 55‐29) between the baseline conditions (which incorporates the hazard from both natural tectonic and volcanic seismicity) and the EGS induced seismicity. As a result, potential EGS induced seismicity poses no seismic risk to the residents in the neighboring communities.
However, potentially larger EGS earthquakes of M 3.0 and higher, should they occur, will probably be felt in La Pine and Sunriver, but not at damaging levels of ground motions (>0.10 g). Individual residents within 10 km of the Project site will feel the larger events. The strength of shaking will depend on the size of the event, and distance to and site conditions at each location. The effects of induced seismicity will be

22
more of a nuisance than a hazard to the vast majority of local residents because of the small size of the events and distances to centers of population.”
For additional technical details, the reader is directed to the report itself, publicly available on the Demonstration website. URS also developed shake maps, also publicly available, based on a predicted upper‐range seismic event of M 3.5 at 1 km depth (3280 ft) in the target well (Wong et al., 2011, and Appendix G). The shake map predicts PGA of 0.25 g at the wellhead, 0.10 g at Paulina Lake, and less than 0.01 g at La Pine (Figure 3‐3). For natural earthquakes, a PGA of 0.10 g is perceived by humans as strong shaking and the potential for damage is light (Wald et al., 1999) However, it has been observed that perceived shaking and damage due to EGS induced seismicity is typically lower (Majer et al., 2007).
To independently evaluate the projected shaking shown in Figure 3‐3, we compared it to actual measurements from The Geysers geothermal field in northern California, where more than 50 years of geothermal production has resulted in more induced seismicity and seismic monitoring than anywhere in the world. We compiled PGA data available from the USGS shake maps22 recorded at SMS stations within 20 km of The Geysers for eight seismic events between November 2009 and March 2011 with M between 3.5 and 3.7. This data is plotted in Figure 3‐4, along with a single shaking measurement (PGA of 0.05 g) from the ML 3.4 injection induced event that occurred under Basel (Majer et al., 2007). A comparison of the predicted shaking (orange curve) to measured shaking at The Geysers (blue diamonds) shows that there is a reasonable fit between the URS shake map predictions and Geysers shake data. However, a shake map appropriately calibrated to Geysers geology and geophysics may overestimate the shaking expected at Newberry; greater shaking is expected for a seismic event of a given magnitude at The Geysers due to the presence of competent bedrock near the surface, which more readily propagates seismic energy due to higher internal friction. The surface geology at Newberry is dominated by thick unconsolidated volcanic materials, which have lower internal friction and absorb more seismic energy, thereby reducing shaking (Aki and Richards, 1980).
The relative intensities of shaking shown in Figure 3‐4 suggest that an SMS would be best positioned at Paulina Lake, where the nearest occupied structures are located, to record shaking that could trigger mitigation actions. Locating the SMS in La Pine would not be useful because the low levels of shaking predicted at La Pine (PGA << 0.01 g) approach the level of seismic noise common to such a small town, such as passing trains and truck traffic.
22 USGS Earthquake Shake Maps

23
Figure 3‐3. Shake map from URS Addendum Figure 1 (Wong et al., 2011). Only Class A Quaternary faults are shown, so the Class B Newberry Caldera ring fractures are not shown.
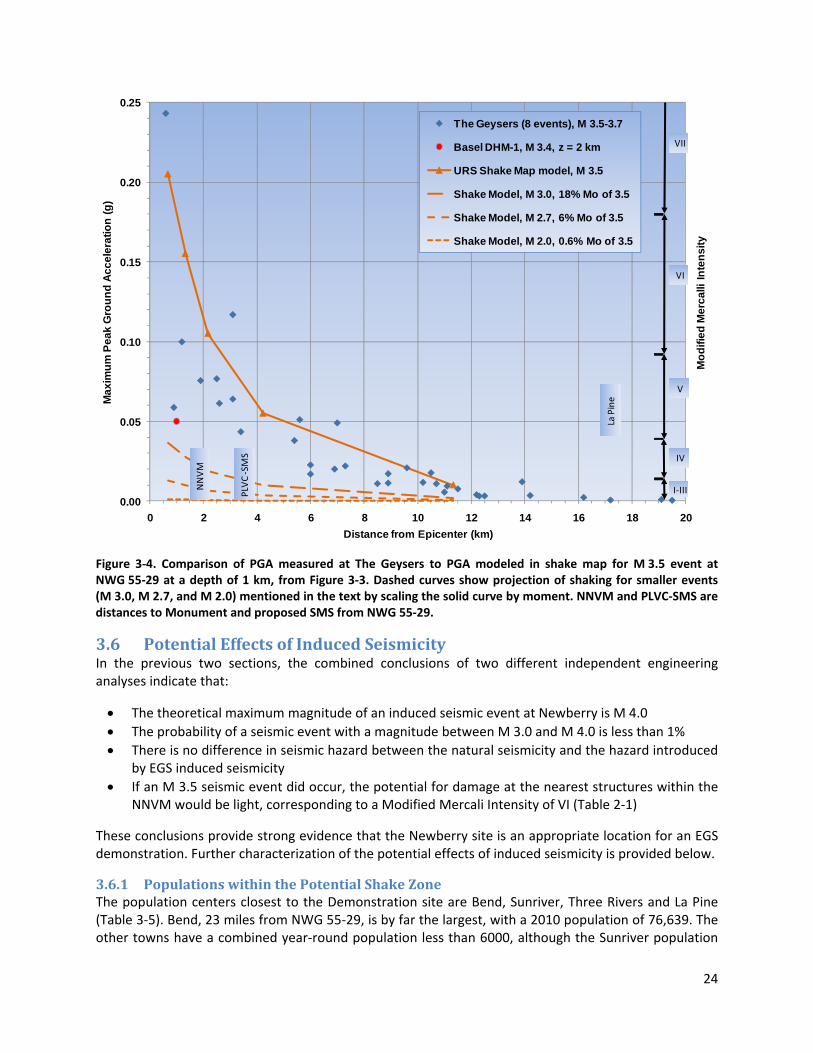
24
Figure 3‐4. Comparison of PGA measured at The Geysers to PGA modeled in shake map for M 3.5 event at NWG 55‐29 at a depth of 1 km, from Figure 3‐3. Dashed curves show projection of shaking for smaller events (M 3.0, M 2.7, and M 2.0) mentioned in the text by scaling the solid curve by moment. NNVM and PLVC‐SMS are distances to Monument and proposed SMS from NWG 55‐29.
3.6 PotentialEffectsofInducedSeismicityIn the previous two sections, the combined conclusions of two different independent engineering analyses indicate that:
The theoretical maximum magnitude of an induced seismic event at Newberry is M 4.0
The probability of a seismic event with a magnitude between M 3.0 and M 4.0 is less than 1%
There is no difference in seismic hazard between the natural seismicity and the hazard introduced by EGS induced seismicity
If an M 3.5 seismic event did occur, the potential for damage at the nearest structures within the NNVM would be light, corresponding to a Modified Mercali Intensity of VI (Table 2‐1)
These conclusions provide strong evidence that the Newberry site is an appropriate location for an EGS demonstration. Further characterization of the potential effects of induced seismicity is provided below.
3.6.1 PopulationswithinthePotentialShakeZoneThe population centers closest to the Demonstration site are Bend, Sunriver, Three Rivers and La Pine (Table 3‐5). Bend, 23 miles from NWG 55‐29, is by far the largest, with a 2010 population of 76,639. The other towns have a combined year‐round population less than 6000, although the Sunriver population
0.00
0.05
0.10
0.15
0.20
0.25
0 2 4 6 8 10 12 14 16 18 20
Ma
xim
um
Pe
ak
Gro
un
d A
cc
ele
rati
on
(g
)
Distance from Epicenter (km)
The Geysers (8 events), M 3.5-3.7
Basel DHM-1, M 3.4, z = 2 km
URS Shake Map model, M 3.5
Shake Model, M 3.0, 18% Mo of 3.5
Shake Model, M 2.7, 6% Mo of 3.5
Shake Model, M 2.0, 0.6% Mo of 3.5
NNVM
PLVC ‐SMS
La Pine
IV
V
VI
I‐III
VII
Mo
difi
ed
Me
rca
lli I
nte
ns
ity

25
soars to 20,000 in the summer. All four of these population centers are located outside of the zone within which perceivable shaking (PGA>0.01g) may occur (12‐13 km from NWG 55‐29; Figure 3‐3).
Table 3‐5. Number of people outside area of perceivable shaking as determined by Wong et al. (2011).
City Population Distance from NWG 55‐29
Bend 76,6391 37 km (23 mi)
Sunriver 1,3182 (20,000 in Summer)3 20 km (12.4 mi)
Three Rivers 2,3532 15 km (9.3 mi)
La Pine 1,6531 15 km (9.3 mi)1Deschutes County Oregon Population 1990‐2010 2Population and Housing Occupancy Status: 2010 Cities and CDPs 3Sunriver Area Chamber of Commerce
Populations in the zone where perceivable shaking may occur are limited to visitors to the NNVM and the adjacent Deschutes National Forest. This transient population is primarily limited to summer months due to winter snow closures (Table 3‐6). We estimate that 659 people could be within the zone where perceivable shaking may occur during the peak summer season daytime hours. During the night, up to 333 people might be within the zone where perceivable shaking may occur. Some visitors are also present during winter days and overnight stays, accessing the area only by foot, ski or snowmobile. These populations are probably 10 to 100 times lower than summer populations.
Table 3‐6. Number of visitors within area of perceivable shaking as determined by Wong et al. (2011).
Location Season Total 2010
(May ‐ Oct) Peak Month Total (August)
Estimated Daily Average during Peak Season
DAYTIME 56,118 20,405 659
Entrance Station 56,1181 20,4051 6592
Paulina Lake VC* 3,7071 1,9941 652
OVERNIGHT 29,891 ND 333
Campgrounds* 20,5021,3 ND 2284
Paulina Lake Cabins* 4,8965 ND 555
East Lake Cabins* 4,4936 ND 506
ND – no data *Visitors to these locations are also counted at the Entrance Station. 1Statistics provided by Rod Bonacker (FS) via email on Jun 14th, 2011. 2Calculated by dividing the Peak Month Total (August) by 31 days. 3Season Total extends thru March 2011. 4Calculated by dividing the Campground Season Total by 90 days (length of peak season); likely overestimated because Campground Season Total extends thru March 2011. 5Estimate assumes Paulina Lake Cabins are 80% occupied for 80% of peak season. 6Estimate assumes East Lake Cabins are 80% occupied for 80% of peak season.
3.6.2 VulnerabilityofStructuresOn May 16, 2011, FS provided AltaRock with a list of 52 key assets within the NNVM, which includes various buildings, two bridges, a road, a dam, and three slope faces. These assets include all structures between the 0.06 g and 0.10 g contour lines of PGA on Figure 3‐3, as well as many other structures located within the 0.01 g to 0.05 g contour lines. The list includes Paulina Lake Lodge and associated cabins, East Lake lodge and associated cabins, Paulina Lake Guard Station and associated FS structures, and other structures along the Paulina‐East Lake Road. The dam and collocated bridges span Paulina Creek at the outlet of Paulina Lake, adjacent to Paulina Lake Lodge. One of the slopes crosses a road cut
26
on Road 500 leading to Paulina Peak, which is prone to rock fall that results in rocks on the roadway. The two other slopes are located on the north sides of Paulina and East Lakes, respectively, which FS presented as a slope stability concern. The vulnerability of structures in and around La Pine will not be assessed because analysis by URS (Wong et al., 2011) indicated that damage at that distance (15 km, 9 mi) is extremely unlikely.
On June 9 2011, a structural engineer with Simpson Gumpertz & Heger (SGH) and a geotechnical engineer with Treadwell & Rollo (T&R) accompanied Rod Bonacker of the FS to conduct a visual inspection of the bridges, the dam, and 15 representative buildings and cabins. The purpose of the visit was to become familiar with the construction types of the buildings and the bridges. They determined that the buildings are all of wood‐frame construction. The older vintage buildings are log cabin style, while the newer buildings are more traditional modern wood frame construction, all with either a stone or concrete foundation. The three structures at the outlet of Paulina Lake were also inspected: the small (3 to 4 feet high) dam, the older (1954) and integral concrete bridge which is no longer in use, and the new (2008) steel bridge installed over the concrete bridge. The talus slopes could not be observed in the field due to snow cover. On June 22, 2011, AltaRock presented the preliminary results of the field visit to the BLM, FS and DOE, and proposed the methodologies for evaluating the assets. All agencies agreed that the proposed method would adequately characterize the structural vulnerability of these assets.
The results of the SGH structural engineering evaluation of the buildings and bridges are attached as Appendix H. Twelve representative structures were scored using the national standard document, FEMA 154, Rapid Visual Screening of Buildings for Potential Seismic Hazards: A Handbook. For the twelve NNVM structures scored, the PGA resulting in a 10% probability of collapse was determined to be between 0.25 and 1.1 g. Further analysis indicates that in a “worst case” 0.10 g PGA that an M 3.5 seismic event could produce the collapse probability would be 1.2% or less for all NNVM structures. SGH noted that the bridge is constructed “on fairly competent bedrock.” SGH calculates the PGA limit for the bridge to be 0.28 g, similar to most susceptible buildings.
SGH also evaluated thresholds for cosmetic damage to buildings and recommended that the peak particle velocity be limited to 2 cm/s to minimize the potential for cosmetic damage to the buildings. This correlates to an approximate PGA of 0.025 g. As will be discussed in sections below, mitigation measures designed to slow induced seismicity will begin at a PGA of 0.014 g, well below the shaking level that might cause cosmetic damage, and an order of magnitude below the shaking level that would cause collapse of NNVM buildings.
The T&R geotechnical engineering evaluation of the dam and steep slopes is attached as Appendix I. The dam is described as a concrete wall 3 to 4 feet high and 12 to 14 inches thick, connected to a concrete bridge on the downstream side. Both concrete structures are “keyed into and bottomed in” bedrock. According to the evaluation, no concrete dam is known to have failed as a result of earthquake induced ground motion, including a 372 foot high concrete arch dam that survived accelerations of 0.6 to 0.8 g caused by an M 6.6 earthquake. Therefore, the engineers conclude that “the probability of additional damage to the dam is low and the probability of failure of the dam is extremely remote.”
The likelihood of landslides on the slopes of concern in the NNVM was evaluated by comparing the maximum stable slope inclination for the five rock types exposed to the slope inclinations measured from LiDAR imagery. The T&R geotechnical engineer concludes that “all geologic units have a low to very low risk of a deep seated landslide during static and minor earthquake loading with PGA’s up to 0.1g.” T&R provides further support for this conclusion from a survey by the USGS (Keefer, 1984) of landslides caused by earthquakes, which concluded that for a landslide to occur during an M 4 earthquake, the
27
epicentral distance would need to be less than 0.2 km. At Newberry, the nearest slope of concern is more than 4 km away from the NWG 55‐29 stimulation zone.
The FS has also expressed concern about snow avalanches being triggered by induced seismicity. According to Avalanche Safety for Skiers and Climbers (Daffern, 1992), the major factors controlling avalanche risk are weather, snowfall, temperature, wind direction, snow pack conditions, slope angle, slope orientation, terrain, and vegetation. When the above conditions create an avalanche hazard, avalanches can be triggered naturally by additional snowfall, temperature changes, rock fall, ice fall, and occasionally by earthquakes (Wong et al., 2011), or artificially by skiers, snowmobiles, and controlled explosive work. Thus, an induced seismic event could potentially serve as a trigger to a snow avalanche, but the potential for an avalanche would be controlled by the natural risk factors unrelated to human activity. If the avalanche hazards are high, winter visitors to the NNVM, such as backcountry skiers or snowmobilers, that venture onto slopes steeper than 25° will risk triggering an avalanche themselves (Daffern, 1992). Although the probability that induced seismicity will trigger an avalanche is low, if stimulation occurs in the winter, AltaRock will work with the FS to ensure that warning signs are posted at snow parks and other principal entrance points providing winter access to NNVM, warning that geothermal and other activities could trigger avalanches (see Section 5.4 for more details).
3.6.3 DamageClaimProceduresAlthough all assessments have determined that it is extremely unlikely that any damage will occur, AltaRock has prepared a process to receive reports of damage, and to assess and rectify damage claims. Instructions and a tentative form to report damage have been developed (attached as Appendix J) and will be made available to stakeholders on the project web sites, and other methods recommended by BLM and FS, if shaking measured by the SMS reaches PGA > 0.028 g. A licensed, independent civil engineer will evaluate all claims and identify the appropriate response. Section 5.4, Indirect Mitigation, further describes how the procedure for compensation will be implemented in the event that damage is reported.
3.7 CharacterizeTectonicandGeologicSettingNewberry Volcano is located at the intersection of three distinct structural zones, the Basin and Range, the Cascades Graben, and the Brother’s Fault Zone (Figure 2‐1), each with a different tectonic history, deformation style, and fault orientation. In addition, the local stress state at the EGS injection well NWG 55‐29 may be complicated by its proximity to ring fractures associated with caldera collapse. Cladouhos et al. (2011) provides further information on the regional setting of Newberry Volcano.
Four caldera ring fractures have been mapped on the northwest flank of Newberry (Sherrod et al., 2004). In the USGS database (Personius, 2002b), the ring fractures are classified as Class B: “Geologic evidence demonstrates the existence of Quaternary deformation, but either (1) the fault might not extend deeply enough to be a potential source of significant earthquakes, or (2) the currently available geologic evidence is too strong to confidently assign the feature to Class C but not strong enough to assign it to Class A.”23 In the entry for these faults Personius (2002b) states “these faults are everywhere concealed, and have been mapped on the basis of the topographic expression of these escarpments.” Despite the tenuous nature of their identification, the ring fractures have been the target of two wells and two core holes drilled by CalEnergy Exploration. However, no geothermal fluids were encountered
23 USGS Quaternary Fault and Fold Database Glossary
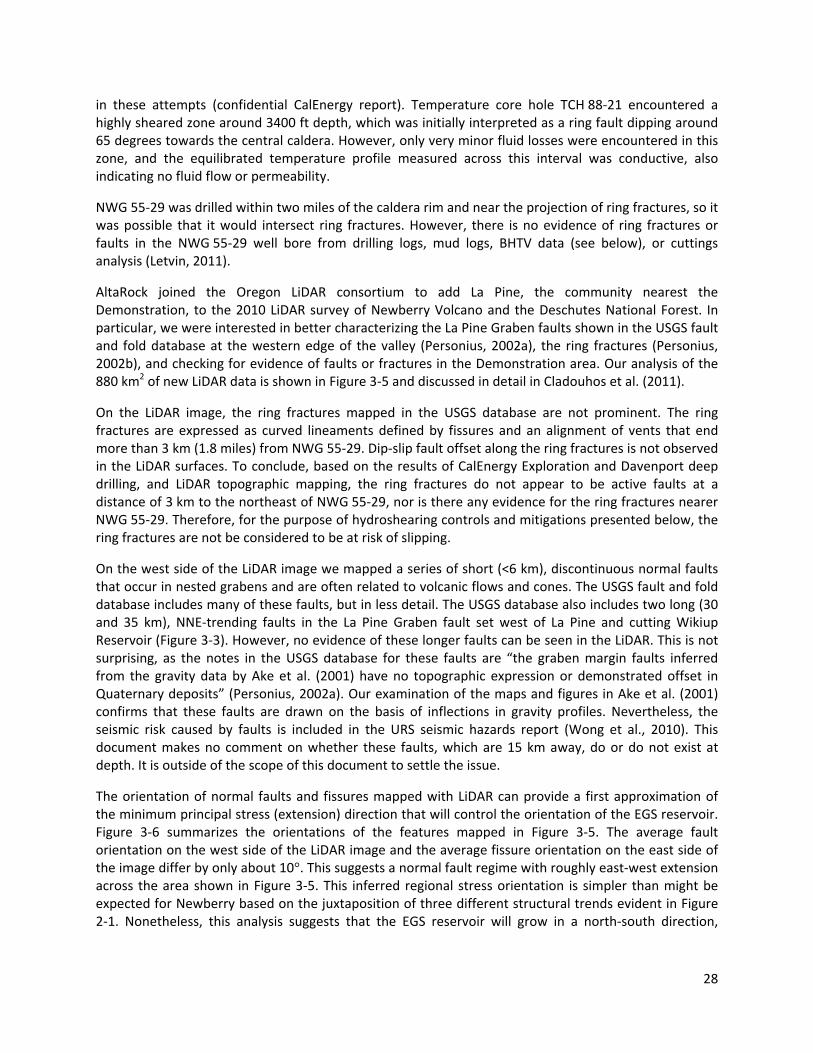
28
in these attempts (confidential CalEnergy report). Temperature core hole TCH 88‐21 encountered a highly sheared zone around 3400 ft depth, which was initially interpreted as a ring fault dipping around 65 degrees towards the central caldera. However, only very minor fluid losses were encountered in this zone, and the equilibrated temperature profile measured across this interval was conductive, also indicating no fluid flow or permeability.
NWG 55‐29 was drilled within two miles of the caldera rim and near the projection of ring fractures, so it was possible that it would intersect ring fractures. However, there is no evidence of ring fractures or faults in the NWG 55‐29 well bore from drilling logs, mud logs, BHTV data (see below), or cuttings analysis (Letvin, 2011).
AltaRock joined the Oregon LiDAR consortium to add La Pine, the community nearest the Demonstration, to the 2010 LiDAR survey of Newberry Volcano and the Deschutes National Forest. In particular, we were interested in better characterizing the La Pine Graben faults shown in the USGS fault and fold database at the western edge of the valley (Personius, 2002a), the ring fractures (Personius, 2002b), and checking for evidence of faults or fractures in the Demonstration area. Our analysis of the 880 km2 of new LiDAR data is shown in Figure 3‐5 and discussed in detail in Cladouhos et al. (2011).
On the LiDAR image, the ring fractures mapped in the USGS database are not prominent. The ring fractures are expressed as curved lineaments defined by fissures and an alignment of vents that end more than 3 km (1.8 miles) from NWG 55‐29. Dip‐slip fault offset along the ring fractures is not observed in the LiDAR surfaces. To conclude, based on the results of CalEnergy Exploration and Davenport deep drilling, and LiDAR topographic mapping, the ring fractures do not appear to be active faults at a distance of 3 km to the northeast of NWG 55‐29, nor is there any evidence for the ring fractures nearer NWG 55‐29. Therefore, for the purpose of hydroshearing controls and mitigations presented below, the ring fractures are not be considered to be at risk of slipping.
On the west side of the LiDAR image we mapped a series of short (<6 km), discontinuous normal faults that occur in nested grabens and are often related to volcanic flows and cones. The USGS fault and fold database includes many of these faults, but in less detail. The USGS database also includes two long (30 and 35 km), NNE‐trending faults in the La Pine Graben fault set west of La Pine and cutting Wikiup Reservoir (Figure 3‐3). However, no evidence of these longer faults can be seen in the LiDAR. This is not surprising, as the notes in the USGS database for these faults are “the graben margin faults inferred from the gravity data by Ake et al. (2001) have no topographic expression or demonstrated offset in Quaternary deposits” (Personius, 2002a). Our examination of the maps and figures in Ake et al. (2001) confirms that these faults are drawn on the basis of inflections in gravity profiles. Nevertheless, the seismic risk caused by faults is included in the URS seismic hazards report (Wong et al., 2010). This document makes no comment on whether these faults, which are 15 km away, do or do not exist at depth. It is outside of the scope of this document to settle the issue.
The orientation of normal faults and fissures mapped with LiDAR can provide a first approximation of the minimum principal stress (extension) direction that will control the orientation of the EGS reservoir. Figure 3‐6 summarizes the orientations of the features mapped in Figure 3‐5. The average fault orientation on the west side of the LiDAR image and the average fissure orientation on the east side of the image differ by only about 10°. This suggests a normal fault regime with roughly east‐west extension across the area shown in Figure 3‐5. This inferred regional stress orientation is simpler than might be expected for Newberry based on the juxtaposition of three different structural trends evident in Figure 2‐1. Nonetheless, this analysis suggests that the EGS reservoir will grow in a north‐south direction,

29
perpendicular to the direction of extension, on steeply dipping fractures, a conclusion further supported by the BHTV analysis discussed below.
Figure 3‐5. Oregon LiDAR Consortium image from the west flank of Newberry Caldera. Fault interpretations by AltaRock and reported in Cladouhos et al. (2011).
Figure 3‐6. Rose diagram of LiDAR scarps (left) and fissures (right) mapped in Figure 3‐5 (from Cladouhos et al., 2011). Concentric circles show percent of total measurements.

30
In October 2010, NWG 55‐29 was logged by the USGS and Temple University using a high‐temperature Borehole Televiewer (BHTV). The processed BHTV data became available in January 2011 (Figure 3‐7). Stress‐induced borehole breakouts were observed over many depth intervals in the well. Breakouts, caused by compressive failure of the borehole wall, have been analyzed by the USGS and Temple University to determine the orientation of the minimum horizontal stress and provide constraints on the relative magnitudes of the horizontal principal stresses, using image‐log analysis techniques applied in other deep geothermal wells (e.g., Davatzes and Hickman, 2006).
Davatzes and Hickman (2011; Appendix K) report that clear borehole breakouts are distributed throughout the BHTV image log and indicate a consistent minimum horizontal stress (Shmin) of 92.0° +/‐ 16.6°. The consistency of the stress direction implies that there are no actively slipping faults within the borehole. Boreholes near active fault zones can show horizontal axis stress rotations as large as 70° and 90°, as were observed in image logs from Coso (Davatzes and Hickman, 2006) and Dixie Valley (Hickman et al., 2000), respectively.
Davatzes and Hickman (2011) also report a natural fracture population of over 350 fractures in the 2425 feet logged interval in NWG 55‐29. They have identified two dominant fracture sets that strike NNE‐SSW and dip approximately 50° to the west and east. Poor expression of the fractures indicates that many of them might be partially healed. The relation between the natural fracture orientations and Shmin suggests a favorable setting for hydroshearing in NWG 55‐29.
The BHTV survey results (full log included as Appendix L) have been used to develop a stochastic fracture and flow model using the AltaStim software model allowing visualization of EGS stimulation scenarios. The inputs to this model include: (1) the three principal stress orientations and relative magnitudes; (2) natural fracture statistics (orientation, distribution, apparent aperture, and assumed radius); (3) geomechanical parameters of the fractures and reservoir rock; and (4) injection depth and pressure in the well bore. Further constraints on AltaStim inputs are discussed below in Sections 4.1 and 4.2. The AltaStim model provides an estimate of the geometry, spatial distribution and hydrologic properties of stimulated fractures to provide guidance for final planning of the Newberry EGS stimulation.

31
Figure 3‐7. Example section from BHTV image from October 2010 logging of well NWG 55‐29, processed to display two‐way travel time (left) and amplitude (right) of the reflected ultrasonic pulse. Characteristic features are labeled as L=lithological contact, F=natural fracture, and B=borehole breakout. The three dark, vertical bands are not natural features in the borehole, but rather are shadows produced by structural rods attached to the BHTV.

32
3.8 LessonsfromPastInjectionandEGSProjectsGeoscientists from the AltaRock team have studied the history of injection‐induced seismicity, starting with Rocky Mountain Arsenal in 1967 up through the Deep Heat Mining project in Basel, Switzerland. Some of the most relevant lessons learned from these projects are described in this section. Details of our analysis can be found in Cladouhos et al. (2010, 2011).
The Fenton Hill, New Mexico HDR (hot dry rock) project began in 1974 and was the first to use hydraulic stimulation to create an artificial geothermal reservoir. The geologic setting of Fenton Hill is similar to that of Newberry, on the western flank of Valles Caldera, just outside the ring fractures that define this large (20 km, or 12 mi diameter) caldera. The Valles Caldera is within the Rio Grande Rift, which is characterized by north‐south striking normal faults and east‐west crustal extension. During a December 1983 experiment, 850 microseismic events ranging in magnitude from ML ‐3 to ML 0 were reliably located by borehole seismometers (House et al., 1985). Given the similar tectonic setting, a low seismic response is also likely at Newberry. Thus, the Newberry MSA is being designed to detect events lower than M 0.0. We contacted individuals involved in the Fenton Hill project about providing additional data for comparison to Newberry but, unfortunately, were not be able to obtain data beyond what has been published.
Over two decades of research and development in EGS has been carried out at Soultz‐sous‐Forêts, France, resulting in a pilot program that currently includes a 200°C EGS reservoir, an injection well, two production wells, two downhole pumps and a 1.5 MWe binary power plant (Genter et al., 2009). Cladouhos et al. (2010) compared the stimulation of three different wells at Soultz (GPK2, GPK3, and GPK4) and found that the induced seismicity characteristics (maximum magnitude and event rate) and stimulation efficacy (improvement of injectivity and reservoir volume) are a function of the characteristics of the preexisting natural fractures and faults in the well bore. To stimulate the GPK2 well, about 6 million gallons of water was injected. The largest induced event recorded was M 2.5. The GPK3 stimulation used about 10 million gallons and the largest induced event recorded was M 2.9. The seismicity induced by stimulation of GPK2 was characterized by a few events in the range of M 2.0‐2.5 and numerous small events, resulting in a dense network of medium‐sized fractures and a 20‐fold increase in injectivity (Dorbath et al., 2009). In contrast, stimulation of the GPK3 borehole resulted in several seismic events in the range of M 2.0‐2.9, less permeability improvement, and 70% of the fluid flow occurring in the one existing major fracture or fault zone (which corresponded to a single widely opened fracture found in image logs at a measured depth of 4705 m (1540 ft) (Dorbath et al., 2009)). In GPK2, medium‐size microseismic events (M < 2.0) were the dominant source of seismic moment production, while in GPK3 the larger microseismic events (M between 2.0 and 2.9) accounted for most of the seismic moment (Dorbath et al., 2009). The cumulative seismic moment (the numerical sum of all fault movement) was less than a single M 3.5 event in both stimulations. The lesson learned in comparing GPK2 and GPK3 is that to maximize the effectiveness of hydroshearing, stimulation plans need to account for the features encountered by the well. At the Newberry EGS Demonstration, AltaRock diverter technology will allow modification of the stimulation depth if a single zone is producing larger seismic events (like the 4705 m fracture in GPK3) and thus higher risk and potentially a less efficient EGS.
In 2006, as part of the Deep Heat Mining (DHM) project in Basel, Switzerland, a deep well (DHM‐1) was drilled for the purpose of creating an EGS reservoir. Basel is an old city, built in the 14th and 15th centuries, and now has a metropolitan area with a population of almost 1 million people. Basel is located in the Upper Rhine Graben, one of the major tectonic features of Western Europe (Laubscher, 2001; Dèzes et al., 2004). Three sets of basement faults, prone to present‐day activation by neotectonic
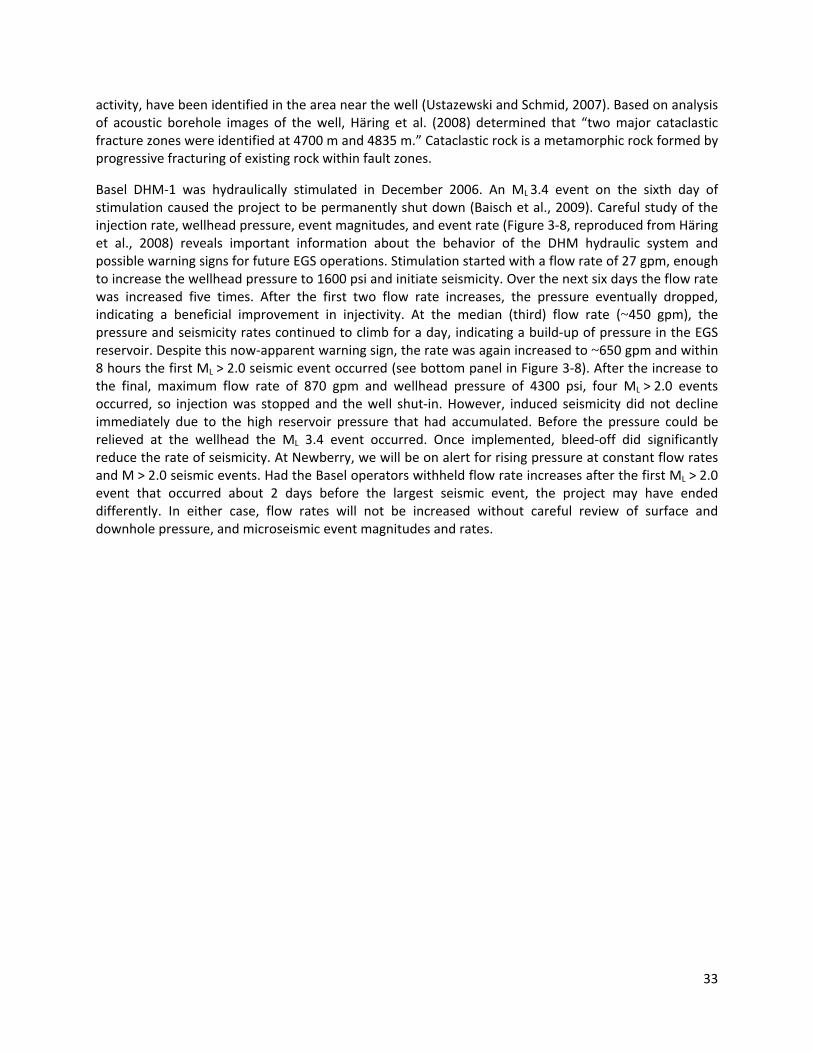
33
activity, have been identified in the area near the well (Ustazewski and Schmid, 2007). Based on analysis of acoustic borehole images of the well, Häring et al. (2008) determined that “two major cataclastic fracture zones were identified at 4700 m and 4835 m.” Cataclastic rock is a metamorphic rock formed by progressive fracturing of existing rock within fault zones.
Basel DHM‐1 was hydraulically stimulated in December 2006. An ML 3.4 event on the sixth day of stimulation caused the project to be permanently shut down (Baisch et al., 2009). Careful study of the injection rate, wellhead pressure, event magnitudes, and event rate (Figure 3‐8, reproduced from Häring et al., 2008) reveals important information about the behavior of the DHM hydraulic system and possible warning signs for future EGS operations. Stimulation started with a flow rate of 27 gpm, enough to increase the wellhead pressure to 1600 psi and initiate seismicity. Over the next six days the flow rate was increased five times. After the first two flow rate increases, the pressure eventually dropped, indicating a beneficial improvement in injectivity. At the median (third) flow rate (~450 gpm), the pressure and seismicity rates continued to climb for a day, indicating a build‐up of pressure in the EGS reservoir. Despite this now‐apparent warning sign, the rate was again increased to ~650 gpm and within 8 hours the first ML > 2.0 seismic event occurred (see bottom panel in Figure 3‐8). After the increase to the final, maximum flow rate of 870 gpm and wellhead pressure of 4300 psi, four ML > 2.0 events occurred, so injection was stopped and the well shut‐in. However, induced seismicity did not decline immediately due to the high reservoir pressure that had accumulated. Before the pressure could be relieved at the wellhead the ML 3.4 event occurred. Once implemented, bleed‐off did significantly reduce the rate of seismicity. At Newberry, we will be on alert for rising pressure at constant flow rates and M > 2.0 seismic events. Had the Basel operators withheld flow rate increases after the first ML > 2.0 event that occurred about 2 days before the largest seismic event, the project may have ended differently. In either case, flow rates will not be increased without careful review of surface and downhole pressure, and microseismic event magnitudes and rates.

34
Figure 3‐8. Reproduced from Häring et al. (2008).
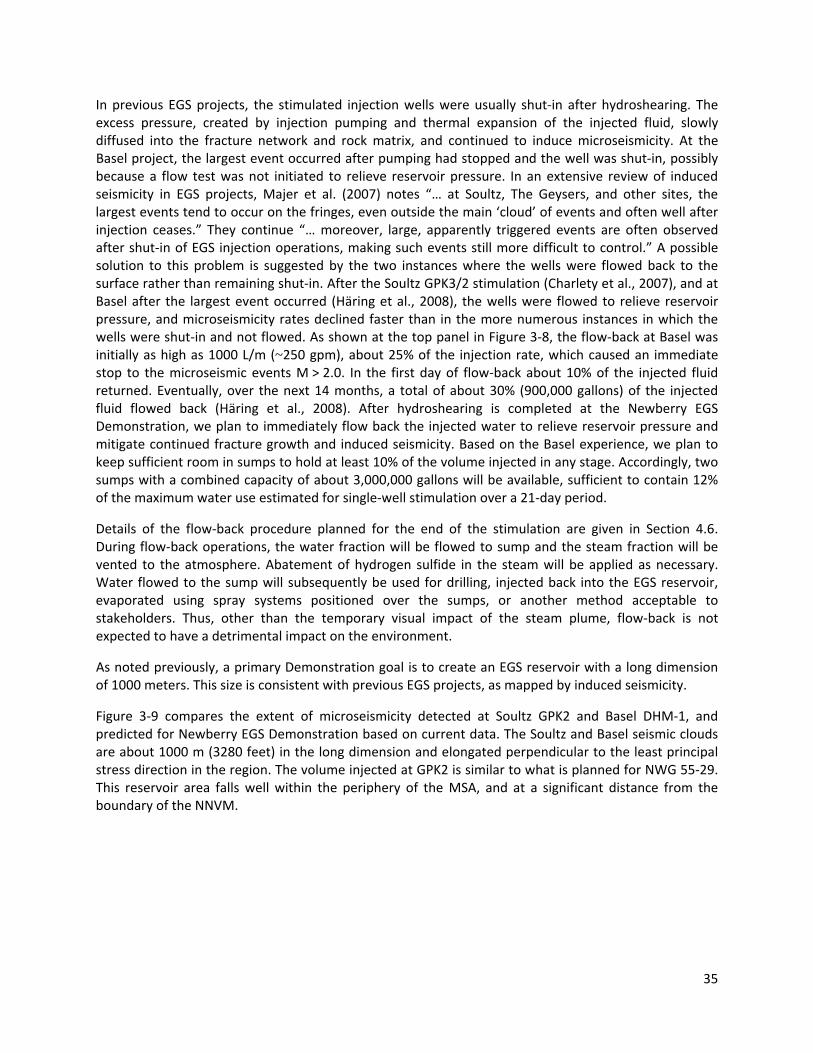
35
In previous EGS projects, the stimulated injection wells were usually shut‐in after hydroshearing. The excess pressure, created by injection pumping and thermal expansion of the injected fluid, slowly diffused into the fracture network and rock matrix, and continued to induce microseismicity. At the Basel project, the largest event occurred after pumping had stopped and the well was shut‐in, possibly because a flow test was not initiated to relieve reservoir pressure. In an extensive review of induced seismicity in EGS projects, Majer et al. (2007) notes “… at Soultz, The Geysers, and other sites, the largest events tend to occur on the fringes, even outside the main ‘cloud’ of events and often well after injection ceases.” They continue “… moreover, large, apparently triggered events are often observed after shut‐in of EGS injection operations, making such events still more difficult to control.” A possible solution to this problem is suggested by the two instances where the wells were flowed back to the surface rather than remaining shut‐in. After the Soultz GPK3/2 stimulation (Charlety et al., 2007), and at Basel after the largest event occurred (Häring et al., 2008), the wells were flowed to relieve reservoir pressure, and microseismicity rates declined faster than in the more numerous instances in which the wells were shut‐in and not flowed. As shown at the top panel in Figure 3‐8, the flow‐back at Basel was initially as high as 1000 L/m (~250 gpm), about 25% of the injection rate, which caused an immediate stop to the microseismic events M > 2.0. In the first day of flow‐back about 10% of the injected fluid returned. Eventually, over the next 14 months, a total of about 30% (900,000 gallons) of the injected fluid flowed back (Häring et al., 2008). After hydroshearing is completed at the Newberry EGS Demonstration, we plan to immediately flow back the injected water to relieve reservoir pressure and mitigate continued fracture growth and induced seismicity. Based on the Basel experience, we plan to keep sufficient room in sumps to hold at least 10% of the volume injected in any stage. Accordingly, two sumps with a combined capacity of about 3,000,000 gallons will be available, sufficient to contain 12% of the maximum water use estimated for single‐well stimulation over a 21‐day period.
Details of the flow‐back procedure planned for the end of the stimulation are given in Section 4.6. During flow‐back operations, the water fraction will be flowed to sump and the steam fraction will be vented to the atmosphere. Abatement of hydrogen sulfide in the steam will be applied as necessary. Water flowed to the sump will subsequently be used for drilling, injected back into the EGS reservoir, evaporated using spray systems positioned over the sumps, or another method acceptable to stakeholders. Thus, other than the temporary visual impact of the steam plume, flow‐back is not expected to have a detrimental impact on the environment.
As noted previously, a primary Demonstration goal is to create an EGS reservoir with a long dimension of 1000 meters. This size is consistent with previous EGS projects, as mapped by induced seismicity.
Figure 3‐9 compares the extent of microseismicity detected at Soultz GPK2 and Basel DHM‐1, and predicted for Newberry EGS Demonstration based on current data. The Soultz and Basel seismic clouds are about 1000 m (3280 feet) in the long dimension and elongated perpendicular to the least principal stress direction in the region. The volume injected at GPK2 is similar to what is planned for NWG 55‐29. This reservoir area falls well within the periphery of the MSA, and at a significant distance from the boundary of the NNVM.

36
A) B)
C)
Figure 3‐9. Comparison of microseismicity ‘clouds’ recorded at A) Soultz GPK2 stimulation (from Dorbath et al., 2009), B) Basel DHM‐1 stimulation (from Häring et al., 2008), and C) predicted 1 km elongate microseismic zone for Newberry EGS Demonstration (inset from Figure 3‐2). All maps are at the same scale, 1.5” = 1000 m.
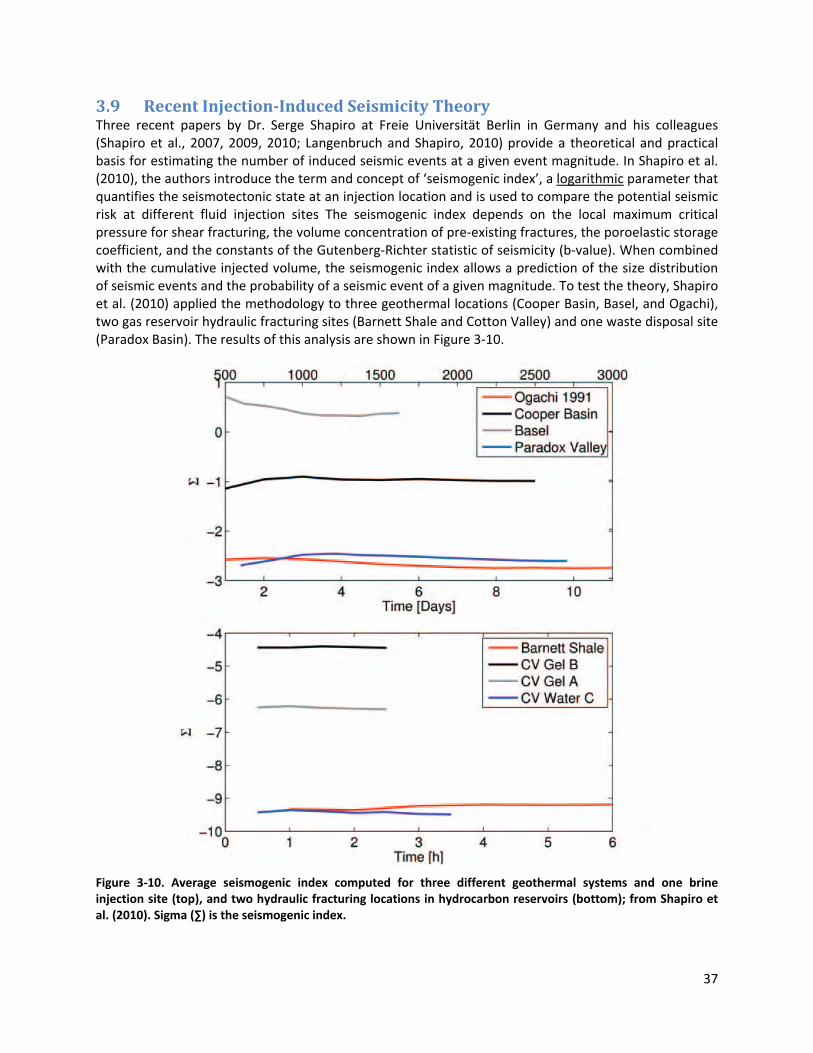
37
3.9 RecentInjection‐InducedSeismicityTheoryThree recent papers by Dr. Serge Shapiro at Freie Universität Berlin in Germany and his colleagues (Shapiro et al., 2007, 2009, 2010; Langenbruch and Shapiro, 2010) provide a theoretical and practical basis for estimating the number of induced seismic events at a given event magnitude. In Shapiro et al. (2010), the authors introduce the term and concept of ‘seismogenic index’, a logarithmic parameter that quantifies the seismotectonic state at an injection location and is used to compare the potential seismic risk at different fluid injection sites The seismogenic index depends on the local maximum critical pressure for shear fracturing, the volume concentration of pre‐existing fractures, the poroelastic storage coefficient, and the constants of the Gutenberg‐Richter statistic of seismicity (b‐value). When combined with the cumulative injected volume, the seismogenic index allows a prediction of the size distribution of seismic events and the probability of a seismic event of a given magnitude. To test the theory, Shapiro et al. (2010) applied the methodology to three geothermal locations (Cooper Basin, Basel, and Ogachi), two gas reservoir hydraulic fracturing sites (Barnett Shale and Cotton Valley) and one waste disposal site (Paradox Basin). The results of this analysis are shown in Figure 3‐10.
Figure 3‐10. Average seismogenic index computed for three different geothermal systems and one brine injection site (top), and two hydraulic fracturing locations in hydrocarbon reservoirs (bottom); from Shapiro et al. (2010). Sigma (∑) is the seismogenic index.

38
These case studies indicate that the seismogenic indices at the gas reservoirs were lower (<‐4), than the geothermal and waste injection locations (>‐3). At the geothermal areas investigated, Basel had the highest index (0.1), followed by Cooper Basin (‐1.0) and Ogachi (‐2.6). Thus, the Basel area has a seismogenic index more than two orders of magnitude higher than that of Ogachi. The Ogachi and Newberry EGS projects are both located on the edges of volcanic calderas, and thus are more tectonically and geologically similar to each other than Basel. Basel is located near the margin faults of a major continental rift with ample evidence of historic and neotectonic seismic activity (Ustazewski and Schmid, 2007).
The essence of Shapiro’s work is that, at any location, total injected volume controls induced seismicity rate and the magnitude of the largest likely seismic event. However, the seismicity induced by the same quantity of injected volume will vary widely depending upon the local geomechanical setting (stress and rock properties) of a particular injection site. The Shapiro approach is used by Fugro, in Appendix E, to provide a probabilistic prediction of maximum magnitude. Fugro concludes that, at a 95% probability, the maximum induced event for the Demonstration is predicted to be M < 2.2. AltaRock will continue to apply the Shapiro methodology to the Newberry EGS Demonstration site, including tracking and updating the seismogenic index (analogous to Figure 3‐10) as the stimulation proceeds.
4 OperationalProceduresThe Phase I Report, currently in preparation, will provide the analysis and background used as a basis for project planning, and will fully detail the operational plans for hydroshearing stimulation to be conducted in Phase II. Here we summarize information and plans most relevant to Induced Seismicity Controls and Mitigation.
4.1 EstimatedHydroshearPressureandFlowRatesIt is not possible, a priori, to predict the pressure required to initiate hydroshearing and improve permeability in NWG 55‐29. The estimated range of wellhead pressure required to initiate hydroshearing is 1160 to 2500 psig. The lower limit is based on the maximum pressure reached during the baseline injection test conducted in October 2010. In that test, a maximum pressure of 1153 psig produced an injection rate of 21 gpm; no improvement in well permeability was observed with prolonged pumping, indicating that the pressure required to overcome the frictional stress on existing fractures was not exceeded, and hydroshearing did not occur. The upper limit, 2500 psig, is based on the estimated pressure required to initiate tensile failure of the reservoir rock (‘hydrofracking‘) at the top of the open hole at 6500 feet. In EGS development, hydroshearing is used to open existing fractures, which is distinct from the practice hydrofracking, which uses higher fluid pressures to create new fractures. The upper bound of 2500 psig must be estimated because the minimum principal stress, which controls the minimum tensile failure pressure, has not been directly measured. As the EGS reservoir grows it may be necessary to exceed 2500 psig in order to overcome frictional losses (in the wellbore and fracture network) and deliver fluid pressure to the margins of the reservoir sufficient to cause hydroshearing. At higher wellhead pressures, the tensile failure pressure may be exceeded near the wellbore; however, the near‐wellbore fracture network developed early in the stimulation should remain self‐propped due to initiation in the hydroshearing regime.
The practical upper bound on the maximum surface pressure is 3500 psig, the rated casing burst pressure for the cemented 13‐3/8" casing in NWG 55‐29 at its deepest, exposed depth of 4,189 ft (top of the 9‐5/8” liner). The casing burst pressure is determined by the yield strength of steel in unsupported (i.e., un‐cemented) casing and includes a safety margin of 14% (Bourgoyne, 1986). The casing in NWG
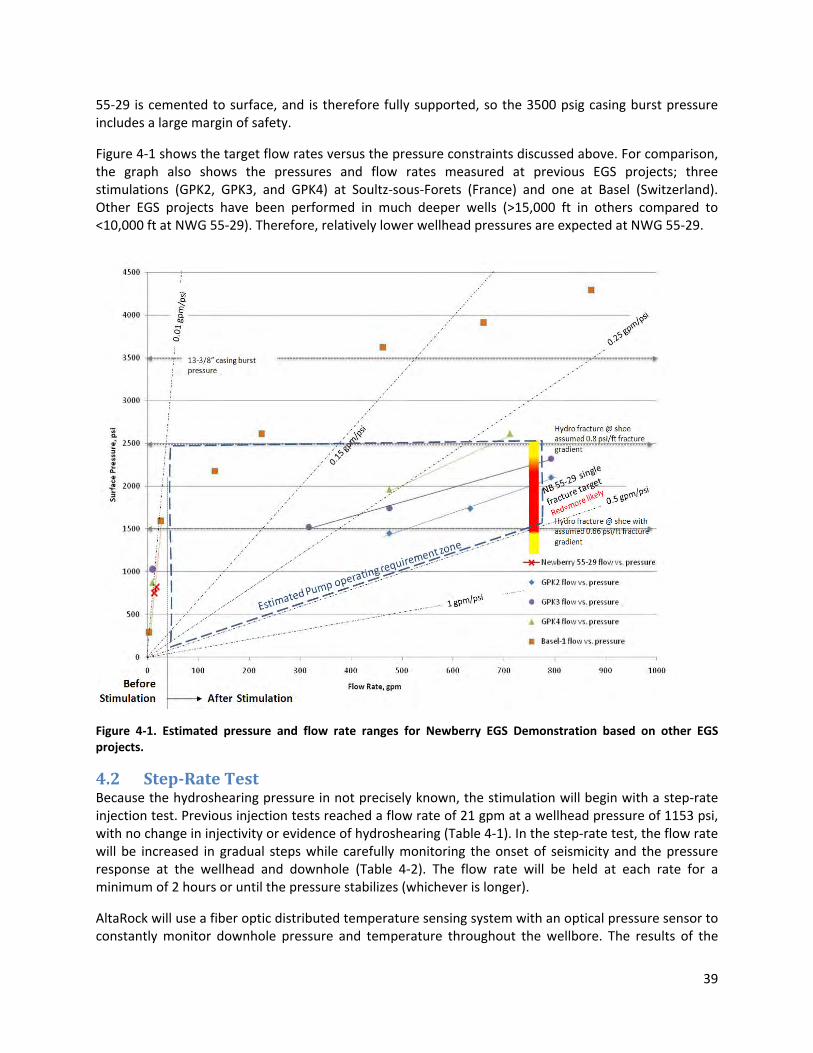
39
55‐29 is cemented to surface, and is therefore fully supported, so the 3500 psig casing burst pressure includes a large margin of safety.
Figure 4‐1 shows the target flow rates versus the pressure constraints discussed above. For comparison, the graph also shows the pressures and flow rates measured at previous EGS projects; three stimulations (GPK2, GPK3, and GPK4) at Soultz‐sous‐Forets (France) and one at Basel (Switzerland). Other EGS projects have been performed in much deeper wells (>15,000 ft in others compared to <10,000 ft at NWG 55‐29). Therefore, relatively lower wellhead pressures are expected at NWG 55‐29.
Figure 4‐1. Estimated pressure and flow rate ranges for Newberry EGS Demonstration based on other EGS projects.
4.2 Step‐RateTestBecause the hydroshearing pressure in not precisely known, the stimulation will begin with a step‐rate injection test. Previous injection tests reached a flow rate of 21 gpm at a wellhead pressure of 1153 psi, with no change in injectivity or evidence of hydroshearing (Table 4‐1). In the step‐rate test, the flow rate will be increased in gradual steps while carefully monitoring the onset of seismicity and the pressure response at the wellhead and downhole (Table 4‐2). The flow rate will be held at each rate for a minimum of 2 hours or until the pressure stabilizes (whichever is longer).
AltaRock will use a fiber optic distributed temperature sensing system with an optical pressure sensor to constantly monitor downhole pressure and temperature throughout the wellbore. The results of the

40
step‐rate testing will allow an optimal injection pressure and flow rate to be determined for initial hydroshearing.
Table 4‐1. Baseline injection test flow rates and pressures.
Injectivity Test Flow Rate (gpm)
Measured wellhead Pressure (psig)
Calculated Injectivity Index (gpm/psi)
10 751 0.03
21 1153 0.03
Table 4‐2. Step‐rate test flow rates and estimated pressures.
Step Rate Test: Flow rate Steps (gpm)1
Predicted wellheadpressure (psig)
Projected Injectivity Index (gpm/psi)
25 1275 0.03
50 2000 0.03
75 2050 0.50 (onset of hydroshearing)
150 2200 0.50
225 2350 0.50
300 2500 0.50
375 2650 0.50
450 2800 0.50
500 2900 0.501 The flow rate will be held at each rate for 2 hours or until the pressure stabilizes, whichever is longer. Flow rates will not be increased if pressures will exceed the rated casing burst pressure of 3500 psig or if the microseismic response exceeds the triggers (see Section 5). The estimated onset of hydroshearing and injectivity improvement shown here are hypothetical, for illustration purposes.
4.3 HorizontalDimensionsofEGSReservoirA goal of the project is create a sustainable EGS reservoir. Modeling by Jupe et al. (1995) suggests that 500 m (1650 ft) spacing between the injection and production wells at the EGS zone will provide sufficient surface area for sustainable heat exchange. Therefore, injection in each zone will continue until microseismicity indicates that fracture permeability has been extended to a long axis of at least 1000 m (3280 ft) to accommodate one injection well and two production wells. If our current understanding of the stress regime is correct, the main cloud of microseismicity will elongate in the north‐south direction and will be allowed to grow horizontally to a long dimension of 1000 m (3280 ft) (Figure 3‐2 and Figure 3‐9
Figure 3‐9). Note that EGS reservoir growth may be not be symmetric around the well and could grow further from the well in one direction than the other. The two production wells, to be drilled after the EGS reservoir creation phase, will be targeted to intersect the outer edges of the stimulated zone.
As shown in Figure 3‐9, all of the microseismicity at both Soultz GPK2 and Basel DHM‐1 occurred within a 500 m radius of the wells, although it was more tightly clustered at GPK2 than DHM‐1. We expect the microseismicity at Newberry to be similarly clustered, growing outward as the injected fluid opens connected fractures. Some event locations may be outliers and thus not representative of the main EGS reservoir. For this Demonstration, we define an outlier as any seismic event between 1 and 3 km from the midpoint of the open‐hole interval of NWG 55‐29. This is the area between the yellow and red circles in Figure 3‐2, and shown in cross‐section in Figure 4‐2. Events that might occur beyond 3 km cannot be reliably located by the MSA, but events greater than M 2.0 in this area would be detected by the regional network.

41
Figure 4‐2. Cross‐section and map showing expected EGS reservoir area, MSA and SMS station locations, horizontal and vertical growth limits, and trigger boundaries.
The NNVM boundary is about 2.3 km (1.4 mi) from the wellhead of NWG 55‐29 and 1.8 km from the bottom of the well. Thus, there is at least 800 m (0.5 mi) between the closest edge of the nearest possible (but unlikely) EGS reservoir and the NNVM. However, because of special concern by the BLM
42
and FS, a special, more aggressive mitigation action is designated for confirmed outliers within 500 m (1640 ft) of the NNVM. As noted in Section 3.2, models predict that horizontal errors up to 400 m are possible. Once the network is running, particularly as microseismic events are located within the MSA, location accuracy is expected to improve. However, even with a 400 m error, the 500 m buffer will protect areas within the NNVM from damage.
We note here that the legislation forming the NNVM24 provides that “nothing in this Act shall be construed as authorizing or directing the establishment of protective perimeters or buffer zones around the Monument or Special Management Area for the purposes of precluding activities outside the Monument and Special Management Area boundary which would otherwise be permitted under applicable law.” And also that “The fact that activities or uses outside the Monument and Special Management Area can be seen, heard, measured, or otherwise perceived within the Monument and Special Management Area shall not, of themselves, limit, restrict, or preclude such activities or uses up to the boundary of the Monument and the Special Management Area.” Nonetheless, AltaRock considers the establishment of this buffer to be a prudent mitigation step.
If a preliminary outlier location is identified during auto‐processing, an AltaRock seismologist will review the event to determine whether it is due to a location error. An outlier report will be transmitted to DOE, BLM, FS, PNSN and LBNL for review. If the event location is confirmed as an outlier by seismologists onsite, the onsite project manager will determine if a mitigation action will be triggered (see Section 5.2).
4.4 VerticalDimensionsofEGSReservoirFor a sustainable reservoir, it is important to maximize the temperature of the stimulated rock. Because intersecting reservoir rock cooler than 200°C (392°F) is not desirable, an upper vertical limit for reservoir growth is set at a depth of 6000 feet (~1.8 km) or about 328 feet (100 m) below sea level, the approximate depth of the 200°C temperature contour.
As discussed in the water monitoring document (AltaRock, 2010) and the independent consultant’s hydrology review (Kleinfelder, 2011), the base of the local groundwater resource is generally shallower than 1000 feet on the western flank of Newberry Volcano (Figure 4‐2). NWG 55‐29 penetrated volcanic rocks correlated to the Newberry, Deschutes, John Day Formations and, below ~8500 feet total vertical depth (TVD), subvolcanic intrusives presumed to be related to the Newberry volcano (AltaRock, 2010). In temperature profiles of NWG 55‐29 and other deep wells, the base of permeability is characterized by a transition from isothermal temperatures above to conductive thermal gradients below, indicating limited groundwater flow below a depth of 1000 feet (Figure 4‐2; Dames and Moore, 1994). Thus, setting a vertical growth boundary at 6000 feet TVD in NWG 55‐29 (horizontal orange line in Figure 4‐2) will provide a buffer of 5000 feet (1.5 km) of impermeable rock between the EGS reservoir and local groundwater resources. The vertical growth boundary will be monitored by both microseismicity (see Section 4.5 below) and by real‐time fiber optic temperature and pressure monitoring in the wellbore.
The stimulation zone (green square in Figure 4‐2) is within subvolcanic intrusives and the John Day Formation, which is recognized as a regional aquiclude (King, 1991). This generalization is substantiated locally by the low injectivity and bulk permeability calculated for the open hole intervals of core hole
24 Newberry National Volcanic Monument, Public LAS 101‐522‐Nov. 5, 1990; Section 8 Savings Provisions (a) and (c).

43
TCH 76‐15 and deep wells CEE 86‐21 and CEE 23‐22 (Spielman and Finger, 1998). These injectivities range from 0.0015‐0.026 kph/psi, several orders of magnitude lower than typical geothermal production wells.
4.5 SeismicMonitoringThe MSA will be used to constantly monitor the growth of the EGS reservoir during hydroshearing operations. At the operational center located near the well site, seismologists and engineers will be monitoring and comparing the injection rate, wellhead and downhole pressure, event locations, maximum event size, the size distribution of microseismicity (the b‐value), and other parameters 24 hours a day.
The Project Manager will ensure that a daily activity report is transmitted to the DOE, BLM, FS, PNSN and LBNL. The daily report will be accompanied by several graphs including surface pressure, bottom hole pressure and flow rate versus time, and temperature versus depth. The daily seismicity graphic will show events versus depth and distance from the well. The events will be color‐coded to differentiate recent and older events, and size‐coded to delineate event magnitude. These reports will be transmitted to designated third parties (e.g., DOE and BLM) by 11:00 am each day.
Raw seismic data will be provided in real‐time to LBNL, where software will automatically determine preliminary locations (epicenters) and magnitudes without review by a seismologist. AltaRock seismologists and engineers will review the microseismic data and provide timely refinements and analysis of induced microseismic event hypocenters and magnitudes, as well as the development of the EGS reservoir with respect to the Demonstration plans and goals. Contacts at organizations such the PNSN, DOE, BLM, FS and LBNL will be identified in advance (Table 4‐3) and notified of operational schedules, activities, and included on the distribution list for the daily reports (above) and exception reports (Section 5.2).
Table 4‐3. Contacts for Induced Seismicity Communications
Organization Contact Name Email Address Phone
Technical Notification and Review: Outlier, Trigger, and Mitigation Reports
Pacific Northwest Seismic Network (PNSN)
John Vidale [email protected] (206) 543‐6790
U.S. Department of Energy (DOE)
Eric Haas [email protected] (303) 275‐4728
Lawrence Berkeley National Lab (LBNL)
Ernest Majer [email protected] (510) 486‐6709
U.S. Bureau of Land Management (BLM)
Linda Christian [email protected] (541) 416‐6890
U.S. Forest Service (FS) Rod Bonacker [email protected] (541) 549‐7729
Emergency Notification: Seismic Event Reports
Deschutes County Sheriff Dispatch NA (541) 693‐6911
4.6 Flow‐BacktoReduceReservoirPressureandSeismicityOne significant difference between the injection strategy at the Newberry EGS Demonstration and prior EGS projects is the manner in which the excess pressure created by injection will be reduced. In this Demonstration, we plan to flow the well to pre‐installed surface test equipment immediately after hydroshearing is completed to relieve reservoir pressure. Reducing reservoir pressure is expected to decrease the fluid pressure in the EGS reservoir and reduce post‐hydroshearing induced seismicity.
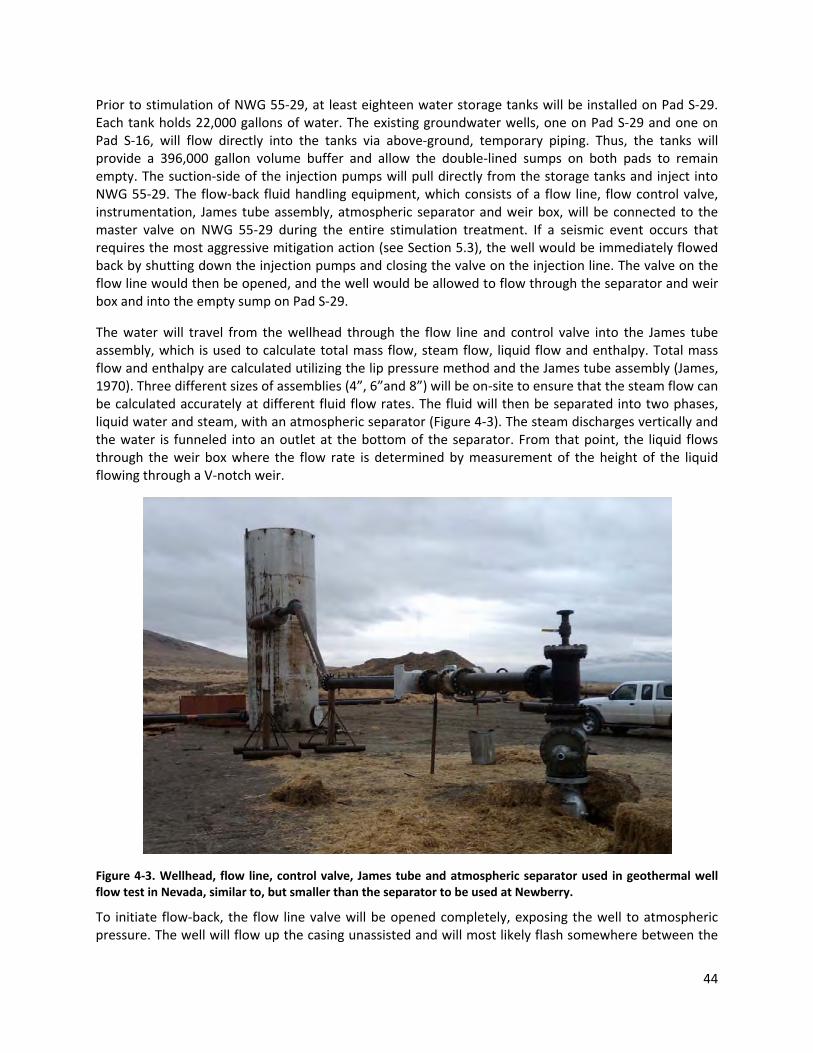
44
Prior to stimulation of NWG 55‐29, at least eighteen water storage tanks will be installed on Pad S‐29. Each tank holds 22,000 gallons of water. The existing groundwater wells, one on Pad S‐29 and one on Pad S‐16, will flow directly into the tanks via above‐ground, temporary piping. Thus, the tanks will provide a 396,000 gallon volume buffer and allow the double‐lined sumps on both pads to remain empty. The suction‐side of the injection pumps will pull directly from the storage tanks and inject into NWG 55‐29. The flow‐back fluid handling equipment, which consists of a flow line, flow control valve, instrumentation, James tube assembly, atmospheric separator and weir box, will be connected to the master valve on NWG 55‐29 during the entire stimulation treatment. If a seismic event occurs that requires the most aggressive mitigation action (see Section 5.3), the well would be immediately flowed back by shutting down the injection pumps and closing the valve on the injection line. The valve on the flow line would then be opened, and the well would be allowed to flow through the separator and weir box and into the empty sump on Pad S‐29.
The water will travel from the wellhead through the flow line and control valve into the James tube assembly, which is used to calculate total mass flow, steam flow, liquid flow and enthalpy. Total mass flow and enthalpy are calculated utilizing the lip pressure method and the James tube assembly (James, 1970). Three different sizes of assemblies (4”, 6”and 8”) will be on‐site to ensure that the steam flow can be calculated accurately at different fluid flow rates. The fluid will then be separated into two phases, liquid water and steam, with an atmospheric separator (Figure 4‐3). The steam discharges vertically and the water is funneled into an outlet at the bottom of the separator. From that point, the liquid flows through the weir box where the flow rate is determined by measurement of the height of the liquid flowing through a V‐notch weir.
Figure 4‐3. Wellhead, flow line, control valve, James tube and atmospheric separator used in geothermal well flow test in Nevada, similar to, but smaller than the separator to be used at Newberry.
To initiate flow‐back, the flow line valve will be opened completely, exposing the well to atmospheric pressure. The well will flow up the casing unassisted and will most likely flash somewhere between the

45
9‐5/8” casing shoe at 6,462 feet and 4,000 feet. For flow‐back planning purposes, we assume that the well will produce no more than 400 kph, or approximately 794 gpm. A total flow rate of 400 kph is equivalent to the maximum planned injection rate of 800 gpm that will be used to stimulate well NWG 55‐29. We estimate a single‐phase reservoir production temperature of 350°F, such that the total mass flow will have an enthalpy of 321.8 BTU/lbm and a flowing steam fraction of 16.3% at atmospheric pressure. With a steam fraction of 16.3%, we expect 665 gpm of liquid flow and 65 kph steam flow. These assumptions are reasonable because the well will have significantly cooled during injection operations and will not have sufficient time to re‐heat prior to flow‐back. If the formation temperature is higher, the enthalpy and steam fraction will also be higher, so the liquid storage requirement will be lower. At a temperature of 535°F, the production fluid would have a steam fraction of 37.6%, which equates to 495 gpm of liquid flow and 150 kph steam flow. The atmospheric separator has a total mass flow capacity of 743 kph for 350°F fluid production flow. The weir box, with a 10” tall, 90° V‐notch, has a liquid handling capacity of 2,000 gpm. This capacity is significantly higher than the expected liquid flow rate range of 495 to 665 gpm. The weir box discharges into the sump on Pad S‐29. At this production rate, the initially empty Pad S‐29 double‐lined sump will have sufficient capacity for about 70 hours of maximum liquid water flow, representing 11.6% of the injection stimulation water, which is expected to be 24,192,000 gallons if an injection rate of 800 gpm is applied for 21 days. If the Pad S‐29 sump begins to approach capacity (1.4 million gallons), while still allowing an adequate freeboard, redundant, high‐head transfer pumps will be in position to transfer water from the sump on Pad S‐29 to the sump on Pad S‐16 through the temporary piping. For redundancy, each pump will be capable of pumping 1,000 gpm of water uphill to Pad S‐16, which is 362 feet higher in elevation than Pad S‐29. Effectively, the two sumps will provide about 2.8 million gallons of geofluid storage capacity during the flow back operations. This is approximately 12% of the maximum estimated water usage for the 21‐day stimulation. Another system safeguard is the flow control valve, which can be partially closed to reduce the production rate if the sumps are nearing capacity. Water discharged to sumps will be removed by one of several methods. Whenever possible, water will be reinjected into the EGS reservoir. If the injection well is unavailable, and prior chemical analysis of sump liquid indicates non‐hazardous composition, water will be spread over roads and well pads for dust control. Otherwise, water will be evaporated using spray systems positioned over the sumps. Other than the visual impact of a steam plume, flow‐back will have no detrimental impact on the environment.
4.7 WellDrillingandCirculationTestingAfter stimulation is complete, a 3‐day flow test of NWG 55‐29 will be conducted using the same equipment and methods described in the previous section. Evaluation of the stimulation of NWG 55‐29 will include analysis of the efficacy of the Induced Seismicity Mitigation Plan presented here. Based on that analysis, the mitigation plan will be modified as necessary. Following a subsequent, second DOE stage‐gate review, two production wells will be drilled and tested, with each production test lasting up to 7 days. After two production wells are drilled into the EGS reservoir, NWG 55‐29 will be used as the injection well and the viability of the newly created EGS reservoir will be demonstrated through a reservoir circulation test lasting 30‐60 days. At this stage, additional reservoir growth is not expected nor desired from an operational perspective. However, it is unlikely that microseismicity will cease. At Soultz, the operators performed circulation testing spanning 6 years. In total, 1460 microseismic events were detected during the 850 days of circulation, including eight events with a magnitude between 2.0 and 2.3 (Cuenot et al., 2011). Therefore, the MSA array, operational center, and data uploads will continue to operate during the circulation test. The conclusion of the 30‐60 day circulation test will mark the end of Phase II of the Newberry EGS Demonstration. Seismic monitoring will continue into Phase III, wherein the information collected in Phase I and Phase II will be incorporated into a conceptual model of a full‐scale EGS power plant and wellfield.

46
5 ProposedControlsandMitigationThe controls proposed below are based on the analysis of the Newberry site‐specific geologic and environmental conditions presented above, and lessons learned from other EGS sites.
5.1 Growth,MagnitudeandShakingLimitsMitigation actions will be triggered when induced seismicity exceeds predefined limits in any one of the following three categories: (1) EGS reservoir growth outside the target stimulation zone or toward undesirable locations; (2) seismic event magnitudes in the reservoir that could lead to larger events; or (3) shaking that could disturb visitors to or threaten structures in the NNVM. For each category, there are intermediate levels designed to proactively manage potential problems. The limits are described first in this section. How the limits are used to trigger mitigation actions is described in Section 5.3. These limits and mitigation actions are summarized in Figure 5‐1.
Horizontal Growth Limits – In the simplest case, the 1000 m‐long EGS reservoir will be centered on the open‐hole section of the well bore (500 m in each direction). However, it is also possible that the EGS reservoir will grow primarily in one direction, in which case a perimeter of up to 1000 m (3280 ft) from the well is appropriate to allow creation of an adequate size reservoir (Figure 4‐2). Microseismic events further than 1000 m from the well will be considered outliers (see Section 4.3 for further discussion).
Vertical Growth – A seismic event with M > 1.0 or that can be picked on 5 or more MSA seismograms and is located shallower than 6000 feet (1.8 km) below the ground surface at NWG 55‐29 may indicate that the reservoir is growing shallower than desirable. This depth defines the minimum desired temperature of the EGS reservoir and maintains at least 5000 feet (1.5 km) of impermeable rock between the EGS reservoir and local groundwater resources.
Magnitude less than 2.0 – Most, and possibly all, seismic events will be smaller than M 2.0. Fugro (2011) determined the probability of generating an M > 2.0 event is between 0.1%‐6.0%; the probability of larger events is orders of magnitude lower (Section 3.4). At Fenton Hill, an EGS project conducted in a similar geologic setting, the largest events were M 0.0. Because of the way seismic event distributions follow the Gutenberg‐Richter law, if there were one M 2.0, there will be on the order of ten M 1.0, and a hundred M 0.0. This would result in a successful EGS demonstration. Seismic events with M < 2.0 will not be considered a concern unless they indicate growth of the EGS reservoir into undesirable locations.
Magnitude between 2.0 and 2.7 – Induced seismic event with M ≥ 2.0 would be similar in size to the few natural microseismic events recorded nearest NWG 55‐29. In addition, our study of the Basel EGS project (Section 3.7) indicates that M ≥ 2.0 events, the first of which occurred 2 days before the main M 3.4 event, and an additional four events that occurred within 16 hours of main event (Figure 3‐8), were warning signals that were ignored by those operators.
Magnitude between 2.7 and 3.5 – An M 2.7 seismic event releases seismic energy equivalent to about eleven (11) M 2.0 events (see Section 2.2). This magnitude is close to midway between the lower limit (2.0) and upper magnitude limit (3.5), and thus provides an alert before reaching the upper bound limit of M 3.5. In addition, at this level events that occur outside the perimeter of the MSA are reliably located by the regional network. Fugro (2011) concluded that the probability of an M > 3.0 event during the Demonstration is 0.01%‐0.8% (Section 3.4).
Magnitude greater than or equal to 3.5 – Wong et al. (2010) estimated that the upper‐bound range of maximum magnitudes for induced events would range from magnitude M 3.5 to 4.0. Seismic events larger than M 3.5 are not desirable, likely or expected, but are possible; events at or above this

47
magnitude will result in the most aggressive mitigation actions. Fugro (2011) concluded that the probability of an M > 4.0 event during the Demonstration is 0.002%‐0.09% (Section 3.4).
Measurements on PLVC‐SMS – Triggers based on measurement of peak ground acceleration (PGA) at the Paulina Lake Visitor Center SMS are intended to be proactive, triggering actions at shaking levels below which most visitors will notice, and well below levels of potential damage. The instrument‐measured shaking on PLVS‐SMS must be correlated in time to a microseismic event to prevent false positives caused by cultural noise. Because perceived shaking and damage due to PGA from EGS induced seismicity is thought to be lower than for natural events (Majer et al., 2007), we consider these PGA triggers to include large margins of safety.
Peak Ground Acceleration below 0.014 g – Below a PGA of 0.014 g, shaking is considered “weak” (see Table 2‐3, USGS Shake Maps and Wald et al., 1999). As described in Table 2‐1 and Table 2‐3, PGA < 0.014 g corresponds to a MMI Level III, which is equivalent to “vibrations similar to the passing of a truck.” Visitors to Paulina Lake regularly experience this level of seismic disturbance due to passing recreational vehicles, delivery trucks, loud motorcycles, and, in the winter, snowmobiles. The cautious shaking model of Wong et al. (2011) implies that an M 2.7 event at the well would produce shaking less than 0.014 g at PLVC (Figure 3‐4). There is no potential for damage at this level of shaking (Table 2‐3).
Peak Ground Acceleration between 0.014 g and 0.028 g – Above a PGA of 0.014 g, shaking is considered “light” (see Table 2‐3, USGS Shake Maps and Wald et al., 1999). As described in Table 2‐1 and Table 2‐3, PGA between 0.014 g and 0.039 g corresponds to a MMI Level IV which is equivalent to “sensation like heavy truck striking building.” There is no potential for damage at or below MMI Level IV. Wong et al. (2011) suggests that shaking at this level could trigger snow avalanches. FS has also expressed concern that, like snow avalanches, rock fall on talus slopes could be triggered by light shaking.
Peak Ground Acceleration greater than or equal to 0.028 g – Twice as much shaking as the previous limit but still within a level perceived as “light” and the potential for damage is “very light” (MMI Level IV, see Table 2‐3, USGS Shake maps and Wald et al., 1999). The cautious shaking model of Wong et al. (2011) implies an M 3.0 event could occur at the well and produce shaking less than 0.028 g (Figure 3‐3).
5.2 ExceptionReportsThe operational center will be staffed by seismologists who will refine waveforms auto‐picks, improve event locations, and track maximum event size and the size distribution of microseismicity (the b‐value) 24 hours a day. The daily report, transmitted at 11:00 am daily, is described in Section 4.5. Here we briefly describe the additional reports that will be prepared and transmitted to DOE, BLM, FS, PNSN and LBNL when exceptions occur:
Outlier Reports – An outlier report will document the location and waveforms of any seismic event picked on 6 or more stations that is initially located outside of the expected stimulation zone (i.e., >1000 m from the well or shallower than 6000 ft). The report will include all relevant information about the seismic event (location, size, time, number of picks, quality of picks, etc.) and stimulation conditions (e.g., flow rate, wellhead and downhole pressure, temperature profile). The report will document whether the outlier was confirmed or relocated by additional analysis. If the event is confirmed as an outlier, the mitigation action will be described. The report will be transmitted to the DOE, BLM, FS and LBNL within 2 hours after the outlier has been initially identified and the mitigation action initiated.
Trigger Reports – A trigger report will document that a magnitude or shaking trigger has been exceeded. The report will include all relevant information about the seismic event (e.g., location, size, time,

48
number of picks) and stimulation conditions (e.g., flow rate, wellhead and downhole pressure, temperature profile). The report will document whether the event was felt by anyone on the drill pad or reported by the public, and what mitigation action was initiated. The report will be transmitted to the DOE, BLM, FS and LBNL within 2 hours after the trigger occurs.
Seismic Event Phone Calls – For the higher magnitude and shaking levels, initial notification will be made by phone to inform the key personnel at the organizations listed in Table 4‐3. Calls will be made by the on‐duty site supervisor as soon as the event is reviewed by a seismologist, and in no case more than two hours after the event. A trigger report with details of the event analysis and mitigation actions will follow the phone alerts.
Mitigation Reports – After sufficient time has passed to evaluate the efficacy of a mitigation action, a summary report will document actions that were taken, and the seismic and well response.
5.3 TriggersandDirectMitigationActions1. Confirmed Outlier – A confirmed outlier with a magnitude greater than or equal to 2.0 will result in the use of diverter to shift stimulation to another zone. A confirmed outlier with a magnitude less than 2.0 will require a second confirming event (of any locatable magnitude) to trigger use of a diverter. Any planned increase in flow rate will be postponed until after the diverter is applied. The MSA radius is 3 km, making location and magnitude determination for events outside this area unreliable. Larger magnitude events can be detected by the PNSN regional network. For outliers exceeding the M 2.7 and M 3.5 magnitude triggers, the mitigation action for the magnitude limits will be used.
2. Outlier within 500 m of NNVM – Any confirmed outlier within 500 m (1640 ft) of the NNVM boundary will result in the use of diverter to shift stimulation to another zone. Any planned increase in flow rate will be postponed until after the diverter is applied.
3. Unwanted Vertical Growth – Any seismic event with M > 1.0 or that is picked on 6 or more stations of the MSA that is located shallower than 6000 feet (1.8 km) below the ground surface at NWG 55‐29 will result in use of diverter to shift stimulation to another zone. Any planned increase in flow rate will be postponed until after the diverter is applied.
4. Incomplete Diversion and Failure to Mitigate – After the decision to use diverter is made it may take up to 4 hours to prepare the diverter and apply it at the depth where diversion is required. Two diverter applications may be necessary to completely seal a fracture zone. Therefore, 8 hours may be required to determine whether diversion has succeeded. If growth into an undesired location continues eight hours after the event that triggered the diversion, the flow rate will be decreased as described below in Mitigation Action 6.
5. No Flow Rate or Pressure Increase – The stimulation plan is to increase flow rate every two hours as long as the seismic response is safe and the pressure remains lower than formation tensile failure and casing burst pressures (Figure 4‐1). However, the flow rate and wellhead pressure will not be increased for at least 24 hours if one or more events with M greater than or equal to 2.0 and less than 2.7 are located within the MSA radius (3 km). If a constant flow rate is leading to increasing pressure, keeping the wellhead pressure from increasing might require reducing the flow rate. Wellhead pressure increased at a constant flow rate of ~450 gpm during the fifth day of the Basel DHM‐1 project, indicating a build‐up of pressure in the EGS reservoir that was a possible precursor to ML > 2.5 seismic events (Figure 3‐8 and Section 3.5).

49
6. Decrease Flow Rate and Pressure – Any ground motion recorded on the Paulina Lake SMS with a PGA greater than 0.014 g that can be correlated in time to a seismic event will result in a reduction of flow rate. In addition, any seismic event with M greater than 2.7 and less than 3.5 and occurring within the 3 km (1.9 mi) radius of the MSA, as determined by the PNSN regional network or the MSA, will also result in a reduction of flow rate. The injection rate will be decreased so that the downhole pressure is reduced by 250 psi. If events with M greater than or equal to 2.0 continue to occur, the injection rate will be further decreased to achieve an additional 250 psi reduction. If more than 24 hours passes without M > 2.0 events, the flow rate may be gradually increased over a 24 hour period back to the rate prior to the triggering event. Beginning at this action level, instructions to report damage will be made available on the project websites. In addition to the written trigger reports, phone calls will be made to inform key personnel at the Technical Organizations and local Emergency Dispatch listed in Table 4‐3. In cooperation and prior agreement with FS, AltaRock will notify park visitors, users of Road 500 to Paulina Peak, and owners and users of NNVM assets (e.g., lodges and cabins) regarding the potential for induced seismicity, shaking, slope instability and other possible disturbance, and limit access to certain areas as agreed in advance with FS personnel.
7. Stop Injection and Flow Well – Any ground motion recorded on the Paulina Lake SMS with a PGA greater than 0.028 g that can be correlated in time to a seismic event within the 3 km (1.9 mi) aperture of the MSA will result in injection being halted. In addition, any seismic event detected within the 3 km (1.9 mi) aperture of the MSA with M greater than 3.5 as determined by PNSN or the AltaRock MSA, will also result in injection being halted. After injection is stopped, the well will be immediately flowed to surface test equipment to relieve reservoir pressure (see Section 4.6). Sufficient sump capacity will be available to store at least 10% of the injected fluid. Resumption of stimulation will be made only after consultation and agreement between AltaRock, DOE, BLM and FS. In addition to the written trigger reports, phone calls will be made to inform key personnel at the Technical Organizations and local Emergency Dispatch listed in Table 4‐3. In cooperation and prior agreement with FS, AltaRock will notify park visitors, users of Road 500 to Paulina Peak, and owners and users of NNVM assets (e.g., lodges and cabins) regarding the potential for induced seismicity, shaking, slope instability and other possible disturbance, and limit access to certain areas as agreed in advance with FS personnel.

50
Figure 5‐1. Decision tree for triggers and mitigation actions.
5.4 IndirectMitigationThe mitigation steps above are designed to minimize the likelihood of damage to structures, slopes and other assets in the NNVM. AltaRock believes that the safeguards and mitigation controls described above are based on the best possible science and engineering available prior to stimulation. However, because the history of EGS projects is limited and the seismic response of the rock volume surrounding NWG 55‐29 cannot be predicted with complete certainty, no guarantee can be made that no damage will occur. Therefore, AltaRock has also developed indirect mitigation plans for unlikely or worst case results.
1. Damage to structures – If shaking measured by the SMS reaches PGA > 0.05 g (Appendices I and J), it is possible that some cosmetic damage could occur to structures near Paulina Lake. Instructions and a tentative form to report damage have been developed (attached as Appendix J) and will be made available on the project websites25 and to owners and users of NNVM assets. If stakeholders notice new damage to the cabins, buildings, roads, or the dam after a felt, induced event occurs, they will be instructed by the project hotline, web sites and printed notifications to NNVM asset owners to submit the damage report within two months of event. A licensed, independent civil engineer, selected with the concurrence of all stakeholders, will evaluate all claims and compare any information collected prior to
25 http://www.newberrygeothermal.com/; http://www.altarockenergy.com/

51
stimulation (see Section 3.6) to the potential damaged condition, as well as the shaking recorded on the PLVC SMS, and the magnitude of the relevant induced seismic event. Payment for repairs will be based on engineering standards and the measured or inferred shaking, and whether the damage could have been caused by a demonstration project seismic event or events.
A similar approach has been used by the Geysers Seismic Monitoring Advisory Committee in Middletown, CA where about 10 M > 3.0, and 1‐2 M > 4.0, seismic events occur per year due to geothermal production and injection26. In the town of Anderson Springs, houses and cabins are very close (within 1 km) to the geothermal operations. Damage claims are evaluated by the Committee to evaluate the validity and value of damage compensation. Between 2004 and 2009, funds were approved by the committee for repairs to 19 properties totaling $63,29927. If long term operation ever occurred at Newberry a committee might be appropriate. For a quick response to an unlikely event, an independent expert is considered more appropriate for the short term Newberry EGS Demonstration.
2. Emergency Plans for Road Damage and Closures – AltaRock recognizes that some roads in the NNVM, particularly Road 500 to Paulina Peak, are quite steep and cross beneath slopes prone to rock fall or avalanche. Although it is unlikely that roads will become blocked by a seismicity‐triggered rock fall (it is closed in the winter season), this remote possibility cannot be ruled out. Therefore, AltaRock has developed the following plan to mitigate this risk during active field operations, including stimulation and flow testing.
Signs will be posted at the beginning of Road 500 for uphill traffic, and on Paulina Peak for downhill traffic, stating “Rock fall hazard ahead. Please contact 855‐EGS4USA toll‐free (855‐872‐4347) to report rocks on the road,” or alternative text approved by the FS. AltaRock will work with FS to ensure that the signs are in place two weeks before the stimulation and remain in place until at least the end of the three‐well circulation flow test.
A front‐end loader and equipment operator will be contracted in advance and on standby in La Pine, ready to remove any debris that falls onto roads from steep road cuts after a felt seismic event.
Arrangements will be made for a road flagging team to be available to control traffic during any partial or full road closure, or during cleanup of the road by the loader.
During, and for at least two months after, the stimulation and flow testing, response will be within 2 daylight hours after a slide is reported.
3. Snow Avalanche Warnings – If stimulation or flow test activities are conducted during the winter, visitors to the area will be warned of an increased risk of snow avalanches (Wong et al., 2011).
Signs will be posted at snow parks and other entrance points that provide winter access to NNVM. The signs will read “Warning: snow avalanche hazards exist on any slope steeper than 25°, including the slopes leading to Paulina Lake and East Lake from the Crater Rim. Skiers and snowmobilers, and geothermal demonstration activities occurring this winter can trigger avalanches on hazardous slopes. Call 855‐EGS4USA toll‐free (855‐872‐4347) for more information”, or alternative text approved by the FS. AltaRock will work with FS to ensure that
26 http://www.andersonsprings.org/EarthquakeCharts/smacnov2009stronggroundmotionanalysis1.pdf
52
these signs are in place two weeks before the stimulation and remain in place until at least the end of the three‐well circulation flow test.
4. Insurance – As part of AltaRock’s prudent risk management practices, it has obtained both general liability and umbrella liability insurance under which a third party may collect if AltaRock is found liable for damage caused by induced seismicity. AltaRock’s Commercial General Liability Insurance with the Federal Insurance Company, a subsidiary of the Chubb Group of Insurance with an A.M. Best Rating of A++, has a general aggregate limit of $2,000,000 and a $1,000,000 limit for each occurrence. The General Liability Policy covers bodily injury or property damage that AltaRock becomes legally obligated to pay by reason of liability. The General Liability Policy does not include an exclusion for “subsidence” which is defined as bodily injury or property damage arising directly or indirectly out of, caused by, resulting from, contributing to or aggravated by “subsidence, settling, sinking, slipping, falling away, caving in, shifting, eroding, mudflow, rising, tilting or any other movement of land or earth.” AltaRock also has Umbrella Liability Insurance with the Federal Insurance Company with a general aggregate limit and occurrence limit of $5,000,000.
6 ConclusionTo allay concerns that the Newberry EGS Demonstration may result in excessive induced seismicity and unacceptable seismic risk, AltaRock has conducted a series of investigations prior to any stimulation activity, including an Induced Seismicity and Seismic Hazards and Risk Analysis (Wong et al. 2010). Based on the results of these investigations, AltaRock will implement robust safeguards and mitigation controls during and after stimulation. The safeguards are built on a foundation of local geologic conditions and monitoring, lessons learned from previous EGS projects, and geomechanical theory. The safeguards proposed in this document detail how the EGS hydroshearing operations will be monitored and under what circumstances field operations will be modified or halted to mitigate the effects of induced seismicity. We are confident that this Induced Seismicity Control and Mitigation Plan will serve as an effective safeguard for the Newberry EGS Demonstration.
53
7 ReferencesAke, J., LaForge, R., and Hawkins, F. (2001). Probabilistic seismic hazard analysis for Wickiup Dam‐
Deschutes project, central Oregon: U.S. Bureau of Reclamation Seismotectonic Report 2000‐04, 71 p.
Aki, K., and G. Richards (1980). Quantitative Seismology, W. H. Freeman, New York.
ANSS (2011). Advanced National Seismic System Catalog search at http://quake.geo.berkeley.edu/anss/ catalog‐search.html, accessed 01/19/2011.
AltaRock (2010). Internal Memorandum by Owen Callahan, Newberry Water Monitoring. AltaRock Energy, Inc., 22 pp.
Baisch S., D. Carbon, U. Dannwolf, B. Delacou, M. Devaux, F. Dunand, R. Jung, M. Koller, C. Martin, M. Sartori, R. Secanell, and R. Vörös (2009). Deep Heat Mining Basel – Seismic Risk Analysis, downloaded from Basel‐Stadt website on April 25, 2010: http://www.wsu.bs.ch/serianex_teil_1_english.pdf
Bourgoyne, Adam T. (1986). Applied Drilling Engineering. Richardson, TX: Society of Petroleum Engineers. Pp. 307‐08.
Brune, J.N. (1970). Tectonic stress and the spectra of seismic shear waves from earthquakes, Journal of Geophysical Research, v. 75, p. 4997‐5009.
Charlety, J., Cuneot, L. Dorbath, C. Dorbath, H. Haessler, and M. Frogneux (2007). Large earthquakes during hydraulic stimulations at the geothermal site of Soultz‐sous‐Forêts, Int. J., of Rock Mech. & Mining Sci., 44, 1091‐1105.
Cladouhos, T., S. Petty, B. Larson, J. Iovenitti, B. Livesay, and R. Baria (2009). Toward More Efficient Heat Mining: A Planned Enhanced Geothermal System Demonstration Project, GRC Transactions, Vol. 33, pp. 165‐170.
Cladouhos, T., S. Petty, G. Foulger, B. Julian, and M. Fehler (2010). Injection Induced Seismicity and Geothermal Energy, GRC Transactions, 32, 1213‐1220.
Cladouhos, T., S. Petty, O. Callahan, W. Osborn, S. Hickman, and N. Davatzes (2011). The Role of Stress Modeling in Stimulation Planning at the Newberry Volcano EGS Demonstration Project, PROCEEDINGS, Thirty‐Sixth Workshop on Geothermal Reservoir Engineering, Stanford University, Stanford, California, January 31 ‐ February 2, 2011, pp. 630‐637.
Cuenot, N., M. Frogneux Michel, D. Catherine, and C. Marco (2011). Induced microseismic activity during recent circulation tests at the EGS site of Soultz‐Sous Forets (France). PROCEEDINGS, Thirty‐Sixth Workshop on Geothermal Reservoir Engineering, Stanford University, Stanford, California, January 31 ‐ February 2, 2011, pp. 638‐650.
Cypser, D.A. (1996). Colorado Law & Induced Seismicity.
http://www.darlenecypser.com/ColoradoLawandInducedSeismicity.html
Cypser, D.A., S.D. Davis (1998), Induced seismicity and the potential for liability under U.S. law. Tectonophysics, 289(1), 239–255. Davatzes, N.C, and S. Hickman (2006). Stress and faulting in the Coso Geothermal Feld: Update and recent results from the East Flank and Coso Wash, Proceedings 31st Workshop on Geothermal Reservoir Engineering, Stanford Univ., Stanford, CA, SGP‐TR‐179.
Daffern, T. (1992). Avalanche safety for skiers and climbers. Seattle, WA: Cloudcap. 192 p.
Davatzes, N.C. and S. Hickman (2006). Stress and faulting in the Coso Geothermal Field: Update and recent results from the East Flank and Coso Wash: Proceedings, Thirty‐First Workshop on Geothermal Reservoir Engineering, Stanford University, Stanford California, January 30‐February 1, 2006 SGP‐TR‐179.

54
Davatzes, N.C, and S. Hickman (2011). Preliminary Analysis of Stress in the Newberry EGS Well NWG 55‐29, final draft submitted to 2011 GRC meeting, attached as Appendix K.
Dezes, P., S.M. Schmid, and P.A. Ziegler (2004). Evolution of the European Cenozoic rift system; interaction of the Alpine and Pyrenean orogens with their foreland lithosphere. Tectonophysics 389(1‐2), 1‐33.
Dorbath, L., N. Cuenot, A. Genter, and M. Frogneux (2009). Seismic response of the fractured and faulted granite to massive water injection at 5 km depth at Soultz‐sous‐Forêts (France), Geophysical Journal International 177, no. 2 (May 1, 2009): 653‐675.
Duchane, D. and Brown, D., 2002, Hot dry rock (HDR) geothermal energy research and development at Fenton Hill, New Mexico, Quarterly Bulletin ‐ Oregon Institute of Technology. Geo‐Heat Center, December 2002, 23, 13‐19.
Foulger Consulting (2010). Newberry Calibration Shot Project, Internal Report to AltaRock Energy Inc. 10/09/2010, 104 p.
Foulger Consulting (2011). Task 1: Moment Tensors, Task 2: Sensor Selection, Task 3: Borehole Array Geometry, Internal Report to AltaRock Energy Inc. 2/15/2011, 67 p.
Genter A., D. Fritsch, N. Cuenot, J. Baumgartner, J‐J. Graff (2009). Overview of the Current Activities of the European EGS Soultz Project: from Exploration to Electricity Production, Proceedings, Thirty‐Fourth Workshop on Geothermal Reservoir Engineering Stanford University, Stanford, California, February 9‐11, 2009.
Häring, M.O., U. Schanz, F. Ladner, and B. Dyer (2008). Characterisation of the Basel 1 enchanced geothermal system, Geothermics, 37, 469‐495.
Hickman, S.H., M.D. Zoback, C.A. Barton, R. Benoit, J. Svitek, and R. Summers (2000). Stress and permeability heterogeneity within the Dixie Valley geothermal reservoir: recent results from well 82‐5. Proceedings, Twenty‐fifth workshop on Geothermal Reservoir Engineering, Stanford University, Jan. 24‐26, SGP‐TR‐165.
House, L., H. Keppler, and H. Kaieda (1985). Seismic Studies of a Massive Hydraulic Fracturing Experiment, GRC Transactions, Vol. 9, Part II, pp. 105‐110.
James, R. (1970). Factors Controlling Borehole Performance, Geothermics Special Issue 2, pp. 1502‐1515.
Jupe, A.J., Bruel, D., Hicks., T., Hopkirk, R., Kappelmeyer, O., Kohl, T., Kolditz, O., Rodrigues, N., Smolka, K., Willis‐Richards, J., Wallroth, T., and Xu, S., 1995, Modelling of a European Prototype HDR Reservoir, Geothermics, V.24, No. 3, 403‐419.
Keefer, D.K. (1984). Landslides caused by earthquakes. Bulletin of the Geological Society of America 95, 406‐421.
King, G. (1991). Technical Reconnaissance Report, Survey of Groundwater Resources, Upper Deschutes River Basin, Oregon. U.S. Bureau of Reclamation, In‐house report.
Kleinfelder (2011). Report, Independent hydrologist review report for EGS demonstration project, Newberry, OR. Kleinfelder West, Portland, OR, 35 pp.
Langenbruch, C. and S. Shapiro (2010). Decay rate of fluid‐induced seismicity after termination of reservoir stimulations. Geophysics, v. 75, no. 6, p. MA53‐MA62.
Laubscher, H. (2001). Plate interactions at the southern end of the Rhine Graben. Tectonophysics 343(1‐2), 1‐19.
Leonard, M. (2010). Earthquake fault scaling: self‐consistent relating of rupture length, width, average displacement, and moment release: Bulleting of the Seismological Society of America, v. 100, p. 1971‐1988.

55
Letvin, A.I. (2011). Analysis of drill cutting mineralogy and geophysical logs to investigate alteration history at Newberry well 55‐29 in preparation for EGS stimulation. MS Thesis, School for Renewable Energy Science, 199 pp.
Majer E.L., R. Baria, R., M. Stark, S. Oates, J.B. Bommer, Smith, B., and H. Asamuma (2007). Induced seismicity associated with Enhanced Geothermal Systems, Geothermics v 36, 185‐222.
Majer, E., R. Baria, and M. Stark (2008). Protocol for induced seismicity associated with enhanced geothermal systems. Report produced in Task D Annex I (9 April 2008), International Energy Agency‐Geothermal Implementing Agreement (incorporating comments by: C. Bromley, W. Cumming, A. Jelacic and L. Rybach). Available at: http://www.iea‐gia.org/publications.asp.
Majer, E., J. Nelson, A. Robertson‐Tait, J. Savy, and I. Wong (2011). (Final Draft) Protocol for Addressing Induced Seismicity Associated with Enhanced Geothermal Systems (EGS). Available at: http://esd.lbl.gov/files/research/projects/induced_seismicity/egs/EGS‐IS‐Protocol‐Final‐Draft‐20110531.pdf
McGarr, A. (1976). Seismic moments and volume changes: Journal of Geophysical Research, v. 81, p. 1487.
Osborn, W. L., Petty, S., Nofziger, L. L., and Perry, D. (2010). Newberry Volcano EGS Demonstration, GRC Transactions, 34, 1213‐1220.
Personius, S.F., compiler (2002a). Fault number 838, La Pine graben faults, in Quaternary fault and fold database of the United States: U.S. Geological Survey website, http://earthquakes.usgs.gov/reg3ional/qfaults, accessed 01/13/2011 01:44 PM.
Personius, S.F., compiler (2002b). Fault number 1806, Newberry volcano ring faults, in Quaternary fault and fold database of the United States: U.S. Geological Survey website, http://earthquakes.usgs.gov/regional/qfaults, accessed 01/14/2011 03:49 PM.
Shapiro, S., C. Dinske and J. Kummerow (2007). Probability of a given‐magnitude earthquake induced by fluid injection. Geophysical Research Letters V34, L14312.
Shapiro, S. A., and C. Dinske (2009). Scaling of seismicity induced by nonlinear fluid‐rock interaction, J. Geophys. Res.,114, B09307, doi:10.1029/2008JB006145.
Shapiro, S. A., C. Dinske, C. Lagenbruch, and F. Wenzel (2010). Seismogenic index and magnitude probability of earthquakes induced during reservoir fluid stimulations. The Leading Edge, March 2010,. 304‐309.
Sherrod, D.R., E.M. Taylor, M.L. Ferns, W.E. Scott, R.M. Conrey, and G.A. Smith (2004). Geologic map of the Bend 30‐x60‐minute quadrangle, central Oregon; U.S. Geol. Survey Geologic Investigations Series 1‐2683.
Spielman, P.B., and J.T. Finger (1998). Well Test Results of Exploration Drilling at Newberry Crater, Oregon in 1995. Proceedings, Twenty‐third workshop on Geothermal Reservoir Engineering, Stanford University, Jan. 26‐28, SGP‐TR‐158.
Ustaszewski, K., and S.M. Schmid (2007). Latest Pliocene to recent thick‐skinned tectonics at the Upper Rhine Graben‐Jura Mountains junction. Swiss J. Geosci. 100(2), 293‐312.
Wald, D.J., V. Quitoriano, T.H. Heaton, and H. Kanamori (1999). Relationships between peak ground acceleration, peak ground velocity, and modified Mercalli intensity in California. Earthquake Spectr. 15, 557–564.
Wong, I., S. Pezzopane, M. Dober, and F. Terra (2010). Evaluation of Induced Seismicity / Seismic Hazards and Risk, for the Newberry Volcano EGS Demonstration, internal report to AltaRock Energy, 24 November 2010.

56
Wong, I., S. Pezzopane, and F. Terra (2011). Development of scenario ground shaking maps and evaluations of the impacts of ground shaking on local buildings, avalanches, and the Lava River Cave, Newberry Volcano EGS Demonstration, internal report to AltaRock Energy, 28 January 2011.

57
10 AppendixC‐ComplianceMatricestoInducedSeismicityProtocolsTable C1: Compliance Matrix, 2008 Protocol28
IEA/DOE Step
Section (in this document)
Status
1. Review Laws Evaluate Regulations 3.1 Complete
2. Assess Natural Seismic Hazard Potential 3.3 – 3.9 Complete
2a. Collect background seismicity data 3.3 Ongoing
2b. Characterize Geologic and Tectonic Setting 3.7 Complete
3. Assess Induced Seismicity Potential 3.4, 3.5 Complete
3a. Induced seismicity mitigation plan 5 Proposed here
4. Establish a Dialogue with Regional Authority 3.2, Appendix D Complete
4a. Monitor and report operational data and events 4.5, 5.2 Ongoing
5. Educate Stakeholders 3.2, Appendix D Ongoing
6. Establish Microseismic Monitoring Network 3.3, 4.5 Ongoing
7. Interact with Stakeholders 3.2, 5 Ongoing
8. Implement Procedure for Evaluating Damage 3.6.3, 5.4 Complete
Table C2: Compliance Matrix, 2011 Protocol
DOE Step Section
(in this document)
Step 1: Perform Preliminary Screening Evaluation 2
Step 2: Implement an outreach and communication program
3.2, 4.5, 5.2
Step 3: Identify criteria for ground vibration and noise 3.1
Step 4: Establish seismic monitoring 3.3, 4.5
Step 5: Quantify the hazard from natural and induced seismic events
3.3, 3.4, 3.5, 3.6, 3.7, 3.8, 3.9
Step 6: Characterize the risk from induced seismic events
3.4, 3.5, 3.6.3, 5.4
Step 7: Develop risk‐based mitigation plans 3.2, 3.6.3, 4.2, 5
28 Sub‐steps 2a, 2b, 3a, and 4a can be found in text of Majer et al., 2008.

58
11 AppendixD–CommunityOutreachMeetings,PresentationsandPublications
Table D1: Presentations – Community Outreach Meetings
Forum and Date Presentation
La Pine, OR, July 15, 2010 General public
Sunriver, OR, Aug 11, 2010 General public
Bend, OR, Sept 25, 2010 General public
La Pine, Oregon, November 10, 2010 General public; field trip to project well site
Table D2: Presentations and Publications – Professional Meetings
Forum and Date Paper Title Authors
GRC 2010 ‐ Presentation and Publication
Newberry Volcano EGS Demonstration
William L. Osborn, Susan Petty, Laura L. Nofziger, and Douglas Perry
GRC 2010 ‐ Presentation and Publication
Injection Induced Seismicity and Geothermal Energy
Trenton Cladouhos, Susan Petty, Gillian Foulger, Bruce Julian and Mike Fehler
AGU 2010 ‐ Abstract and Presentation
Stimulation Controls and Mitigation of Induced Seismicity for EGS Projects
Susan Petty, Trenton Cladouhos, Will Osborn, and Joe Iovenitti
AGU 2010 ‐ Abstract and Poster
Development of Exploration Methods for Engineered Geothermal Systems through Integrated Geophysical, Geologic and Geochemical Interpretation
Joe L Iovenitti, Ileana Tibuleac, Deborah Hopkins, Trenton Cladouhos, Robert Karlin, Philip Wannamaker, B. M. Kennedy, David Blackwell, and Matthew Clynne
Stanford 2010 ‐ Presentation and Publication
The In Situ Formation of Calcium Carbonate as a Diversion Agent for Use in Engineered Geothermal Systems
Pete Rose, Scott Fayer, Susan Petty, and Daniel Bour
Stanford 2010 ‐ Presentation and Publication
Reverse Circulation Method and Durable Cements Provide Effective Well Construction: A Proven Technology
Rafael Hernandez, Daniel Bour
Stanford 2010 ‐ Presentation and Publication
Strength Retrogression in Cements Under High‐Temperature Conditions
Benjamin Iverson and Joe Maxson, Halliburton, and Daniel Bour, AltaRock Energy, Inc.
Stanford 2010 ‐ Presentation and Publication
Non‐Portland Cement‐Based Systems for Geothermal Well Use
Lance Brothers, Benjamin Iverson – Halliburton, Daniel Bour – AltaRock Energy Inc.
GRC 2010 ‐ Presentation and Publication
Development of a Downhole Fluorimeter for Measuring Flow Processes in Geothermal and EGS Wellbores
Pete Rose, Scott Fayer, Steve Olsen, Susan Petty, and Daniel Bour

59
DOE Peer Review Oct 2010 ‐ Presentation
Newberry Volcano EGS Demonstration
Susan Petty
Stanford 2011 ‐ Presentation and Publication
Fluid Diversion in an Open‐Hole Slotted Liner – A First Step in Multiple Zone EGS Stimulation
Susan Petty, Laura Nofziger, Daniel Bour, Yini Nordin
Stanford 2011 ‐ Presentation and Publication
The role of a stress model in stimulation planning at the Newberry Volcano EGS Demonstration
Trenton T. Cladouhos, Susan Petty, Owen Callahan, Will Osborn, Steve Hickman and Nicholas C. Davatzes
Hedberg Conference Napa, CA, March 2011 ‐ Presentation
Multiple Zone Stimulation of Newberry EGS Project – Key to Reservoir Optimization and Minimizing Cost of EGS Power Production
Susan Petty, Laura Nofziger, Daniel Bour, Yini Nordin
GRC 2011 ‐ Presentation and Publication (pending)
Newberry Volcano EGS Demonstration – Phase I Results
William L. Osborn, Susan Petty, Trenton T. Cladouhos, Joe Iovenitti, Laura L. Nofziger, Owen Callahan, Douglas Perry and Paul L. Stern
GRC 2011 ‐ Presentation and Publication (pending)
Newberry Volcano EGS Demonstration Stimulation Modeling
Trenton T. Cladouhos, Matthew Clyne, Maisie Nichols, Susan Petty, William L. Osborn, and Laura Nofziger

60
Table D3: Presentations, Meetings and Discussions ‐ Media, Politicians and Other Stakeholders
Date Location Attendees Involvement
08/31/09 Bend, OR KOHD News Media
09/28/09 Telephone
Bend Bulletin ‐Kate Ramsayer
Media
10/16/09 Telephone
Representative for Senator Ron Wyden ‐David Blair
Politician
10/30/09 Telephone
KTVZ ‐Barney Lerten
Media
10/30/09 Telephone
Bend Bulletin ‐Kate Ramsayer
Media
11/03/09 Bend, OR
Environmental Center ‐Mike Riley Deschutes River Conservancy ‐Tod Heisler, Scott McCaulou
Community Members
11/04/09 Bend, OR
Oregon Wild ‐Tim Lillebo
Community Members
11/04/09 Bend, OR
Representative for Senator Jeff Merkley ‐Jonathan Manton
Politician
11/16/09 Telephone Bend Bulletin Media
11/10/09 La Pine, OR
Deschutes County Planning Department Public Meeting
Community Members
11/30/09 Sunriver, OR
Deschutes County Planning Department Public Meeting
Community Members
11/30/09 Sunriver, OR
Sunriver Owners Association ‐Brook Snavely
Media/Community Member
12/08/09 Bend, OR
Landwatch ‐Erik Kancler
Community Member
12/08/09 Bend, OR
Warm Springs Power, CTWS ‐Jim Manion ‐Bobby Brunoe
Community Member
12/14/09 Bend, OR
Forest Resources Council ‐Chuck Burley
Community Member
12/14/09 Bend, OR Senator Chris Telfer Politician
12/14/09 Bend, OR State Representative Judy Stiegler, District 54 Politician
12/15/09 Bend, OR Deschutes Co. Commissioner Alan Unger Politician
12/15/09 Bend, OR
Representatives for Congressman Greg Walden ‐Nick Strader ‐Colby Marshall
Politician

61
12/15/09 Bend, OR KOHD News Media
12/15/09 Telephone Bend Bulletin Media
12/16/09 Bend, OR State Representative Gene Whisnant, District 53 Politician
01/05/10 Bend, OR Dennis Hanson Community Member
02/04/10 Salem, OR
Representative for Rep. Judy Stiegler, District 54‐Linda Rohrback
Politician
02/04/10 Salem, OR
Representative for Rep. Gene Whisnant, District 53 ‐Megan Schenewerk
Politician
02/04/10 Salem, OR
Office of the Treasurer ‐James Sinks
Politician
02/23/10 La Pine, OR
Russell Construction Company ‐Victor and Vickie Russell
Community Members
02/23/10 La Pine, OR
La Pine Industrial Group ‐Leland Smith
Community Member
02/23/10 La Pine, OR
Newberry Eagle ‐Sandra Jones
Media
02/23/10 Sunriver, OR
Sunriver Owners Association ‐Brook Snavely
Media/Community Member
02/24/10 Bend, OR
Bend Radio Group ‐RL Garrigus
Media
02/24/10 Bend, OR
EDCO ‐Roger Lee ‐David Stowe
Community Member
02/24/10 Bend, OR
Cascade Business News ‐Pamela Hulse Andrews
Media
03/18/10 Bend, OR
Tillamook County Commissioner ‐Tim Josi
Politician
03/22/10 Bend, OR
Environmental Center ‐Mike Riley
Community Member
03/22/10 Bend, OR
Representative for Senator Ron Wyden ‐David Blair Representative for Senator Jeff Merkley ‐Jonathan Manton
Politician
03/23/10 Portland, OR Oregon Geothermal Working Group Trade Organization
03/24/10 Bend, OR
Representatives for Congressman Greg Walden ‐Nick Strader
Politician
03/24/10 Bend, OR EDCO Community Member
03/24/10 Bend, OR
Representative for Senator Jeff Merkley ‐Jonathan Manton
Politician

62
04/21/10 Bend, OR
EDCO ‐Roger Lee ‐David Stowe ‐Scott Larson
Community Members
04/27/10 Bend, OR
Representative for Senator Jeff Merkley ‐Jonathan Manton
Politician
05/12/10 La Pine, OR La Pine City Council Politicians
05/12/10 La Pine, OR Paulina Lake Lodge Staff Community Members
05/19/10 Bend, OR
EDCO ‐Roger Lee ‐David Stowe ‐Scott Larson
Community Members
05/20/10 Sunriver, OR Sunriver Men's Club Community Members
06/09/10 Email
Senator Jeff Merkley, Senator Ron Wyden, Congressman Greg Walden
Politicians
06/18/10 La Pine, OR
La Pine Chamber of Commerce ‐Members Breakfast
Community Members
06/23/10 Bend, OR State Representative Judy Stiegler, District 54 Politician
06/26/10 Telephone
La Pine City Manager ‐Rick Allen
Politician
06/29/10 Bend, OR
Deschutes County Commission ‐Alan Unger
Politician
07/01/10 Bend, OR
Juniper Group Sierra Club ‐David Stowe
Community Member
07/01/10 Bend, OR
Bend Bulletin ‐Editorial Board
Media
07/10/10 Redmond, OR Oregon Veteran's Job Fair Community Members
07/13/10 Bend, OR
Representative Judy Stiegler, District 54 ‐Rep. Steigler aide Linda Rohrback Representative Gene Whisnant, District 53
Politicians
07/14/10 Bend, OR
Bend Bulletin ‐Kate Ramsayer
Media
07/14/10 Bend, OR
Representative for Senator Jeff Merkley ‐Susanna Julber
Politician
07/15/10 La Pine, OR
Deschutes County Commission Candidate ‐Tony DeBone
Politician
07/21/10 Bend, OR
Deschutes Co. Commissioner Candidate ‐Dallas Brown
Politician
07/21/10 Bend, OR Jonathan Manton Politician
08/12/10 Bend, OR
Deschutes Co. Commissioner Candidate ‐Dallas Brown
Politician
08/25/10 Bend, OR Osher Lifelong Learning Series (20 citizens) Community Members

63
09/08/10 Telephone
The Source Weekly ‐Eric Flowers
Media
09/17/10 Email
Forest Resources Council ‐Chuck Burley
Community Member
11/05/10 Bend, OR Jonathan Manton Politician
11/09/10 Portland, OR
Northwest Association of Environmental Engineers
Trade Organization
11/11/10 Bend, OR
Deschutes River Conservancy ‐Scott McCaulou ‐Gen Hubert
Community Members
11/18/10 Sunriver, OR
Sunriver Environmental Services ‐Terry Penhollow
Community Member
12/07/10 La Pine, OR La Pine Lodgepole Dodgers Snowmobile Club Community Members
12/08/10 Email
Sunriver Owners Association ‐Brook Snavely
Media/Community Member
02/14/11 Washington DC Energy Now Media
03/14/11 La Pine, OR La Pine High School Community Member
03/17/11 Bend, OR
Wayne Kinney (Wyden), S Julber (Merkley) & N Strader (Walden)
Politicians
Table D4: Presentations, Meetings and Discussions ‐ Regulators
Bend, OR, Mar 8, 2010 Deschutes County
Bend, OR, Apr 23, 2010 BLM and FS
Bend, OR, May 15, 2010 Deschutes County
Prineville, OR, June 30, 2010 BLM, FS, DOE, DOGAMI, DEQ
Bend, OR, July 20, 2010 Oregon DEQ
Bend, OR, Aug 4, 2010 Oregon DEQ
Portland, OR, Sept 25, 2010 BLM, FS, DOE, DOGAMI
Bend, OR, Oct 20, 2010 Oregon DEQ
Bend, OR, Nov 10, 2010 Oregon DEQ
Portland, OR, Dec 7, 2010 BLM, FS, DOE, DOGAMI, DEQ
Prineville, OR, March 16, 2011 BLM, FS, DOE, DOGAMI