Indsec Securities and Finance Ltd
24
Incorporated in 1992 in Hyderabad by the name of Heritage Foods (India) Ltd, Heritage Foods is the flagship company of Heritage group. Company operates 5 business divisions namely Dairy, Retail, Agri, Bakery and Renewable Energy. Dairy is the largest contributor to topline followed by Retail division. Investment Rationale : Proxy play on Indian dairy growth story: India is the largest producer of milk with total production of 132 Mn Tonnes in CY13. National Dairy Development Board (NDDB) projects In‐ dian milk demand to go to 200 Mn Tonnes by 2021‐2022 which means milk demand is expected to grow at 4.56% CAGR over next 9 years or 6 mn Tonnes incremental Milk demand every year. At Av Milk price of Rs 35/ kg, this offers incremental busi‐ ness opportunity of Rs 266bn every year over next 9 years. Capacity expansion will lead to sustained topline growth: Heritage Foods has two drivers of Top line growth‐ Dairy and Retail and the company has been constantly investing money to enhance the capacity in both these lines of business. To keep the growth momentum going, company is in the process of investing approx Rs 500‐525 mn over next 2 years. The capital expenditure should help Dairy division grow its topline by 39% (to Rs 18.49bn) and Retail division by 38% (to Rs 5.22bn) by FY16E. This is expected to lead to consolidated Top line growth of 37% (to Rs 23.64bn) by FY16E. Increasing proportion of Value added Products to improve margin: Valued Added dairy products (VADP) command EBITDA margin (13‐16%)which is almost double of what is fetched by liquid milk (6‐7%). Company is actively striving to enhance the contribution of VADP to total Dairy sales to 22% by FY16Efrom 18% in FY14. Increasing Proportion of VADP in total dairy sales should lead to improvement in Operating margin of dairy divi‐ sion by 50 bps by FY16E to 9% from 8.5% in FY14. Turnaround in Retail business ,trigger for re ‐Rating: Loss in the Retail division has eclipsed the profit of company’s dairy divi‐ sion. If losses of retail division are removed, consolidated PBDIT for FY13 and FY14 would have been better by minimum 12‐ 13%. The scenario is expected to change with Retail Division all set to become profitable at EBITDA level from FY16E . We ex‐ pect Retail division to clock EBITDA profit of Rs 78.27mn in FY16E from EBITDA loss of Rs 133.2mn in FY14. This will lead to consolidated EBITDA margin of the company improving by 150 bps over FY14 to 7.00% by FY16E. 150bps improvement in EBITDA margin will enhance the Net profit by almost 90% be‐ tween FY14 and FY16E. This will lead to massive rerating of the stock over next 12‐18 months. Outlook & Valuation : Based on SOTP method, where we value Dairy business at 6xFY16 EV/EBITDA (50% discount to Hatsun Agro) and Retail business at 0.5x FY16 EV/Sales (more than 50% discount to Shoppers Stop), we get March’16 Fair value of Company’s eq‐ uity as Rs 13.72bn. This translates into per share fair price of Rs 591. At the fair price of Rs 591, company’s stock is valued at 28.97xFY15E EPS and 15.67xFY16E EPS which is at comfortable level compared to peers. We Recommend BUY on Heritage Foods with March’16 price target of Rs 591 and upside potential of 73%. BSE Code 519552 NSE Code HERITGFOOD Market Cap (Rs mn) 7934 Sector DAIRY Year End March 52 w.High/Low 375/169 Listed on BSE/NSE Shares in Issue (mn) 23.20 BSE Sensex 26745 NSE Nifty 8002 STOCK DETAILS Avg. Daily Turnover (Rs mn) 38.01 Heritage Foods (HTFL IN)- Initiating Coverage INDSEC CMP 342 Rating BUY Target 591 Upside 73% CONSOLIDATED FINANCIALS Rs in bn FY13 FY14 FY15E FY16E Revenue 16.02 17.22 19.97 23.63 EBIDTA 1.01 0.95 1.08 1.65 EBIDTA(%) 6.30 5.50 5.40 7.00 PAT 0.53 0.46 0.47 0.87 EPS (Adj) 21.5 19.5 20.4 37.7 P/E (x) 15.9 17.5 16.8 9.1 SHAILESH KUMAR [email protected] +91 22 61146139 INDSEC SECURITIES AND FINANCE LTD. SEPTEMBER 24, 2014 1 % June 2014 March 2014 Promoter 40.03 40.03 FII 2.83 2.66 DII 0.94 0.69 Others 56.20 56.62 SHAREHOLDING PATTERN Source: Company, Indsec Research 0 50 100 150 200 250 300 350 400 0 5000 10000 15000 20000 25000 30000 Sep‐13 Oct‐13 Nov‐13 Dec‐13 Jan‐14 Feb‐14 Mar‐14 Apr‐14 May‐14 Jun‐14 Jul ‐14 Aug‐14 Sep‐14 BSE SENSEX Heritage
Transcript of Indsec Securities and Finance Ltd

Incorporated in 1992 in Hyderabad by the name of Heritage Foods (India) Ltd, Heritage Foods is the flagship company of Heritage group. Company operates 5 business divisions namely Dairy, Retail, Agri, Bakery and Renewable Energy. Dairy is the largest contributor to topline followed by Retail division. Investment Rationale: Proxy play on Indian dairy growth story: India is the largest producer of milk with total production of 132 Mn Tonnes in CY13. National Dairy Development Board (NDDB) projects In‐dian milk demand to go to 200 Mn Tonnes by 2021‐2022 which means milk demand is expected to grow at 4.56% CAGR over next 9 years or 6 mn Tonnes incremental Milk demand every year. At Av Milk price of Rs 35/ kg, this offers incremental busi‐ness opportunity of Rs 266bn every year over next 9 years.
Capacity expansion will lead to sustained topline growth: Heritage Foods has two drivers of Top line growth‐ Dairy and Retail and the company has been constantly investing money to enhance the capacity in both these lines of business. To keep the growth momentum going, company is in the process of investing approx Rs 500‐525 mn over next 2 years. The capital expenditure should help Dairy division grow its topline by 39% (to Rs 18.49bn) and Retail division by 38% (to Rs 5.22bn) by FY16E. This is expected to lead to consolidated Top line growth of 37% (to Rs 23.64bn) by FY16E.
Increasing proportion of Value added Products to improve margin: Valued Added dairy products (VADP) command EBITDA margin (13‐16%)which is almost double of what is fetched by liquid milk (6‐7%). Company is actively striving to enhance the contribution of VADP to total Dairy sales to 22% by FY16Efrom 18% in FY14. Increasing Proportion of VADP in total dairy sales should lead to improvement in Operating margin of dairy divi‐sion by 50 bps by FY16E to 9% from 8.5% in FY14.
Turnaround in Retail business ,trigger for re ‐Rating: Loss in the Retail division has eclipsed the profit of company’s dairy divi‐sion. If losses of retail division are removed, consolidated PBDIT for FY13 and FY14 would have been better by minimum 12‐13%. The scenario is expected to change with Retail Division all set to become profitable at EBITDA level from FY16E . We ex‐pect Retail division to clock EBITDA profit of Rs 78.27mn in FY16E from EBITDA loss of Rs 133.2mn in FY14. This will lead to consolidated EBITDA margin of the company improving by 150 bps over FY14 to 7.00% by FY16E. 150bps improvement in EBITDA margin will enhance the Net profit by almost 90% be‐tween FY14 and FY16E. This will lead to massive rerating of the stock over next 12‐18 months.
Outlook & Valuation :
Based on SOTP method, where we value Dairy business at 6xFY16 EV/EBITDA (50% discount to Hatsun Agro) and Retail business at 0.5x FY16 EV/Sales (more than 50% discount to Shoppers Stop), we get March’16 Fair value of Company’s eq‐uity as Rs 13.72bn. This translates into per share fair price of Rs 591. At the fair price of Rs 591, company’s stock is valued at 28.97xFY15E EPS and 15.67xFY16E EPS which is at comfortable level compared to peers.
We Recommend BUY on Heritage Foods with March’16 price target of Rs 591 and upside potential of 73%.
BSE Code 519552
NSE Code HERITGFOOD
Market Cap (Rs mn) 7934
Sector DAIRY
Year End March
52 w.High/Low 375/169
Listed on BSE/NSE
Shares in Issue (mn) 23.20
BSE Sensex 26745
NSE Nifty 8002
STOCK DETAILS
Avg. Daily Turnover (Rs mn) 38.01
Heritage Foods (HTFL IN)- Initiating Coverage INDSEC
CMP 342 Rating BUY
Target 591 Upside 73%
CONSOLIDATED FINANCIALS
Rs in bn FY13 FY14 FY15E FY16E
Revenue 16.02 17.22 19.97 23.63
EBIDTA 1.01 0.95 1.08 1.65
EBIDTA(%) 6.30 5.50 5.40 7.00
PAT 0.53 0.46 0.47 0.87
EPS (Adj) 21.5 19.5 20.4 37.7
P/E (x) 15.9 17.5 16.8 9.1
SHAILESH KUMAR [email protected] +91 22 61146139
INDSEC SECURITIES AND FINANCE LTD.
SEPTEMBER 24, 2014 1
% June 2014 March 2014
Promoter 40.03 40.03
FII 2.83 2.66
DII 0.94 0.69
Others 56.20 56.62
SHAREHOLDING PATTERN
Source: Company, Indsec Research
0
50
100
150
200
250
300
350
400
0
5000
10000
15000
20000
25000
30000
Sep
‐13
Oct
‐13
Nov‐13
Dec‐13
Jan
‐14
Feb
‐14
Mar
‐14
Apr‐14
May
‐14
Jun
‐14
Jul‐1
4
Aug‐14
Sep
‐14
BSE SENSEX Heritage

INDSEC
INDSEC SECURITIES AND FINANCE LTD. 2
Table of Contents
1. Investment Summary ………………………………………………………………………………………………………………………...1
2. Company Background ………………………………………………………………………………………………………………………...3
3. Business Model ……………………………………………………………………………………………………………………….…..4
4. Management Profile …………………………………………………………………………………………………………………………….5
5. Key Investment Rationale ………………………………………………………………………………………………………………………… 7
6. SWOT Analysis ………………………………………………………………………………………………………………………… 11
7. Sector View ………………………………………………………………………………………………………………………… 12
8. Financial Performance Analysis ………………………………………………………………………………………………………………………… 15
9. Peer Comparison ……………………………………………………………………………………………………………………… 16
10. Valuation and Recommendation ………………………………………………………………………………………………………………………… 17
11. Risk to Call ………………………………………………………………………………………………………………………… 17
12. Financials ….……………………………………………………………………………………………………………………… 18
13. Annexure .………………………………………………………………………………………………………………………… 20
14. Disclaimer .………………………………………………………………………………………………………………………… 23

• Incorporated in 1992 in Hyderabad by the name of
Heritage Foods (India) Ltd, Heritage Foods is the flagship company of Heritage group.
• Company operates 5 business divisions namely Dairy,
Retail, Agri, Bakery and Renewable Energy. Dairy is the largest contributor to topline followed by Retail division.
• Dairy products are sold under brand name of “Heritage “
while Retail stores operate under brand name “Heritage Fresh” and its Non Food FMCG products are sold under the brand name “Blossom”.
• Company’s dairy division has operations in 8 states (Including 5 southern states , Maharashtra , Odisha and Delhi) with daily milk procurement of 0.89 mn litres of liquid milk from 0.3 mn farmers.
INDSEC
INDSEC SECURITIES AND FINANCE LTD. 3
Business Segment: Dairy segment is the mainstay of company’s business in terms of both Topline and profitability with contribu‐tion of 75% to consolidated turnover while contributing 132% of Consolidated Operating profit for FY14.
Source: Company, Indsec Research
Segment‐wise Sales Contribution—FY14
Company Background
• Company has 129 Chilling plants and 13 Processing & Pack‐
aging plants with capacity of 1.56 Mn Litres and 1.38 mn Litres per day.
• Company’s dairy products are sold to 1.1 mn households
daily through 101000 outlets who are supplied by 5,200 distributors / Agents.
• Retail division under “ Heritage Fresh” brand has 0.256 mn Sq Ft of carpet area under 74 stores where private and popular FMCG Labels are sold .
• Company engages 3656 people across different divisions
as on March 31, 2014.
Segment‐wise Profit Contribution—FY14
Source: Company, Indsec Research
Infrastructure: Dairy Segment
State AP & Telangana Tamil Nadu Karnataka Maharashtra Total
No. of Chilling Plants 112 12 ‐ 5 129
Chilling Capacity (LLPD) 11.80 2.47 0.50 0.87 15.64
No of Processing & Packaging Plant 10 1 1 1 13
Packaging Capacity (LLPD) 11.30 0.50 1.50 0.50 13.80
Source: Company, Indsec Research
Sales and Distribution Related
132
‐27 ‐4 ‐1
‐50
0
50
100
150
Dairy Retail Agri Bakery
Profit Contribution(%)
Processing Related: Heritage Foods Ltd has got chilling capacity of 1.56 mn LPD and packaging capacity of 1.38 mn LPD via 129
chilling plants and 13 processing & packaging plants respectively. State wise plant Number of plants and their combined capacity
is as given below.
No. of Sales Offices Distributors Outlets No of Vehicles Household Reach
26 5200 101000 1073 1100000
Source: Company, Indsec Research
75%
21%
4%
0%Dairy Retail Agri Bakery

INDSEC
INDSEC SECURITIES AND FINANCE LTD. 4
Business Model
Dairy
Sourcing: Heritage‘s dairy business is retail centric business where the company sources almost 70% of Milk (of approx 9 lac litres/day) directly from 3 lac farmers in 5 states while remaining 30% is sourced from Secondary Sources (15% from Milk Co‐Operatives and remaining 15% from Private Players/
Aggregators/Competitors).
Sales & Distribution: Raw milk sourced is sent to 129 chilling plants of the company and then it is processes and packed at 13 packaging units of the company. Almost 83% of Raw milk sourced is sold within 24 hours in liquid form as packaged milk while remaining milk is sold after converting it into various value added Milk Products like Curd, Lassi, Ice Cream, Ghee, Sweets etc .
95% of liquid Milk is sold to almost 1.1mn retail household daily via 5200 Agents/Distributors and 101000 outlets while remaining 5% is sold to institutional clients like local coffee chain, Organized retail Chain etc..
Payment: Dairy is a negative working capital business for the company where the company pays milk suppliers/farmers between 1‐4 weeks time (subject to negotiation) while it sells the milk to distributors/ Agents/ retail Outlets on cash & carry basis. Institutional clients get 30 days of credit from the company.
Activity Flow Chart
Source: Company, Indsec Research
Retail
• Company Operates 74 No of Heritage Fresh Stores under brand name of “Heritage Fresh” with total carpet area of 0.256 mn sq ft.
• The stores are spread across three cities of Hyderabad, Chennai and Bangalore.
• Heritage Fresh stores are focused towards Food and Grocery items along with day to day use FMCG items .
• Besides regular FMCG brands company also sells private labels through these stores. Private labels contribute approx 20% to Retail Division Turnover.
• Some of the key private labels are “ Farmers Pride– Grains & Staples”, Blossom– Toilet papers, Spic– Utensil Cleaners, Sanistar– Toilet Cleaner, Cleanex– Phenyl, Cozy– detergent Bar etc. Company markets food FMCG products under Heritage brand name only.

INDSEC SECURITIES AND FINANCE LTD.
5
INDSEC
Management Profile
Name Profile
Sri D Seetharamiah
Chairman, 88
B Com, FCA, is the senior partner of Brahmayya & Co., a leading Chartered Accountants firm. He had occupied several coveted positions, which include, Membership of the Southern Regional Board of Reserve Bank of India, Federa‐tion of Andhra Pradesh Chamber of Commerce and Industry, Chairmanship of Tirumala Tirupati Devasthanams Trust Board etc. He is also on Board of several Companies.
Smt N. Bhuvaneswari
Vice‐Chair‐Person & Managing Di‐rector, 52
B.A, is a dynamic leader who has extensive experience in business and has been successfully steering Heritage towards growth and better prospects. She was named as one of the most powerful business women in India and placed 45th rank in the list of " Fortune 50" for the year 2013. She is also a Director in several other Companies.
Dr V Nagaraja Naidu
Director, 67
M Com, M Litt, PhD ( FM), starting from Administrative Staff College of India, Hyderabad in 1972 held various positions in reputed Universities for about 25 years. He has been associated with the Company since inception and has been able to utilize his intimate understanding of the rural socio economic scenario to strengthen the milk procurement systems and strategies of Heritage.
Sri M Siva Rama Prasad
Addl. Director, 66
BE (Met), Mr. Prasad with his rich and successful background of reviving and rehabilitating sick industries and starting new industries was awarded" The Most Successful and Innovative Entrepreneur” for the African Region in the year 1996 by UNIDO.
Sri N P Ramakrishnan
Director, 67
He has substantial experience in the transport business, has a thorough under‐standing of the systems of milk procurement and transportation and has en‐abled Heritage to strengthen its main milk procurement base at Chittoor, Ban‐galore and nearby areas.
Sri Srivishnu Raju Nandyala
Director, 41
B.E (Chem), He is the founder Chairman and CEO of EXCIGA group, which con‐sists of five non banking finance companies. Past President of CII’s Young Indi‐ans, Hyderabad Chapter and a past member on the state council of CII. He is a Director in several Public and Private Companies.
Sri Lokesh Nara
Director, 31
B.Sc (MIS), MBA (Stanford), Before joining the Board of Heritage Foods, he was associated with the Company as a Vice‐President of the Retail division. He has also worked with the World Bank as a Junior Professional Associate.
Smt N.Brahmani
Executive Director, 27
B.E (Electronics), MBA (Stanford), Before joining the Board of Heritage Foods, she worked as Investment Associate in Vertex Venture Management Pvt Ltd between 2009 to 2011 in Singapore and associated with the Company as a Vice‐President (Business Development).
K Durga Prasada Rao
Whole Time Director, 72
DE (Mech), D.E (Dairy), D Tech ( Dairy), He worked 3 years in Amul Dairy, 24 years in AP Dairy Development Co‐operative Federation Limited and 22 Years in Heritage Foods Ltd in various positions.

INDSEC SECURITIES AND FINANCE LTD.
6
INDSEC
Corporate Management Team
Name Profile
Dr. M. SambaSiva Rao
President
M.Sc, PhD (Zoology), He served the state and central governments for about two decades as a member of Indian Administrative Services(IAS). Before join‐ing Heritage Foods Ltd, Dr Rao was Joint Secretary in Department of Com‐merce under Ministry of Commerce and Industry, Government of India.
A Prabhakara Naidu
Chief Financial Officer
FCA, He has 21 years of experience in Finance and Accounts. He is associated with the Organization since inception.
Umakanta Barik
Company Secretary
MA (Eco), LLB, FCS, has over 12 years of experience in the areas of Secretarial, Legal and Insurance.
Sri J Samba Murthy,
Head ‐ Dairy Division
B.Sc, MBA , has around 26 years of Experience in Dairy industry. Presently working in the Company as Sr. Vice President and associated with the Com‐pany since 2007. Before Heritage Foods Limited, He worked in APDDCF Lim‐ited, Visakha Dairy NDDB, and Reliance in various positions in the field of Sales & Marketing.
S Jagdish Krishnan,
Chief Operating Officer ‐ Retail and Bakery Divisions
MS, MBA, has over 16 years of experience in the areas of Brand Management, Consulting, Corporate Communications and Retailing with leading Indian and Multinational Organizations. His last assignment was with the CavinKare Group at Chennai where he was the Head of the Retail Organization.
Anil Kumar Srivastava,
Chief Operating Officer— Agri Business Division
MBA, PG Diploma ( Foreign Trade & Fruit and vegetable Technology), He has around 29 years of rich experience to his credit with various reputed Food Processing Industries.

INDSEC SECURITIES AND FINANCE LTD. 7
INDSEC
Investment Rationale:
• NDDB projects India’s Milk demand to grow to
200 Mn Tonnes by CY 22 from 138 Mn Tonnes in
CY 14.
• Changing Food habits and increase in disposable
income are the key drivers of growth in Milk
Demand.
• In order to meet the projected milk demand,
India needs incremental milk of 7.6 Mn Tonnes
per annum over next 9 years.
• At Average Rate of Rs 35/kg, this presents incre‐
mental business opportunity of Rs 266 Bn Per
annum.
• Heritage Foods with its leadership Position In
South Indian market is an excellent vehicle to
ride the expected boom in Dairy demand.
1. Proxy play on Indian Dairy growth story :
India is the largest producer of milk with total production of 132 Mn Tonnes in CY13. National Dairy Development Board (NDDB) projects Indian milk demand to grow to 200 Mn Tonnes by 2021‐2022 which means milk demand is expected to grow at 4.56% CAGR over next 9 years or 7.6 mn Tonnes incremental Milk demand every year. At Avg Milk price of Rs 35/ kg , this offers incremental business opportunity of Rs 266Bn every year over next 9 years. Heritage Foods Ltd being a promi‐nent player in Dairy space in India is all set to benefit from this secular demand growth.
Domestic Milk Demand (Mn Ton)
127.9
132.4
138.4
144.8
151.4
158.3
165.5
173
180.9
189.2
197.8
0
50
100
150
200
250
CY12
CY13
CY14E
CY15P
CY16P
CY17P
CY18P
CY19P
CY20P
CY21P
CY22P
Domestic Milk Demand(Mn Ton)
Source: NDDB, Indsec Research
Indian Processed Milk Market Size (Rs. Trn.)
Source: Industry, Indsec Research
Heritage Dairy Turnover (Rs. Bn)
8.61
10.94 12.69 13.28
‐
2.00
4.00
6.00
8.00
10.00
12.00
14.00
FY11 FY12 FY13 FY14
Net sales(Rs Bn)
Source: Company, Indsec Research
5.0 5.56.1
6.77.3
8.18.9
9.710.7
0.0
2.0
4.0
6.0
8.0
10.0
12.0
CY14P CY15P CY16P CY17P CY18P CY19P CY20P CY21P CY22P
Indian Processed Milk Market Size (Rs Trn)

INDSEC SECURITIES AND FINANCE LTD.
8
INDSEC
• In order to Capture the huge business opportu‐
nity in Dairy Business segment company is re‐
quired to invest in back end infrastructure
which includes Chilling Plants , Processing &
Packaging plants etc.
• Company intends to invest around Rs 375– 400
mn over next 2 years in the dairy business to
strengthen back end infrastructure.
• Further Retail segment is expected to break
even once area under Retail reaches 0.4 mn Sq
Ft from current 0.275 mn Sq Ft.
• Company intends to invest close to Rs 100‐125
mn to achieve the targeted retail space.
• These investments are expected to help the
company increase the dairy segment turnover
by 39% by FY16E to Rs 18.5 Bn while Retail Seg‐
ment turnover is expected to clock 37% growth
during the same period (Rs 5.2 Bn).
2. Capacity expansion will lead to sustained topline growth:
Heritage Foods has two drivers of top line growth‐ Dairy and Retail and the company has been constantly investing money to enhance the ca‐pacity in both these lines of business. In Dairy division, company has enhanced its Milk chilling capacity by 15% (from 1.35 Mn Litre per day to 1.56 mn Litre per day) and Milk packaging capacity by 20% (from 1.15 MLPD to 1.38 MLPD) in last 2 years while in the Retail segment, Total carpet area of retail space has gone up from 0.2 mn Sq Ft to 0.22 mn Sq Ft. The capex has resulted into Dairy and Retail division Top line growing by 21% (Rs 13.28 Bn Vs Rs 10.94 Bn) and 26% (Rs 3.78 bn Vs Rs 2.99 Bn) respectively. To keep the growth momentum going, company is in the process of investing approx Rs 450‐500mn over next 2 years. This in‐volves approx Rs 350‐375mn investment in dairy segment and Rs 100‐125 mn in Retail segment. The capital expenditure should help Dairy division grow its topline by 39% (to Rs 18.49 Bn) and Retail division by 38% (to Rs 5.22Bn) by FY16E. This is expected to lead to consolidated Top line growth of 37% (to Rs 23.64 Bn) by FY16E.
Segment wise Turnover Growth—Dairy (Rs. Bn)
Source: Company, Indsec Research
Segment wise Turnover Growth—Retail (Rs. Bn)
Source: Company, Indsec Research
Consolidated Turnover Growth— Net Sales (Rs. Bn)
Source: Company, Indsec Research
16.02 17.22 19.97
23.64
‐
5.00
10.00
15.00
20.00
25.00
FY13 FY14 FY15E FY16E
Net Sales (Rs Bn)
12.7 13.315.5
18.5
0.0
5.0
10.0
15.0
20.0
FY13 FY14 FY15E FY16E
Dairy(Rs Bn)
3.33.8
4.4
5.2
0.0
1.0
2.0
3.0
4.0
5.0
6.0
FY13 FY14 FY15E FY16E
Retail (Rs Bn)

INDSEC
• Value Added Dairy products (VADP) have been
the fastest growing segment of Dairy Industry
with Av growth of 25% P .a (vs 10‐11% growth
in liquid milk segment) and command margins
between 13‐16% compared to 6‐7% margin in
Liquid Milk Business.
• Heritage itself has registered CAGR of 50% in
its VADP sales over last 5 years ( FY 09‐14 ) and
VADP as percentage of Total dairy sale stood at
18.8% in FY14.
• Curd sales has been the key driver of growth in
VADP and it has grown at CAGR of 52.5% dur‐
ing the same period (FY 09‐14) .
• We expect VADP sales to grow by 64% in next 2
years where its contribution to total Dairy sales
will grow to 22.3% .
• Higher proportion of VADP is expected to en‐
hance Dairy segment EBITDA by 50 bps between
FY 14‐16 .
3. Increasing proportion of Value added Products to improve margin :
Valued Added Dairy products (VADP) command EBITDA margin (13‐16%)which is almost double of what is fetched by liquid milk (6‐7%). Of the total sales of Rs 13.28 bn registered by Dairy division of the company in FY 14, Value added dairy products (VADP) has contributed Rs 2.50 Bn or 18.8%. Company is actively striving to enhance the contribution of VADP to total Dairy sales to 22% by FY16E (Rs 4.12 bn). Increasing Proportion of VADP in total dairy sales should lead to improvement in operating margin of dairy division by 50 bps by FY16E to 9%.
INDSEC SECURITIES AND FINANCE LTD. 9
Source: Company, Indsec Research
Value Added Dairy Product Revenue (Rs. Bn)
Curd Segment Revenue (Rs. Bn)
Source: Company, Indsec Research
Trend in Dairy Segment EBITDA
Source: Company, Indsec Research
1.82.5
3.1
4.1
14.6
18.8
20.3
22.3
0.0
5.0
10.0
15.0
20.0
25.0
0.0
0.5
1.0
1.5
2.0
2.5
3.0
3.5
4.0
4.5
FY13 FY14 FY15E FY16E
VADP Turnover(Rs Bn) VADPas % of Dairy(%)‐RHS
1.2
1.8
2.3
3.1
64.0
71.0
74.6 75.1
55.0
60.0
65.0
70.0
75.0
80.0
0.0
0.5
1.0
1.5
2.0
2.5
3.0
3.5
FY13 FY14 FY15E FY16E
Curd Turnover(Rs Bn) Curd as % of VADP (%)‐RHS
1.2 1.1 1.2 1.7
9.68
8.50
7.61
9.00
7.00
7.50
8.00
8.50
9.00
9.50
10.00
0.0
0.2
0.4
0.6
0.8
1.0
1.2
1.4
1.6
1.8
FY13 FY14 FY15E FY16E
EBITDA (Rs Bn) EBITDA (%)

INDSEC
• Retail division which accounted for 21% of
consolidated turnover in FY14 has made losses
which ate almost 27% of operating profit made
by Dairy division.
• This led to consolidated operating profit sub‐
dued to the tune of 12‐13% of its potential oper‐
ating profit.
• Retail division is expected to register its first
profit at EBITDA level in FY16e (Rs 62 Mn ) due
to increased area under retail and cost cutting .
• Turnaround of Retail division will have very
positive impact on Company’s PAT which is ex‐
pected to double in next two years (FY16E) to Rs
0.87 Bn.
• The stock could get re Rated due to expected
performance over next 12‐18 months.
4.Turnaround in Retail business will provide trigger for Re ‐Rating:
Heritage Fresh, the Retail Division of the company has been the Achilles Heel for last 5 years. Loss in the Retail division has eclipsed the profit of the Dairy division. If losses of retail division are removed, consolidated PBDIT for FY13 and FY14 would have been higher by minimum 12‐13%. This has forced the company to keep investing out of pocket to maintain the growth momentum. The scenario is expected to change with Retail Division all set to become profitable at EBITDA level from FY16E on the back of economy of scale and improvement in same store sales. We expect Retail division to clock EBITDA of Rs 62 mn in FY16E from EBITDA loss of Rs 133.2mn in FY14. This will lead to consolidated EBITDA margin of the company improving by 150 bps over FY14 to 7.00% by FY16E. 150bps improvement in EBITDA margin is expected to increase in Net profit by almost 90% to Rs 0.87Bn between FY14 and FY16E. This will lead to a Re ‐Rating of the company over next 12‐18 months.
INDSEC SECURITIES AND FINANCE LTD. 10
Source: Company, Indsec Research
Trend in Operating Profit
Trend in PAT and Net Profit Margin
Source: Company, Indsec Research
0.50 0.46 0.47
0.87
3.1
2.72.4
3.7
0.0
0.5
1.0
1.5
2.0
2.5
3.0
3.5
4.0
‐
0.10
0.20
0.30
0.40
0.50
0.60
0.70
0.80
0.90
1.00
FY13 FY14 FY15E FY16E
PAT (Rs Bn)‐LHS NPM (%)‐RHS
0.5
1.1
1.01.1
1.7
‐0.5
0.0
0.5
1.0
1.5
2.0
FY12 FY13 FY14 FY15E FY16E
Dairy Retail Consolidated EBITDA( Rs Bn)
INDSEC SECURITIES AND FINANCE LTD.
11
INDSEC
SWOT Analysis
Source: Company, Indsec Research

INDSEC SECURITIES AND FINANCE LTD. 12
INDSEC
Dairy Sector: Sector View
Source: NDDB, Indsec Research
Indian Processed Milk Market Size (Rs. Trn.)
Source: Industry, Indsec Research
State Wise Milk Production CY13 (Mn Ton)
Domestic Milk Demand (Mn Ton)
• India is the largest producer of Milk globally and produced 132.4 Mn Tons of milk in CY 13 accounting for 17% of Global Milk production .
• Only 50% of milk produced in India is used for trading do‐mestically .
• National Dairy Development Board expects domestic milk demand to grow at 4.56% CAGR in volume terms over next 8‐9 years to 200 Mn Tons by CY 21‐22 which means annual incremental milk demand of 6 Mn Tons .
• Processed milk market size is estimated at Rs 5 trn for CY 14 (FY15) and expected to grow at 10% P.a.
• Top 5 states account for almost 50% of total milk produc‐tion.
Source: NDDB, Indsec Research
17%
10%
10%
8%7%
48%
UP Rajasthan AP Gujrat MP Remaining
• Total value of Dairy product sold in India in CY 13 stood at approx Rs 4.5 Trn and 73% of it comprises of Liquid Milk while remaining 27% is sold in the form of Milk derivatives . Out of this 27% space approx 11% is sold in the form of Value added dairy products .
• Currently only 30% of domestic milk trade share held by Organized sector (16%‐Dairy Co‐Operatives and 14%‐private dairy companies) while rest comes from Unorganized sector.
• Industry estimates suggest VADP (Value Added derivative products) segment is growing at 25% p.a and will maintain the growth momentum for next 5‐6 years. Changing life‐style, growing per capita income and consistent product quality is the key reason behind faster growth in VADP.
Dairy Product Sales Composition (%)
73
8
84 3
1 1 1 1
Liquid Milk Ghee Milk PowderIce Cream Butter Curd
Cheese Flavoured Milk Paneer
Source: NDDB, Indsec Research
127.9
132.4
138.4
144.8
151.4
158.3
165.5
173
180.9
189.2
197.8
0
50
100
150
200
250
CY12
CY13
CY14E
CY15P
CY16P
CY17P
CY18P
CY19P
CY20P
CY21P
CY22P
Domestic Milk Demand(Mn Ton)
5.05.5
6.16.7
7.38.1
8.99.7
10.7
0.0
2.0
4.0
6.0
8.0
10.0
12.0
CY14P
CY15P
CY16P
CY17P
CY18P
CY19P
CY20P
CY21P
CY22P
Indian Processed Milk Market Size (Rs Trn)

INDSEC SECURITIES AND FINANCE LTD. 13
INDSEC
Inflation Trend in Dairy Products—WPI Trend—Milk Vs Dairy Products
100.0 101.0 109.0 114.6 123.2146.4
175.9194.0
100.0 99.5105.4
116.4122.9
138.8
152.1
171.5
CY05 CY06 CY07 CY08 CY09 CY10 CY11 CY12
Milk Dairy Products
Global Dairy
762.3 767.2 783.2
65.4 67.9 69.1
8.6
8.9 8.8
8 .4
8 .5
8 .5
8 .6
8 .6
8 .7
8 .7
8 .8
8 .8
8 .9
8 .9
0
100
200
300
400
500
600
700
800
900
2012 2013E 2014F
World Milk ProductionTotal Trade Dairy Trade as % of production
Global Milk Production & Trade (Mn Tonnes)
Source: USDA, Indsec Research
Top 5 Global Producers of Milk
Countries Milk Production (Mn Tons) CY 2013 10 Yr CAGR (%)
India 141 4.3
USA 91 1.7
China 39 11.4
Pakistan 39 3.4
Brazil 30 4.2
Source: OECD‐FAO , Indsec Research
Top 5 Exporters and Importers of Dairy Products
Top Importers % of Total
Imports
Top Exporters
China 44.0 New Zealand
Algeria 24.0 EU 27
Indonesia 6.7 US Brazil 6.0 Australia
Russia 5.3 Argentina
% of Total
Exports 55.0
21.0
7.3
13.0
Total 86.0 Total
Source: Industry, Indsec Research
Source: Ministry of Commerce, GoI, Indsec Research
• Profit margin in liquid Milk is barely 5‐6% while same for VADP segment stands between 13‐16%. Lure of Higher profit margin along with faster growth ( 25% vs 12%) has prompted many private dairies to aggressively venture into VADP space which also help them ward off competition from unorganized players.
• Though inflation in Dairy products can be easily passed on to the end consumer due to staple nature of Milk, Government (Both state & centre) do interfere in pricing of Liquid milk by using state Co‐operatives and policy instruments. Higher exposure to VADP also provides hedge against vagaries of Government Policies.
• Milk being a perishable commodity, processing plants have to be close to market as well as centre of procurement so that milk can be processed and consumed within limited time. This is the main rea‐son why Milk Brands are regional in Nature and Market leader Amul has got only limited presence in India in spite of being in existence for more than 5 decades.
• Further back end Infrastructure like chilling plants and refrigerated vehicles along with continuous power availability is very important for Dairy business to grow.
• Inflation in Dairy products is in double digits since CY09.
Global Dairy Trade—Key Highlights
2013—Global Dairy Trade Share (%)
33
30
12
98
4 2 11
EU‐28Oceania
N America
Europe (Ex EU‐28)America‐Central, South & CaribbeanS E AsiaAsia
Africa
M E Asia
Source: Industry , Indsec Research
Productwise Contribution (%)‐Global Dairy Trade—CY10
40
30
1010
6 4
Cheese & CurdMilk & Cream‐Conc & SweetenedMilk & Cream‐Non Conc/ Non sweetButter & Milk FatsButterMilk & YogurtWhey & Natural Milk Products
Source: Industry , Indsec Research

INDSEC SECURITIES AND FINANCE LTD. 14
INDSEC
Global Milk Production Projection (Mn Tonnes)
Source: OECD‐FAO Forecast, Indsec Research
763 784 802 818 833 848 864 880 896 912 928
0
100
200
300
400
500
600
700
800
900
1000
2013
2014
2015
2016
2017
2018
2019
2020
2021
2022
2023
Milk
• Total value of Global dairy Trade of USD 47Bn in CY13 where EU‐ 28 and Oceania (New Zealand & Australia ) combined together account for almost two third of Global Export.
• Global Milk production projected to increase by 162 Mn tonnes over next 10 years out of which close to 40% additional production to come from India and China itself. Estimates suggest India’s Milk production will overtake combined production of EU‐28 by 2020.
• Because of large population and increasing per capita Income these countries will witness higher milk demand.
• Since cost of milk production in India and China is among the lowest in the world, production growth to cater to incremental demand will be coming to these countries.
• Due to mandatory phase out of Subsidy under WTO regime, EU and US will lose out on competitiveness in Global Dairy market and thus are looking to set production bases in low cost countries like India .
India and Global dairy Trade
Composition of India’s Dairy Export CY10
44%
23%
12%
8%
3%
3%2% 5%
SMP Milk fats Butter
WMP Cheese Processed CheeseWhey Powder Others
Source: Industry, Indsec Research
Key Markets for India’s Dairy Export CY10
15%
18%
3%8%
5%6%4%
6%
35%
Bangladesh UAE Oman
Nepal Yemen Egypt
Singapore Philippines Others
Source: Industry, Indsec Research
Key Issues with India’s Dairy Sector
• In spite of being the largest global producer of Milk, India’s growing domestic demand leaves very little surplus milk for export.
• Productiity of Milch animals in India is miserably low (1 ton/Milch Animal/ Year vs 9.4 for US, 6.2 for EU and 5.9 for Aus‐tralia) among prominent producer countries and is expected to remain so for next 6‐7 years.
• Indian Dairy Industry suffers with perception of Poor quality among global consumers which makes it challenging to ex‐port products to global consumers.
• Cow Milk is the only popular milk in most developed coun‐tries and buffalo milk is unheard of. India produces substan‐tial quantity of buffalo milk . Foreign buyers are not very sure of suitability of buffalo milk for human consumption.
• Developed countries like EU, USA , Japan etc offer heavy subsidy to domestic dairy producers in the form of subsidized feed grains, irrigation, interest on loans and insurance. They further provide export incentive to their farmers to sell dairy produce in interna‐tional market. For example , EU gives subsidy of more than USD 550/ Ton on SMP, USD 850/ Ton of Full Cream Powder, USD 1200/Ton of Butter and Butter Oil. The heavy subsidy along with Higher tariff barrier (Canada‐ 126.6%, Japan‐ 93.3%, EU‐48.3%) create heavy obstacle in way of Indian dairy export to these coun‐tries.
The Way Forward:
With the WTO regime banning subsidy of Agriculture Export by coun‐tries to come in force, Indian Milk producers have real chance of grow‐ing their presence in Global Market if they are able to address quality and productivity issue. Since, India’s domestic demand growth is set to outgrow global Dairy demand growth, many more global players will be inclined to buy stake in Domestic Dairy companies and use their superior technology to gain market share. Strong Brand and Back End infrastructure will be key to capturing this market.
INDSEC SECURITIES AND FINANCE LTD.
15
INDSEC
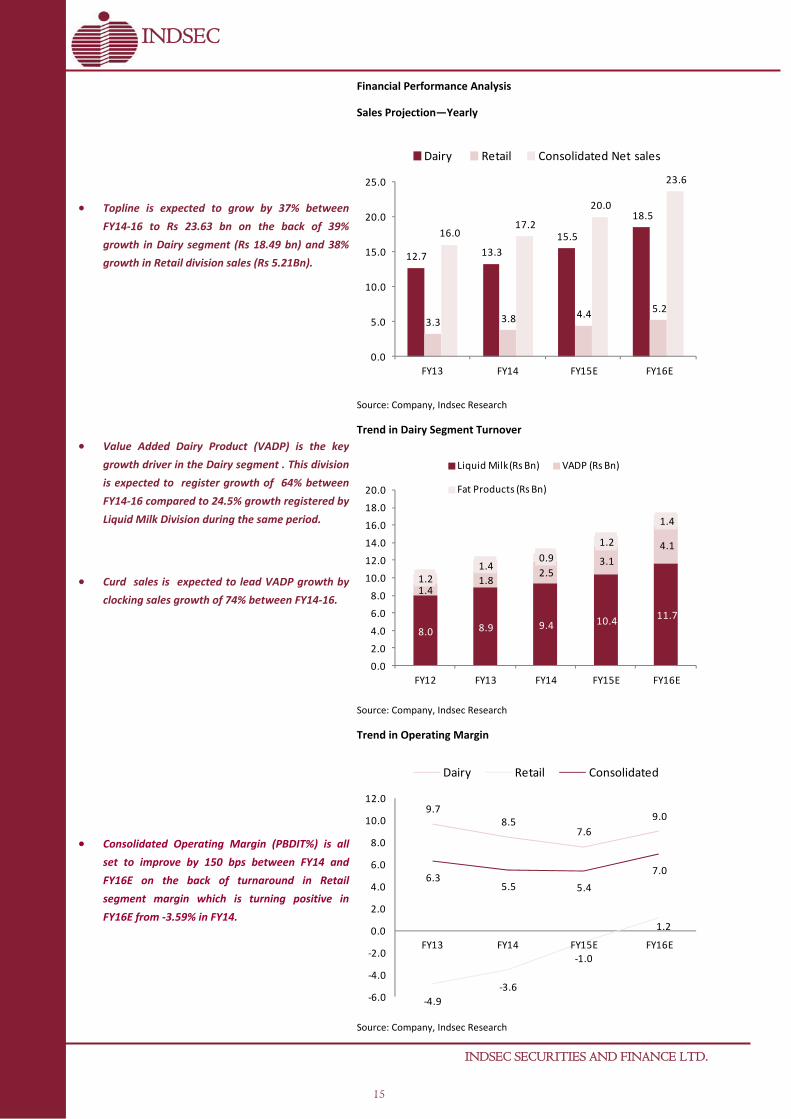
• Topline is expected to grow by 37% between
FY14‐16 to Rs 23.63 bn on the back of 39%
growth in Dairy segment (Rs 18.49 bn) and 38%
growth in Retail division sales (Rs 5.21Bn).
• Value Added Dairy Product (VADP) is the key
growth driver in the Dairy segment . This division
is expected to register growth of 64% between
FY14‐16 compared to 24.5% growth registered by
Liquid Milk Division during the same period.
• Curd sales is expected to lead VADP growth by
clocking sales growth of 74% between FY14‐16.
• Consolidated Operating Margin (PBDIT%) is all
set to improve by 150 bps between FY14 and
FY16E on the back of turnaround in Retail
segment margin which is turning positive in
FY16E from ‐3.59% in FY14.
Financial Performance Analysis
Trend in Dairy Segment Turnover
Source: Company, Indsec Research
Source: Company, Indsec Research
Source: Company, Indsec Research
Sales Projection—Yearly
Trend in Operating Margin
12.7 13.3
15.5
18.5
3.3 3.8 4.45.2
16.017.2
20.0
23.6
0.0
5.0
10.0
15.0
20.0
25.0
FY13 FY14 FY15E FY16E
Dairy Retail Consolidated Net sales
8.0 8.9 9.4 10.411.7
1.41.8
2.53.1
4.1
1.2
1.40.9
1.2
1.4
0.0
2.0
4.0
6.0
8.0
10.0
12.0
14.0
16.0
18.0
20.0
FY12 FY13 FY14 FY15E FY16E
Liquid Milk (Rs Bn) VADP (Rs Bn)
Fat Products (Rs Bn)
9.7
8.57.6
9.0
‐4.9‐3.6
‐1.0
1.2
6.35.5 5.4
7.0
‐6.0
‐4.0
‐2.0
0.0
2.0
4.0
6.0
8.0
10.0
12.0
FY13 FY14 FY15E FY16E
Dairy Retail Consolidated

INDSEC SECURITIES AND FINANCE LTD. 16
INDSEC
• Debt Equity ratio has consistently im‐
proved, ROCE and ROE too have en‐
hanced by 686 bps and 392 bps respec‐
tively between FY14 and FY16E mainly
due to turnaround in retail Segment and
improving profitability in Dairy Seg‐
ment.
• There is tremendous improvement in
free cash flow per share from FY15
onwards after blip in FY14 due to
improvement in Inventory days and
normalization of Capex in FY15E and
FY16E.
Trend in Leverage and Return Ratios
Source: Company, Indsec Research
Source: Company, Indsec Research
* The number is into New Zealand Dollar. $ The number is denoted in Euro.
Sales number and return ratio for Fontera are for 12 months ending 31st, July 2013 and Danone are for 12 months ending 31st, December 2013 while for remaining companies they are for FY14, i.e. 12 month period ending 31st, March 2014.
Movement in FCF
Company Heritage Kwality Hatsun Agro
Fontera NZ
Danone
Sales (Rs.bn) 17.22 45.69 24.81 18.63* 21.29$
EBITDA(%) 5.50 5.95 7.45 7.62 16.53
NPM(%) 2.70 2.75 3.30 3.70 7.70
Net‐Worth (Rs.bn) 1.79 4.28 1.79 6.75 10.73
Debt‐Equity 0.40 2.52 2.21 0.69 1.12
ROCE(%) 27.91 16.99 22.12 10.21 9.17
ROE(%) 25.34 33.87 45.63 10.91 14.49
Div Yield (%) 0.87 0.20 0.87 3.33 NA
PAT CAGR(%)‐(FY14‐16E) 39.92 14.89 7.24 ‐12.00 10.90
FY16 PE 8.87 6.07 34.57 19.75 17.95
FY16 PB 2.59 1.42 8.98 2.11 2.51
FY16 EV/EBITDA 4.16 5.43 14.64 10.07 11.66
Peer comparison
1.03
0.48
0.40 0.39
0.25
0.00
0.20
0.40
0.60
0.80
1.00
1.20
0.00
5.00
10.00
15.00
20.00
25.00
30.00
35.00
40.00
FY12 FY13 FY14 FY15E FY16E
ROCE (%) ROE (%) Debt Equity (RHS)
14.6
29.3
‐0.2
34.1
50.9
39.99
61.1
77.0
92.8
124.6
‐20.00
0.00
20.00
40.00
60.00
80.00
100.00
120.00
140.00
FY12 FY13 FY14 FY15E FY16P
Adj BV/ share Adj FCF/ share Adj EPS

INDSEC SECURITIES AND FINANCE LTD.
17
INDSEC
Valuation and Recommendation :
We are using SOTP method to value the company where Dairy business is being valued on EV/EBITDA basis while Retail business (along with Agri & Bakery) is valued using EV/sales methodology.
We advise BUY on Heritage Foods with March 16 price target of Rs 591 which gives upside potential of 72% from current level. At the target price, stock is valued at 15.67x FY16E EPS which is quite comfortable.
Risk to Call :
We have been prudent in our projection about segment revenue and margin of the company. In spite of that there might be some inherent risks associated with our call which could derail the projected revenue and profitability . Some of the key risks are outlined below.
Downside Risk :
• We have assumed 9% average realization growth for liquid milk over next couple of years which we believe reasonable looking at past trend and inflation expectation. In case company is not able to increase prices for liquid milk, it might impact top line growth as well as profitability.
• We have assumed 27% average sales growth for Value added Dairy Product (VADP ) over next couple of years which is in line with the past growth recorded by the company. In case, the company is not able to maintain the growth momentum in VADP space, it can have negative impact on profit‐ability of the company.
• We have projected Retail division (along with Agri and Bakery) to turn prof‐itable at EBITDA level in FY16E. In case, the Retail division does not perform as expected, profitability projection for FY16 might not materialize as projected.
Upside Risk:
• Better than anticipated sales growth, margin growth in any segment/ across segments can cause upside risk to profitability and hence stock price. We have been very conservative about margin improvement in dairy segment. There is high probability it may surprise on the upside.
• Any news on stake sale/JV in Retail operation can lead to value unlocking, which again may cause upward risk to target price.
A) Dairy business EV at 6x FY 16E EBITDA (Rs Mn) 6 x 1646.75 = 9880.48
B) Retail business EV @ 0.5x FY16 sales (Rs Mn) 0.5 x 6163.42 = 3081.71
C) Consolidated EV Rs Mn (A +B) FY 16 12962.2
D) Consolidated FY16 Market Cap = EV ‐ (Long Term Debt+ Short term Borrowing)
+(Cash) all for FY16
=12962.2‐(318.48+350.00)+(1425.09)
=13718.81
E) Per share FY 16 Fair Value of Heritage Foods =13718.81/23.2
= 591

INDSEC SECURITIES AND FINANCE LTD.
18
INDSEC
Summary Income Statement
Amt. in Rs. millions FY12 FY13 FY14 FY15E FY16E Net Revenues 13,934.1 16,018.1 17,220.4 19,971.3 23,635.4 Cost Of Revenues 11,190.6 12,369.0 13,438.1 15,654.1 18,207.0 Gross Profit 2,743 3,649 3,782 4,317 5,428 Power and fuel 308.6 364.1 396.1 459.3 543.6
Other Operating Expenses 1,923.1 2,274.3 2,436.5 2,776.0 3,238.0 EBITDA 511.8 1,010.8 949.8 1,081.8 1,646.7
Other Income 32.1 41.0 49.5 51.5 99.8 EBITDA, including OI 544 1,052 999 1,133 1,747 Depreciation 211.9 220.2 250.0 299.6 342.7 Net Interest Exp. 197.7 167.0 132.2 116.6 80.2 EBT 134 665 617 717 1,324 Taxes 42.4 136.9 160.2 243.9 450.0 Tax Rate 32% 21% 26% 34% 34% Net Income 92 528 457 473 874 Adj EPS (INR) 4.0 21.5 19.5 20.4 37.7 Shares Outstanding 11.5 11.6 23.2 23.2 23.2
For the fiscal year ending
Summary Balance sheet
Amt. in Rs. millions FY12 FY13 FY14E FY15E FY16E SOURCES OF FUNDS Share Capital 115.3 116.0 232.0 232.0 232.0 Reserves 812.4 1,300.6 1,555.5 1,920.4 2,658.3 Total Shareholders Funds 928 1,417 1,788 2,152 2,890 Warrant application money ‐ ‐ ‐ ‐ ‐ Minority Interest 0.6 0.2 0.2 0.2 0.2 Long term borrowing 699.3 405.6 391.7 471.3 318.5 Net Deferred Tax liability 181.5 195.3 225.2 245.0 265.0 Other long term liabilities 66.5 75.5 93.4 112.0 132.0 Long term provisions 7.5 7.7 9.3 10.7 11.5 Current Liabilities and Provisions Current Liabilities 652.4 568.2 689.8 766.0 906.6 Provisions 63.7 84.2 128.8 164.1 194.3 Short term borrowings 705.8 576.2 882.5 500.0 350.0 Other Current Liabilities 761.4 776.6 709.8 820.7 971.3 Total Current Liabilities 2,183.3 2,005.1 2,410.9 2,250.9 2,422.1 Total Liabilities 4,066.4 4,106.0 4,918.3 5,242.6 6,039.6
APPLICATION OF FUNDS :
Net Block 2,302.6 2,367.9 2,714.8 2,765.2 2,622.5 Capital Work in Progress 92.4 82.7 111.2 110.0 80.0 Long term loans and advances 191.0 174.7 205.2 115.0 135.0 Non Current Assets 10.4 4.4 6.9 5.0 5.9 Investment 1.6 8.1 6.6 6.6 6.6 Current Assets, Loans & Advances
Inventories 934.5 820.9 1,085.5 1,258.5 1,489.4 Sundry Debtors 112.0 150.7 166.1 191.5 210.5 Cash and Bank 301.2 330.7 445.4 736.1 1,425.1 Loans and Advances 120.7 165.8 176.6 54.7 64.8 Other Current assets ‐ ‐ ‐ ‐ ‐ Total Current Assets 1,468 1,468 1,874 2,241 3,190 Miscellaneous Expenditure ‐ ‐ ‐ ‐ ‐ Total Assets 4,066.4 4,106.0 4,918.3 5,242.6 6,039.6
For the fiscal year ending

INDSEC SECURITIES AND FINANCE LTD.
19
INDSEC
Summary Cash Flow Statement For the fiscal year ending
Amt. in Rs. millions FY12 FY13 FY14E FY15E FY16E PBT & Extraordinary 134.3 636.4 617.1 717.2 1323.6 Depreciation 211.9 220.2 250.0 299.6 342.7 After other adjustments
(Inc) / Dec in Working Capital 113.6 56.1 ‐204.8 258.2 61.2 Taxes (29.8) (124.5) ‐160.2 ‐243.9 ‐450.0 Others 174.5 184.6 116.7 109.2 73.1 Cash from Ops. 605 973 618.8 1140.3 1350.6 Purchase of Fixed Assets (288.1) (296.0) ‐625.3 ‐348.8 ‐170.0 Others 22.8 3.7 1.5 0.0 0.0 Cash from Investing (265) (292) ‐623.8 ‐348.8 ‐170.0 Issue of share capital 1.0 ‐ 0.0 0.0 0.0 Borrowings (119.7) (476.7) 292.4 ‐302.9 ‐302.9 Others (194.0) (175.0) ‐172.7 ‐197.9 ‐188.7 Cash from Financing (313) (652) 119.7 ‐500.8 ‐491.6 Net Change in Cash 27 29 114.7 290.7 689.0 BF Cash 262.0 288.5 330.7 445.4 736.1 Bank Balances 12.7 13.3 0.0 0.0 0.0 END Cash 301.2 330.7 445.4 736.1 1425.1
Summary Ratios For the fiscal year ending
FY12 FY13 FY14E FY15E FY16E Profitability Return on Assets (%) 2.3 12.2 10.0 9.3 15.5 Return on Capital (%) 15.9 37.6 27.9 26.1 36.0 Return on Equity (%) 9.9 35.2 25.3 22.0 30.2 Margin Trend Gross Margin (%) 19.7 22.8 22.0 21.6 23.0 EBITDA Margin (%) 3.7 6.3 5.5 5.4 7.0 Net Margin (%) 0.7 3.1 2.7 2.4 3.7 Liquidity
Current Ratio 0.7 0.7 0.8 1.0 1.3 Quick Ratio 0.2 0.3 0.3 0.4 0.7 Debtor Days 2.9 3.4 3.5 3.5 3.3 Inventory Days 24.5 18.7 23.0 23.0 23.0 Creditor Days 17.1 12.9 14.6 14.0 14.0 Working Capital Days ‐26.6 ‐19.8 ‐20.8 ‐13.6 ‐10.2 Solvency Total Debt / Equity 1.0 0.5 0.4 0.4 0.3 Interest Coverage 2.6 6.1 7.2 9.3 20.5 Valuation Ratios EV/EBITDA 17.7 8.5 9.2 7.6 4.4 P/E 86.3 15.9 17.5 16.8 9.1 P/B 8.6 5.6 4.4 3.7 2.7

INDSEC SECURITIES AND FINANCE LTD. 20
INDSEC
Annexure
Heritage Foods—Key Brands
Dairy
Milk
Ice Cream
Ghee
Curd
Buttermilk/
Sweets
Butter
Product/Brand

INDSEC SECURITIES AND FINANCE LTD.
21
INDSEC
Retail/FMCG (Non Food)
Drinking Water
Utensils Cleaner
Toilet Cleaner
Floor Cleaner
Toilet Tissue Roll
Bar Detergents
Product/Brand

INDSEC SECURITIES AND FINANCE LTD.
22
INDSEC
FMCG (Food)
Namkeens
Honey /
Corn Flakes
Pickles
Instant Noodles/
Instant Mixes
Wheat Flour /
Salt
Turmeric /Chilli
Powder
Product/Brand
Papads

BUY : Expected total return of over 25% within the next 12 months.
ACCUMULATE : Expected total return between 10 to 25% within the next 12 months.
REDUCE : Expected total return below 10% within the next 12 months.
SELL : Expected total return is below the market return within the next 12 months.
NEUTRAL: No investment opinion on the stock under review.
This report has been issued by Indsec Securities and Finance Limited (ISFL), which is a SEBI regulated entity.
This document is for informational purposes only and is not intended as an offer or solicitation for the purchase or sale of security.
This document has been prepared and issued on the basis of publicly available information, internally developed data and other sources believed to be reliable. However, we do not guarantee its accuracy and the information may be incomplete and condensed. Note how‐ever that, we have taken meticulous care to ensure that the facts stated are accurate and opinions given are fair and reasonable, neither the analyst nor any other employee of our company is in any way responsible for its contents. The Company’s research department has received assistance from the subject company (ies) referred to in this document including, but not limited to, discussions with manage‐ment of the subject company (ies). All opinions, projections and estimates constitute the judgment of the author as of the date of this document and these, including any other information contained in this document, are subject to change without notice. Prices and avail‐ability of financial instruments also are subject to change without notice. While we would endeavor to update the information herein on reasonable basis, we are under no obligation to update or keep the information current. Also, there may be regulatory, compliance, or other reasons that may prevent us from doing so.
Securities recommended in this document are subject to investment risks, including the possible loss of the principal amount invested. Any decision to purchase/sale securities mentioned in this document must take into account existing public information on such security or any registered prospectus. The appropriateness of a particular investment, decision or strategy will depend on an investor's individual circumstances and objectives. The securities, instruments, or strategies discussed in this document may not be suitable for all investors, and certain investors may not be eligible to purchase or participate in some or all of them. Each recipient of this document should make such investigations as it deems necessary to arrive at an independent evaluation of an investment in the securities of companies referred to in this document (including the merits and risks involved).
This report is not directed or intended for distribution to, or use by, any person or entity who is a citizen or resident of or located in any locality, state, country or other jurisdiction, where such distribution, publication, availability or use would be contrary to law, regulation or which would subject the company to any registration or licensing requirement within such jurisdiction. The securities described herein may or may not be eligible for sale in all jurisdictions or to certain category of investors. Persons in whose possession this document may come are required to inform themselves of and to observe such restriction
The company may trade in securities, which are the subject of this document or in related instruments and may have acted upon, use or used the information contained in this document or the research or the analysis on which it is based, before its publication. The company or its directors may have a position or be otherwise interested in the investment strategy referred to in this document. The company may be involved in any other transaction involving such securities and earn brokerage or other compensation or act as advisor or lender/borrower to such company(ies) or have other potential conflicts. of interest with respect to any recommendation and related information and opinions. This is just a suggestion and the company will not be responsible for any profit or loss arising out of the decision taken by the reader of this document. Any comments or statements made herein are those of the analyst and do not necessarily reflect those of the company. No matter contained in this document may be reproduced or copied without the consent of the company. Any unauthor‐ized use, duplication, redistribution or disclosure is prohibited by law and will result in prosecution. The information contained in this document is intended solely for the recipient and may not be further distributed by the recipient. The Company accepts no liability what‐soever for the actions of third parties.
The research analyst(s) of this report certifies that all of the views expressed in this research report accurately reflect their personal views about those issuer(s) or securities and that no part of his/her/their compensation was, is, or will be, directly or indirectly, related to the specific recommendation(s) or view(s) expressed by that research analyst in this research report.
Analyst’s holding in the stocks mentioned in the Report: ‐ NIL
INDSEC
INDSEC Rating Distribution
Disclaimer
INDSEC SECURITIES AND FINANCE LTD. 23

CONTACT DETAILS
For additional information please contact: [email protected], or visit us at www.indsec.co.in
Indsec Securities & Finance Ltd, 301/302, "215 Atrium", "A" Wing, Andheri‐Kurla Road, Chakala, Andheri (East), Mumbai ‐ 400 093 Telephone: +91 22 6114 6114 / 6114 6100, Fax: +91 22 6114 6180 / 86
INDSEC
INDSEC SECURITIES AND FINANCE LTD. 24
Management Designation Email ID Direct No. (+91‐22)
Nandkishore Gupta Managing Director [email protected] 6114 6101/02
Research Team Designation [Sectors Covered] Email ID Direct No. (+91‐22)
Milan Wadkar Vice President‐Research [Cement, Auto & Mid Caps] [email protected] 6114 6105
Shailesh Kumar Research Analyst [Banking, FMCG & Mid Caps] [email protected] 6114 6139
Divya Sankaranarayanan Research Associate [email protected] 6114 6115
Rahul Dani Research Associate [email protected] 6114 6116
Chandrakant Maske Technical Analyst [email protected] 6114 6136
Institutional Sales Team Designation Email ID Direct No. (+91‐22)
Nilesh Mistry Head – Sales [email protected] 6114 6125
Parag Shah Sales Trader [email protected] 6114 6133
Pradnya Potdar Executive—Dealing [email protected] 6114 6134