Indoor Radiation Mapping using the Laser Assisted …infohouse.p2ric.org/ref/13/12758.pdfThe Laser...
37
DOE/EM-0407 Indoor Radiation Mapping Using the Laser Assisted Ranging and Data System (LARADS) Deactivation and Decommissioning Focus Area Prepared for U.S. Department of Energy Office of Environmental Management Office of Science and Technology November 1998
Transcript of Indoor Radiation Mapping using the Laser Assisted …infohouse.p2ric.org/ref/13/12758.pdfThe Laser...

DOE/EM-0407
Indoor Radiation Mapping Using the Laser Assisted
Ranging and Data System (LARADS)
Deactivation and DecommissioningFocus Area
Prepared for
U.S. Department of EnergyOffice of Environmental Management
Office of Science and Technology
November 1998

Indoor Radiation MappingUsing the Laser Assisted
Ranging and DataSystem (LARADS)
OST Reference #1946
Deactivation and DecommissioningFocus Area
Demonstrated atHanford Site
Richland, Washington

Purpose of this document
Innovative Technology Summary Reports are designed to provide potential users with theinformation they need to quickly determine if a technology would apply to a particularenvironmental management problem. They are also designed for readers who mayrecommend that a technology be considered by prospective users.
Each report describes a technology, system, or process that has been developed and testedwith funding from DOE’s Office of Science and Technology (OST). A report presents the fullrange of problems that a technology, system, or process will address and its advantages to theDOE cleanup in terms of system performance, cost, and cleanup effectiveness. Most reportsinclude comparisons to baseline technologies as well as other competing technologies.Information about commercial availability and technology readiness for implementation is alsoincluded. Innovative Technology Summary Reports are intended to provide summaryinformation. References for more detailed information are provided in an appendix.
Efforts have been made to provide key data describing the performance, cost, and regulatoryacceptance of the technology. If this information was not available at the time of publication,the omission is noted.
All published Innovative Technology Summary Reports are available on the OST Web site athttp://OST.em.doe.gov under “Publications.”
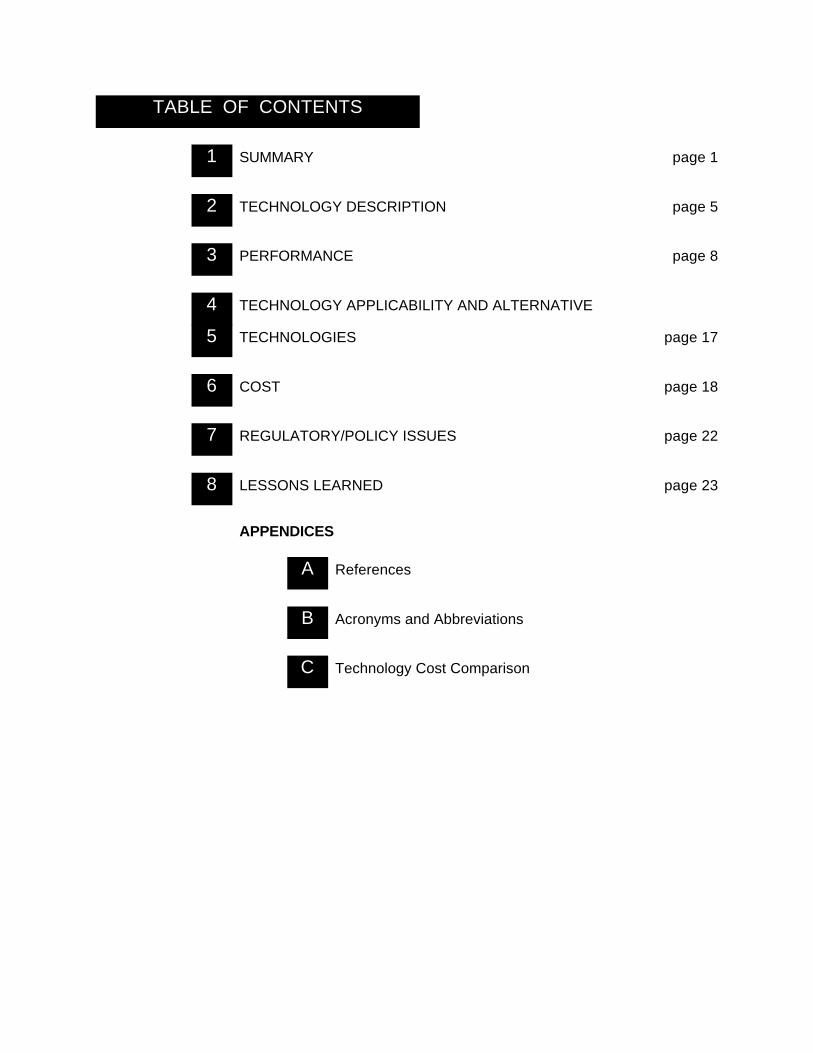
TABLE OF CONTENTS
SUMMARY page 11
TECHNOLOGY DESCRIPTION page 52
PERFORMANCE page 83
TECHNOLOGY APPLICABILITY AND ALTERNATIVE4
TECHNOLOGIES page 175
COST page 186
REGULATORY/POLICY ISSUES page 227
LESSONS LEARNED page 238
APPENDICES
ReferencesA
Acronyms and AbbreviationsB
Technology Cost ComparisonC

Page 1
U.S. Department of Energy
SECTION 1- EXECUTIVE SUMMARY
The Laser Assisted Ranging and Data System (LARADS) is a characterization technology that provides real-time data on the location and concentration levels of radiological contamination. The system can be utilizedwith a number of available detection instruments and can be integrated with existing data analysis and mappingsoftware technologies to generate superior quality survey data reports. This innovative technology iscompetitive with baseline technologies in terms of cost and survey times, but is much more flexible andprovides more useful reports. The system also has the capability of electronically logging survey data, makingit easy to store and retrieve. Such data are scientifically derived and not subject to interpretation. TheLARADS is an extremely attractive alternative to manually generated survey data reports.
�� Technology Summary
This section summarizes the demonstration of aninnovative characterization technology, Laser AssistedRanging and Data System (LARADS), developed byThermo NUtech and its subsidiary, Thermo Hanford, Inc.(THI). The LARADS provides real-time data on thelocation and concentration levels of radiologicalcontamination during surveys. The LARADS, which alsoproduces automated survey reports, was demonstrated forthe U. S. Department of Energy’s (DOE) C Reactor InterimSafe Storage (ISS) Project Large Scale TechnologyDemonstration (LSTD) at the DOE’s Hanford Site inRichland, Washington. 1394 m2 (15,000 ft2) of wall andfloor surfaces were surveyed.
Problem Addressed
DOE’s nuclear facilities require characterization and documentation of the results as part of planning anddecision-making for decontamination and decommissioning (D&D) projects and to release areas that have beencleaned up. Conducting radiation surveys of indoor and outdoor surfaces and generating accurate surveyreports is an important component of the D&D program. Historically, at the Hanford Site radiation surveyreports have been generated by observing and recording readings from the survey instrument and preparinghandwritten reports, usually containing crudely-drawn sketches of the areas being surveyed. This method is notalways reliable, as handwritten reports are often unclear or illegible, and source term quantification and locationare uncertain. The volume and quality of data that can be included in these manually generated reports isminimal.
The LARADS provides an attractive alternative to traditional methods of generating radiological survey datareports. The LARADS is based on integration of an auto-tracking civil surveyor’s “total station” with aradiological detection system, along with electronic data generation and storage, and is characterized by thefollowing features, capabilities, and configuration:
Features and Configuration
C Compatible with readily available portable or hand-held radiological survey detectors for both beta/gammaand alpha surface contamination
C Applicable to a variety of surfaces including floors, buildings, and structures (either interior or exterior)
C Capable of providing well-documented, usable release surveys or providing characterization surveysinvolving high levels of contamination
C Adaptable to mobile platform configurations for large-area surveys

EXECUTIVE SUMMARY continued
Page 2
U.S. Department of Energy
C Electronic storage of survey and radiation detection data that are scientifically derived and not subject tointerpretation or recorded manually
C Flexible report generation capabilities that are easily integrated with existing software technologies (suchas a Geographic Information System [GIS] or computer-aided design [CAD]), providing three-dimensionalgraphic and photographic presentations.
The LARADS consists of the following components:
C Tracking system
C Radio or wired data communication devices
C Customized software and a portable computer that can be set up either at the survey area or remotely
A hand-held radiological detector with a count rate meter was employed in this demonstration.
Potential Markets
The technology is suitable for DOE nuclear facility D&D sites or similar sites that must be surveyed to facilitateproperty transfer or release.
Advantages of the Innovative Technology
The following table summarizes the innovative technology against the traditional (baseline), hand-writtensurvey reports, in key areas:
Category Comments
Cost The cost of operating the LARADS technology ($5.00/m2)* is similar to thebaseline ($5.27/m2) , and less costly for highly-contaminated areas
Performance The LARADS produces reports that are more accurate, complete, and clear thanthe current baseline
Implementation No special site services are required to implement the LARADS or the baseline
Secondary WasteGeneration
The LARADS (and the baseline) do not generate any significant secondary waste
ALARA Use of the LARADS enhances as low as reasonably achievable (ALARA) practicecompared to the baseline tested by reducing the time that technicians spendnoting detector readings and locations while in proximity to contamination sources
* Cost for LARADS shown applies if one RCT is used, as discussed in the Cost Conclusions in Section 5
Shortfalls/Operator Concerns
As the total station is the comparatively high-cost item of the LARADS, proper radiological work practices andengineering controls should be taken to prevent it from becoming contaminated. While contamination will notweaken its ability to perform surveys, it will affect the locations where it can be used without radiologicalcontrols. (As presently configured, the tripod can be wrapped in plastic, but the head cannot be completelywrapped. A cover that would protect over 90% of the head surface could be added.) As with any radiologicaldetection device, the same care should be taken to prevent the radiological detector from becomingcontaminated, as this will probably affect survey results. The operator must check that tracking and electricpower supply are maintained.

EXECUTIVE SUMMARY continued
Page 3
U.S. Department of Energy
Skills/Training
Training of field technicians is minimal (less than one day), provided that the trainees are proficient in standardradiological survey practices. The set up and use of the total station requires technician training on this system. In addition, personal computer (PC)-based knowledge, along with the use of GIS software, are necessary toproduce enhanced-quality Auto-CAD overlay reports.
�� Demonstration Summary
This report covers the period February through December 1997, during which time 1394 m2 (15,000 ft2) offloors and walls were surveyed at the C Reactor.
Demonstration Site Description At its former weapons production sites, the U. S. Department of Energy (DOE) is conducting an evaluation ofinnovative technologies that might prove valuable for facility decontamination and decommissioning (D&D). Aspart of the Hanford Site LSTD at the C Reactor ISS Project, at least twenty technologies will be tested andassessed against baseline technologies currently in use. DOE’s Office of Science & Technology/Deactivationand Decommissioning Focus Area, in collaboration with the Environmental Restoration Program, is undertakinga major effort of demonstrating improved and innovative technologies at its sites nationwide, and if successfullydemonstrated at the Hanford Site, these innovative technologies could be implemented at other DOE sites andsimilar government or commercial facilities.
Applicability
C This system is useful for site characterization in support of D&D engineering design and during andsubsequent to D&D activities.
C By using various radiation probes, the LARADS has the ability to capture both alpha and beta/gammainformation.
C Clear, concise, comprehensible maps can be automatically generated representing the location and extentof contamination. These maps are useful for job planning and decontamination activities. Additionally,data can be used as input to dose assessment software with more accuracy, completeness, speed, andreproducibility than with the baseline technology.
Key Demonstration Results
It was successfully demonstrated that the LARADS system has the following capabilities:
C Accurate correlation of contamination level to the contamination location (+/- 2.5 cm [1 in.]).
C Continuous radiological data acquired and stored in database format.
C Clear, concise, easily understood graphics of survey data.
C Provides a tracking record that can be used to check for full coverage of the surface that was surveyed.
C Flexibility with the existing software allows the system to be adapted to most radiation survey probes suchas scintillator detectors (gamma or alpha probes), gas-filled detectors, and Geiger Mueller (GM) probes.
C Costs using the innovative technology are similar to baseline costs; however, report information is morecomplete and comprehensible, resulting in indirect cost savings to a project.

EXECUTIVE SUMMARY continued
Page 4
U.S. Department of Energy
C Production rates using the innovative technology are better than with the baseline for areas larger thanseveral hundred square meters. Based on production rates demonstrated, an example area of 520 m2
(5600 ft2) would take 7 work days with LARADS and 10 days with the baseline technology.
Regulator Issues
The LARADS is a mapping tool for characterization of contaminated surfaces; therefore, there are no specialregulatory permits required for its operation and use. The detection level of the radiological instrumentationmeets the requirements of 10 Code of Federal Regulations (CFR) Parts 20 and 835, and proposed Part 834.
Technology Availability
This technology is commercially available through THI or Thermo NUtech (parent Co. of THI), on a servicecontract basis, for beta/gamma and alpha surveys of floors and walls.
Technology Limitations/Needs for Future Development
Due to physical size and geometry of the total station, this system is not appropriate for small, congested areas. However, other than adding metric conversions to the mapping feature, at the present time there is no need tomodify the system demonstrated at the Hanford Site C Reactor.
�� Contacts
Management
John Duda, FETC, (304) 285-4217Jeff Bruggeman, DOE-RL, (509) 376-7121Shannon Saget, DOE-RL, (509) 372-4029
Technical
Stephen Pulsford, BHI, (509) 373-1769Greg Gervais, USACE, (206) 764-6837Conan Wade, THI, (509) 376-9040Marc Wendling, THI, (509) 373-1723
Licensing Information
John Moroney, THI, (509) 375-4675
Other
All published Innovative Technology Summary Reports are available at http://em-50.doe.gov. The TechnologyManagement System, also available through the EM-50 Web site, provides information about OST programs, technologies,and problems. The OST Reference # for Indoor Radiation Mapping Using the Laser Assisted Ranging and Data System(LARADS) is 1946.

Page 5
U.S. Department of Energy
TECHNOLOGY DESCRIPTION
Figure 1a. The LARADS system in action. Figure 1b. The LARADS equipment aspackaged.
SECTION 2
�� Overall Process Definition
The DOE nuclear facilities D&D program requires accurate documentation of radiological survey results obtained for insideand outside surfaces. Traditionally, this has been accomplished with the preparation of handwritten survey reports, that areoften difficult to read. The LARADS technology offers a viable alternative to this conventional approach by providingcomprehensive, high-quality, useable reports. The system (Figure 1) consists of these distinct components:
Components
1. A tracking system. This consists of a modified civil surveyor’s “total station.” A total station is capable of determiningrange (distance from the measurement probe to the total station setup), azimuth, and elevation to a target. A targetprism mounted on or in close proximity to the radiological detector reflects a low-intensity laser beam back to the totalstation.
2. Radio data communication devices (as was used in the C Reactor demonstration). (Note that wired communication isan option.) The measured contamination level is transmitted to a receiver that is connected to a computer.
3. A portable notebook PC and customized software. The system produces files that can be imported into a number ofcommercially available GIS software packages.
Also, an off-the-shelf portable radiological count rate meter (e.g., Eberline E-600 with suitable detector[s]) with automaticdata transmission capabilities is used with the system.
Overview
C The LARADS is capable of determining the position of a radiological detector as it moves across the subject of interest(wall, floor) and storing the positional coordinates of the detector, as well as the radiological reading, in electronic files. The system accurately transcribes the readings to various types of mapping displays.

TECHNOLOGY DESCRIPTION continued
Page 6
U.S. Department of Energy
C The system has customized software that allows it to display in real-time on the PC monitor the surveytrace, a background view of a surface (i.e., digital photo or CAD drawing) and the current radiologicalreading(s). The survey trace can be used to check that full coverage of the surface has been attained. Radiological data points that exceed a user-defined set point are highlighted as the survey progresses.
C The system provides a projected plan view of walls, top view of floors, and bottom view of ceilings, withX/Y origin user-selectable (usually left-hand corner of the room), area under survey, or a component beingsurveyed. The system is also capable of generating results in geodetic (i.e., State Plane, UTM, etc.)coordinates.
C Depending on the type of detector used, this technology accommodates up to two channels of radiologicalinformation storage per position, i.e., alpha, beta, gamma, or multiple region of influence gamma.
C The LARADS accommodates collection of radiological data in a buffer when it has lost lock with thedetector, such as when the surveyor passes behind obstructions. Once lock-in is re-established, data arelinearly interpolated between the two “good” positions. These interpolated values are flagged in the storedfile for later interpretation and quality assurance.
C The electronic files collected are downloaded and processed in CAD, GIS, and/or other software packagesto overlay on digital photos or CAD drawings to produce a graphical representation of contaminationlevels across the surface. These files can be loaded into a number of available database/spreadsheetpackages for statistical analysis.
C The system is battery-operated and capable of ~8 hours of operation between charges. The onlyexpendable items that would be generated by implementing this technology are the optional plasticwrappings that can be used to prevent contamination of equipment.
C The LARADS can accommodate a variety of radiation detection probes (e.g., alpha scintillator counter,beta/gamma counter such as a gas proportional counter or an ion chamber, sodium iodide detector, etc.)
�� System Operation
Setup
It takes about 20 minutes to set up the system under normal operation conditions (noncongested and openareas, ~3 m x 4 m [9 ft x 12 ft]). Prior to initiating the survey, the setup involves the following steps:
C Source check the radiological detection subsystem
C Mount and level the total station on a tripod
C Connect the total station to a power source and a computer
C Measure the height of the laser window from the floor and input the height into the computer
C Connect a radio modem with a battery attachment to the computer and to the survey instrument
C Perform a system check to verify that all of the components are operating
C Establish a predetermined alarm set point for the rate meter and set the alarm using the computer menu
C Establish a lock from the laser to the prism that is attached to the detector.

TECHNOLOGY DESCRIPTION continued
Page 7
U.S. Department of Energy
Under ideal conditions, the total station would be set up at least 3.7 m (12 ft) from the survey area. A largerdistance from the survey surface translates to a wider area that can be surveyed without moving the totalstation and performing additional setup sequences. The computer can be at any convenient location, either inthe same building or at a remote office.
Operation
The survey can be performed by one or two people. In a one-person operation, the surveyor will watch the faceof the Eberline E380-AB/E-600 probe/meter and/or listen to the audio function for signs of increasing activityduring the survey. With two people, one surveyor will monitor the survey on the computer screen while thesecond performs the scan and maintains proper detector scan rate and distance from the survey surface. While two people are not required, the time to set up and complete a survey can be slightly shortened and twopersons make it convenient if the total station is placed at a far distance or if hand scanning a large area resultsin operator fatigue. Personnel using the LARADS need basic computer skills and an understanding of x - ycoordinate systems. During each survey, the operator must ensure that electric power and tracking aremaintained. Where non-fixed contamination is involved, the equipment should be protected fromcontamination. There are no secondary waste streams or any substantial safety or environmental concernswith the LARADS technology.

Page 8
U.S. Department of Energy
PERFORMANCE
SECTION 3
�� Demonstration Plan
Site Description
The demonstration was conducted at the C Reactor building at DOE’s Hanford Site. The purpose of the LSTDprogram is to demonstrate and document performance data and costs for improved and innovativetechnologies that can aid in placing the C Reactor into an interim storage mode for up to 75 years, or until thefinal disposal of the reactor’s core is completed. The C Reactor ISS objectives include placing the reactor in acondition that will not preclude or increase future decommissioning costs, minimizing the potential for releasesto the environment, and reducing the frequency of inspections thereby reducing potential risk to workers.
The DOE nuclear facility D&D program requires accurate characterization of buildings and structures in order toplan D&D activities or to certify facilities for unrestricted release. The demonstrations of the LARADS and thebaseline technology were conducted in the Laundry Sorting Room of the C Reactor facility. Approximately 53m2 (570 ft2) of floors and walls up to about 2.5 m (8 ft) was surveyed with the LARADS for both beta/gammaand alpha radiation. Similarly, 49 m2 (525 ft2) were surveyed using the baseline technology. THI, a subsidiaryof the developer and one of Bechtel Hanford Inc.’s (BHI) subcontractors, provided radiological controltechnicians (RCTs) for the demonstration. THI developed and submitted a specific procedure for thecompletion of this demonstration. The procedure was carried out as a demonstration on February 14 and 19,1997. Over 1341m2 (14,430 ft2) at the C Reactor were subsequently surveyed using the LARADS andreleased, making the total area surveyed equal to 1394 m2 (15,000 ft2).
Demonstration Objectives
Objectives of the demonstration included the following desired performance features for the equipment:
C Capability of measuring survey points with xyz coordinates along with radiological readings (i.e., perform arelease survey with locating and quantifying of hot spots).
C The product must be a real-time, three-dimensional, radiation map.
C Mapping accuracy within 2.5 centimeters (1 in.).
C Easy to decontaminate with conventional practices.
C Ability to operate at temperatures between 3oC and 40o C.
C Have background subtraction capability.
C Ability to operate in a radiologically contaminated zone and able to perform the demonstration in such away as to avoid contamination.
C Ability to store and interpret a building grid (coordinates), a floor grid, and a wall grid. Output must resultin a map of contamination related to the physical structures (room, wall, door, window, column, etc.).
C The composite electronic file must be down-loadable to a commercially available PC system. Thecomputer, software, and software license must be supplied with the unit.

PERFORMANCE continued
Page 9
U.S. Department of Energy
Demonstration Chronology
To briefly summarize, the demonstration operations and main steps included the following:
C The LARADS was checked for operation by THI personnel prior to and after the demonstration at theHanford Site.
C The total station and ranging system was calibrated by THI prior to the start of the demonstration and wasrechecked after the demonstration.
C The radiological probes used by this system were calibrated by Pacific Northwest National Laboratory(PNNL) prior to the demonstration and source checked by THI personnel prior to and after thedemonstration.
C Approximately 100% of the reachable areas (approximately 53 m2 [570 ft2]) of the Reactor LaundrySorting Room was mapped using the LARADS for beta/gamma radiation. For any area that exceeded thepredetermined beta/gamma level set point, an alpha measurement was also conducted to determine thealpha contamination level. Since the demonstration, The LARADS has been deployed at C Reactor, andover 1394m2 (15,000 ft2) of surfaces have been surveyed for beta/gamma and released. Costs are basedon surveying 520 m2 (5,600 ft2).
C Radiological information was obtained using a commercially-available 100 cm2 active area zinc sulphide-coated thin plastic scintillation detector (Eberline E-380-A/B) interfaced with a commercially-availablecount/dose rate meter (CRM [Eberline E-600]). Data were collected and stored on the LARADS onboardnotebook computer in units of counts per minute (cpm). Later these data were analyzed and converted toradiological activity and reported in units of disintegrations per minute (dpm), normalized for Cs137.
�� Treatment Performance
LARADS
The LARADS collects data points at a rate of one per second. These data points represent the radiologicalinformation from the CRM and their associated physical coordinates. The LARADS records these data pointsin electronic files with the onboard computer system. This allows downloading of these files into a GIS forgenerating maps of the surveyed area and creation of a database relevant to the positions and radiologicalreadings.
Each surface survey effort entailed initializing the tracking sub-system, powering up the radiation detection sub-system and computer, and performing the survey. The initialization sequence allowed the tracking sub-systemto establish a local coordinate system for each surface. (This coordinate system is currently in EnglishStandards units [feet]. There are plans to modify the LARADS to report in metric units, but this modificationwas not in place for this specific demonstration project.)
Every attempt was made to traverse the survey area on parallel passes ensuring 100% coverage of the area;however, this was not always possible. The survey speed was approximately 2 in./sec. to 3 in./sec. A spacingjig was attached to the detector to maintain its distance, as near as practical, to 1/4 in. from the surface. In thismanner, detector geometry remained relatively constant throughout the wall survey portion of the project. However, using a handle extension ("walking stick") to allow floor surveys to be conducted with less discomfortto the surveyor, caused the detector geometry to suffer when conducting the floor survey. (This was correctedin other work with the LARADS.)
The LARADS surveyed approximately 53 m2 (570 ft2) during initial demonstration activities. Since thedemonstration, the LARADS has been successfully deployed at C Reactor and a total of over 1394 m2 (15,000ft2) of surfaces have been surveyed and released. The information collected during the deployment, along

PERFORMANCE continued
Page 10
U.S. Department of Energy
with information collected during the demonstration were used for performance and cost evaluations presentedin this report. During the initial demonstration phase, the LARADS system collected a total of 7,163 data pointswithin the surveyed areas. Each of these data points represents the radiological information from the specificradiological detector along with the physical coordinates of the readings.
Forty-three of the initial data points collected contained readings above the minimum detectible activity (MDA). When the LARADS CRM detector passes over a contaminated area, the cpm logged will rise, peak, and tail offagain to background levels. Due to their spurious nature, 10 of these readings were determined to be "falsepositive,” which accounted for less than 0.14% of the data collected and that were identified as false in dataprocessing. These false positives are kept in the data files, but are filtered out for the graphics or tablesincluded within the survey report.
Two locations on the floor were found to be contaminated above the detection systems MDA. One of thesewas found to exceed 5k dpm/100 cm2 (the 10 CFR 835 Appendix D value). This was found in a constructionjoint located in the southeast corner of the floor. The other elevated reading location was below the 5kdpm/100 cm2 level (4371 dpm/100 cm2). This elevated location was found in a slab penetration or insertlocated in the southeast quadrant of the floor area. (These two locations were also noted in the baselinesurvey.)
Figure 2 is a survey track map of the floor with the area surveyed overlaid on vector-based room featureschematics. This figure is presented as a comparison to the current baseline method of hand drawing sketches(Figure 3). Figure 4 is a survey track maps overlaid upon digital photos of a wall area. Figures 2 and 4 showthe LARADS data mapping and presentation capabilities.
Baseline
C THI RCTs performed a survey of all the floor and reachable wall areas of the Laundry Sorting Room(same area as the initial LARADS survey), using the same radiation detection probe and meter as theLARADS, and the same survey protocol for beta/gamma and alpha radiation filed measurements. Alldetectors were calibrated by PNNL and source checked by THI RCTs.
C Areas that indicated elevated beta readings were static checked for beta/gamma activity and also staticchecked using a zinc sulphide scintillation detector system (an E-380AB probe with an E-600 meter) foralpha radiation. Hot spot areas are normally marked with paint to identify the contaminated areas forfuture references, but they were not marked for this demonstration.
C The interior walls of the room were surveyed to a height of approximately 8 ft from the floor surface, andthe floor surface was surveyed in its entirety.
C A handwritten radiological survey report was generated containing information regarding the conduct ofthe survey such as date, time, instruments used, location, etc., as well as the survey results. This reportincluded a hand drawn sketch of the surveyed area with associated radiological contamination levels (seeFigure 3).

PERFORMANCE continued
Page 11
U.S. Department of Energy
NNNNNNNNN
NN
NN NNN
N
N NNN
N
NNNNNNNNNNN 3,343 Beta, <MDA (<111) Alpha
5,186 Beta, <MDA (<111) Alpha
3,450 Beta, <MDA (<111) Alpha
5,171 Beta, <MDA (<111) Alpha
SCALER RESULTS (dpm/100cm2)
0 2 4 Feet
LARADS Radiological Survey
Survey Track Map
105-C Technology Demonstration ProjectFloor - Laundry Sorting Room
Survey Date: 2/14/97# of Data Points: 3003Background (cpm): 259Minimum Detectable Activity (dpm): 3509Maximum Net cpm (Survey): 947Maximum Net dpm (Survey): <6764
Survey Statistics SummaryAll Direct Readings are per 100 cm2
< 3510 dpm (MDA)
>5000 dpm
3510 - 5000 dpm
LEGEND
N
Figure 2. The LARADS survey track map of the Laundry Sorting Room floor.
Note: Spaces between data points are not survey gaps, because the detector face is much larger inarea. All areas were scanned with overlap.

PERFORMANCE continued
Page 12
U.S. Department of Energy
Figure 3. Baseline survey report of the Laundry Sorting Room walls. Notes:
CC All areas were scanned with overlap.
PERFORMANCE continued
Page 13
U.S. Department of Energy
000000000000000000000000
000000000000000000
00
00000
00
0000000000000000000000000000000000000000000000000000
0000000000000000000000000000000000000000000000000
00000000000000000000000000000000
000000000000000000000000000000000000000000000000000000000000000000000
00000000000000000000000000000000000000000000000000000000000
000000000000000000000000000000000000000000000000000000000000000000000000000000000000000000000
00000000000000000000000000000000000
000000000000000000000000000000000
00000000000000000000000
000000000000000000
0000000000000000000000000
0000000000000000000000
00000000000
00000000000000000000000000000000
0000
00000000000000000000000
0000000000000000000000000000000
000000
000000
00000000000000
000000000000
1 0 1 2 Feet
LARADS Radiological Survey
Survey Track Map
105-C Technology Demonstration ProjectEast Wall - Laundry Sorting Room
Survey Date: 2/14/97# of Data Points: 700Background (cpm): 259Minimum Detectable Activity (dpm): 3509Maximum Net cpm (Survey): 79Maximum Net dpm (Survey): <3509 (<MDA)
Survey Statistics SummaryAll Direct Readings are per 100 cm2
0 < 3509 dpm (MDA)
Figure 4. The LARADS overlay of survey results on the east wall of the Laundry Sorting Room.
Note: All areas were scanned with overlap.

PERFORMANCE continued
Page 14
U.S. Department of Energy
Meeting Performance Objectives
The objectives listed in the Demonstration Overview section were met. The main purpose of thisdemonstration was to evaluate the data collection and survey result mapping capability of this system;evaluation of the radiological detector employed is not within the scope. In addition, the LARADS identified andmapped the same hotspots that the baseline survey system located and identified.
Comparison of Innovative Technology to Baseline
Table 3-1 summarizes performance and operation of the innovative technology compared to the baselinetechnology.
Because of the variety of functions and facilities, the DOE complex presents a wide range of D&D workingconditions. The working conditions for an individual job directly affect the manner in which D&D work isperformed. Evaluations of the innovative and baseline technology presented in this report are based upon aspecific set of conditions or work practices found at the Hanford Site, and are presented in Table 3-2. Thistable is intended to help the technology user identify work item differences between baseline and innovativetechnologies.
Skills/Training
Training of field technicians is minimal, provided that the trainees are proficient in standard radiological surveypractices. The set up and use of the total station requires technician training on this system. It was observedduring the deployment of the LARADS that the experienced RCTs can learn to operate the system in less thana day. In addition, PC-based computer knowledge, along with the use of GIS software, are necessary toproduce enhanced quality Auto-CAD overlay reports. This can easily be achieved provided that the operatorhas the basic knowledge of operation of PC-based computer software. Training of onsite personnel is notinvolved if the LARADS is deployed as a vendor service.
Operational Concerns
As the total station is the comparatively high-cost item of the LARADS, proper radiological work practices andengineering controls should be taken to prevent it from becoming contaminated. While contamination will notweaken its ability to perform surveys, it will affect the locations where it can be used without radiologicalcontrols. (As presently configured, the tripod can be wrapped in plastic, but the head cannot be completelywrapped. A cover that would protect over 90% of the head surface could be added.)
As with any radiological detection device, the same care should be taken to prevent the radiological detectorfrom becoming contaminated, as this will probably affect survey results.
The LARADS operator must be vigilant to ensure that tracking and electric power supply are maintained.

PERFORMANCE continued
Page 15
U.S. Department of Energy
TABLE 3-1. Summary of Performance and Operation - Baseline Versus Innovative TechnologyDemonstration.
Activity or Feature Baseline Tech Innovative Tech Demo
Field time (Survey)1 Same Same
Coverage of Area1 ~100% ~100%
Setup2 0.33 hrs 1 hr
Calibration3 Same Same
Report Preparation 2 hrs 0.5 hr (and with better qualitythan baseline)
Report Archiving Hard copy, microfilming4 Electronic format
Report Clarity Acceptable Better than baseline
Survey Report Generation 30 min. 30 min.
Flexibility Adequate More flexible than baseline
Precision, accuracy, representativeness,completeness
Adequate Better than baseline
Safety Same Same
Data interpretation Adequate Better than baseline
Ease of operation Easy Need some training5
Waste generation Minimal Plastic wrap to protectequipment
Utility requirements Same Same
Reproducibility6 Subjective Better than baseline
Ease of Use5 Skill of craft More involved than baseline5
(Hours shown are person-hours)NOTES:1. Two persons were used for 3 hours each for the improve/innovative technology demonstration. However, the
system can be operated with one person for improved labor efficiency.2. Setup, as used to describe baseline, includes time to layout grid lines prior to survey and is highly dependent upon
size of surface area to be surveyed. The LARADS setup is time to level tripod and connect system cabling and is<20 min per room regardless of size.
3. The radiological detection sub-system used for the LARADS demonstration is easier to calibrate than the baselinerad detection meter. The contamination rate meter used with the LARADS can be calibrated to an alpha/betadetector in <45 min.
4. Costs to prepare and maintain records unknown.5. Training and ease of use are not involved if the LARADS is deployed as a vendor service.6. Reproducibility is defined as the ability to return to the same precise location after passage of time to compare
readings.

PERFORMANCE continued
Page 16
U.S. Department of Energy
Table 3-2. Summary of Variable Conditions.
Variable The LARADS Technology Baseline Technology
Scope of Work
Quantity and type ofmaterial surveyed in testareas *
502 m2 (5600 ft2) of floor and wallsurfaces surveyed in one room;results of the survey are mapped anda report is generated.
49 m2 (525 ft2) of floor and wallsurfaces surveyed in one room; resultsof the survey are mapped and a reportis generated.
Location of test area Reactor Building C, Laundry SortingRoom.
Reactor Building C, Laundry SortingRoom.
Nature of work Surfaces were characterized andmapped for beta/gamma and alphacontamination.
Surfaces were characterized andmapped for beta/gamma and alphacontamination.
Work Environment
Level of contamination inthe test areas
The demonstration area is not aradiation area. Any contaminationthat might be present is non-removable and, therefore, fixed.
The demonstration area is not aradiation area. Any contamination thatmight be present is non-removableand, therefore, fixed.
Level of floorobstructions in test areas
Unobstructed. Unobstructed.
Work Performance
Technology acquisitionmeans
Survey and mapping are a vendorprovided service.
Survey and mapping are performed byHanford Site RCTs.
Compliancerequirements
Compliance is that necessary to meetthe requirements for a typical survey.
Compliance is that necessary to meetthe requirements for a typical survey.
Work Process Steps
Survey tracking rate
(This is provided forinformation only and isnot a factor in the costcomparison)
Actual:6.3 cm/sec. (2.5 in./sec.)
Actual:6.3 cm/sec. (2.5 in. /sec.)
Data recording duration Size of room being surveyed andlevel of contamination in the room willnot impact the speed of datacollection.
Larger and more heavily contaminatedrooms will see a decrease in the speedof data collection due to the require-ment for increased hand-logging ofverification readings. (See the costconclusions in section 5)
* Areas surveyed shown in this table represent: walls surveyed using the innovative LARADS technology duringJune-August 1997; and walls and floor surveyed using the baseline technology. As mentioned in Section 5 onCost, the cost analysis includes extrapolating the data for the 49 m2 baseline survey to 520 m2, in order tocompare the technologies on an equal basis.

Page 17
U.S. Department of Energy
TECHNOLOGY APPLICABILITY ANDALTERNATIVE TECHNOLOGIES
SECTION 4
�� Competing Technologies
Alternative methods to the LARADS technology are the conventional hand-drawn maps, or the indoorUltrasonic Ranging and Data (USRAD) system marketed by Chemrad Tennessee (Oak Ridge, Tennessee) thatautomatically does mapping comparable to the LARADS. The demonstrated system provides more completesurvey reports that are generated faster and with less effort than the baseline method.
�� Technology Applicability
C This technology can be used to provide thorough, well-documented release or characterization surveys ofcontaminated or potentially contaminated floors, buildings, and structures prior to and afterdecommissioning and demolition/dismantlement.
C The system may be used both on interior and exterior surfaces.
C The precision and quality of the survey documents (maps generated by the system) supports regulatoryreview and fulfills the intent of free release survey requirements.
C For larger areas (>100 ft2), the system can be configured with large-area detectors on a mobile platformfor surveying walls, ceilings, and floors.
C The LARADS is very flexible. Compatibility with the existing software allows the use of the majority ofavailable portable or hand-held radiological survey detectors (e.g., sodium iodide for Cs-137 and Co-60gammas, GM probe, alpha scintillator probe, etc.). The automatic tracking, ranging, and mappingcapabilities are adaptable to surveying any surface. As the system collects three-dimensionalcoordinates, it may be used on surfaces (to the extent that probe size allows; probe is 4 in. wide and 6 in.long) as well as general area (i.e., middle of the room, a distance above the floor or wall). Three-dimensional presentation software exists and data presentation is dependent on the user’s needs andrequirements.
C The system can also be configured with high-level radiation detectors and can be used for investigatingand documenting more extreme radiological conditions.
�� Patents/Commercialization/Sponsor
This technology is commercially available through THI or Thermo NUtech (parent Co. of THI), on a servicecontract basis, for beta/gamma and alpha surveys of floors and walls.
The demonstration at C Reactor was sponsored by DOE’s Office of Science & Technology/Deactivation andDecommissioning Focus Area, in collaboration with the Environmental Restoration Program.
�� Marketplace Opportunities
C Radiologically contaminated sites with surface contamination or suspect surface contamination slated forremediation or D&D activities and release (DOE, U. S. Environmental Protection Agency or U. S. NuclearRegulatory Commission [NRC] sites).
C Operational and maintenance radiation surveys at DOE or NRC sites.

Page 18
U.S. Department of Energy
COST
SECTION 5
The purpose of this section is to summarize cost elements for the innovative technology and analyze thepotential for savings relative to equivalent cost elements for the baseline technology. The objective is to assista decision maker who is considering further investigation of the innovative technology or those who may desireto deploy such a system.
�� Methodology
This cost analysis compares the innovative LARADS technology, interfaced with standard portable radiologicalCRMs, to a baseline technology consisting of surveying with standard count/dose rate meters and hand-mapping and recording the results. The latter has been the standard procedure for radiological surveying ofwall surfaces at the Hanford Site. Costs for the innovative technology are taken from actual costs experiencedduring its deployment at the C Reactor, where it was used to survey walls in several rooms of the building. Costs for the baseline technology are taken from a demonstration conducted in the Laundry Sorting Room ofthe C Reactor. A total 1394 m2 of surfaces have been surveyed using the LARADS technology, of which 520m2 were completed at the time this cost comparison was developed, compared to a total of only 49 m2 of walland floor surveyed during the initial demonstration of the baseline technology. Thus, for comparison purposes,costs for the baseline are extrapolated out to the 520 m2 (5,600 ft2). Final results from running both surveys arecontained in reports that include maps of the surveyed surfaces detailing location, type, and level ofcontamination.
Activities included for cost comparison are as follows:
Innovative Technology Baseline Technology
C Transport equipment from the storage area tothe work area
C Transport equipment from the storage area tothe work area
C Set up the LARADS equipment and establishstarting coordinates; run background check forCRM readings
C Set up equipment; run background check forCRM readings
C Survey utilizing a CRM interfaced with theLARADS
C Survey with CRM and hand-record the data
C Reposition the LARADS at new locations andreset coordinates
C Exit-frisk equipment C Exit-frisk equipment
C Assemble report from the survey results C Assemble report from the survey results
Based on the conditions established for the comparison, costs for the LARADS vary from being essentiallyequivalent to the baseline technology to nearly twice the cost of the baseline technology. These differences aredirectly related to the number of RCTs utilized when surveying with the LARADS and are discussed in moredetail herein.

COST continued
Page 19
U.S. Department of Energy
�� Cost Analysis
The LARADS technology is available from the vendor at the rates indicated in Table 5-1:
Table 5-1. Innovative Technology Acquisition Costs.
ACQUISITION OPTION ITEM COST
Vendor provided service (based on1997 rate per eight -hour day fromThermo Hanford, Inc.)
C Two vendor techniciansC The LARADS equipment, + rate
meter and probe
C Alternative with one vendortechnician
C The LARADS equipment, + ratemeter and probe
$800.00$60.00
Total Daily Rate: $860.00(with two technicians)
$400.00$60.00
Total Daily Rate: $460.00(with one technician)
Observed unit costs and production rates for principal components of the demonstrations for both theinnovative and baseline technologies are presented in Table 5-2.
Table 5-2. Summary of Unit Costs & Production Rates Observed.
INNOVATIVE TECHNOLOGY BASELINE TECHNOLOGY
Cost Element Unit CostProduction
RateCost Element Unit Cost Production Rate
*
Set up theLARADS
$188.00/each N/A Surveying withconventionalinstrumentation(assumes 1 RCTsurveying)
$3.21m2/hr($.29/ft2)
17.4 m2/hr (187 ft2/hr) *
Survey utilizingthe LARADSC with 1 RCT
surveyingC with 1 RCT
scanning + 1 RCT at thestation
$3.21/m2
($.29/ft2)$5.81/m2
($.54/ft2)
18.6 m2/hr(200 ft2/hr)18.6 m2/hr(200 ft2/hr)
Data analysis & reportassembly(assumes 1 RCTcompiling the report)
$100.00/day** N/A
Reportgeneration(assumes 1 RCTcompiling thereport)
$29.00/each N/A
* The production rate for baseline will be adversely impacted if activity above background is encountered. With the LARADS, productivity can be constant. With baseline, the technician must stop and assess elevatedresponse, either to quantify hot spots or to verify that activity is below criteria of concern.

COST continued
Page 20
U.S. Department of Energy
$0
$500
$1,000
$1,500
$2,000
$2,500
$3,000
$3,500
$4,000
$4,500
Total Mob. D & DCharac.
Demob. DataAssy. &
Doc.
cost category
cost
Baseline Hand-Recording
Innovative LARADS (2 RCTs)
Innovative LARADS (1 RCT)
Figure 5. Costs.
** Baseline reports are done at the end of each workday.
Unit costs and rates indicated are only for the activities shown and do not consider mobilization, setup,productivity losses, or demobilization. Costs included in Table 5-2 for the innovative technology are for laborand for equipment rental; for the baseline costs are for labor and for equipment amortization. The total cost forusing this technology is sensitive to several site-specific conditions. The survey production rate will vary withthe working conditions, e.g., percent of job performed in rooms with irregular wall geometry, numerousopenings in the walls, or permanent obstructions in front of the walls, all of which will force moving the LARADSmore often and thereby decrease productivity.
For additional discussion of cost variable conditions that may occur when using the innovative technology andthe potential effect these conditions may have on unit costs and production rates, refer to Section 3 of thisreport.
�� Costs
Figure 5 is a chart displaying a comparison of costs between the innovative and baseline technologies forsurveying a total area of 520 m2 ( 5,600 ft2). As previously noted, this represents the actual wall areassurveyed during deployment of the LARADS technology at the C Reactor, but is an extrapolated wall area forthe baseline technology. Both methodologies utilize the same hand-held instrumentation to obtain similarsurvey results. The comparison is based on total observed costs for each technology. This comparison is validfor release surveys where few spots are encountered that have activity higher than background.
A second scenario for utilizing the innovative technology is also included in the chart for comparison purposes. This scenario involves the use of one RCT to set up and do the surveying with the LARADS as opposed to thetwo RCTs that were actually used. See Appendix C for a description of activities included in each cost categoryand the detailed cost analysis for the innovative technology (both cases) and the baseline technology.

COST continued
Page 21
U.S. Department of Energy
�� Cost Conclusions:
When two RCTs use the LARADS for surveying, one manning the computer and the other running the surveyinstrument, the technology has higher costs than the baseline technology in all categories except for reportgeneration. The total unit cost for the LARADS when utilizing two RCTs is $8.83/m2 ($0.82/ft2). The total unitcost for the baseline technology is $5.06/m2 ($.47/ft2 ). Total unit costs are based upon the conditions andassumptions established for the demonstration and are derived by dividing the total cost for each of theinnovative and baseline technologies by 520 m2 (5,600 ft2) . See Appendix C, Tables C-1 an C-2 forcalculations of total costs for the innovative and baseline technologies, respectively.
Although the LARADS takes more time to set up and move, it has a unique advantage over the baselineequivalent in its ability to store collected survey data for later assimilation into reports. This saves time inreport generation. Also note that data listed in Table 5-2 show that the LARADS has a slight productivityadvantage over the baseline technology. This is due to a lower confidence level in the data collected using thebaseline method; i.e., hand-recording the data involves rechecking (or verification) of readings to ensureaccuracy. The LARADS eliminates shortcomings inherent in the baseline methodology by automatically and precisely locating and recording survey instrument readings in the first pass.
A cost scenario using one RCT to run a LARADS survey on the demonstration wall area was generated and ispresented in Table C-1.1 of Appendix C. Under this scenario, the total unit cost for the LARADS is $5.27/m2
($.49/ft2) , making it nearly identical in cost to the baseline technology. It should be noted, however, that thestandard procedure at the Hanford Site for surveying large wall areas or wall areas of any size that have a highlevel of contamination is to use two RCTs in order to allow alternating the RCT using the hand-held instrument.This reduces operator fatigue and the possibility of operator error.
For large and heavily contaminated wall areas, it is possible that using the LARADS with two RCTs mayactually cost less than the baseline methodology. Taking redundant readings to pinpoint hotspots ischaracteristic with the baseline technology and, for heavily contaminated wall surfaces, can lead to a reductionin productivity over using the baseline methodology on lightly contaminated wall surfaces or wall surfaces beingsurveyed for free release. If a baseline scenario is run using an assumed 35% reduction in productivity (and allother conditions and assumptions for the demonstration are applied), then using the LARADS with two RCTsbecomes less expensive than the baseline technology for wall surface areas over 715 m2 (7700 ft2).
In conclusion, a potential user of the innovative technology must weigh factors such as job size, duration andlevel and concentration of contamination in order to properly assess costs. If the job is complex, but underapproximately 715 m2 (7700 ft2) in size, then the user may want to determine if the trade-off between theincreased labor costs to run the LARADS with two RCTs is offset by its guaranteed increase in productivity,accuracy, and completeness over the conventional baseline methodology. For example, if the regulatedrequirements for a characterization or closure survey require an increased amount of documentation or anincrease in precision, then it may be wise to utilize the LARADS technology. Those desiring a detaileddescription of assumptions used to formulate the cost comparison should refer to Appendix C of this report.

Page 22
U.S. Department of Energy
REGULATORY/POLICY ISSUES
SECTION 6
�� Regulatory Considerations
C The LARADS is a mapping tool for characterization of contaminated surfaces; therefore, there are nospecial regulatory permits required for its operation and use.
C The system can be used for free release surveys, depending on the detection level requirements. For thisdemonstration, the detection level of the radiological instrumentation meets the requirements of 10 CFRParts 20 and 835, and proposed Part 834.
C Although the demonstration took place at a Comprehensive Environmental Response, Compensation, andLiability Act (CERCLA) site, no CERCLA requirements apply to the surveys conducted.
�� Safety, Risk, Benefits, and Community Reaction
Worker Safety
C Normal radiation protection worker safety procedures used at the facility would apply.C Technology users should implement contamination control practices.C Normal electrical grounding requirements should be met if the option to use 115-VAC power is selected.C Normal precautions with lead-acid battery storage apply.
Community Safety, Environmental and Socioeconomic Impacts, and Community Perception
C It is not anticipated that implementation of the LARADS innovative technology would present any adverseimpacts to community safety or the environment.
C Similarly, no socioeconomic impacts are expected in association with use of this technology.
C This technology should be well perceived by the public since it enhances the information that is available,such as maps and records, upon which cleanup and no-action decisions are based.
Page 23
U.S. Department of Energy
LESSONS LEARNED
SECTION 7
�� Implementation Considerations
C The tracking system component of the LARADS has the capacity to reestablish the tracking signal afterbeing interrupted when maneuvering around obstacles. The data can be interpolated between areaswhere an interruption has occurred; however, for achieving the most effective surveys, obstacles andmovable objects should be cleared from the survey area as much as possible.
C The system loses sensitivity when totally covered with plastic sheeting. Therefore, extra care is requiredwhen operating the system in contaminated areas.
C The LARADS is well suited for large, open indoor areas and is weatherproof for outdoor use.
�� Technology Limitations/Needs for Future Development
C Due to physical size and geometry of the total station, this system is not appropriate for small, congestedareas.
C At the present time, there is no need to modify the mapping features of the system demonstrated at theHanford Site C Reactor other than adding metric conversions.
�� Technology Selection Considerations
C The technology is suitable for DOE nuclear facility D&D sites or similar sites that must be surveyed tofacilitate property transfer or release.
C This system is useful for site characterization in support of D&D engineering design and during andsubsequent to D&D activities.
C By using various radiation probes, the LARADS has the ability to capture both alpha and beta/gammainformation.
C Clear, concise, comprehensible maps can be automatically generated, representing the location andextent of contamination. These maps are useful for job planning and decontamination activities. Additionally, data can be used as input to dose assessment software with more accuracy, completeness,speed, and reproducibility than the baseline technology.
C Data acquired through use of the LARADS are scientifically derived, and are not subject to subjectiveobservations. The data are electronically logged, and are not recorded or presented manually.

Page 24
U.S. Department of Energy
REFERENCES
APPENDIX A
ANSI, 1989, Performance Specifications for Health Physics Instrumentation for Use in Normal EnvironmentalConditions, ANSI N42.17A-1989, American National Standards Institute, New York, New York.
10 CFR 835, "Occupational Radiation Protection," Code of Federal Regulations, as amended.
NRC, 1992, Termination of Operating Licenses for Nuclear Reactors, Regulatory Guide 1.86, U.S. NuclearRegulatory Commission, Washington, D.C.
THI, 1997, Final Survey Report for C Reactor Technology Demonstration, Thermo Hanford, Inc., Richland,Washington, 1997.

Page 25
U.S. Department of Energy
ACRONYMS AND ABBREVIATION
APPENDIX B
Acronym/Abbreviation
Description
ALARA As Low As Reasonably Achievable
ANSI American National Standards Institute
BHI Bechtel Hanford, Inc.
CAD computer-aided design
CERCLA Comprehensive Environmental Response, Compensation and
CFR Code of Federal Regulations
CRM count rate meter
cpm counts per minute
D&D decontamination and decommissioning
DOE U.S. Department Of Energy
DOE-RL DOE- Richland Operations Office (WA)
dpm disintegrations per minute
FETC Federal Energy Technology Center
G&A general and administrative (costs)
GIS geographical information system
GM Geiger Mueller
ICT Integrated Contractor Team
ISS Interim Safe Storage
LARADS Laser Assisted Ranging and Data System
LSTD Large Scale Technology Demonstration
MDA minimum detectible activity
NRC U. S. Nuclear Regulatory Commission
PC personal computer
PNNL Pacific Northwest National Laboratory
RCT radiological control technician
THI Thermo Hanford, Inc.
USACE U.S. Army Corps Of Engineers
UTM Universal Transverse Mercator (coordinates)
VAC volts, alternating current
WBS work breakdown structure

Page 26
U.S. Department of Energy
TECHNOLOGY COST COMPARISON
APPENDIX C
This Appendix contains definitions of cost elements, descriptions of assumptions, and computations of unitcosts that are used in the cost analysis. The definitions are based on a work breakdown structure (WBS) formobilization, characterization, demobilization, data assembly, and documentation.
Innovative Technology - LARADS
MOBILIZATION (WBS 331.01)
Transport Equipment from Storage to Work Area: This cost element provides for transporting equipmentfrom a location on the Hanford Site to the C Reactor. Activity cost is measured as one each daily activity.
Daily Equipment Setup: This cost element includes setting up the LARADS tripod and leveling it, connectingthe total station to a power source and computer, measuring the height of the laser window, connecting theradio modem to the survey instrument and the computer, establishing a predetermined alarm set point for thesurvey instrument, and source checking the radiological subsystem. The activity cost is measured as a dailyactivity.
Safety Meeting: This cost element is a weekly safety meeting for the entire D&D work crew at the C Reactor. For purposes of fitting the format of the cost summary, the meeting time has been divided by 5 and distributedout as a daily activity.
D&D CHARACTERIZATION (WBS 331.17)
Use LARADS in Conjunction with an Eberline E-600 to Survey for Beta-Gamma: This cost elementincludes one RCT performing the scan with an Eberline E-600 and one RCT monitoring the computer screen onthe LARADS. The activity cost is measured on a per square foot basis.
Reposition LARADS & Reset Coordinates: This cost element includes moving the LARADS tripod andcomputer to new locations after tracking limits of the device have been reached. The number of times requiredto move the device in a typical work day varied during the deployment and depended upon RCT experience inoperating the device (a “learning curve” was encountered), square foot area and height of walls within therooms surveyed, level of obstruction in front of the surveyed walls, and the number of openings present insurveyed walls. For purposes of simplification, the number of moves used in the cost calculation is based onan average. During the deployment, four moves per day were typically required and form the basis of this costactivity.
DEMOBILIZATION (WBS 331.21)
Exit-Frisking LARADS: This cost activity includes running an instrument sweep of the LARADS equipment tocheck for radiological contamination. It is measured as a daily activity.
D&D DATA ASSEMBLY & DOCUMENTATION (WBS 331.17)
Assemble Report from the Mapping Results: This cost activity includes downloading data collection filesfrom the field system computer into an office-based GIS system for analysis and report generation. It ismeasured as a daily activity.
COST ANALYSIS
The LARADS was deployed at the C Reactor on the Hanford Site. The technology was used to collect surveydata generated by readings from a portable Eberline E-600 CRM equipped with an Eberline E-380 AB zincsulfite scintillator probe with a face area of 100 cm2. The probe was used to detect both alpha and beta

APPENDIX C continued
Page 27
U.S. Department of Energy
radiation simultaneously on wall surfaces of several rooms in the facility at a scan speed of up to 4 in. persecond. The LARADS tracked location of the survey rate meter by means of a tripod-mounted laser andreflection prism mounted to the rate meter. Survey readings were transferred to the LARADS computer bymeans of a radio modem also attached to the rate meter.
The LARADS technology was acquired as a vendor service from THI, who supplied both the LARADSequipment and two RCTs to operate it. Actual surveying used as the basis of this cost analysis with theLARADS took place over 25 roughly consecutive work days starting the last week of June 1997 and ending thefirst week of August 1997. In that time period, 520 m2 (5,600 ft2) of wall area was surveyed.
It is important to note that the LARADS did not achieve ideal production every day it was used during thedeployment. Several factors were responsible for this and include:
C the necessity to remove debris from ongoing D&D activities at the C Reactor that were piled up in front ofwalls and obstructed a clear tracking path for the LARADS laser
C other interferences and delays caused by ongoing D&D work
C battery problems that affected the LARADS computer
C short circuits in the power cords attached to the LARADS equipment and other problems associated withequipment cabling
C occasional aberrant survey instrument readings caused by improper settings (forcing resurveying)
C daily demands on RCT time outside the LARADS survey work (a key reason for delays in finishingsurveying work)
Surveying with the LARADS proceeded at the pace of 18.6 m2 (200 ft2) per hour for roughly 4 hours ofproductive surveying per day when little or no interference occurred. Under unencumbered productionconditions, the rest of the work day was occupied with normal daily lunch and work breaks; time to make anaverage of four location moves with the LARADS equipment; and time to pack up equipment, leave the job-site, and return to an office to compile the survey results. Calculated costs for the LARADS are based on theseproductivity assumptions in order to reasonably and fairly judge it against a comparable baseline technology(that must be extrapolated to match the 520 m2 (5,600 ft2) surveyed with the LARADS) and to establish a basisby which other DOE sites can judge the technology. Thus, the following cost table distills the deployment froman activity that took roughly 1 month activity to an activity that takes 7 fully-productive days.

APPENDIX C continued
Page 28
U.S. Department of Energy
Table C-1. Cost Summary - LARADS (Utilizing Two RCT’s)Unit Cost (UC) Total Unit Total Cost
Work Breakdown (WBS) Hours Rate Hours Rate UnitCost
(TQ) Measure (see 1) Comments
MOBILIZATION (WBS 331.01) Subtotal: $283.54 Transport Equipment fromStorage to Work Area
0.08 $99.90 (see 3)
0.08 $7.50(see 4)
$8.59 8 day (see 5)
$68.74 Based on 5 minutes per day of surveying totake equipment from a storage area to the worklocationin the C Reactor
Daily Equipment Setup(Including Source-Check)
0.25 $49.95(see 2)
0.25 $7.50 $14.36 8 day(see 5)
$114.90 Based on 15 minutes per day of surveying toset up equipment at the work location
Safety Meeting 0.50 $99.90 $49.95 2 each $99.90 Based on the Hanford Site requirementto have one safety meeting per week
D&D CHARACTERIZATION (WBS 331.17) Subtotal: $3,866.40 Use LARADS inconjunction with EberlineE-600 to survey for beta-gamma
0.0050 $99.90 0.0050 $7.50 $0.54 5,600 squarefoot
$3,007.20 Based on 2 RCTs averaging 4 hours of actualsurveying per day
Reposition the LARADS &Reset Coordinates(Registration)
0.25 $99.90 0.25 $7.50 $26.85 32 each $859.20 Based on an average of 4 moves per day ofsurveying utilizing the LARADS equipment
DEMOBILIZATION (WBS 331.21) Subtotal: $229.80 Exit-Frisking LARADS 0.17 $49.95 0.17 $7.50 $9.77 8 day
(see 5)$78.13 Equipment standby and time for an RCT to
survey the equipmentBreaking Down LARADSEquipment
0.33 $49.95 0.33 $7.50 $18.96 8 day (see 5)
$151.67 Includes removing the LARADS system PC,CRM, and data links
D&D DATA ASSEMBLY & DOCUMENTATION (WBS 331.17) Subtotal: $229.80 Generate Report from theSurvey Results
0.50 $49.95 0.50 $7.50 $28.73 8 day (see 5)
$229.80 Based on an average report generation time of30 minutes per day of surveying
TOTAL: $4,609.54 (for 5,600 sf of wall)
Notes:
1) UC=UC X TQ

APPENDIX C continued
Page 29
U.S. Department of Energy
2) The labor rate of $49.95/hr is based on the rate for a RCT and includes base wage, fringes, and areaoverhead, but excludes BHI G&A and overhead.3) The labor rate of $99.90 is based on a crew rate for two vendor-supplied RCTs and incudes base wage,fringes, and area overhead, but excludes BHI G&A and overhead.4) The equipment rate of $7.50/hour is based on a rate of $300.00/week established by Thermo Hanford, Inc. The hourly rate assumes an average 40-hour work week.
The Hanford Site indirect expense rates for common support and materials are omitted from this analysis. Overhead rates for each DOE site vary in magnitude and in the way they are applied. Decision makers seekingsite-specific costs can apply their site’s rates to this analysis without having to back out the Hanford Site’s ratesfirst. This omission does not sacrifice the cost savings accuracy because overhead is applied to both theinnovative and baseline technology costs. Engineering, quality assurance, administrative costs, and taxes onservices and materials are also omitted from this analysis for the same reason indicated for the overhead rates. The standard labor rates established by the Hanford Site for estimating D&D work are used in this analysis forthe portions of the work performed by local crafts. Additionally, the analysis uses an 8-hour work day with a 5-day week.

APPENDIX C continued
Page 30
U.S. Department of Energy
Table C-1.1. Cost Summary - LARADS (Utilizing One RCT)Unit Cost (UC) Total Unit Total Cost
Work Breakdown Structure Labor Equipment Other Total Quantity of (TC) (WBS) Hours Rate Hours Rate Unit
Cost (TQ) Measure (see 1) Comments
MOBILIZATION (WBS 331.01) $201.62 Transport Equipment fromStorage to Work Area
0.08 $49.95(see 2)
0.08 $7.50(see 3)
$4.60 8 day (see 4)
$36.77 Based on 5 minutes per day of surveying to takeequipment from a storage area to the worklocation in the C Reactor
Daily Equipment Setup(Including Source-Check)
0.25 $49.95 0.25 $7.50 $14.36 8 day $114.90 Based on 15 minutes per day of surveying toStorage to Work Area
Safety Meeting 0.50 $49.95 $24.98 2 each $49.95 Based on the Hanford Site requirementto have one safety meeting per week
D&D CHARACTERIZATION (WBS 331.17) $2,068.20 Use LARADS in conjunctionwith an Eberline E-600 tosurvey for beta-gamma
0.0050 $49.95 0.0050 $7.50 $0.29 5,600 squarefoot
$1,608.60 Based on 1 RCT averaging 4 hours of actual surveying time per day
Reposition the LARADS &Reset Coordinates(Registration)
0.25 $49.95 0.25 $7.50 $14.36 32 each $459.60 Based on an average of 4 moves per day ofsurveying utilizing the LARADS equipment
DEMOBILIZATION (WBS 331.21) $228.60 Exit-Frisking LARADS 0.17 $49.95 0.15 $7.50 $9.62 8 day
(see 4)$76.93 Equipment standby and time for an RCT to
Breaking Down LARADSEquipment
0.33 $49.95 0.33 $7.50 $18.96 8 day (see 4)
$151.67 Includes removing the LARADS system PC,CRM, and data links
D&D DATA ASSEMBLY & DOCUMENTATION (WBS 331.17) $229.80 Generate Report from theSurvey Results
0.50 $49.95 0.50 $7.50 $28.73 8 day (see 4)
$229.80 Based on an average report generation time of30 minutes per day of surveying
TOTAL: $2,728.22 (for 5,600 sf of wall)

APPENDIX C continued
Page 31
U.S. Department of Energy
Baseline Technology
MOBILIZATION (WBS 331.01)
Transport Equipment from Storage to Work Area: This cost element provides for transporting equipmentfrom a location on the Hanford Site to the C Reactor. The activity is measured as a one each per day.
Source-Check Equipment: This cost element includes routine background checks with the hand-held surveyinstrumentation before beginning surveying. The activity is measured as a one each per day.
Safety Meeting: This cost element is a weekly safety meeting for the entire D&D work crew at the C Reactor. For purposes of fitting the format of the cost summary, the meeting time has been divided by five anddistributed as a daily activity.
D&D CHARACTERIZATION (WBS 331.17)
Survey Walls with an Eberline E-600 and Hand-Record the Results: This cost element includes routinesweeps for beta-gamma and alpha contamination using the Eberline hand-held instrumentation. It alsoincludes stopping the instrument sweep to record readings. This is particularly essential at hot spots wherehand-recording must occur simultaneously with, or immediately after, receiving detector readings to accuratelyestablish the location and size of hot spots. For the baseline demonstration, the activity is measured as a oneeach activity since the contamination level of the test area was low and relatively few hot spots were found. (Inheavily contaminated regions, it is anticipated that this would be an ongoing activity occurring simultaneouslywith the instrument sweep and, thus, would probably need to be measured on a unit basis such as square footper minute). The activity cost is measured on a per-square-foot basis.
DEMOBILIZATION (WBS 331.21)
Exit Frisk Equipment: This cost element includes time to sweep miscellaneous equipment, such asclipboards, pencils, etc. for contamination. It does not include time to check the actual detectors forcontamination.D&D DATA ASSEMBLY & DOCUMENTATION (WBS 331.17)
Assemble a Report from the Survey Results: This cost activity includes logging all of the hand-recordeddata into an office-based GIS for analysis and report generation.
COST ANALYSIS
The baseline technology consists of using conventional detectors to sweep for radiological contamination. Itwas demonstrated at the Hanford Site on 49 m2 (525 ft2) of floor and wall areas in the Laundry Sorting Room ofthe C Reactor. Measurement equipment used during the baseline demonstration was the same as theLARADS measurement equipment (an Eberline E-380AB probe/E-600 that has the capability of detecting bothbeta/gamma and alpha contamination. The survey was conducted at an average scan speed of 6.35centimeters (2.5 in.) per second.
For the demonstration, survey work was conducted by one RCT employed by THI. Hourly RCT labor rates arethe result of discussions between the U. S. Army Corps of Engineers (USACE) and BHI and are detailed in

APPENDIX C continued
Page 32
U.S. Department of Energy
Table C-2. A separate hourly rate was calculated for the survey equipment used and is based on an amortizedcost that factors in initial procurement costs, average service life, and annual repair costs.
In order to create an equitable comparison between the baseline and the innovative technologies, costs for thebaseline demonstration are extrapolated out to the 520 m2 (5,600 ft2) of wall areas that were surveyed duringdeployment of the LARADS. A total comparable cost is then calculated using labor and equipment costs andsurvey productivity established during demonstration of the baseline technology. Based on these assumptions,to survey an equivalent wall area with the baseline methodology will take 10 fully productive days.
The Hanford Site indirect expense rates for common support and materials are omitted from this analysis. Overhead rates for each DOE site vary in magnitude and in the way they are applied. Decision makers seekingsite-specific costs can apply their site’s rates to this analysis with out having to back out the Hanford Site’s ratesfirst. This omission does not sacrifice the cost savings accuracy because overhead is applied to both theinnovative and baseline technology costs. Engineering, quality assurance, administrative costs, and taxes onservices and materials are also omitted from this analysis for the same reason indicated for the overhead rates. The standard labor rates established by the Hanford Site for estimating D&D work are used in this analysis forthe portions of the work performed by local crafts. Additionally, the analysis uses an 8-hour work day with a 5-day week.

APPENDIX C continued
Page 33
U.S. Department of Energy
Table C-2. Cost Summary - Baseline.Unit Cost (UC) Total Unit Total Cost
Work Breakdown Structure Labor Equipment Other Total Quantity of (TC)(WBS) Hours Rate Hours Rate Unit
Cost (TQ) Measure (see 1) Comments
MOBILIZATION (WBS 331.01) Subtota: $123.87 Transport Equipment from 0.08 $49.95 0.08 $1.38 $4.11 9 day $36.96 Based on 5 minutes per day of surveyingStorage to Work Area (see 2) (see 3) (see 4) to take equipment from a storage area to
a work location in the C ReactorSource-Check Equipment 0.08 $49.95 0.08 $1.38 $4.11 9 day $36.96 Based on 5 minutes per day of surveying
(see 4) to check background radiation levelsSafety Meeting 0.50 $49.95 $24.98 2 each $49.95 Based on the Hanford Site requirement
to have one safety meeting per weekD&D CHARACTERIZATION (WBS 331.17) Subtotal $1,524.25
Survey Walls with anEberline E-600 and HandRecord the Results
0.0053 $49.95 0.0054 $1.38 $0.27 5,600 squarefoot
$1,524.25 Based on 1 RCT averaging 3 hours ofactual surveying time per day
DEMOBILIZATION (WBS 331.21) Subtotal $78.53 Exit Frisk Equipment 0.17 $49.95 0.17 $1.38 $8.73 9 day $78.53 Equipment standby plus time for a RCT to
(see 4) survey the equipmentD&D DATA ASSEMBLY & DOCUMENTATION (WBS 331.17) Subtotal $899.10
Assemble a Report from theSurvey Results
2.00 $49.95 $99.90 9 day $899.10(see 4)
TOTAL: $2,625.75 (for 5,600 sf of wall)1) UC=UC X TQ2) The labor rate of $49.95/hr is based on the rate for an RCT and includes base wage, fringes, and area overhead, but excludes BHI G&A andoverhead.3) The equipment rate of $1.38/hr is based on an amortized hourly cost for an Eberline E-600 digital rate meter equipped with an Eberline SHP-380-ABlarge area probe.4) The total number of days is based upon 3.67 productive hours of surveying per day at a survey productivity rate of 187 sf/hour.5) The Hanford Site indirect expense rates for common support and materials are also omitted from this analysis. Overhead rates for each DOE sitevary in magnitude and in the way they are applied. Decision makers seeking site specific costs can apply their site’s rates to this analysis withouthaving to first back out the Hanford Site’s rate. Engineering, quality assurance, administrative costs and taxes on services and materials are alsoomitted from this analysis for the same reasons. The analysis assumes an 8-hour work day and a 40-hour work week.