INDONESIAN CENTER FOR AGRICULTURAL LAND … · indonesian center for agricultural land resources...
41
GREENHOUSE GAS EMISSION UNDER DIFFERENT CROP MANAGEMENT PRACTICES IN INDONESIA INDONESIAN CENTER FOR AGRICULTURAL LAND RESOURCES INDONESIAN CENTER FOR AGRICULTURAL LAND RESOURCES RESEARCH AND DEVELOPMENT (ICALRD)
-
Upload
truongquynh -
Category
Documents
-
view
229 -
download
0
Transcript of INDONESIAN CENTER FOR AGRICULTURAL LAND … · indonesian center for agricultural land resources...

GREENHOUSE GAS EMISSION UNDER DIFFERENT CROP MANAGEMENT PRACTICES
IN INDONESIA
INDONESIAN CENTER FOR AGRICULTURAL LAND RESOURCESINDONESIAN CENTER FOR AGRICULTURAL LAND RESOURCES RESEARCH AND DEVELOPMENT (ICALRD)

BackroundBackround
Ri i i t t f d f I d i• Rice is an important food source for Indonesia• To raise the national rice production is not only
by intensifying rice field but also expansion ofby intensifying rice field, but also expansion of rice cultivated area in marginal land
• Expansion to marginal lands peat land (21• Expansion to marginal lands peat land (21 mill ha)
• Expansion of peat land for rice agricultural• Expansion of peat land for rice agricultural purposes could enhanced greenhouse gas emission i.e. CH4, N2O and CO24, 2 2
• Indonesia has a committment to reduce 26% of GHG emission (voluntary) 9.5% of its should
f l dcome from peat land management

General Objective of GHG’s Studies onGeneral Objective of GHG s Studies on Rice Agriculture in Indonesia
• To obtain rice management practices on g ppeatland and mineral soil that increase yield with low GHG’s emissionyield with low GHG s emission

GHG emission studies on peatGHG emission studies on peat(2007‐ on going)
• 2008 AmeliorantLocation: Jakenan
• 2006 Rice cultivarsLocation: Jakenan1. Control2. Dolomite3 Ri t
Location: Jakenan1. Punggur2 Tenggulang 3. Rice straw
4. Animal manure
li
2. Tenggulang3. Banyuasin4. Batanghari
• 2009 AmeliorantsLocation: Jakenan and South Kalimantan
• 2007 AmeliorantLocation: Jakenan
1. Control2. Dolomit3. Rice straw
1. Control2. Dolomite3 Zeolite
4. Animal manure5. Si ‐Fertilizer
3. Zeolite4. Steel slag

Jakenan trial (peat was(peat was transported to Jakenan)Jakenan)

South Kalimantan trial (direct measurement on peatland)measurement on peatland)

Batanghari (2006), steel slag (2007), animal manure (2008, 2009)Banyuasin (2006), zeolite (2007), rice straw (2008), Si fertilizer (2009)Tenggulang (2006) dolomite (2007 2008 2009)Tenggulang (2006), dolomite (2007, 2008, 2009)Punggur (2006), Control (2007, 2008, 2009)
30
15
20
25
t CO
2e)
5
10
15
GW
P (t
0
200720072008
2009 (Jakenan)
2009 (Kalimantan)

GHG reduction, Yield, and Ratio (GWP/yield)GHG reduction, Yield, and Ratio (GWP/yield)
Jakenan South KalimantanTechnology
Reduction (%)
Yield(t/ha)
Ratio(t CO2e/t
yield)
Reduction (%)
Yield(t/ha)
Ratio(t CO2e/t
yield)yield) yield)
Control Baseline 4.5 5.2 Baseline 2.7 5.0Dolomite 27.3 4.8 3.6 26.0 2.8 3.5Z liZeolite 21.4 5.0 4.5 - - -
Steel slag 29.4 6.0 3.3 - - -Rice Straw -6.2 4.7 5.2 -0.1 2.7 5.0
Animal manure 28.7 5.1 3.0 16.5 2.7 4.2Si‐Fertilizer 6.2 4.8 3.6 18.5 3.5 3.1

Numbers of GHG’s sampling from peat soil originated from South Kalimantan
Before During After
g
GHGBefore
rice planting
During rice
planting
After rice
plantingCV (%)
*CO 96 480 480 32*CO2 96 480 480 32
**CH4 1040 5720 3380 20
*N2O 96 192 480 29
Total 1232 6392 4340 11964
* Gas samples were collected manually using 20 cm x 40 cm x 20 cm plexi‐glass chamber with 5 ml syringe
** Gas samples were collected using automatic gas sampling device. The chamber dimension for gas collection was 1 m x 1 m x 1 m

Recapitulation of GHG’s emission from peat GHG’sRecapitulation of GHG s emission from peat. GHG s concentration were based on 11,964 gas concentration data and they were conducted within 300 days of field
tmeasurement
Without ameliorant DolomiteZeolite Electric furnace slag
35000
40000
)
(21‐31 t CO2‐e/ha)
(8 18 t CO /h ) (17‐21 t CO2‐e/ha)
20000
25000
30000
CO
2-C
/ha) (8‐18 t CO2‐e/ha)
( 2 / )
10000
15000
20000
GW
P (k
g
0
5000
Before Planting (BP) During Planting (DP) After Planting (AP)Before Planting (BP) During Planting (DP) After Planting (AP)
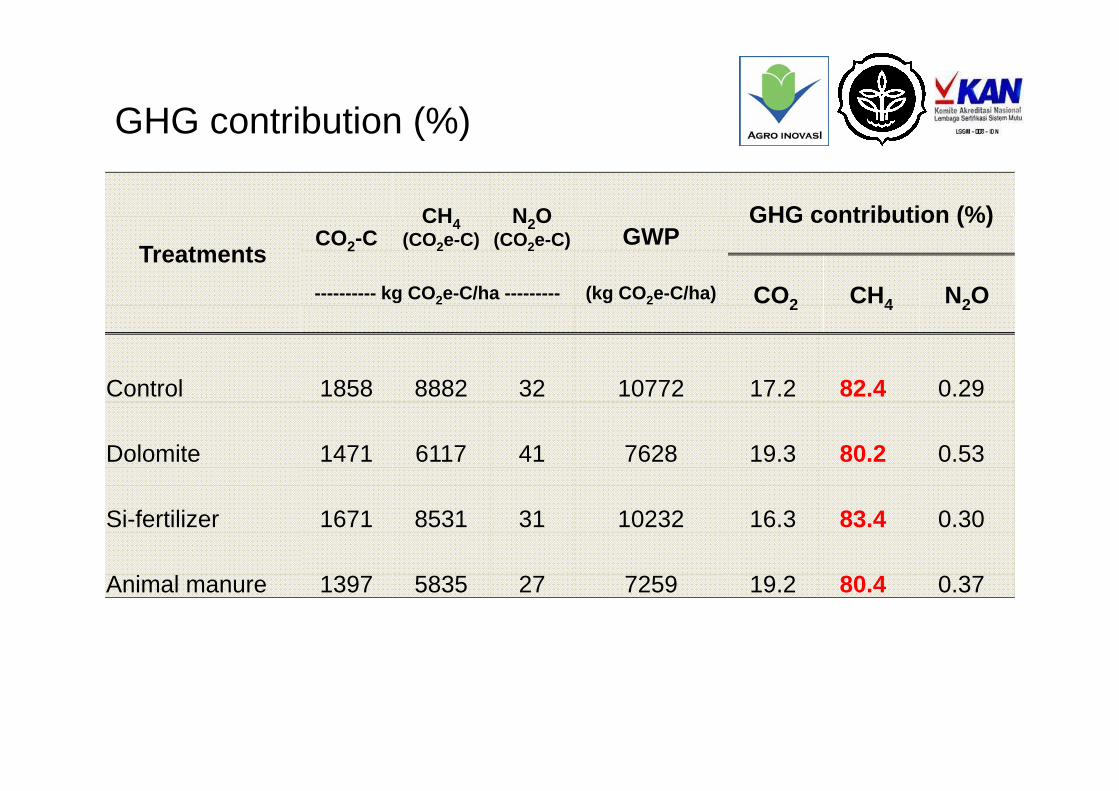
GHG contribution (%)
CH N O GHG contribution (%)
GHG contribution (%)
TreatmentsCO2-C
CH4(CO2e-C)
N2O(CO2e-C) GWP
GHG contribution (%)
---------- kg CO2e-C/ha --------- (kg CO2e-C/ha) CO2 CH4 N2O2 4 2
Control 1858 8882 32 10772 17.2 82.4 0.29Control 1858 8882 32 10772 17.2 82.4 0.29
Dolomite 1471 6117 41 7628 19.3 80.2 0.53
Si-fertilizer 1671 8531 31 10232 16.3 83.4 0.30
139 83 2 2 9 19 2 80 4 0 3Animal manure 1397 5835 27 7259 19.2 80.4 0.37

1000
1200
mg/
m2/
d
600
800
h ric
e pl
ant (
m
y = 0.38x + 547.4r = 0.380*, n = 36
200
400
CH
4 flu
x w
ith
Methane flux emitted from rice plant;
00 200 400 600 800 1000
CH4 flux without rice plant (mg/m2/d)
547.4/695.1 x 100% = 78.7% of CH4
hil
y = 0.38x + 147.70 380* 36700
800
900
(mg/
m2/
d
While;
= 21.3% of CH4r = 0.380*, n = 36
400
500
600
out r
ice
plan
t
From ebullition and dissolved in water
100
200
300
CH
4 flu
x w
itho
00 200 400 600 800 1000 1200
CH4 flux with rice plant (mg/m2/d)
C

Effect of crop management in Aeric Eutropept soil of
Soil Analysis Value
H (1 2 5)H2O 5.1 + 0.23p p
JakenanpH (1 : 2.5)
KCl 4.6 + 0.22
Texture (%)
Sand 42.3 + 3.01
Silt 48.2 + 3.42
Clay 9.5 + 3.26
Org C (%) 0.52 + 0.150
Org N (%) 0.03 + 0.007
C/N 15.9 + 4.44
Extract NH
Ca 3.55 + 1.803
Mg 0.21 + 0.208Extract NH4‐acetate 1 N pH 7 (me 100g‐1)
K 0.08 + 0.033
Na 0.26 + 0.046
Total 4.19 + 2.164
CEC (me 100g‐1) 4.59 + 2.071
BS (%) 85.3 + 10.39
Total S (ppm) 129.5 + 79.62(pp )
Dithionite Fe2O3 (%) 0.75 + 0.348
Oxalate Fe2O3 (%) 0.25 + 0.036

Rice Crop Management Systems
Technologies1.1.
p g y
g1. Conventional – CF : Control/farmers
practice: fertilization (120 kg N, 90 kg P and 60 kg K); no organic amendments; continously flooded, seedlings 21 25 days after sowing 2.seedlings 21‐25 days after sowing.
2. Conventional – Intermittent: The same as treatment no (1) but with ( )intermittent irrigation.
3. ICM – CF: young seedlings (15 days), 1 3.
seedling per hole, N fertilization based on Leaf Color Chart (LCC), 2 ton/ha animal manure seedlings establishanimal manure, seedlings establish with legowo 2:1.

4. ICM – Intermittent : Similar with no (3) b i h i i i i i(3) but with intermittent irrigation
5. SRI – Intermittent : 0 inorganic fertilizer, 15 t/ha animal manure, , / ,seedlings age 15 days, plant spacing at 30 cm x 30 cm with 1 seedling per hole intermittent irrigationhole, intermittent irrigation
6. SRI – Saturate : similar with no. 5 but with 1 cm flooding
7. Semi SRI – intermittent : Similar with no. 5, but if necessary add inorganic fertilizer intermittent irrigationfertilizer, intermittent irrigation
LCC
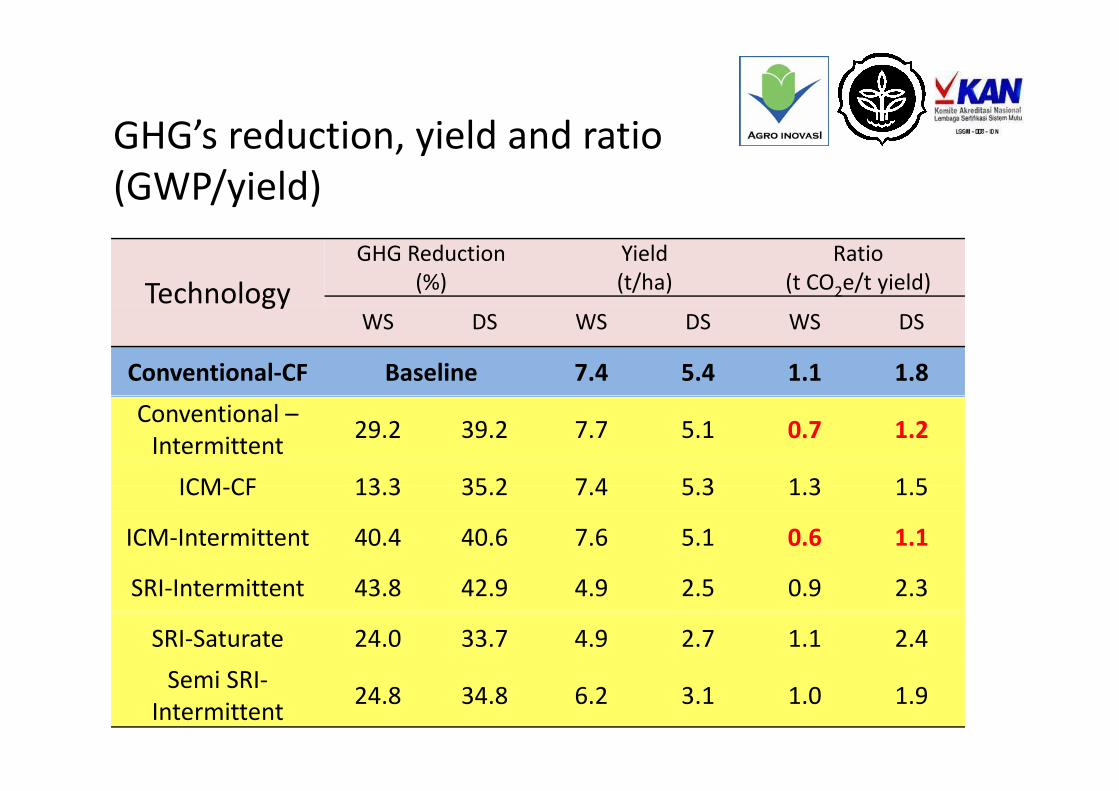
GHG’ d ti i ld d tiGHG’s reduction, yield and ratio (GWP/yield)
TechnologyGHG Reduction
(%)Yield (t/ha)
Ratio (t CO2e/t yield)gy
WS DS WS DS WS DS
Conventional‐CF Baseline 7.4 5.4 1.1 1.8Conventional –Intermittent 29.2 39.2 7.7 5.1 0.7 1.2
ICM CF 13 3 35 2 7 4 5 3 1 3 1 5ICM‐CF 13.3 35.2 7.4 5.3 1.3 1.5
ICM‐Intermittent 40.4 40.6 7.6 5.1 0.6 1.1
SRI‐Intermittent 43.8 42.9 4.9 2.5 0.9 2.3
SRI‐Saturate 24.0 33.7 4.9 2.7 1.1 2.4Semi SRI‐
Intermittent 24.8 34.8 6.2 3.1 1.0 1.9

Contribution (%) of every GHGContribution (%) of every GHG emitted from rice agriculture
TreatmentsGWP CO2‐C %
N2O(CO2e‐C) %
CH4(CO2e‐C) %
(kg CO2‐C/ha) (kg/ha) (kg/ha) (kg/ha)
Conventional‐CF 5681 957 16.9 5.5 0.1 4718 83.1C ti lConventional –Intermittent
4078 984 24.1 17.1 0.4 3076 75.4
ICM‐CF 4008 870 21 7 15 7 0 4 3122 77 9ICM‐CF 4008 870 21.7 15.7 0.4 3122 77.9
ICM‐Intermittent 3366 1138 33.8 16.4 0.5 2211 65.7
SRI‐Intermittent 4836 1046 21.6 11.3 0.2 3778 78.1
SRI‐Saturate 3579 733 20 5 12 2 0 3 2833 79 2SRI‐Saturate 3579 733 20.5 12.2 0.3 2833 79.2

Approaches to Estimate CH4 Emission from d ld
Approaches to Estimate CH4 Emission from d ldLimited CH4 Measurements in Rice FieldLimited CH4 Measurements in Rice Field
a. What is the best time to take CH4 gas samples?
b. Are three sampling days in one season reliable to determine the seasonal CH4 emission?
c. Is there any relationship between automatic and y pmanual sampling of CH4 gas?
d. How much CH4 gas concentration reduction in ad. How much CH4 gas concentration reduction in a syringe after several days of storage?

DeterminationDetermination ofof thethe bestbest samplingsamplingtimetime inin aa dayday forfor CHCH44 gasgas samplingsamplingtimetime inin aa dayday forfor CHCH44 gasgas samplingsampling

Bihourly CH4 flux pattern at different
25 00Fase Anakan Aktif (11 HST)
growth stage
10,00
15,00
20,00
25,00
CH
4/m
2/ja
m)
0,00
5,00
7 10 12 14 16 18 20 22 24 2 4 6Fl
uks
(mg
Waktu Pengamatan (jam)
Fase Berbunga (63 HST) 25.00
m)
Waktu Pengamatan (jam)
Fase Pengisian Malai (77 HST)
0 50
0.60
m
10.00
15.00
20.00
mg
CH
4/m
2/ja
m
0 20
0.30
0.40
0.50
(mg
CH
4/m
2/ja
m
0.00
5.00
8 10 12 14 16 18 20 22 24 2 4 6
Fluk
s (m
0.00
0.10
0.20
10 12 14 16 18 20 22 0 2 4
Fluk
s (
Waktu pengamatan (jam) Waktu pengamatan (jam)
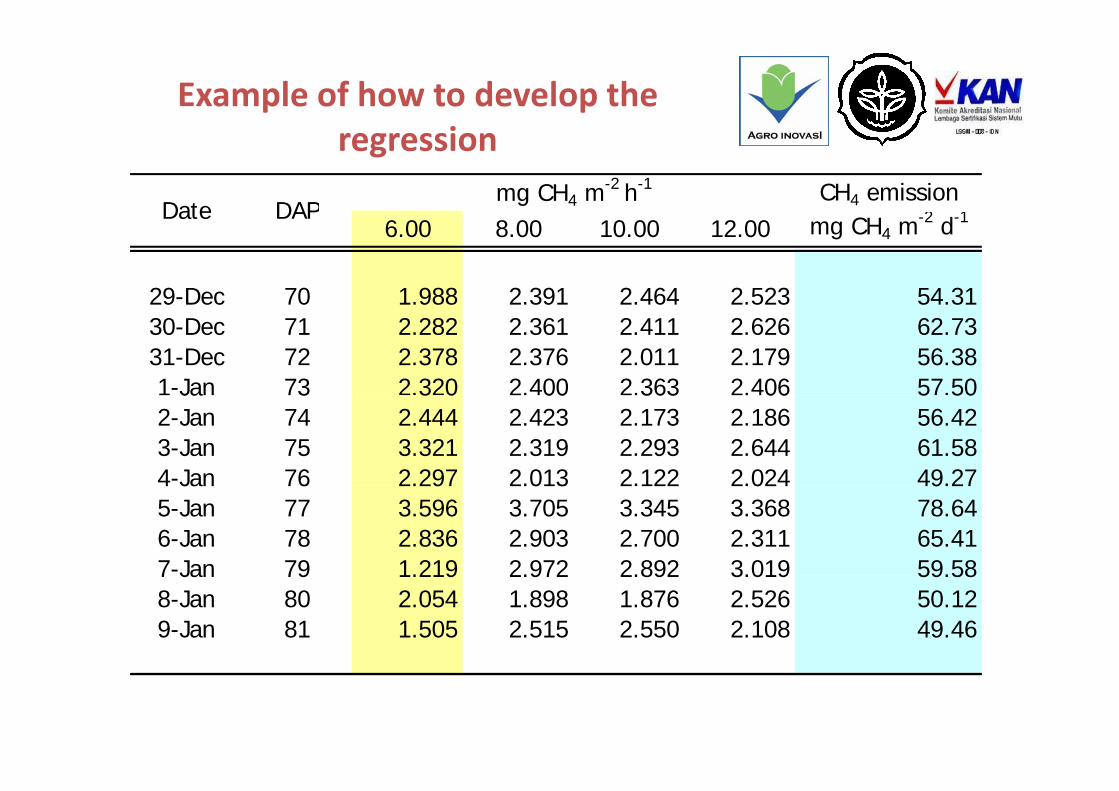
Example of how to develop the i
CH4 emission2 d 1
mg CH4 m-2 h-1
Date DAPCH4 emission
2 d 1mg CH4 m
-2 h-1
Date DAP
regression
6.00 8.00 10.00 12.00 mg CH4 m-2 d-1
29-Dec 70 1.988 2.391 2.464 2.523 54.31
Date DAP6.00 8.00 10.00 12.00 mg CH4 m-2 d-1
29-Dec 70 1.988 2.391 2.464 2.523 54.31
Date DAP
30-Dec 71 2.282 2.361 2.411 2.626 62.7331-Dec 72 2.378 2.376 2.011 2.179 56.381-Jan 73 2.320 2.400 2.363 2.406 57.50
30-Dec 71 2.282 2.361 2.411 2.626 62.7331-Dec 72 2.378 2.376 2.011 2.179 56.381-Jan 73 2.320 2.400 2.363 2.406 57.50Ja 3 3 0 00 363 06 5 502-Jan 74 2.444 2.423 2.173 2.186 56.423-Jan 75 3.321 2.319 2.293 2.644 61.584-Jan 76 2.297 2.013 2.122 2.024 49.27
Ja 3 3 0 00 363 06 5 502-Jan 74 2.444 2.423 2.173 2.186 56.423-Jan 75 3.321 2.319 2.293 2.644 61.584-Jan 76 2.297 2.013 2.122 2.024 49.274 Jan 76 2.297 2.013 2.122 2.024 49.275-Jan 77 3.596 3.705 3.345 3.368 78.646-Jan 78 2.836 2.903 2.700 2.311 65.417-Jan 79 1.219 2.972 2.892 3.019 59.58
4 Jan 76 2.297 2.013 2.122 2.024 49.275-Jan 77 3.596 3.705 3.345 3.368 78.646-Jan 78 2.836 2.903 2.700 2.311 65.417-Jan 79 1.219 2.972 2.892 3.019 59.587 Jan 79 1.219 2.972 2.892 3.019 59.588-Jan 80 2.054 1.898 1.876 2.526 50.129-Jan 81 1.505 2.515 2.550 2.108 49.46
7 Jan 79 1.219 2.972 2.892 3.019 59.588-Jan 80 2.054 1.898 1.876 2.526 50.129-Jan 81 1.505 2.515 2.550 2.108 49.46

06.00 am
y = 24 234x140.0
06.00 am
y = 24 234x140.0Relationship y = 24.234x
R = 0.8928**
80.0
100.0
120.0
g C
H4m
-2d-1
)
y = 24.234xR = 0.8928**
80.0
100.0
120.0
g C
H4m
-2d-1
)Relationship between hourly and daily flux to
20.0
40.0
60.0
daily
flux
(mg
20.0
40.0
60.0
daily
flux
(mgy
determine the best sampling hour to
0.00 1 2 3 4 5 6
hourly flux (mg CH4m-2h-1)
0.00 1 2 3 4 5 6
hourly flux (mg CH4m-2h-1)
estimate daily CH4flux
08.00 am
y = 22.714x150.0
08.00 am
y = 22.714x150.0 y 22.714xR = 0.9196**
90.0
110.0
130.0
g C
H4m
-2d-1
)
y 22.714xR = 0.9196**
90.0
110.0
130.0
g C
H4m
-2d-1
)
10.0
30.0
50.0
70.0
daily
flux
(mg
10.0
30.0
50.0
70.0
daily
flux
(mg
-10.0-1 0 1 2 3 4 5 6
hourly flux (mg CH4m-2h-1)
-10.0-1 0 1 2 3 4 5 6
hourly flux (mg CH4m-2h-1)
** significant at 1% level

Sampling E i Number of 2 Correlation
IR 64 rice variety at different sampling time
Sampling Time
Equation Number of samples (n)
r2 Correlation coefficient [r]
06.00 am Y = 24.348X 28 0.8717 0.934**
08.00 am Y = 24.725X 33 0.743 0.862**
10.00 am Y = 18.802X 26 0.4384 0.662*
12.00 pm Y = 19.43X 24 0.7443 0.863**
Sampling Equation Number of r2 Correlation ff
Memberamo rice variety at different sampling time
p gTime
Equationsamples (n)
r coefficient [r]
06.00 am Y = 24.234X 30 0.7972 0.893**
08.00 am Y = 24.714X 34 0.8457 0.920**
10.00 am Y = 19.235X 27 0.707 0.841**
12.00 pm Y = 19.687X 23 0.6736 0.821**

Correlation
Way Apo Buru rice variety at different sampling time
Sampling Time
Equation Number of samples (n)
r2Correlation coefficient
[r]
06.00 am Y = 24.602X 31 0.7558 0.869**
08.00 am Y = 20.447X 34 0.732 0.856**
10.00 am Y = 19.11X 25 0.7656 0.875**
12.00 pm Y = 18.403X 22 0.6425 0.802**

Time conversion for CH4manual sampling
30 0
manual sampling
20 0
25.0
30.0
sion
10 0
15.0
20.0
y convers
y = ‐0.6994x + 29.862
0 0
5.0
10.0
hour dail
0.0
0 2 4 6 8 10 12 14 16 18
24
Time (h)Time (h)

Table for time conversion
6.00 25.67 7.00 24.97 8.00 24.276.01 25.66 7.01 24.96 8.01 24.266.02 25.65 7.02 24.95 8.02 24.25
08.0006.00 07.00
6.03 25.65 7.03 24.95 8.03 24.256.04 25.64 7.04 24.94 8.04 24.246.05 25.63 7.05 24.93 8.05 24.236.06 25.62 7.06 24.93 8.06 24.236.07 25.62 7.07 24.92 8.07 24.226.08 25.61 7.08 24.91 8.08 24.216.09 25.60 7.09 24.90 8.09 24.216.10 25.60 7.10 24.90 8.10 24.206.11 25.59 7.11 24.89 8.11 24.196.12 25.58 7.12 24.88 8.12 24.186.13 25.58 7.13 24.88 8.13 24.186.14 25.57 7.14 24.87 8.14 24.176.15 25.56 7.15 24.86 8.15 24.166.16 25.55 7.16 24.86 8.16 24.166.17 25.55 7.17 24.85 8.17 24.156.18 25.54 7.18 24.84 8.18 24.146.19 25.53 7.19 24.83 8.19 24.146.20 25.53 7.20 24.83 8.20 24.136.21 25.52 7.21 24.82 8.21 24.126.22 25.51 7.22 24.81 8.22 24.116 5 5 8 86.23 25.51 7.23 24.81 8.23 24.116.24 25.50 7.24 24.80 8.24 24.106.25 25.49 7.25 24.79 8.25 24.09

Relationship between Manual and pAutomatic CH4 gas sampling

Relationship between manual Relationship between manual operated chamber operated chamber and and
automatic automatic CH4 CH4 gas samplinggas samplingsystemsystem

Relationship between manual and automatic gas sampling duringautomatic gas sampling during
Number of samples (n) = 36p ( )
y = 0.7979x7.0
2 h-1
)
yR2 = 0.5974**
5.0
6.0
plin
g (m
g m-2
3.0
4.0
CH 4
gas
sam
p
1.0
2.0
Aut
omat
ic C
0.00.0 1.0 2.0 3.0 4.0 5.0 6.0 7.0 8.0 9.0
Manual CH4 gas sampling (mg m-2 h-1)
A
Manual CH4 gas sampling (mg m h )

How much CH4 gas concentrationHow much CH4 gas concentration reduction in a syringe after several d f ??days of storage??

Determination of CHDetermination of CH44 gas concentration reduction inside a 5 gas concentration reduction inside a 5 ml plastic syringe (methods)ml plastic syringe (methods)
0 days1, 2, 3, 4 days
ml plastic syringe (methods)ml plastic syringe (methods)
10.1 10.1
IntegratorIntegrator
Shimadzu GC-6Appm ppm CHCH44 Each day consist 5 syringeEach day consist 5 syringe
Syringe 0 vs 1 0 vs 2 0 vs 3 0 vs 4
1
2
3
4
5

Regression to determine CH4Regression to determine CH4reduction in a 10 ml syringe
18500
19000
19500
17500
18000
18500
nding
y = ‐16,789x + 18668R² = 0 67**
16500
17000
Rean
R² = 0,67**
15500
16000
0 20 40 60 80 100 1200 20 40 60 80 100 120
time (h)

Correction factor to obtain accurate Correction factor to obtain accurate CH4 flux results CH4 flux results
time ofstorage Reading % change correction
f t
time of storage Reading % change correction
f tg(h)
g g factor g(h)
g g factor
1 18651 0,09 1,0009 25 18248 2,25 1,02252 18634 0 18 1 0018 26 18231 2 34 1 02342 18634 0,18 1,0018 26 18231 2,34 1,02343 18618 0,27 1,0027 27 18215 2,43 1,02434 18601 0,36 1,0036 28 18198 2,52 1,02525 18584 0 45 1 0045 29 18181 2 61 1 02615 18584 0,45 1,0045 29 18181 2,61 1,02616 18567 0,54 1,0054 30 18164 2,70 1,02707 18550 0,63 1,0063 31 18148 2,79 1,02798 18534 0 72 1 0072 32 18131 2 88 1 02888 18534 0,72 1,0072 32 18131 2,88 1,02889 18517 0,81 1,0081 33 18114 2,97 1,029710 18500 0,90 1,0090 34 18097 3,06 1,0306

Are three sampling days (with the intervalAre three sampling days (with the interval of one month) reliable to determine seasonal CH emission??seasonal CH4 emission??

Gas samples taken at 35, 65 and 95 DAP
y = 1 0977x9000.0
2 ) y = 1.0977xR = 0.936**
5000 0
6000.0
7000.0
8000.0
ux (m
g C
H 4m
-2
Relationship betweensingle day flux x 30 2000.0
3000.0
4000.0
5000.0
of 3
0 da
ily fl
u
days of sampling, and the sum of 30 daily fl
0.0
1000.0
0.0 1000.0 2000.0 3000.0 4000.0 5000.0 6000.0 7000.0 8000.0
daily flux x 30-day (mg CH4m-2)
sum
gas samples taken at 38 68 and 98 DAPflux gas samples taken at 38, 68 and 98 DAP
y = 1.0684xR = 0.849**
8000.0
9000.0
H 4 m
-2)
4000.0
5000.0
6000.0
7000.0
ily fl
ux (m
g C
H
1000.0
2000.0
3000.0
sum
of 3
0 da
i
0.00.0 1000.0 2000.0 3000.0 4000.0 5000.0 6000.0 7000.0 8000.0 9000.0
daily flux x 30-day (mg CH4m-2)

Gas samples withdrawn at 3 different days after riceGas samples withdrawn at 3 different days after rice planting (wet season of 2001/02)
Gas Sampling at Number of CorrelationGas Sampling at Number of Correlation(DAP) samples (n) coefficient [r]
38 68 98 Y 0 8957X 12 0 977**
Equation
38, 68, 98 Y = 0.8957X 12 0.977**
35, 67, 95 Y = 0.8765X 12 0.927**
35, 65, 95 Y = 0.9424X 12 0.914**
32 62 92 Y 0 8179X 12 0 904**32, 62, 92 Y = 0.8179X 12 0.904**
43, 75, 107 Y = 0.8017X 12 0.915**
28, 58, 88 Y = 0.6932X 12 0.758*
* significant at 5% level** significant at 1% level

Gas samples withdrawn from 3 different days after planting (wet season of 2002/03)
Gas Sampling at Number of CorrelationE tiGas Sampling at Number of Correlation(DAP) samples (n) coefficient [r]
35, 65, 95 Y = 1.098X 12 0.936**
Equation
35, 65, 95 Y 1.098X 12 0.936
35, 67, 95 Y = 0.9912X 12 0.890**
38, 68, 98 Y = 1.068X 12 0.848**
32, 62, 92 Y = 0.8679X 12 0.802**, ,
43, 75, 107 Y = 0.830X 12 0.716*
28, 58, 88 Y = 0.9908X 12 0.530
* significant at 5% level** significant at 1% level
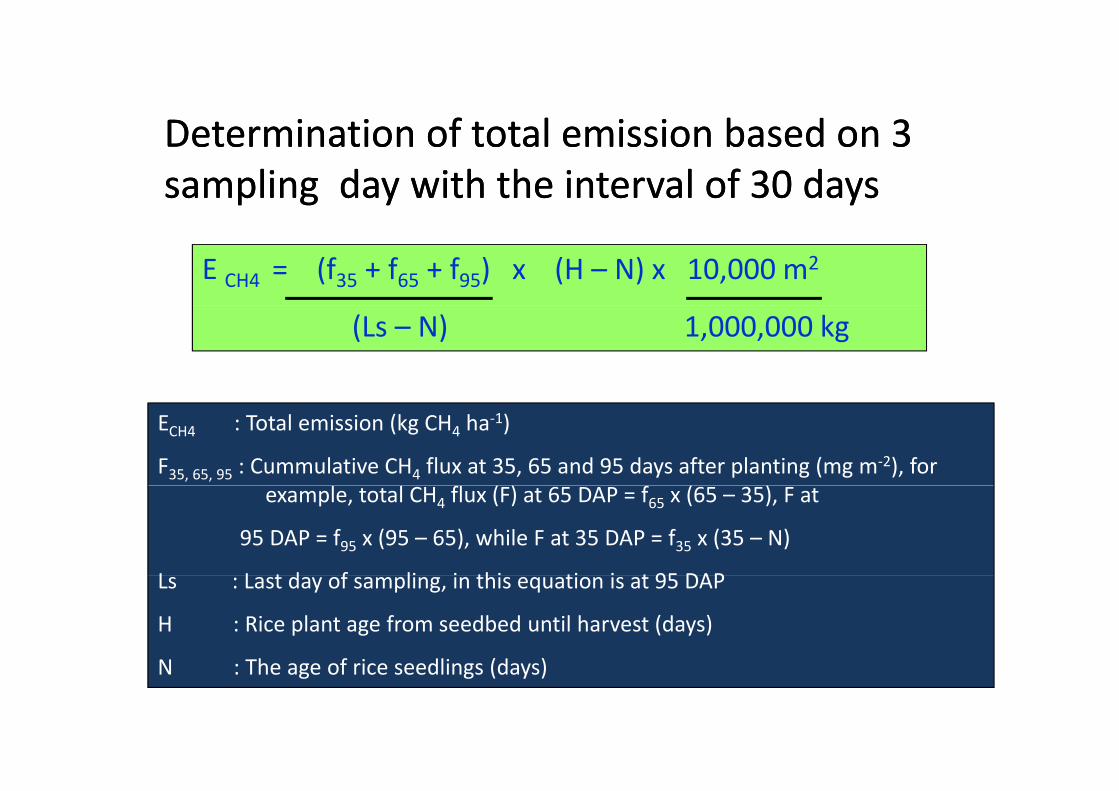
D t i tiD t i ti f t t l i i b d 3f t t l i i b d 3Determination Determination of total emission based on 3 of total emission based on 3 sampling sampling day with the interval of 30 daysday with the interval of 30 days
E CH4 = (f35 + f65 + f95) x (H – N) x 10,000 m2
(Ls – N) 1,000,000 kg
ECH4 : Total emission (kg CH4 ha‐1)
F35, 65, 95 : Cummulative CH4 flux at 35, 65 and 95 days after planting (mg m‐2), forexample, total CH4 flux (F) at 65 DAP = f65 x (65 – 35), F at
95 DAP = f95 x (95 – 65), while F at 35 DAP = f35 x (35 – N)
L L t d f li i thi ti i t 95 DAPLs : Last day of sampling, in this equation is at 95 DAP
H : Rice plant age from seedbed until harvest (days)
N : The age of rice seedlings (days)N : The age of rice seedlings (days)
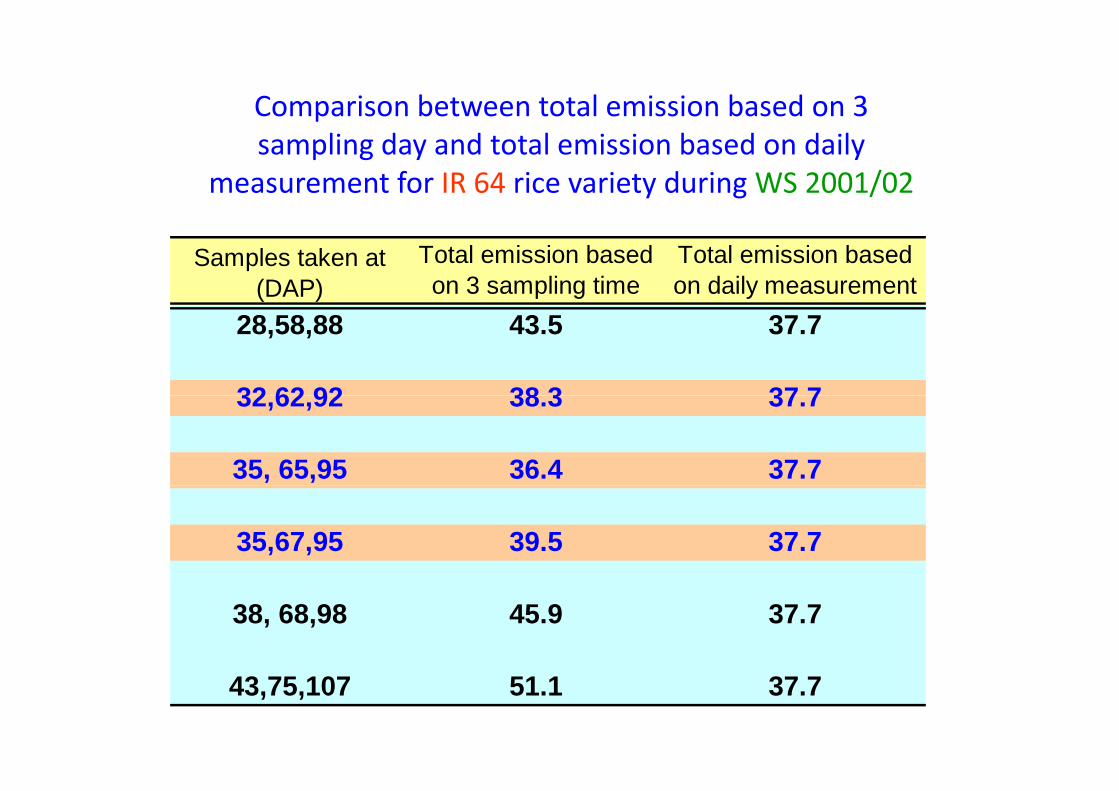
Comparison between total emission based on 3 sampling day and total emission based on daily
measurement for IR 64 rice variety during WS 2001/02
Total emission based on 3 sampling time
Total emission based on daily measurement
Samples taken at (DAP)
43.5 37.7
38 3 37 7
28,58,88
32 62 92 38.3 37.7
36.4 37.735, 65,95
32,62,92
39.5 37.735,67,95
45.9 37.738, 68,98
51.1 37.743,75,107

Comparison between total emission based on 3 sampling day and total emission based on daily measurement forday and total emission based on daily measurement for
IR 64 rice variety during WS 2002/03
Total emission based on 3 sampling time
Total emission based on daily measurement
151 5 17628 58 88
Samples taken at (DAP)
151.5 176
191.0 176
28, 58, 88
32, 62, 92
161.0 17635, 65, 95
, ,
175.4 17635, 67, 95
166.5 17638, 68, 98
167.5 17643, 75, 107

THANK YOU
INDONESIA AGRICULTURAL ENVIRONMENT RESEARCH INSTITUTE