
INDONESIA: TOWARD NEW GROWTH MODEL MEDIUM AND … AMRO - prijambodo - BAPPENAS... · indonesia:...
30
INDONESIA: TOWARD NEW GROWTH MODEL MEDIUM AND LONG-TERM PLAN Joint Asian Regional Roundtable OECD Development Centre-AMRO Singapore, 26 September 2012 BAMBANG PRIJAMBODO Assistant of Minister for Economy and Development Financing Affairs Ministry of National Development Planning/Bappenas
-
Upload
truongthuy -
Category
Documents
-
view
214 -
download
0
Transcript of INDONESIA: TOWARD NEW GROWTH MODEL MEDIUM AND … AMRO - prijambodo - BAPPENAS... · indonesia:...

INDONESIA: TOWARD NEW GROWTH MODEL
MEDIUM AND LONG-TERM PLAN
Joint Asian Regional Roundtable
OECD Development Centre-AMRO
Singapore, 26 September 2012
BAMBANG PRIJAMBODO
Assistant of Minister for Economy and Development Financing Affairs
Ministry of National Development Planning/Bappenas
OUTLINE
• MEDIUM TERM DEV. PLAN AND AN EXAMPLE OF DERIVATION
OF THE PLAN TO ANNUAL PLAN
• CURRENT ECONOMIC PROGESS
– Key elements in facing global financial crisis and recession in
2008/09 and global risks in 2011/2012 (see related tables on
the last pages)
• NEW GROWTH MODEL
– Key drivers, factors, and policies
– Target and estimate until 2016
• LESSONS LEARNED
2
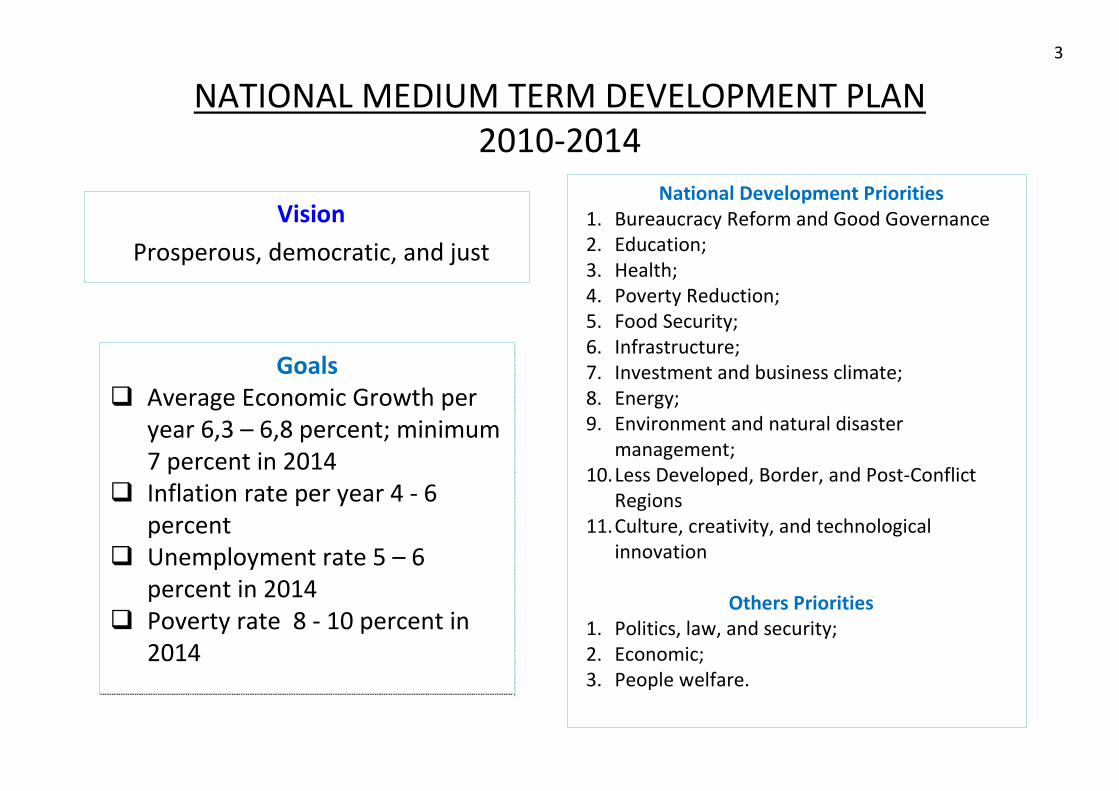
NATIONAL MEDIUM TERM DEVELOPMENT PLAN
2010-2014
National Development Priorities
1. Bureaucracy Reform and Good Governance
2. Education;
3. Health;
4. Poverty Reduction;
5. Food Security;
6. Infrastructure;
7. Investment and business climate;
8. Energy;
9. Environment and natural disaster
management;
10.Less Developed, Border, and Post-Conflict
Regions
11.Culture, creativity, and technological
innovation
Others Priorities
1. Politics, law, and security;
2. Economic;
3. People welfare.
Goals
� Average Economic Growth per
year 6,3 – 6,8 percent; minimum
7 percent in 2014
� Inflation rate per year 4 - 6
percent
� Unemployment rate 5 – 6
percent in 2014
� Poverty rate 8 - 10 percent in
2014
Goals
� Average Economic Growth per
year 6,3 – 6,8 percent; minimum
7 percent in 2014
� Inflation rate per year 4 - 6
percent
� Unemployment rate 5 – 6
percent in 2014
� Poverty rate 8 - 10 percent in
2014
3
Vision
Prosperous, democratic, and just
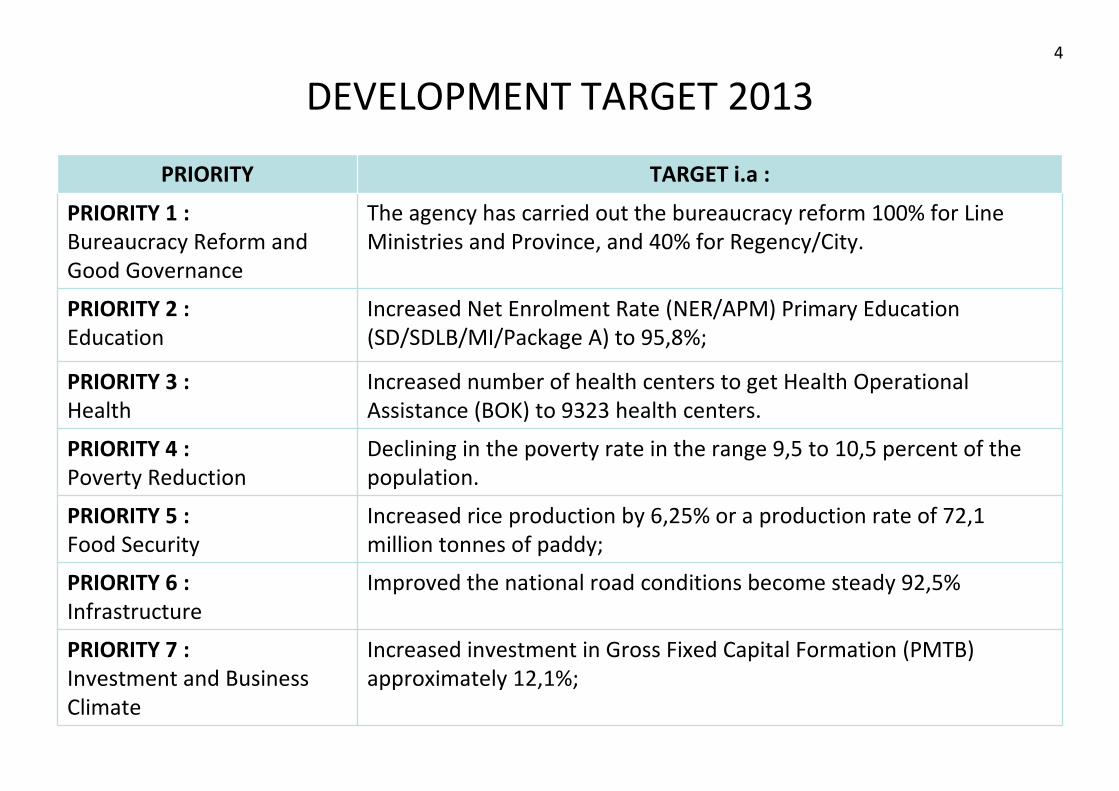
DEVELOPMENT TARGET 2013
PRIORITY TARGET i.a :
PRIORITY 1 :
Bureaucracy Reform and
Good Governance
The agency has carried out the bureaucracy reform 100% for Line
Ministries and Province, and 40% for Regency/City.
PRIORITY 2 :
Education
Increased Net Enrolment Rate (NER/APM) Primary Education
(SD/SDLB/MI/Package A) to 95,8%;
PRIORITY 3 :
Health
Increased number of health centers to get Health Operational
Assistance (BOK) to 9323 health centers.
PRIORITY 4 :
Poverty Reduction
Declining in the poverty rate in the range 9,5 to 10,5 percent of the
population.
PRIORITY 5 :
Food Security
Increased rice production by 6,25% or a production rate of 72,1
million tonnes of paddy;
PRIORITY 6 :
Infrastructure
Improved the national road conditions become steady 92,5%
PRIORITY 7 :
Investment and Business
Climate
Increased investment in Gross Fixed Capital Formation (PMTB)
approximately 12,1%;
4
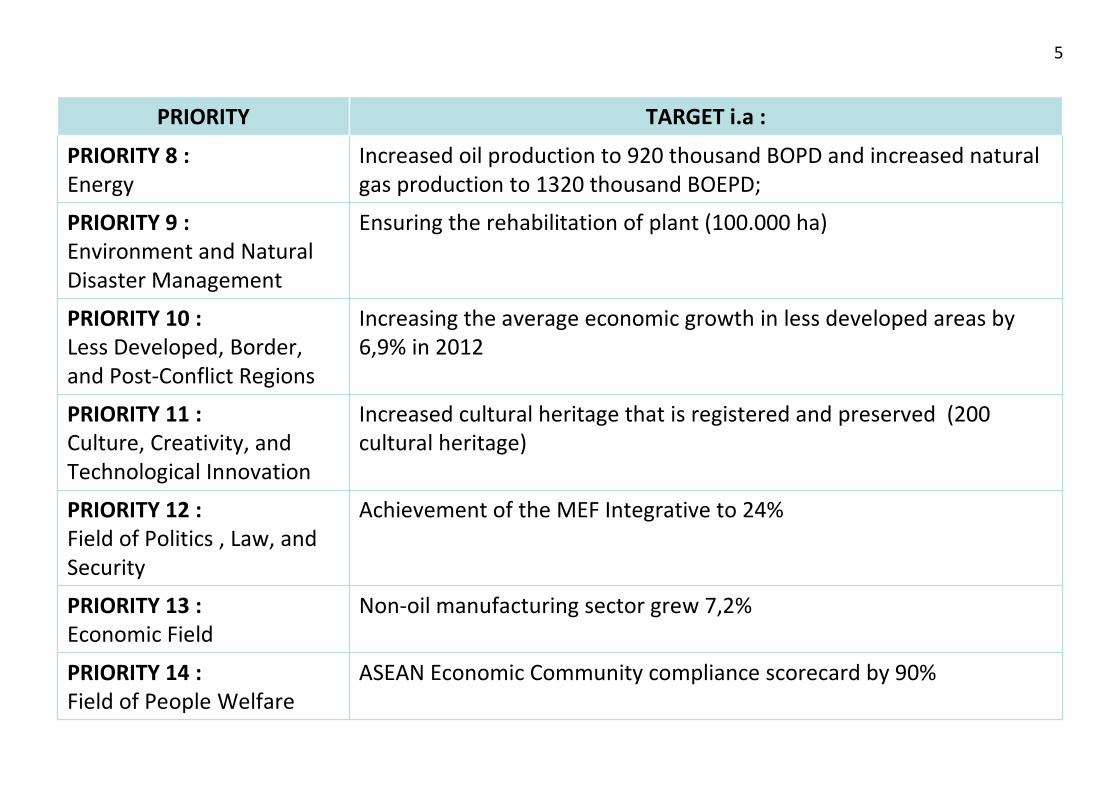
PRIORITY TARGET i.a :
PRIORITY 8 :
Energy
Increased oil production to 920 thousand BOPD and increased natural
gas production to 1320 thousand BOEPD;
PRIORITY 9 :
Environment and Natural
Disaster Management
Ensuring the rehabilitation of plant (100.000 ha)
PRIORITY 10 :
Less Developed, Border,
and Post-Conflict Regions
Increasing the average economic growth in less developed areas by
6,9% in 2012
PRIORITY 11 :
Culture, Creativity, and
Technological Innovation
Increased cultural heritage that is registered and preserved (200
cultural heritage)
PRIORITY 12 :
Field of Politics , Law, and
Security
Achievement of the MEF Integrative to 24%
PRIORITY 13 :
Economic Field
Non-oil manufacturing sector grew 7,2%
PRIORITY 14 :
Field of People Welfare
ASEAN Economic Community compliance scorecard by 90%
5
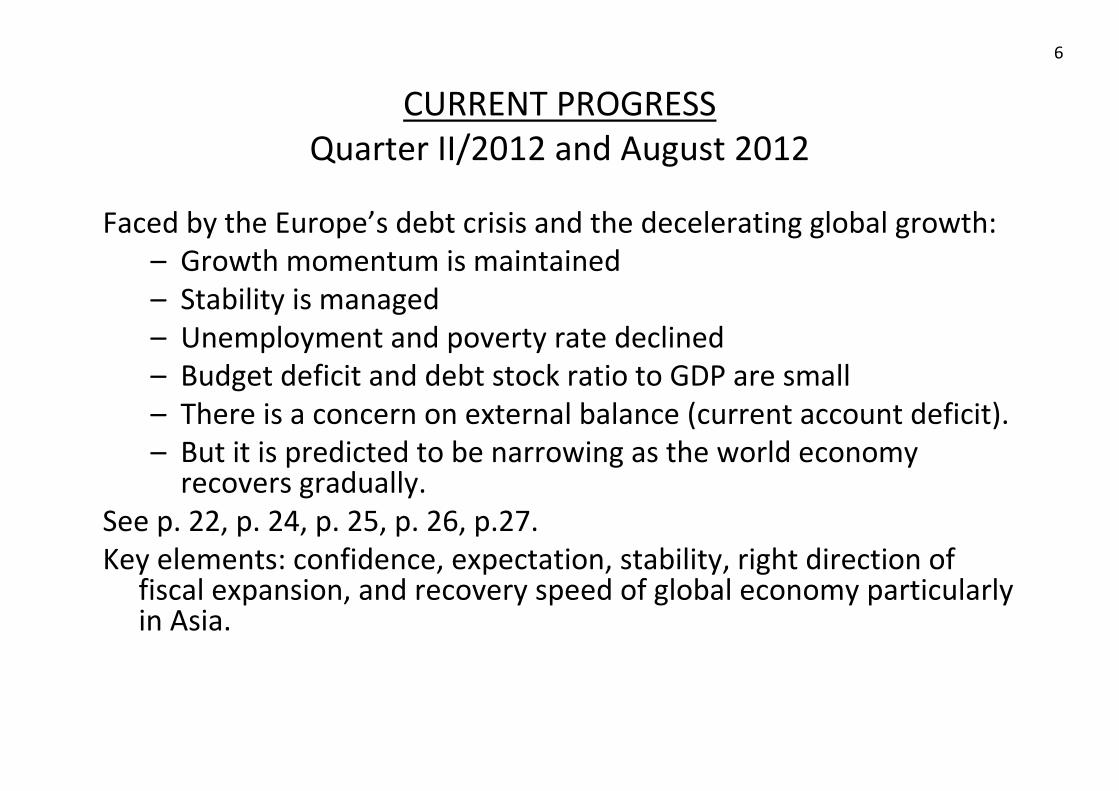
CURRENT PROGRESS
Quarter II/2012 and August 2012
Faced by the Europe’s debt crisis and the decelerating global growth:
– Growth momentum is maintained
– Stability is managed
– Unemployment and poverty rate declined
– Budget deficit and debt stock ratio to GDP are small
– There is a concern on external balance (current account deficit).
– But it is predicted to be narrowing as the world economy recovers gradually.
See p. 22, p. 24, p. 25, p. 26, p.27.
Key elements: confidence, expectation, stability, right direction of fiscal expansion, and recovery speed of global economy particularly in Asia.
6
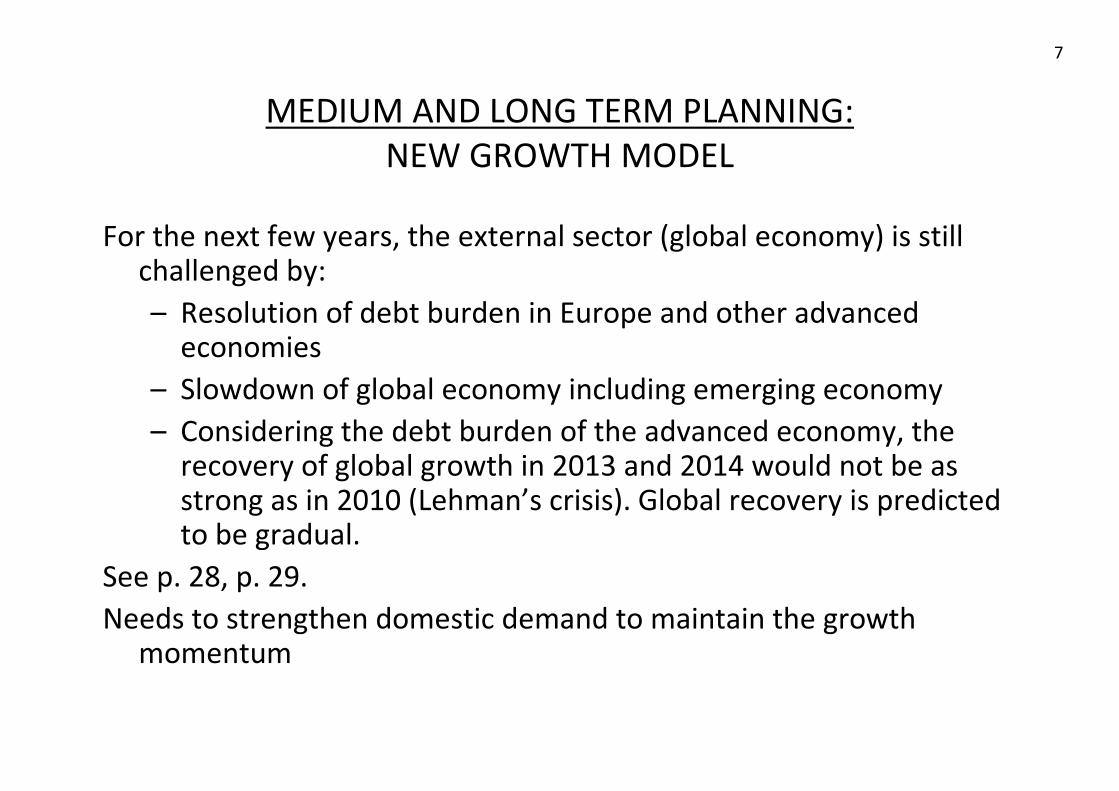
MEDIUM AND LONG TERM PLANNING:
NEW GROWTH MODEL
For the next few years, the external sector (global economy) is still challenged by:
– Resolution of debt burden in Europe and other advanced economies
– Slowdown of global economy including emerging economy
– Considering the debt burden of the advanced economy, the recovery of global growth in 2013 and 2014 would not be as strong as in 2010 (Lehman’s crisis). Global recovery is predicted to be gradual.
See p. 28, p. 29.
Needs to strengthen domestic demand to maintain the growth momentum
7

KEY DRIVER, FACTORS, AND POLICY
MEDIUM AND LONG-TERM GROWTH
NEW GROWTH MODEL OF INDONESIA’S ECONOMY
– Increased expectation to Asian Region particularly ASEAN+3 (see p. 25)
– Robust economic progress and strong resilience from global shock (see current progress)
– Strong fiscal condition and improved spending policy
– Productive population (demographic bonus)
– Coming of age of middle class
– Rich natural resources
– Investment and infrastructure development
– Human investment and education challenges
– Technology development
– Strengthening industrialization process (through Master Plan Acceleration and Expansion of Indonesia Economic Development)
• Compare with the pattern of growth in 1970 – 1997 (see p. 23).
• Room to raise total factor productivity is still available [TFP 2000 – 2007 was around 1.7 percentage point (Pierre Van Der Eng, 2009)].
8

FISCAL SPACE AND SPENDING POLICYBudget deficit is relatively small & spending could be sharpened for productive expenditures
THE NATIONAL BUDGET, 2004 - 2013(Rp Trillion)
2013201220112010200920082007200620052004DescriptionRAPBNAPBN-P1507.71358.21210.6995.3848.8981.6707.8638.0495.2403.4REVENUES AND GRANTS1503.31357.41205.4992.2847.1979.3706.1636.2493.9403.1RevenuesI.1178.91016.2873.9723.3619.9658.7491.0409.2347.0280.6Tax Revenues1.
324.3341.1331.5268.9227.2320.6215.1227.0146.9122.5Non Tax Revenues2.4.50.85.33.01.72.31.71.81.30.3GrantsII.
1657.91548.31295.01042.1937.4985.7757.6667.1509.6427.2EXPENDITURE1139.01069.5883.7697.4628.8693.4504.6440.0361.2297.5Central Government ExpenditureI.
241.1212.3175.7148.1127.7112.890.473.354.352.7Personnel1.159.2186.6124.697.680.756.054.547.229.215.5Goods and Services2.193.8168.7117.980.375.972.864.355.032.961.5Capital3.
2.12.01.61.21.41.51.61.61.22.7% of GDP113.2117.893.388.493.888.479.879.165.262.5Interest Payment4.316.1245.1295.4192.7138.1275.3150.2107.4120.891.5Subsidies5.274.7202.4255.6140.094.6223.0116.994.6104.469.0Energya.
41.442.739.752.843.552.333.312.816.322.5Non Energyb.518.9478.8411.3344.7308.6292.4253.3226.2150.5129.7Regional ExpenditureII.435.3408.4347.2316.7287.3278.7244.0222.1143.2122.9Balancing Funds1.
83.670.464.128.021.313.79.34.07.26.9Fund for Special Authonomy2.-36.9-72.38.941.55.284.330.049.950.838.7PRIMARY BALANCE
-150.2-190.1-84.4-46.9-88.6-4.1-49.8-29.1-14.4-23.8SURPLUS / DEFICIT -1.6-2.3-1.1-0.7-1.6-0.1-1.3-0.9-0.5-1.0% of GDP
150.2190.1130.991.6112.684.142.529.411.120.8NET FINANCING169.6194.5148.796.1128.1102.569.056.021.448.9Domestic FinancingI.-19.5-4.4-17.8-4.6-15.5-18.4-26.6-26.6-10.3-28.1Foreign FinancingII.
Source: MoF
9

PRODUCTIVE POPULATIONMore than 30 years span whereby dependency ratio reach the minimum
Source: Nat. Statistics Agency
Demographic Bonus
10

THE COMING OF AGE OF INDONESIA’S MIDDLE CLASSAn estimated 90 million Indonesians could join the consuming class by 2030
11

RICH NATURAL RESOURCESMost of them are still intact to be processed into higher VA products
Natural Gas Thermal Coal Geothermal Palm Oil Cocoa Tin Nickel Bauxite
Key Metrics
±±±± 165 TCF of
reserves at
production
rate ± 3 TCF
pa
World
second
largest
exporter
Home of
40% of
world’s
resources
(the largest
in the world)
World’s
largest
exporter;
>19 mil tons
per year
At 770 thou
tons/year,
world’s 2nd
largest
producer
At 65 thou
tons/year,
world’s 2nd
largest
producer
Own ± 12%
of world’s
reserves (4th
largest)
World’s 7th
largest
reserves;
world’s 4th
largest
production
About 40% is assumed feasible. Up to now, 1.200 MW has been
developed.
Will be at least partially processed
domestically by 2013 (new mining law:
4/2009)
• Abundant resources for gas-based energy and petrochemical industries
• Not including Non-Conventional Gases, from Coal Bed Methane and Coal Gassification
12
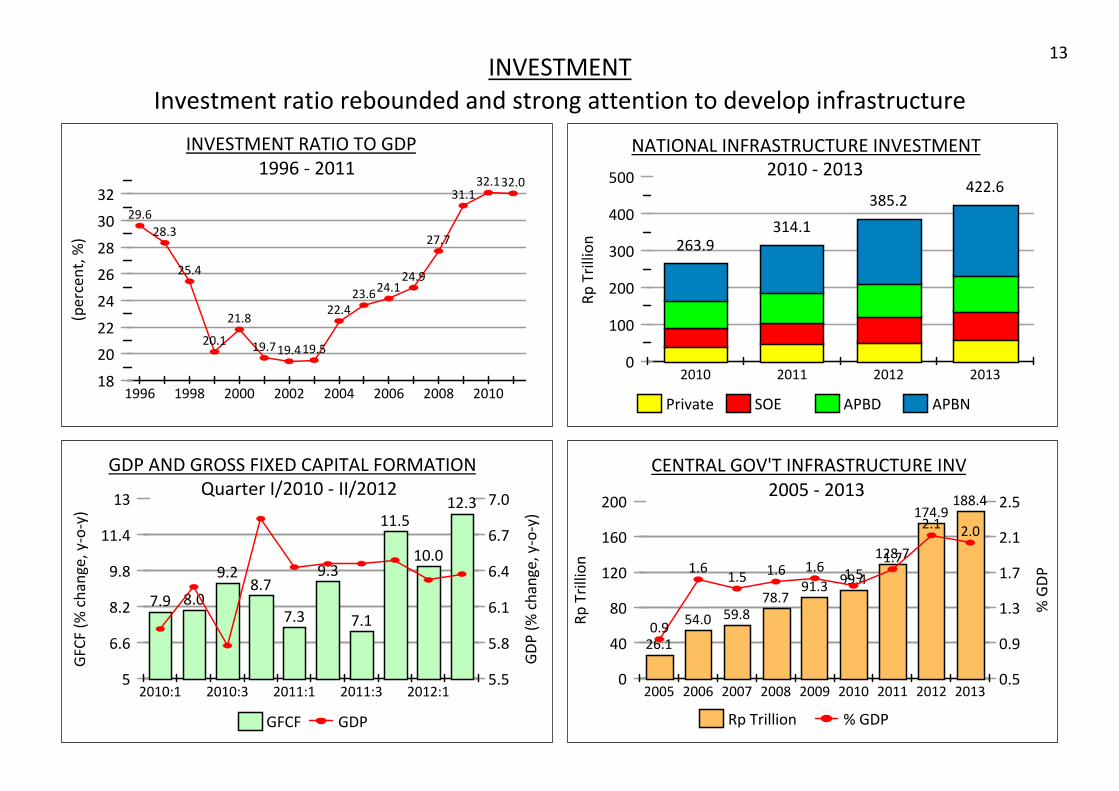
INVESTMENT
Investment ratio rebounded and strong attention to develop infrastructure
0
40
80
120
160
200
Rp
Tri
llio
n
0.5
0.9
1.3
1.7
2.1
2.5
% G
DP
2005 2006 2007 2008 2009 2010 2011 2012 2013
26.1
54.0 59.878.7
91.399.4
128.7
174.9188.4
0.9
1.61.5
1.6 1.61.5
1.7
2.12.0
Rp Trillion % GDP
CENTRAL GOV'T INFRASTRUCTURE INV
2005 - 2013
18
20
22
24
26
28
30
32
(pe
rce
nt,
%)
1996 1998 2000 2002 2004 2006 2008 2010
29.6
28.3
25.4
20.1
21.8
19.719.419.5
22.4
23.624.1
24.9
27.7
31.132.132.0
INVESTMENT RATIO TO GDP
1996 - 2011
5
6.6
8.2
9.8
11.4
13
GF
CF
(%
ch
an
ge
, y
-o-y
)
5.5
5.8
6.1
6.4
6.7
7.0
GD
P (
% c
ha
ng
e,
y-o
-y)
2010:1 2010:3 2011:1 2011:3 2012:1
7.9 8.0
9.28.7
7.3
9.3
7.1
11.5
10.0
12.3
GFCF GDP
GDP AND GROSS FIXED CAPITAL FORMATION
Quarter I/2010 - II/2012
13
0
100
200
300
400
500
Rp
Tri
llio
n
2010 2011 2012 2013
263.9314.1
385.2422.6
Private SOE APBD APBN
NATIONAL INFRASTRUCTURE INVESTMENT
2010 - 2013

TOTAL INVESTMENT NEEDS OF INFRASTRUCTURETowards Strong Domestic Connectivity 2011 - 2025
424.860
120.615
APBD
59.352
Mixed
620.297
Private
533.471
SOE
446.928
APBN
2.000.000
200.000
400.000
600.000
800.000
1.200.000
1.000.000
1.400.000
1.600.000
1.800.000
2.200.000
0Total
2.170.153
183.499
158.765
1.028.789
71.402
607.083
Nod
Decided
85.246
Papua - Kep. Maluku
Sulawesi
Kalimantan
Jawa
Bali - NT
Sumatera
197
194
94
Total
904
96
106
217
Nod
Decided
60
APBD
34
Mixed
87
Private
133
SOE
152
APBN
438
Total Investment 2.170 Trilion Rupiah Total Number of Projects 904
Billion Rupiah
Source: KP3EI – Connectivity Working Group
14

EDUCATION CHALLANGES
Ensuring that workers receive the right level of education
15
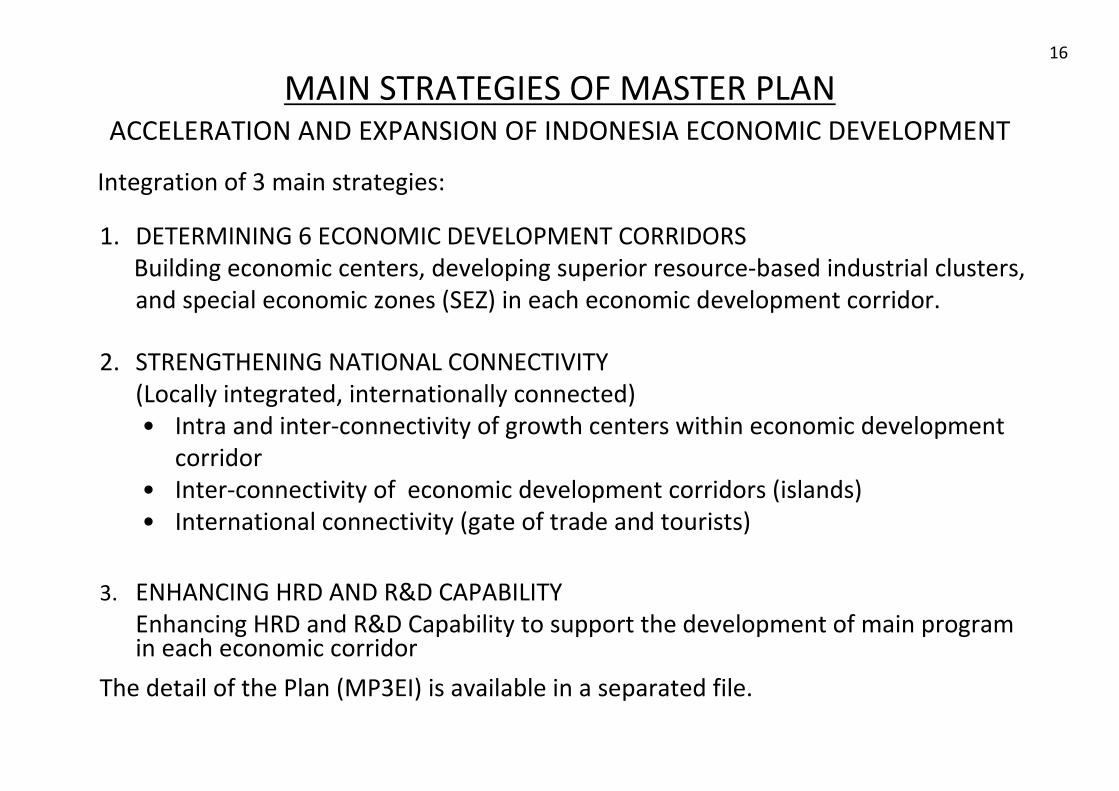
1. DETERMINING 6 ECONOMIC DEVELOPMENT CORRIDORS
Building economic centers, developing superior resource-based industrial clusters,
and special economic zones (SEZ) in each economic development corridor.
2. STRENGTHENING NATIONAL CONNECTIVITY
(Locally integrated, internationally connected)
• Intra and inter-connectivity of growth centers within economic development
corridor
• Inter-connectivity of economic development corridors (islands)
• International connectivity (gate of trade and tourists)
3. ENHANCING HRD AND R&D CAPABILITY
Enhancing HRD and R&D Capability to support the development of main program in each economic corridor
The detail of the Plan (MP3EI) is available in a separated file.
MAIN STRATEGIES OF MASTER PLANACCELERATION AND EXPANSION OF INDONESIA ECONOMIC DEVELOPMENT
Integration of 3 main strategies:
16
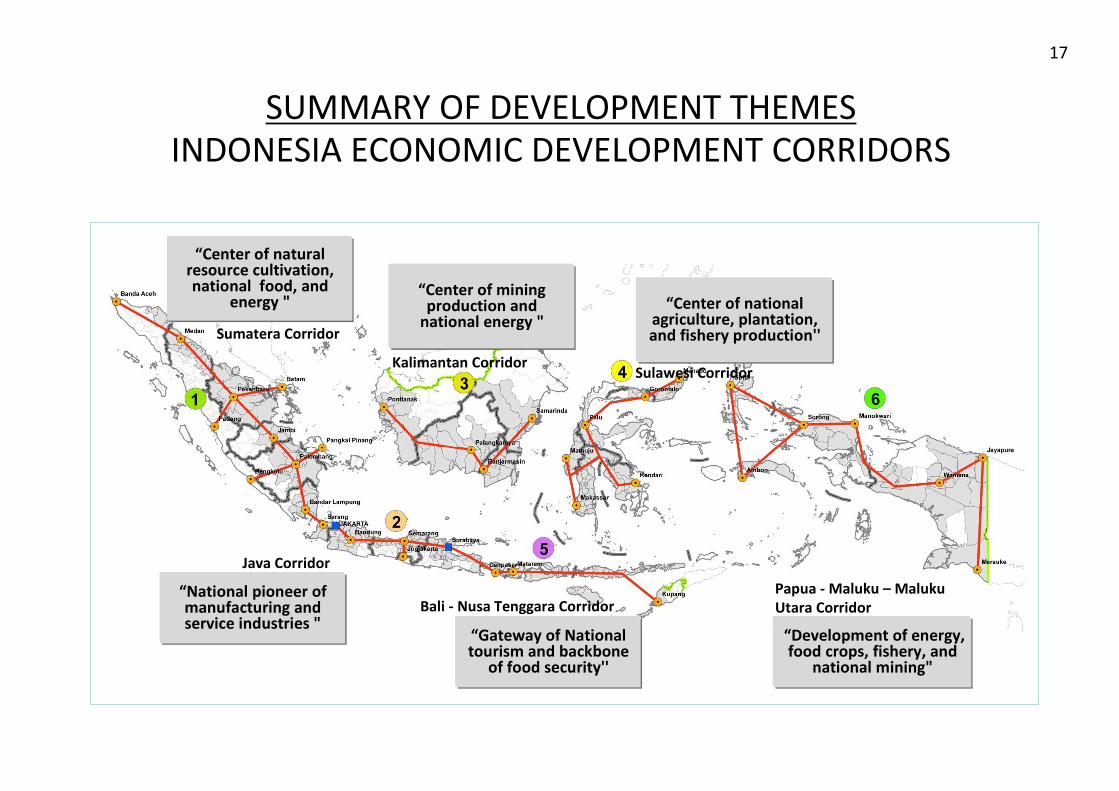
SUMMARY OF DEVELOPMENT THEMES
INDONESIA ECONOMIC DEVELOPMENT CORRIDORS
“Center of mining production and
national energy "“Center of national
agriculture, plantation, and fishery production''Sumatera Corridor
Kalimantan CorridorSulawesi Corridor
“Gateway of National tourism and backbone
of food security''
“National pioneer of manufacturing and service industries "
“Development of energy, food crops, fishery, and
national mining"
Java Corridor
Bali - Nusa Tenggara CorridorPapua - Maluku – Maluku
Utara Corridor
“Center of natural resource cultivation,national food, and
energy "
17
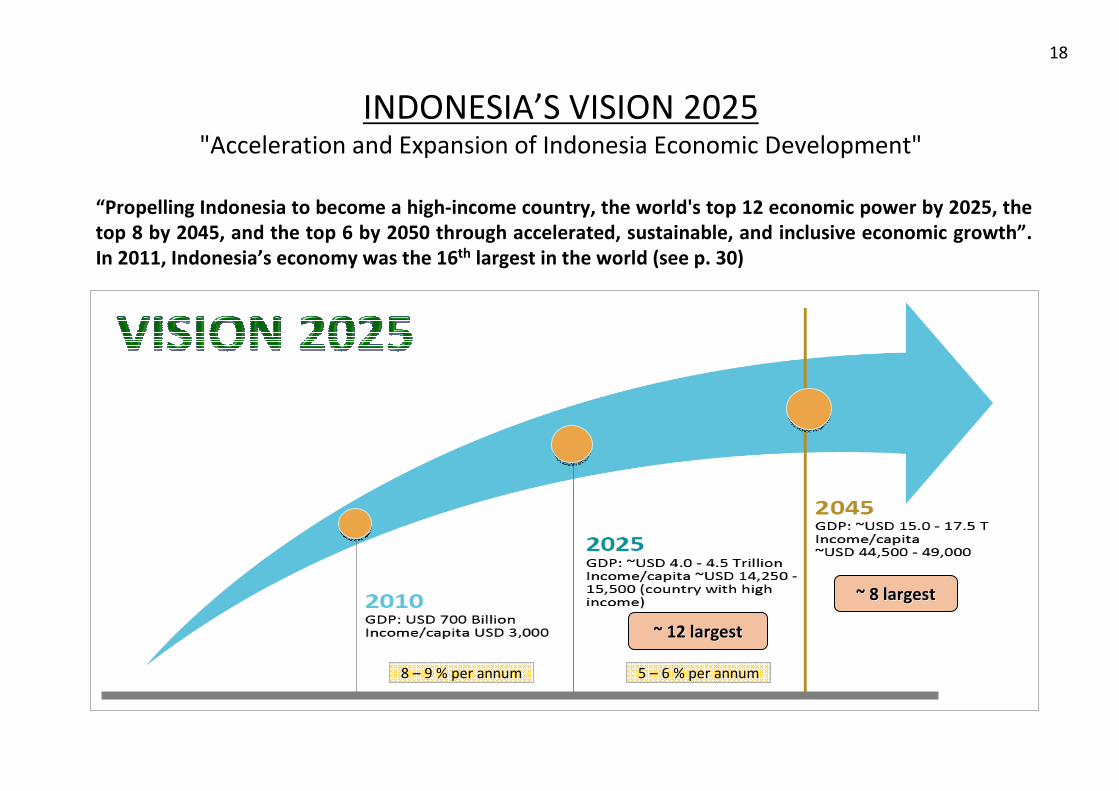
INDONESIA’S VISION 2025"Acceleration and Expansion of Indonesia Economic Development"
“Propelling Indonesia to become a high-income country, the world's top 12 economic power by 2025, the
top 8 by 2045, and the top 6 by 2050 through accelerated, sustainable, and inclusive economic growth”.
In 2011, Indonesia’s economy was the 16th largest in the world (see p. 30)
~ 12 largest ~ 12 largest
~ 8 largest ~ 8 largest
8 – 9 % per annum 5 – 6 % per annum
18

GROWTH ESTIMATE, 2012 – 2016With estimate growth in 2012 is 6.3% ± 0.1%, 2013 6.6% ± 0.2%, 2014 6.9% ± 0.2%,
2015 and 2016 slightly above 7%, the average growth 2012 – 2016 is around 6.6% pa
19
MEDIUM TERM PLAN, ANNUAL BUDGET TARGET, AND REALIZATION
2010 - 2014
Average201420132012201120102009
GDP GROWTH (%)
TARGET
6.3 - 6.87.0 - 7.76.7 - 7.46.4 - 6.96.0 - 6.35.5 - 5.6Medium Term Plan
6.86.56.55.8Annual Budget
6.3*)6.56.24.6Realization
UNEMPLOYMENT RATE (%)
TARGET
5.0 - 6.06.0 - 6.66.7 - 7.07.4 - 7.47.6Medium Term Plan
6.3**)6.67.17.9Realization
POVERTY RATE (%)
TARGET
8 - 109,5 - 10,510.5 - 11.511.5 - 12.512.0 - 13.5Medium Term Plan
12.0***)12.513.314.1Realization
* Semester I/2012, **) per February 2012, ***) per March 2012

LESSON LEARNED
• With frequent uncertainty of the global economy, orientation is balanced between external and domestic.
• Stability is important to maintain confidence.
• Progressive policies and efforts are needed to attract investment.
• Bottleneck of infrastructure is eliminated by involving private sector.
• Fiscal policy is important to promote growth and achieve broaderdevelopment goals by sharpening the direction of spending.
• Industrialization process is strengthened to increase the value added of natural resources based on regional comparative advantage. Secondary sector plays an important in creating formal employment.
• Access to and quality of education are enhanced and link to the needs of business is improved to increase the contribution of human capital in growth and development.
20

RELATED TABLES
21
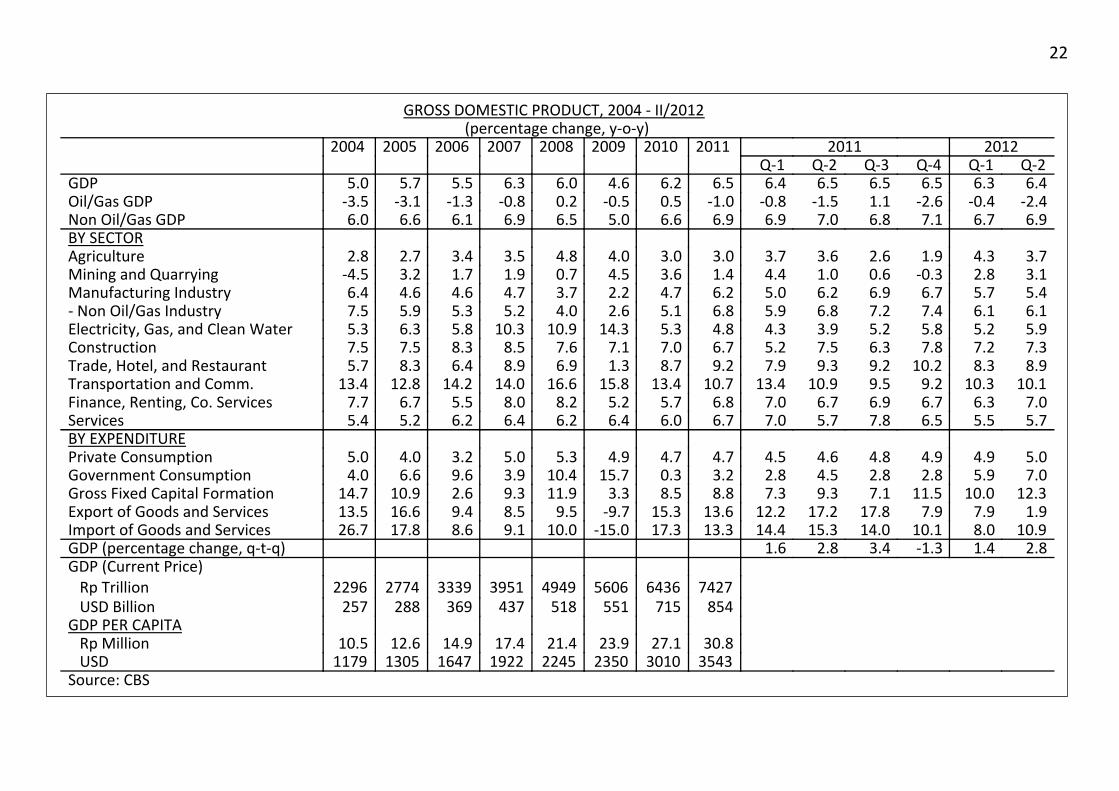
GROSS DOMESTIC PRODUCT, 2004 - II/2012(percentage change, y-o-y)
2012201120112010200920082007200620052004Q-2Q-1Q-4Q-3Q-2Q-1 6.46.36.56.56.56.46.56.24.66.06.35.55.75.0GDP
-2.4-0.4-2.61.1-1.5-0.8-1.00.5-0.50.2-0.8-1.3-3.1-3.5Oil/Gas GDP6.96.77.16.87.06.96.96.65.06.56.96.16.66.0Non Oil/Gas GDP
BY SECTOR3.74.31.92.63.63.73.03.04.04.83.53.42.72.8Agriculture3.12.8-0.30.61.04.41.43.64.50.71.91.73.2-4.5Mining and Quarrying5.45.76.76.96.25.06.24.72.23.74.74.64.66.4Manufacturing Industry6.16.17.47.26.85.96.85.12.64.05.25.35.97.5- Non Oil/Gas Industry5.95.25.85.23.94.34.85.314.310.910.35.86.35.3Electricity, Gas, and Clean Water7.37.27.86.37.55.26.77.07.17.68.58.37.57.5Construction8.98.310.29.29.37.99.28.71.36.98.96.48.35.7Trade, Hotel, and Restaurant
10.110.39.29.510.913.410.713.415.816.614.014.212.813.4Transportation and Comm.7.06.36.76.96.77.06.85.75.28.28.05.56.77.7Finance, Renting, Co. Services5.75.56.57.85.77.06.76.06.46.26.46.25.25.4Services
BY EXPENDITURE5.04.94.94.84.64.54.74.74.95.35.03.24.05.0Private Consumption7.05.92.82.84.52.83.20.315.710.43.99.66.64.0Government Consumption
12.310.011.57.19.37.38.88.53.311.99.32.610.914.7Gross Fixed Capital Formation1.97.97.917.817.212.213.615.3-9.79.58.59.416.613.5Export of Goods and Services
10.98.010.114.015.314.413.317.3-15.010.09.18.617.826.7Import of Goods and Services2.81.4-1.33.42.81.6GDP (percentage change, q-t-q)
GDP (Current Price)
74276436560649493951333927742296 Rp Trillion
854715551518437369288257 USD BillionGDP PER CAPITA
30.827.123.921.417.414.912.610.5 Rp Million35433010235022451922164713051179 USD
Source: CBS
22

GROSS DOMESTIC PRODUCT, 1968 - 2011(percentage change)
Period of 1998 - 2011Average201120102009200820072006200520042003200220012000199919981968-97
6.56.24.66.06.35.55.75.04.84.53.64.90.8-13.16.8GDP6.96.65.06.56.96.16.66.05.75.24.95.31.0-14.26.9Non-Oil/Gas GDP3.03.04.04.83.53.42.72.83.83.43.31.92.2-1.33.5Agriculture1.43.64.50.71.91.73.2-4.5-1.41.00.35.5-1.6-2.86.0Mining and Quarrying6.24.72.23.74.74.64.66.45.35.33.36.03.9-11.410.9Manufacturing Industry6.85.12.64.05.25.35.97.56.05.74.97.03.5-13.111.1o/w Non Oil/Gas Industry4.85.314.310.910.35.86.35.34.98.97.97.68.33.013.0Electricity, Gas, Clean Water6.77.07.17.68.58.37.57.56.15.54.65.6-1.9-36.412.9Construction9.28.71.36.98.96.48.35.75.44.33.95.7-0.1-18.28.2Trade, Hotel, Restaurant
10.713.415.816.614.014.212.813.412.28.48.18.6-0.8-15.19.3Transportation and Comm.6.85.75.28.28.05.56.77.76.76.76.84.6-7.2-26.610.8Finance, Renting, Co. Services6.76.06.46.26.46.25.25.44.43.83.22.31.9-3.85.8Services4.74.74.95.35.03.24.05.03.93.83.51.64.6-6.26.9Private Consumption3.20.315.710.43.99.66.64.010.013.07.66.50.7-15.47.7Government Consumption8.88.53.311.99.32.610.914.70.64.76.516.7-18.2-33.013.0Gross Fixed Capital Formation
13.615.3-9.79.58.59.416.613.55.9-1.20.626.5-31.811.27.8Export of Goods and Services13.317.3-15.010.09.18.617.826.71.6-4.24.225.9-40.7-5.312.4Import of Goods and Services
3543301023502245192216471305117910949207727826864761084GDP/Capita (USD) *)Source: Processed from CBS. *) End od Period
23
24
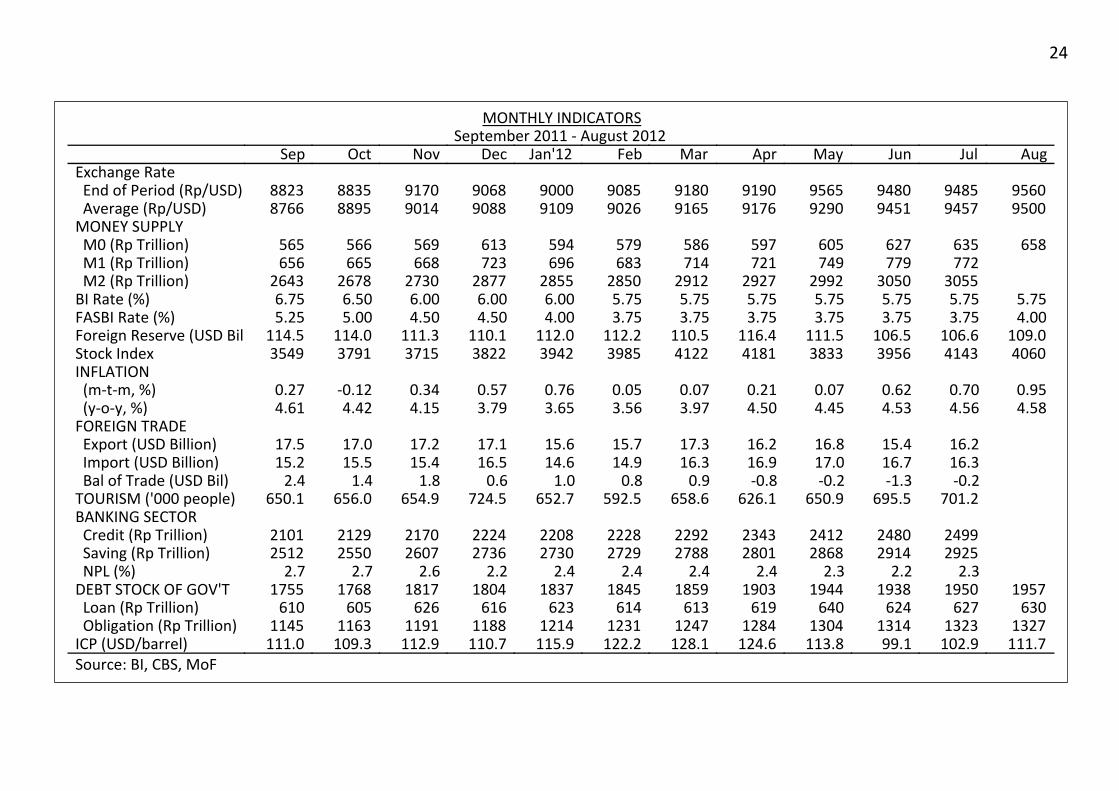
MONTHLY INDICATORSSeptember 2011 - August 2012
AugJulJunMayAprMarFebJan'12DecNovOctSepExchange Rate
956094859480956591909180908590009068917088358823 End of Period (Rp/USD)950094579451929091769165902691099088901488958766 Average (Rp/USD)
MONEY SUPPLY658635627605597586579594613569566565 M0 (Rp Trillion)
772779749721714683696723668665656 M1 (Rp Trillion)30553050299229272912285028552877273026782643 M2 (Rp Trillion)
5.755.755.755.755.755.755.756.006.006.006.506.75BI Rate (%)4.003.753.753.753.753.753.754.004.504.505.005.25FASBI Rate (%)
109.0106.6106.5111.5116.4110.5112.2112.0110.1111.3114.0114.5Foreign Reserve (USD Bil)406041433956383341814122398539423822371537913549Stock Index
INFLATION0.950.700.620.070.210.070.050.760.570.34-0.120.27 (m-t-m, %)4.584.564.534.454.503.973.563.653.794.154.424.61 (y-o-y, %)
FOREIGN TRADE16.215.416.816.217.315.715.617.117.217.017.5 Export (USD Billion)16.316.717.016.916.314.914.616.515.415.515.2 Import (USD Billion)-0.2-1.3-0.2-0.80.90.81.00.61.81.42.4 Bal of Trade (USD Bil)
701.2695.5650.9626.1658.6592.5652.7724.5654.9656.0650.1TOURISM ('000 people)BANKING SECTOR
24992480241223432292222822082224217021292101 Credit (Rp Trillion)29252914286828012788272927302736260725502512 Saving (Rp Trillion)
2.32.22.32.42.42.42.42.22.62.72.7 NPL (%)195719501938194419031859184518371804181717681755DEBT STOCK OF GOV'T
630627624640619613614623616626605610 Loan (Rp Trillion)132713231314130412841247123112141188119111631145 Obligation (Rp Trillion)
111.7102.999.1113.8124.6128.1122.2115.9110.7112.9109.3111.0ICP (USD/barrel)
Source: BI, CBS, MoF

MAIN INDICATORS OF INDONESIA'S ECONOMY2000 - 2013
201220132012201120102009200820072006200520042003200220012000Q.2Q.1
GROSS DOMESTIC PRODUCT6.46.36.56.24.66.06.35.55.75.04.84.53.64.9 Growth (%, y-o-y)
30.827.123.921.417.414.912.610.59.48.67.96.8 GDP per Capita (Rp Million)354330102350224519221647130511791094920772782 GDP per Capita (USD)
32.831.832.032.131.127.724.924.123.622.419.519.419.721.8Investment Ratio to GDP (%)BALANCE OF PAYMENTS
-6.9-3.21.75.110.60.110.510.90.31.68.17.86.98.0 Current Account (USD Billion)0.20.72.00.02.42.90.10.63.43.94.24.8 % of GDP
38.738.6162.7129.499.0107.993.180.666.854.548.946.344.850.3 o/w X(Non Oil/Gas) (USD Bil)5.52.513.426.61.1-11.73.63.00.31.9-0.9-1.1-7.6-7.9 Cap and Fin Account (USD Bil)
106.5110.5110.196.266.151.656.942.634.736.336.232.028.029.4 Foreign Reserve (USD Bil)21.319.821.117.219.424.817.327.132.333.141.441.1 Debt Service Ratio (%)
9306909987769087103989681914091689706896885769317102338379EXCHANGE RATE (Rp/USD)4.54.03.87.02.811.16.66.617.16.45.110.012.59.3INFLATION (%, y-o-y)
5.755.756.006.506.509.258.009.7512.757.438.3113.0217.6314.53BI RATE (%)BANKING SECTOR
2480229222241784144713141004787690554438366308269 Credit (Rp Tril)291427882736230519141682146312291076922848788809720 Deposit (Rp Tril)3956412238223704253413552746180611631000692425392416STOCK INDEX
NATIONAL BUDGET150813581211995849982708638495403341299301205Revenue (Rp Tril)11791016874723620659491409347281242210186116 Tax
324341331269227321215227147123998811589 Non Tax1658154812951042937986758667510427377322342221Expenditure (Rp Tril)11391070884697629693505440361297256224261188 Central Gov't
519479411345309292253226150130120988133 Regional Gov't-150-190-84-47-89-4-50-29-14-24-35-24-40-16Surplus/Deficit-1.6-2.3-1.1-0.7-1.6-0.1-1.3-0.9-0.5-1.0-1.7-1.3-2.5-1.2 % of GDP
GOVERNMENT DEBT19381859180316771591163713891302131312991232122512741235 Rp Trillion
24.326.128.433.135.239.047.356.661.267.277.488.9 % of GDPOPEN UNEMPLOYMENT
7.67.78.39.09.410.010.911.910.39.99.18.05.8 (Mil People)6.36.67.17.98.49.110.311.29.99.79.18.16.1 % of Labor Force
POVERTY29.129.931.032.535.037.239.335.136.137.338.437.938.7 (Mil People)12.012.413.314.115.416.617.716.016.717.418.218.419.1 % of Population
0.410.380.370.350.360.330.360.320.320.33GINI Ratio
Source: BPS, BI, Ministry of Finance, BEI. *) 2012 is Budget Note Revised and 2013 is Budget Note.**) SInce 2011, Susenas is conducted two times, March and September.
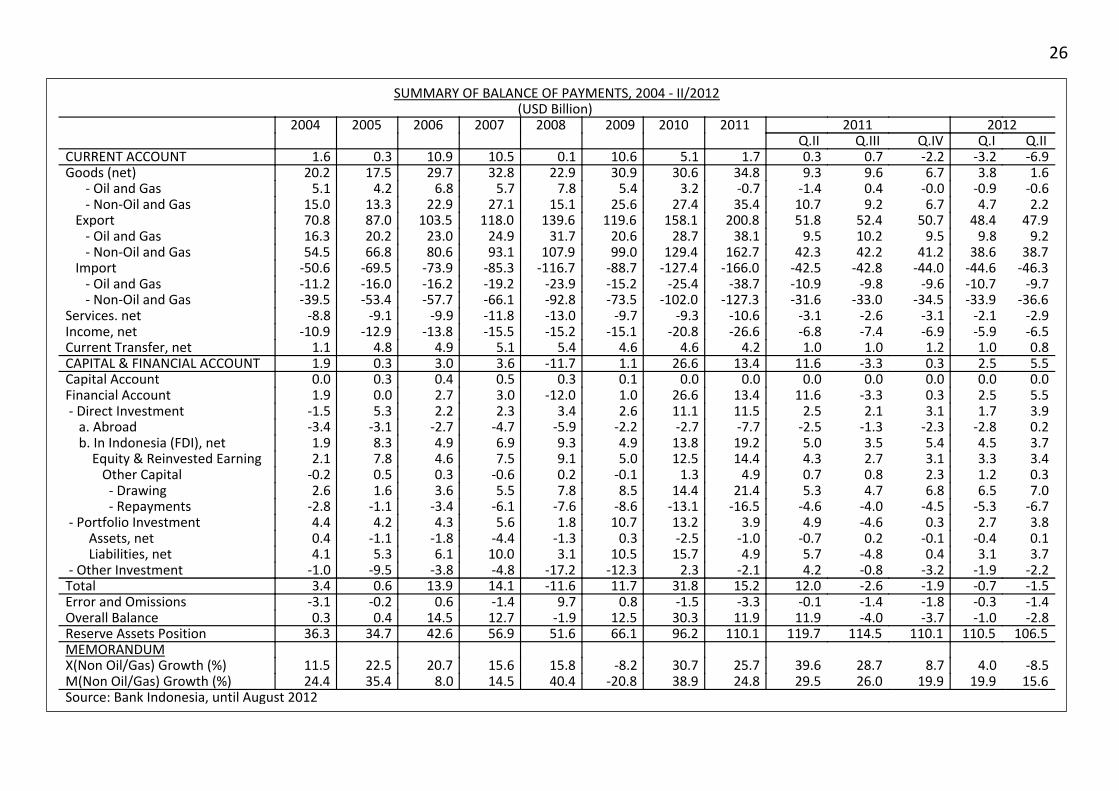
SUMMARY OF BALANCE OF PAYMENTS, 2004 - II/2012(USD Billion)
2012201120112010200920082007200620052004 Q.IIQ.IQ.IVQ.IIIQ.II -6.9-3.2-2.20.70.31.75.110.60.110.510.90.31.6CURRENT ACCOUNT1.63.86.79.69.334.830.630.922.932.829.717.520.2Goods (net)
-0.6-0.9-0.00.4-1.4-0.73.25.47.85.76.84.25.1 - Oil and Gas2.24.76.79.210.735.427.425.615.127.122.913.315.0 - Non-Oil and Gas
47.948.450.752.451.8200.8158.1119.6139.6118.0103.587.070.8 Export9.29.89.510.29.538.128.720.631.724.923.020.216.3 - Oil and Gas
38.738.641.242.242.3162.7129.499.0107.993.180.666.854.5 - Non-Oil and Gas-46.3-44.6-44.0-42.8-42.5-166.0-127.4-88.7-116.7-85.3-73.9-69.5-50.6 Import
-9.7-10.7-9.6-9.8-10.9-38.7-25.4-15.2-23.9-19.2-16.2-16.0-11.2 - Oil and Gas-36.6-33.9-34.5-33.0-31.6-127.3-102.0-73.5-92.8-66.1-57.7-53.4-39.5 - Non-Oil and Gas
-2.9-2.1-3.1-2.6-3.1-10.6-9.3-9.7-13.0-11.8-9.9-9.1-8.8Services. net-6.5-5.9-6.9-7.4-6.8-26.6-20.8-15.1-15.2-15.5-13.8-12.9-10.9Income, net0.81.01.21.01.04.24.64.65.45.14.94.81.1Current Transfer, net5.52.50.3-3.311.613.426.61.1-11.73.63.00.31.9CAPITAL & FINANCIAL ACCOUNT0.00.00.00.00.00.00.00.10.30.50.40.30.0Capital Account5.52.50.3-3.311.613.426.61.0-12.03.02.70.01.9Financial Account 3.91.73.12.12.511.511.12.63.42.32.25.3-1.5 - Direct Investment0.2-2.8-2.3-1.3-2.5-7.7-2.7-2.2-5.9-4.7-2.7-3.1-3.4 a. Abroad3.74.55.43.55.019.213.84.99.36.94.98.31.9 b. In Indonesia (FDI), net3.43.33.12.74.314.412.55.09.17.54.67.82.1 Equity & Reinvested Earning0.31.22.30.80.74.91.3-0.10.2-0.60.30.5-0.2 Other Capital7.06.56.84.75.321.414.48.57.85.53.61.62.6 - Drawing
-6.7-5.3-4.5-4.0-4.6-16.5-13.1-8.6-7.6-6.1-3.4-1.1-2.8 - Repayments3.82.70.3-4.64.93.913.210.71.85.64.34.24.4 - Portfolio Investment0.1-0.4-0.10.2-0.7-1.0-2.50.3-1.3-4.4-1.8-1.10.4 Assets, net3.73.10.4-4.85.74.915.710.53.110.06.15.34.1 Liabilities, net
-2.2-1.9-3.2-0.84.2-2.12.3-12.3-17.2-4.8-3.8-9.5-1.0 - Other Investment-1.5-0.7-1.9-2.612.015.231.811.7-11.614.113.90.63.4Total-1.4-0.3-1.8-1.4-0.1-3.3-1.50.89.7-1.40.6-0.2-3.1Error and Omissions-2.8-1.0-3.7-4.011.911.930.312.5-1.912.714.50.40.3Overall Balance
106.5110.5110.1114.5119.7110.196.266.151.656.942.634.736.3Reserve Assets PositionMEMORANDUM
-8.54.08.728.739.625.730.7-8.215.815.620.722.511.5X(Non Oil/Gas) Growth (%)15.619.919.926.029.524.838.9-20.840.414.58.035.424.4M(Non Oil/Gas) Growth (%)
Source: Bank Indonesia, until August 2012
26

NUMBER AND PERCENTAGE OF POOR PEOPLE1970 - 2012
Percentage (%)Number (million)YearU+RRural (R)Urban (U)U+RRural (R)Urban (U)60.0--70.0--197040.140.438.854.244.210.0197633.333.430.847.238.98.3197828.628.429.042.332.89.5198026.926.528.140.631.39.3198121.621.223.135.025.79.3198417.416.120.130.020.39.7198715.114.316.827.217.89.4199013.713.813.425.917.28.7199311.312.39.722.515.37.2199617.519.813.434.024.67.21996 *)24.225.721.949.531.917.6199823.426.019.448.032.315.6199919.122.414.638.726.412.3200018.424.89.837.929.38.6200118.221.114.538.425.113.3200217.420.213.637.325.112.2200316.720.112.136.124.811.4200416.020.011.735.122.712.4200517.721.813.539.324.814.5200616.620.412.537.223.613.6200715.418.911.735.022.212.8200814.117.410.732.520.611.9200913.316.69.931.019.911.1201012.515.79.230.019.011.02011/312.415.69.129.918.911.02011/912.015.18.829.118.510.62012/3
Source: CBS; *) based on 1998's calculation method
27

GROSS DOMESTIC PRODUCT(percentage change, % y-o-y)
20122011201020112010200920082007200620052004Tw 2Tw 1Tw 4Tw 3Tw 2Tw 1Tw 4Tw 3
2.32.42.01.61.91.82.42.81.82.4-3.1-0.31.92.73.13.5US2.51.82.22.52.02.93.33.82.53.2-2.60.42.52.93.03.1Canada3.22.9-0.7-0.6-1.80.03.25.6-0.84.5-5.5-1.02.21.71.32.4Japan
-0.8-0.20.60.50.41.61.32.50.91.3-4.80.73.02.82.12.8UK1.01.22.02.72.94.63.84.03.03.5-5.01.32.63.00.81.2Germany0.30.31.21.51.72.21.41.61.71.4-2.20.82.12.41.92.2France
-0.5-1.0-0.40.91.62.82.31.81.21.7-4.02.03.63.42.02.2Netherlands-2.5-1.4-0.50.41.01.01.61.50.51.4-5.0-1.01.52.10.81.4Italy-1.3-0.60.00.60.80.90.70.20.6-0.1-3.50.93.64.03.63.3Spain2.53.54.04.04.74.64.04.74.43.91.65.16.86.23.65.3Poland
-3.3-2.3-3.0-2.0-1.1-0.51.01.3-1.51.4-2.90.01.91.40.91.5Portugal-6.2-6.5-7.5-5.0-7.3-8.0-8.6-4.6-7.0-3.0-2.92.04.54.52.24.6Greece-1.0-1.21.21.31.92.12.52.41.71.2-6.30.61.04.03.54.9Hungary0.01.42.90.82.9-0.90.21.01.4-0.8-5.5-2.15.45.36.04.6Ireland1.71.22.23.21.41.30.0-2.12.0-1.2-7.17.36.37.94.28.5Romania
-0.50.00.61.31.62.42.02.01.41.9-4.30.43.03.31.72.2Euro Area (17)3.74.32.52.61.91.12.22.42.12.51.32.14.02.82.83.8Australia0.02.41.91.40.91.21.21.61.41.2-2.1-0.12.81.03.34.5New Zealand7.68.18.99.19.59.79.89.69.210.48.79.013.011.610.410.1China5.55.36.16.78.09.28.27.67.58.96.46.210.09.59.07.6India2.42.83.33.63.54.24.94.53.66.30.32.35.15.24.04.6South Korea
-0.20.41.93.54.56.67.110.74.010.7-1.80.76.05.44.76.2Taiwan2.01.53.66.01.29.112.510.54.914.8-0.81.17.88.47.39.3Singapore1.10.73.04.45.47.66.76.95.07.1-2.72.36.47.07.18.5Hong Kong6.46.36.56.56.56.46.85.86.56.24.66.06.35.55.75.0Indonesia5.44.95.25.74.35.14.85.35.17.2-1.64.86.25.85.36.8Malaysia4.20.4-8.93.72.73.23.86.60.17.8-2.32.54.95.24.66.3Thailand5.96.34.03.23.64.96.17.33.97.61.14.26.65.24.86.7Philippines2.93.35.08.49.112.19.25.38.59.0-4.80.74.76.98.49.4Turkey0.50.81.42.13.34.25.36.92.77.5-0.25.16.14.03.25.7Brazil4.14.53.94.33.14.44.45.13.95.5-6.31.23.25.13.24.0Mexico3.02.12.93.03.33.43.03.13.12.9-1.53.65.55.65.33.3South Africa
Sources: National Statistics related Country
28

WORLD ECONOMIC OUTLOOK 2000 - 2013*)(percentage change, %)
2013*)2012*)201120102009200820072006200520042003200220012000
OUTPUT3.93.53.95.3-0.63.25.45.24.54.93.72.92.44.7World1.91.41.63.2-3.60.92.83.02.63.12.01.81.54.1Developed Countries2.42.11.82.4-3.1-0.31.92.73.13.52.51.81.14.1 US0.7-0.31.41.9-4.30.92.73.31.72.20.70.92.03.8 European Union1.52.4-0.84.5-5.0-0.61.52.10.81.4-0.00.51.83.7 Japan5.95.76.27.52.86.18.78.27.37.56.34.73.85.8Developing Countries5.35.45.25.32.85.67.16.46.27.14.87.24.93.6 Africa2.81.95.34.5-3.62.95.46.45.97.34.84.30.25.2 Central and East Europe7.57.17.89.77.17.711.410.39.58.58.16.85.86.7 Asia8.58.09.210.48.79.013.011.610.410.110.09.18.38.4 China6.56.17.58.96.86.210.09.59.07.66.94.63.95.2 India3.75.53.54.92.75.96.36.15.66.27.53.82.95.0 Middle East4.23.44.56.2-1.64.35.85.74.76.02.10.30.44.0 Latin America5.13.85.912.8-10.53.37.99.37.810.65.33.90.212.3TRADE VOLUME
Import4.21.94.411.5-12.20.44.77.86.39.34.22.9-0.412.2 Developed Countries7.07.88.815.3-8.110.914.011.912.115.89.67.12.512.1 Developing Countries
Export4.32.35.412.2-11.51.86.18.96.29.33.42.8-0.412.0 Developed Countries6.25.76.614.4-7.76.09.511.511.913.310.37.32.313.7 Developing Countries
COMMODITY PRICES Crude Oil (USD/brl)
103.4111.895.179.461.799.672.366.056.441.431.126.125.930.3 WTI **)94.2101.8104.079.061.897.071.164.353.437.828.925.024.328.2 Average (WTI, Brent, Dubai)-4.3-12.017.826.3-15.77.514.123.26.115.25.91.9-4.84.2 Non-fuel
CONSUMER PRICE1.62.02.71.50.13.42.22.42.32.01.91.52.22.3 Developed Countries5.66.37.26.15.29.36.55.65.75.96.66.87.88.5 Developing Countries
Source: Statistis related Countries, IMF, WEO, Update July 2012. *) Estimate. **) EIA, US Dept. of Energy, based on the latest projection
29

THE 40 LARGEST GROSS DOMESTIC PRODUCT IN 2011(USD Billion)
2011201020092008200720062005200420032002200120001999199819971996CountryNo.150941452713939142921402913377126231185311142106421028699519354879383327838United States1
72985930499145203494271322571932164114541325119810831019953856China25869548850354849435643574572465643033981416047314433391543244706Japan33577328633073641332929052771273024282014188318922134218121602438Germany42776256326322843258722602138205517971458134013321457147114231573France5249321431622165013661089882664552506554644587844872840Brazil62418226321812657281424482283220318621614147114801503145613591221United Kingdom72199206121172318213018751789173815171230112511071210122612011268Italy818501487122316611300990764591430345307260196271405392Russia91737157713381503142412791134992866735715725661617638614Canada1016761598125412511153908809689591510488476454424421376India1114941395145916011444123811331046886689610582619602573623Spain12148812459921055946778732655539424377400412381426425Australia131155103588210941035952849760700706710672566487468387Mexico14111610158349311049952845722644576505533462358532573Korea15
84670853951143236428625723519616016514095216227Indonesia16840781796875784678640611539439401386412403387418Netherlands17778735614730649529483392303232196266250269255244Turkey18636528492503434391372363325279255250268273265305Switzerland19578451377477385357316251215189183189161146165158Saudi Arabia20538462406486463399371362315251227247259255253276Sweden21514469431529425342304253217198190171168172157157Poland22513470474509460400378362312254233233255256250276Belgium23484417375454394340304260225192171168159151158160Norway244824193613513072422031681371161159610598106111Iran25467430378400393376365340311301294326299275299288Taiwan26448370310328262214183153130103269284284299293272Argentina27419380383416376325306292254208192193213214208235Austria28408363284274286261247219168111119133133134149144South Africa2936029827031525822218114812411010310483737671United Arab Emirates30346319264273247207176161143127116123123112151182Thailand31333312311344311274258245213174160160174174170184Denmark3232828723323621116114711995989810096109112119Colombia33316295329315230183144113839312311798918671Venezuela34303305327349311265243230195148131128138134133136Greece3527923819322318715713812511010193948073102102Malaysia36267238240273246208196189165136125122130130123128Finland372602271861901781461251139691889485859995Singapore38248216173179173155123997670717975838679Chile39243224209215207190178166159164167169163167176159Hong Kong SAR40
Source: IMF, WEO Data Base, April 2012
30


