Indonesia Economic Quarterly: December 2011 Enhancing...
44
www.worldbank.org/id www.worldbank.org/indonesia Indonesia Economic Quarterly: December 2011 Enhancing Preparedness, Ensuring Resilience Shubham Chaudhuri Indonesia Lead Economist World Bank December 14, 2011 Jakarta, Indonesia
Transcript of Indonesia Economic Quarterly: December 2011 Enhancing...
www.worldbank.org/id www.worldbank.org/indonesia
Indonesia Economic Quarterly: December 2011
Enhancing Preparedness, Ensuring Resilience
Shubham Chaudhuri Indonesia Lead Economist
World Bank
December 14, 2011 Jakarta, Indonesia
2
Outline
What I’ll be talking about
Developments in the last quarter: more of the same
Global economic outlook continues to deteriorate
Financial markets continue to be volatile
The real economy remains little affected, thus far
Looking forward: enhancing preparedness to ensure resilience
How the global economy might evolve: baseline as well as more adverse
scenarios
Fiscal measures to enhance preparedness: the 2012 budget
Ensuring financial sector stability
Structural reforms to ensure resilience
Revitalized manufacturing sector key to resilience and medium-term growth
A decade of slow recovery
Constraints on growth
Renewed opportunities for growth
Developments in the last quarter: more of the same
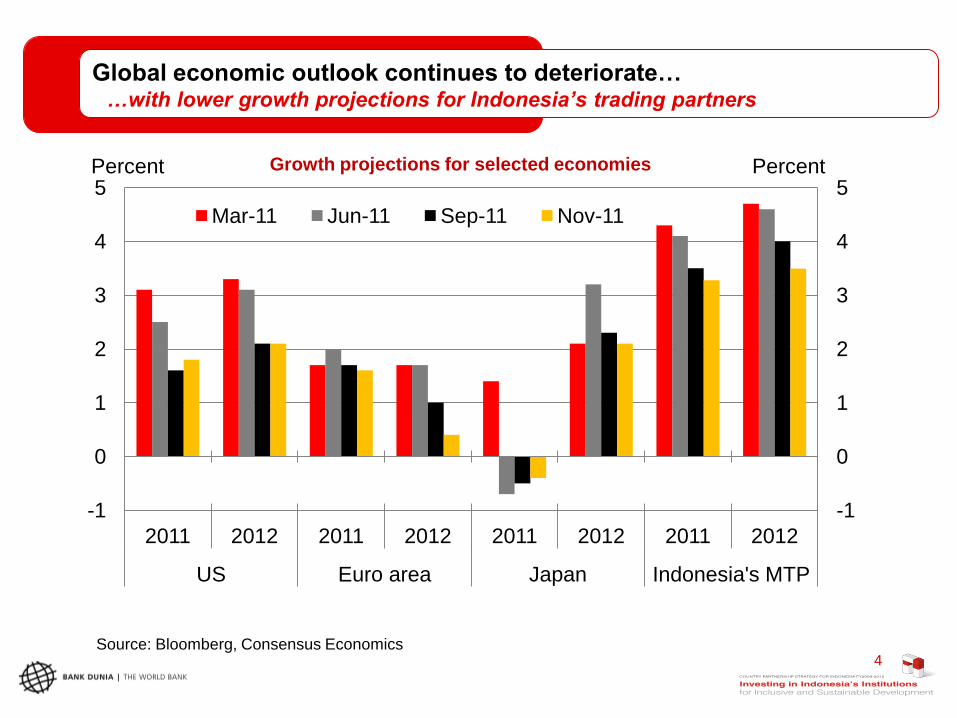
Source: Bloomberg, Consensus Economics
-1
0
1
2
3
4
5
-1
0
1
2
3
4
5
2011 2012 2011 2012 2011 2012 2011 2012
US Euro area Japan Indonesia's MTP
Mar-11 Jun-11 Sep-11 Nov-11
Percent Percent
4
Global economic outlook continues to deteriorate…
Growth projections for selected economies
…with lower growth projections for Indonesia’s trading partners
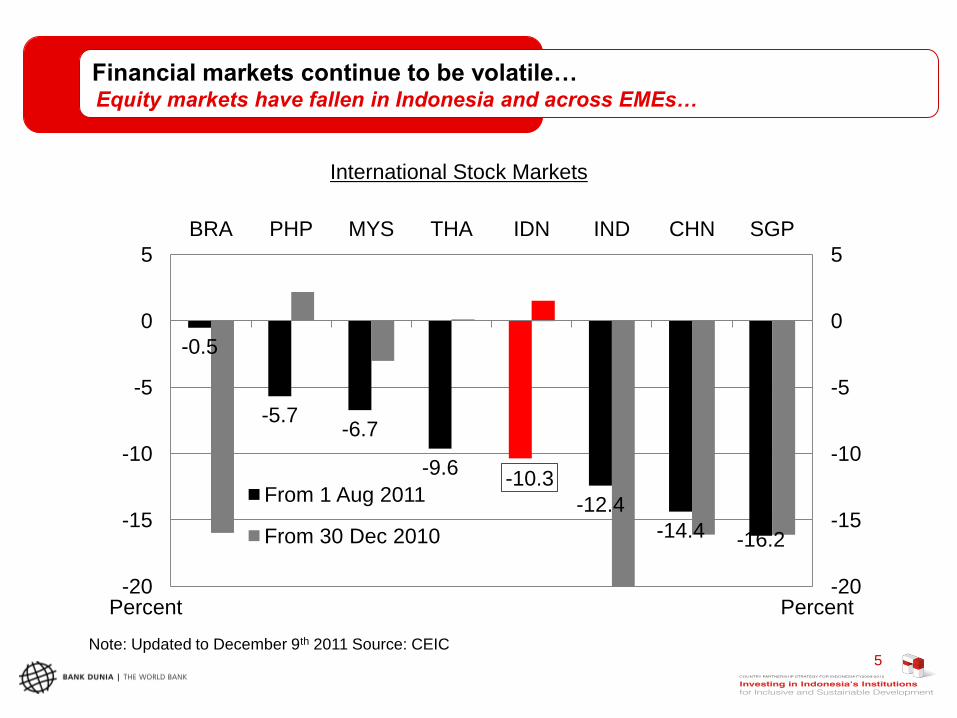
International Stock Markets
Note: Updated to December 9th 2011 Source: CEIC 5
Financial markets continue to be volatile…
Equity markets have fallen in Indonesia and across EMEs…
-0.5
-5.7 -6.7
-9.6 -10.3
-12.4
-14.4 -16.2
-20
-15
-10
-5
0
5
-20
-15
-10
-5
0
5
BRA PHP MYS THA IDN IND CHN SGP
From 1 Aug 2011
From 30 Dec 2010
Percent Percent
Note: Updated December 9th 2011 Sources: CEIC and World Bank
5
6
7
8
9
10
75
80
85
90
95
100
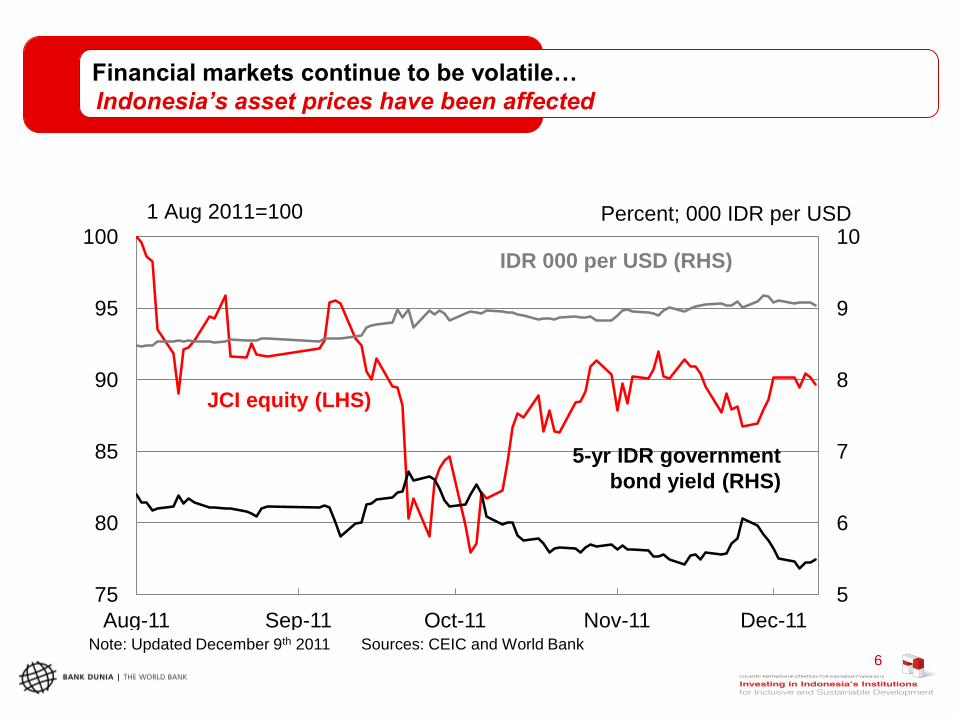
Aug-11 Sep-11 Oct-11 Nov-11 Dec-11
JCI equity (LHS)
IDR 000 per USD (RHS)
5-yr IDR government
bond yield (RHS)
1 Aug 2011=100 Percent; 000 IDR per USD
6
Financial markets continue to be volatile…
Indonesia’s asset prices have been affected
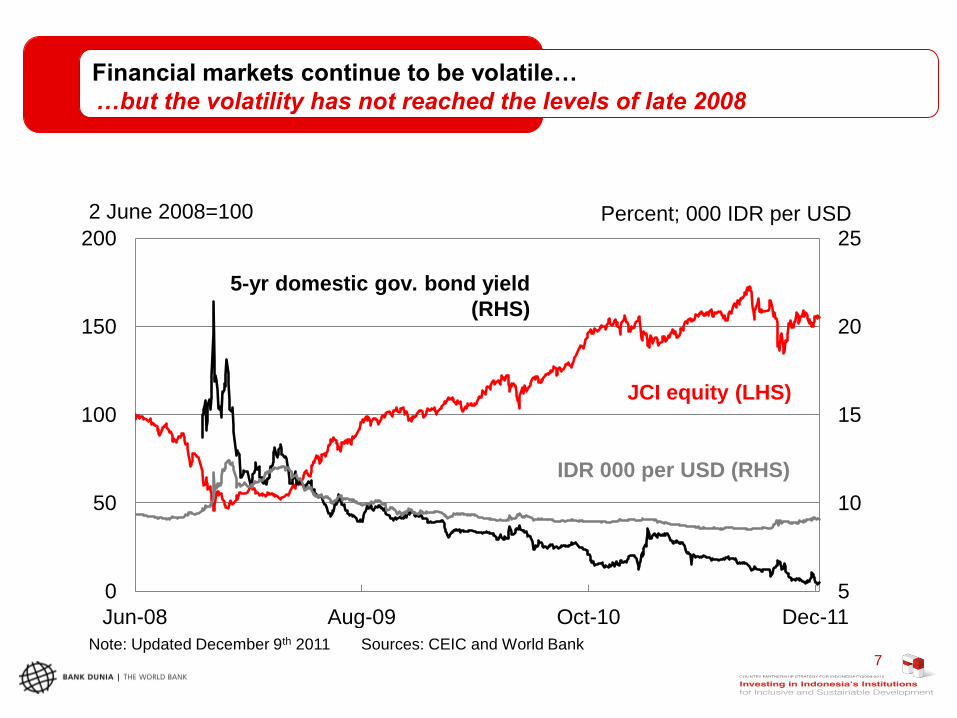
Note: Updated December 9th 2011 Sources: CEIC and World Bank
5
10
15
20
25
0
50
100
150
200
Jun-08 Aug-09 Oct-10 Dec-11
JCI equity (LHS)
IDR 000 per USD (RHS)
5-yr domestic gov. bond yield
(RHS)
2 June 2008=100 Percent; 000 IDR per USD
7
Financial markets continue to be volatile…
…but the volatility has not reached the levels of late 2008
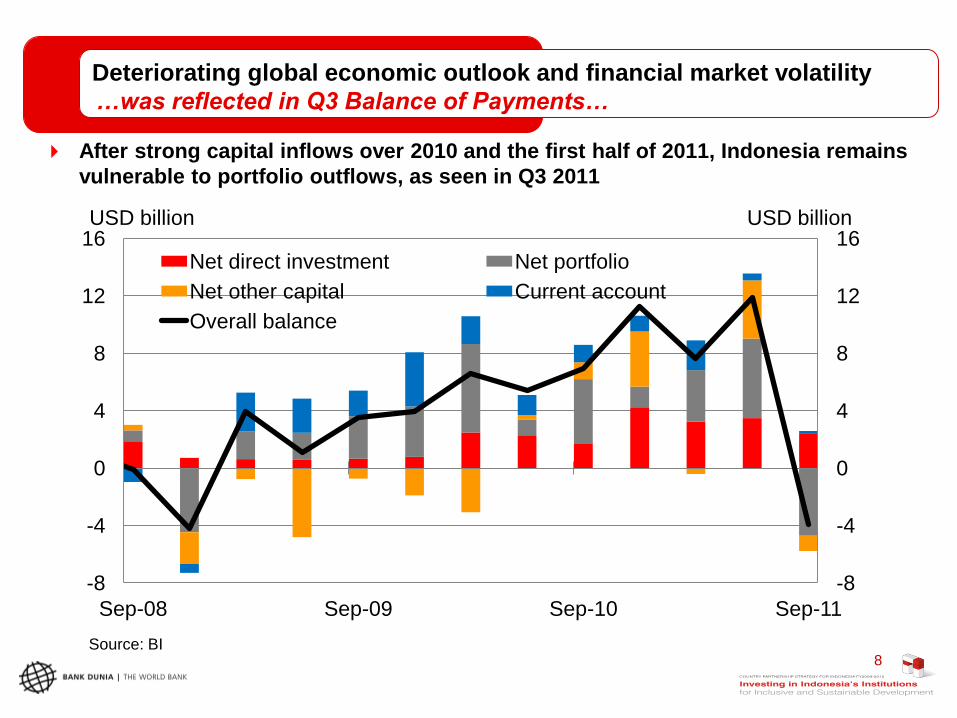
After strong capital inflows over 2010 and the first half of 2011, Indonesia remains
vulnerable to portfolio outflows, as seen in Q3 2011
Source: BI
-8
-4
0
4
8
12
16
-8
-4
0
4
8
12
16
Sep-08 Sep-09 Sep-10 Sep-11
Net direct investment Net portfolio
Net other capital Current account
Overall balance
USD billion USD billion
8
Deteriorating global economic outlook and financial market volatility
…was reflected in Q3 Balance of Payments…
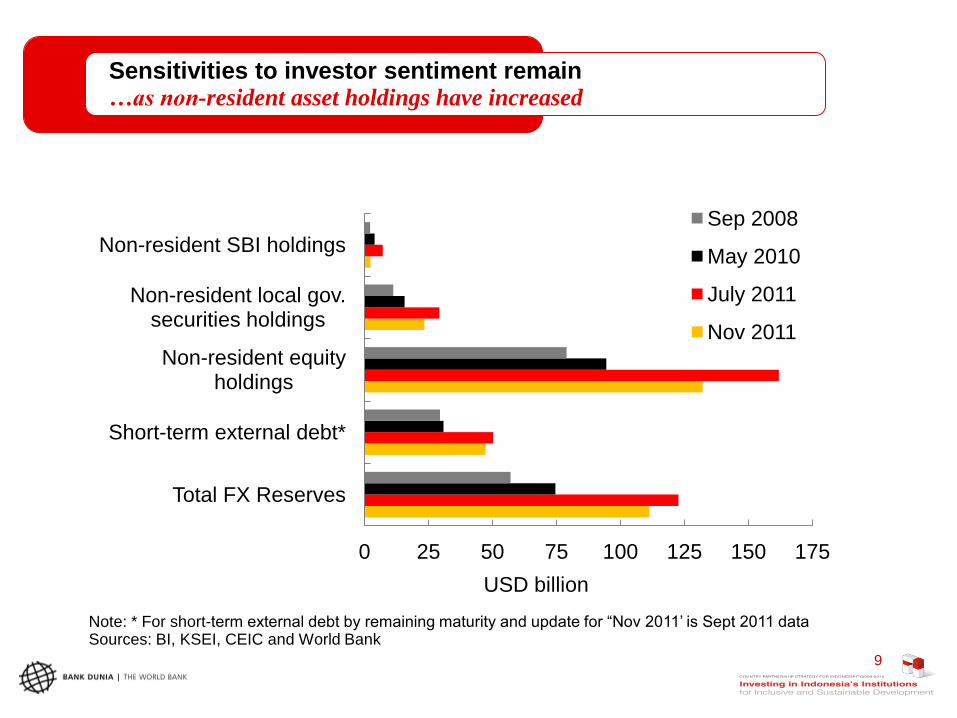
Note: * For short-term external debt by remaining maturity and update for “Nov 2011’ is Sept 2011 data Sources: BI, KSEI, CEIC and World Bank
Sensitivities to investor sentiment remain …as non-resident asset holdings have increased
9
0 25 50 75 100 125 150 175
Total FX Reserves
Short-term external debt*
Non-resident equity holdings
Non-resident local gov. securities holdings
Non-resident SBI holdings
Sep 2008
May 2010
July 2011
Nov 2011
USD billion
10
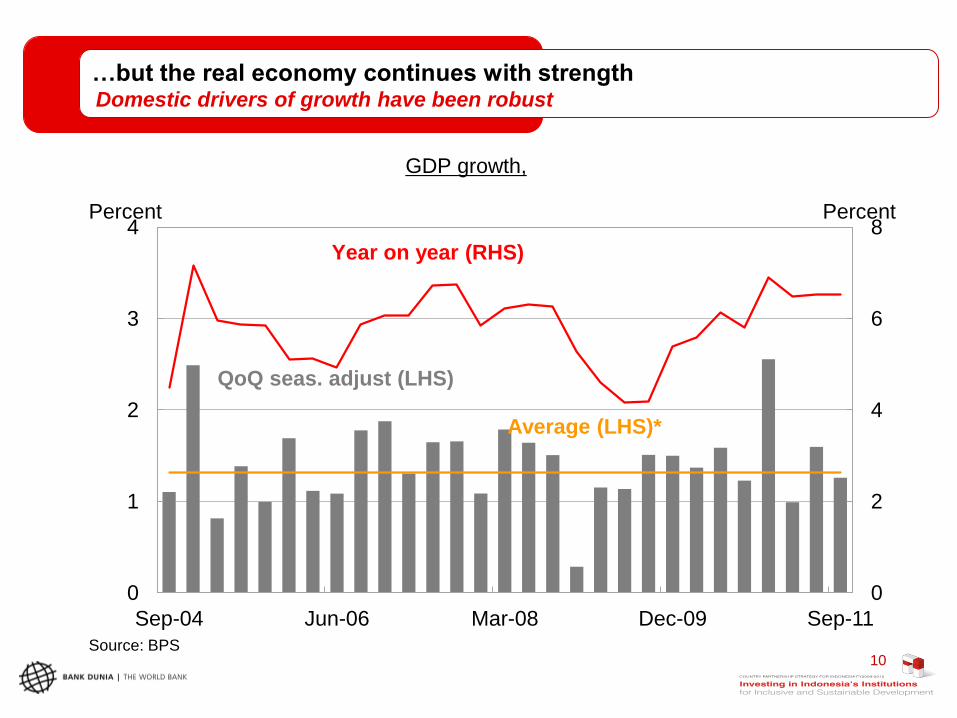
…but the real economy continues with strength
Source: BPS
Domestic drivers of growth have been robust
0
2
4
6
8
0
1
2
3
4
Sep-04 Jun-06 Mar-08 Dec-09 Sep-11
Percent Percent
QoQ seas. adjust (LHS)
Year on year (RHS)
Average (LHS)*
GDP growth,
11
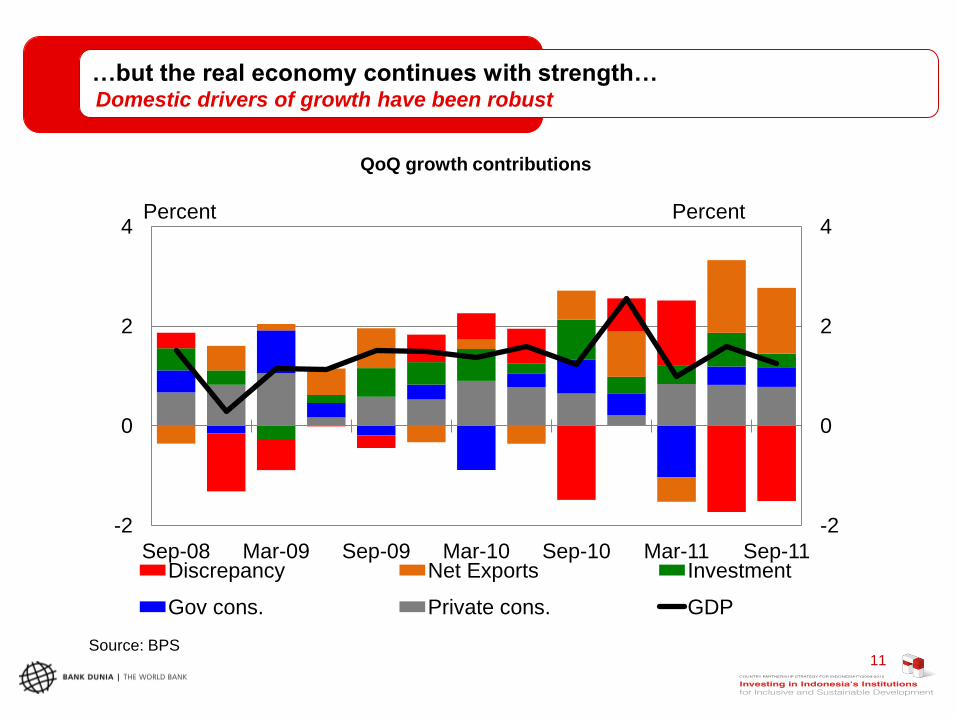
…but the real economy continues with strength…
Source: BPS
QoQ growth contributions
Domestic drivers of growth have been robust
-2
0
2
4
-2
0
2
4
Sep-08 Mar-09 Sep-09 Mar-10 Sep-10 Mar-11 Sep-11 Discrepancy Net Exports Investment
Gov cons. Private cons. GDP
Percent Percent
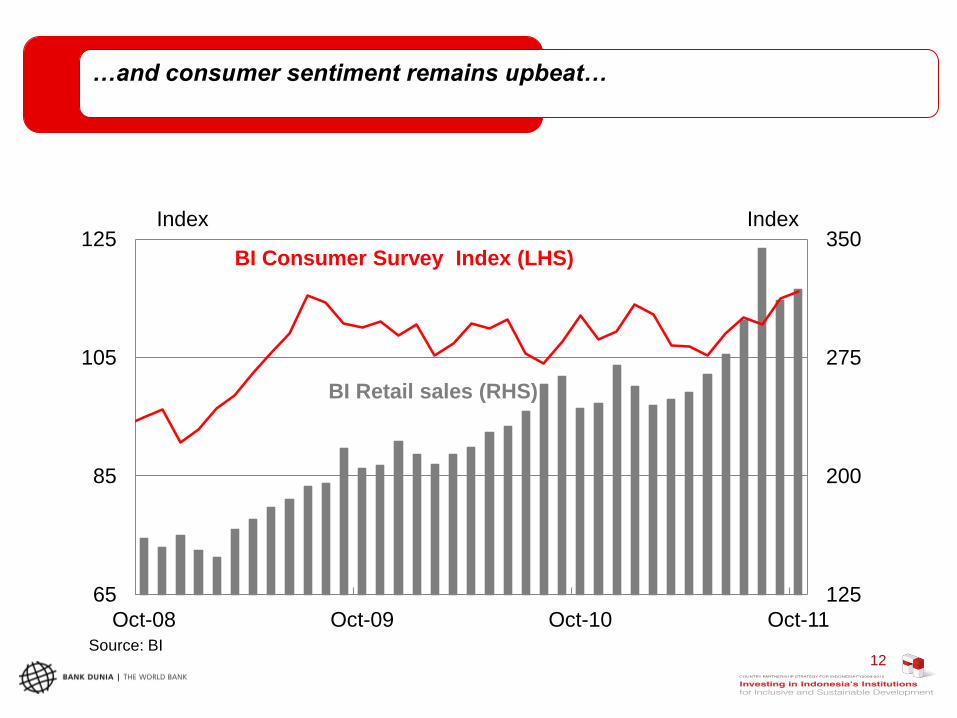
Source: BI
125
200
275
350
65
85
105
125
Oct-08 Oct-09 Oct-10 Oct-11
Index Index
BI Retail sales (RHS)
BI Consumer Survey Index (LHS)
…and consumer sentiment remains upbeat…
12

Looking ahead: how the global economy might evolve
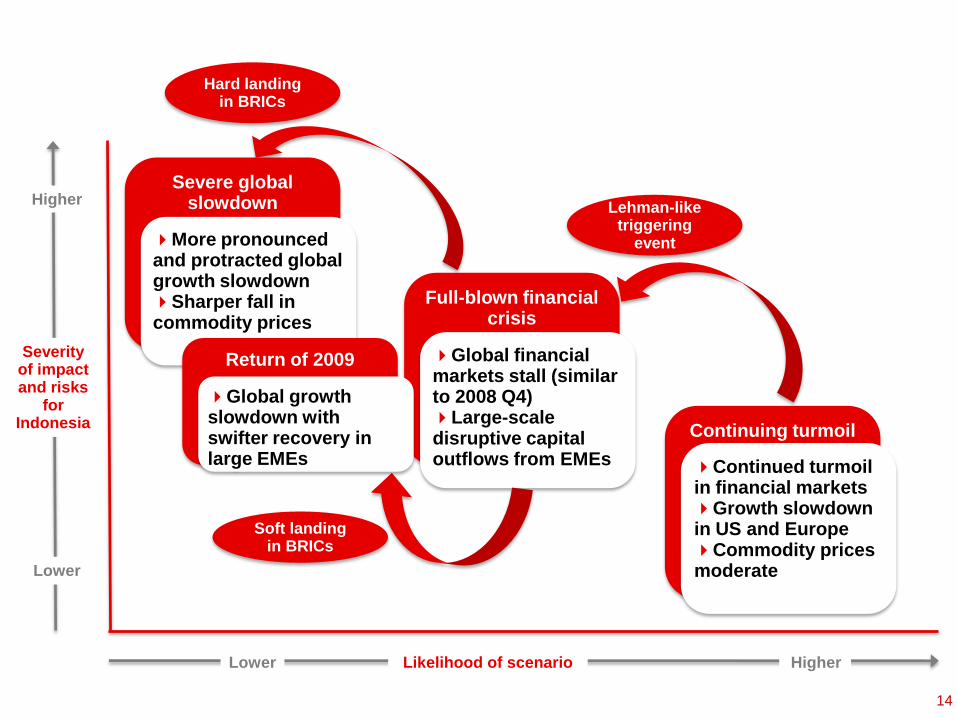
Continuing turmoil
Continued turmoil in financial markets Growth slowdown in US and Europe Commodity prices moderate
Higher Lower
Higher
Lower
Likelihood of scenario
Severity of impact and risks
for Indonesia
Full-blown financial crisis
Global financial markets stall (similar to 2008 Q4) Large-scale disruptive capital outflows from EMEs
Lehman-like triggering
event
Hard landing in BRICs
Severe global slowdown
More pronounced and protracted global growth slowdown Sharper fall in commodity prices
Soft landing in BRICs
Return of 2009
Global growth slowdown with swifter recovery in large EMEs
14
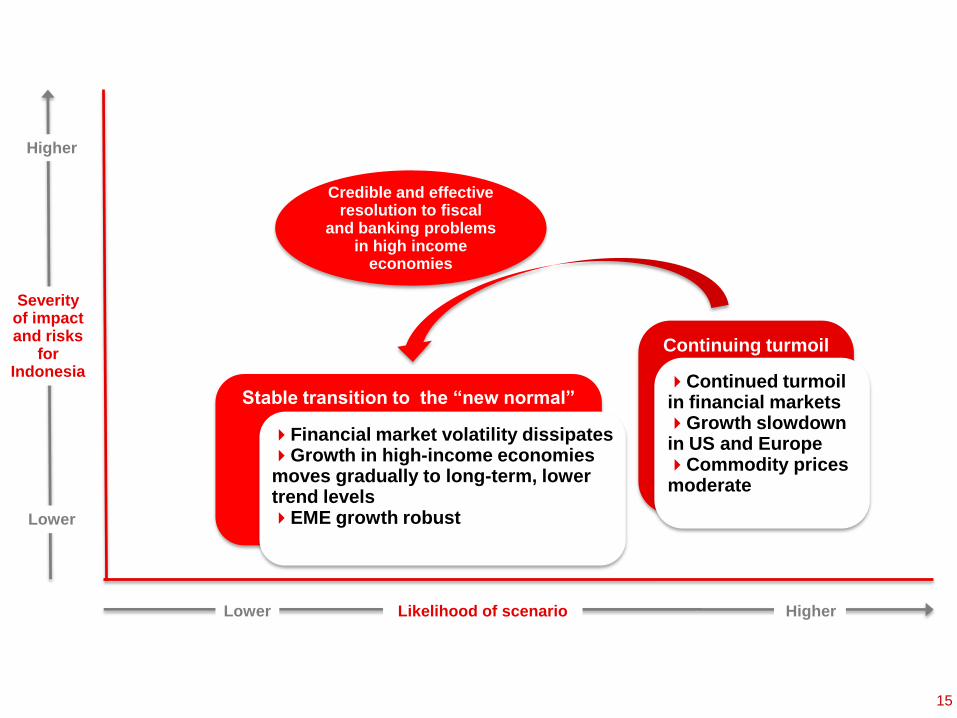
Continuing turmoil
Continued turmoil in financial markets Growth slowdown in US and Europe Commodity prices moderate
Higher Lower
Higher
Lower
Likelihood of scenario
Severity of impact and risks
for Indonesia
Stable transition to the “new normal”
Financial market volatility dissipates Growth in high-income economies moves gradually to long-term, lower trend levels EME growth robust
Credible and effective resolution to fiscal
and banking problems in high income
economies
15

Note: 2011 and 2012 are projections. Real ratio of investment to GDP. Terms of trade series is constructed by World Bank from monthly trade data Source: CEIC and World Bank staff projections
Previous
outcomes
Scenario 1:
baseline
Scenario 2:
possible
Scenario 3:
less likely
Ongoing
international
financial
turmoil
Global
financial crisis
and 2009-like
outcome
Severe global
slowdown
2008
2009 2010 2011 2012 2011 2012 2011 2012
Indonesian GDP
growth (percent) 6.0 4.6 6.1 6.4 6.2 6.3 5.5 6.3 4.1
Scenario assumptions:
Investment/GDP ratio
(percent) 23.7 23.4 24.0 24.5 25.3 24.5 24.5 24.5 23.6
Major trading partner
GDP growth (percent) 2.0 -1.4 6.8 3.3 3.5 3.2 2.0 3.0 -1.8
Terms of trade growth
(percent) -18.1 -4.2 5.3 10.0 0.0 8.0 -15 7.0 -30.0
The impact of the global scenarios …could be sizeable but solid growth is likely
16
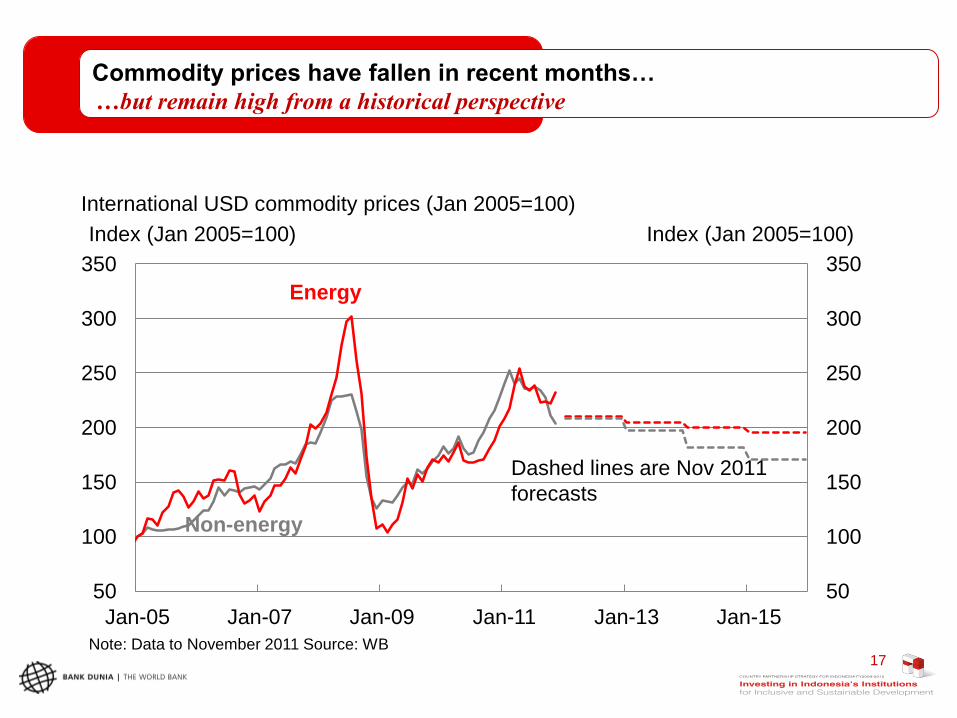
Note: Data to November 2011 Source: WB
International USD commodity prices (Jan 2005=100)
50
100
150
200
250
300
350
50
100
150
200
250
300
350
Jan-05 Jan-07 Jan-09 Jan-11 Jan-13 Jan-15
Energy
Non-energy
Index (Jan 2005=100)
Dashed lines are Nov 2011
forecasts
Index (Jan 2005=100)
17
Commodity prices have fallen in recent months…
…but remain high from a historical perspective
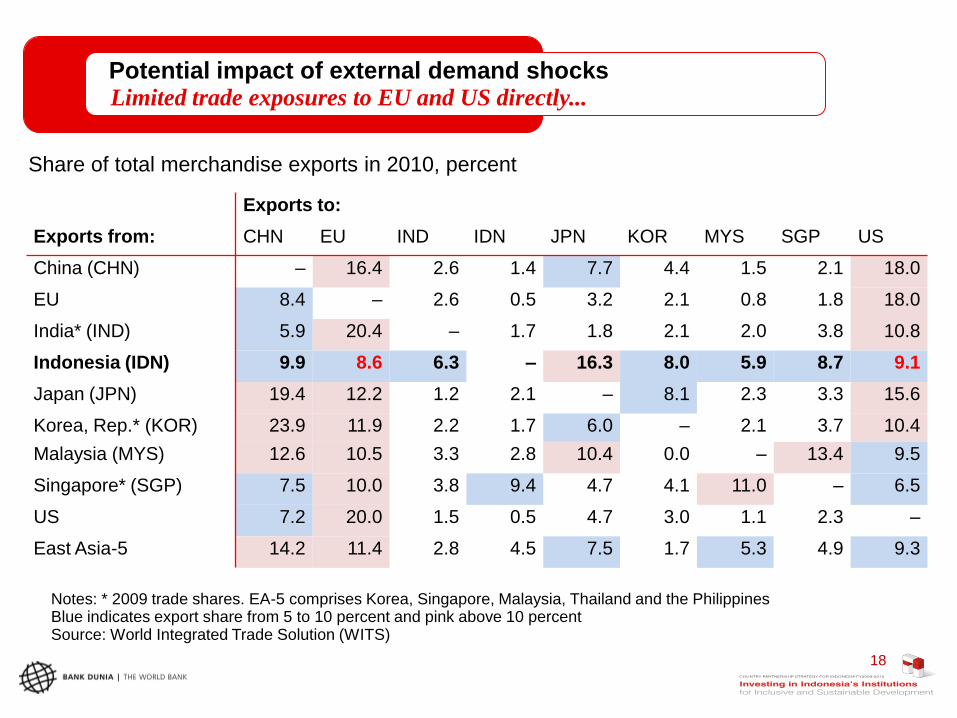
Potential impact of external demand shocks
Limited trade exposures to EU and US directly...
Notes: * 2009 trade shares. EA-5 comprises Korea, Singapore, Malaysia, Thailand and the Philippines Blue indicates export share from 5 to 10 percent and pink above 10 percent Source: World Integrated Trade Solution (WITS)
Exports to:
Exports from: CHN EU IND IDN JPN KOR MYS SGP US
China (CHN) – 16.4 2.6 1.4 7.7 4.4 1.5 2.1 18.0
EU 8.4 – 2.6 0.5 3.2 2.1 0.8 1.8 18.0
India* (IND) 5.9 20.4 – 1.7 1.8 2.1 2.0 3.8 10.8
Indonesia (IDN) 9.9 8.6 6.3 – 16.3 8.0 5.9 8.7 9.1
Japan (JPN) 19.4 12.2 1.2 2.1 – 8.1 2.3 3.3 15.6
Korea, Rep.* (KOR) 23.9 11.9 2.2 1.7 6.0 – 2.1 3.7 10.4
Malaysia (MYS) 12.6 10.5 3.3 2.8 10.4 0.0 – 13.4 9.5
Singapore* (SGP) 7.5 10.0 3.8 9.4 4.7 4.1 11.0 – 6.5
US 7.2 20.0 1.5 0.5 4.7 3.0 1.1 2.3 –
East Asia-5 14.2 11.4 2.8 4.5 7.5 1.7 5.3 4.9 9.3
Share of total merchandise exports in 2010, percent
18
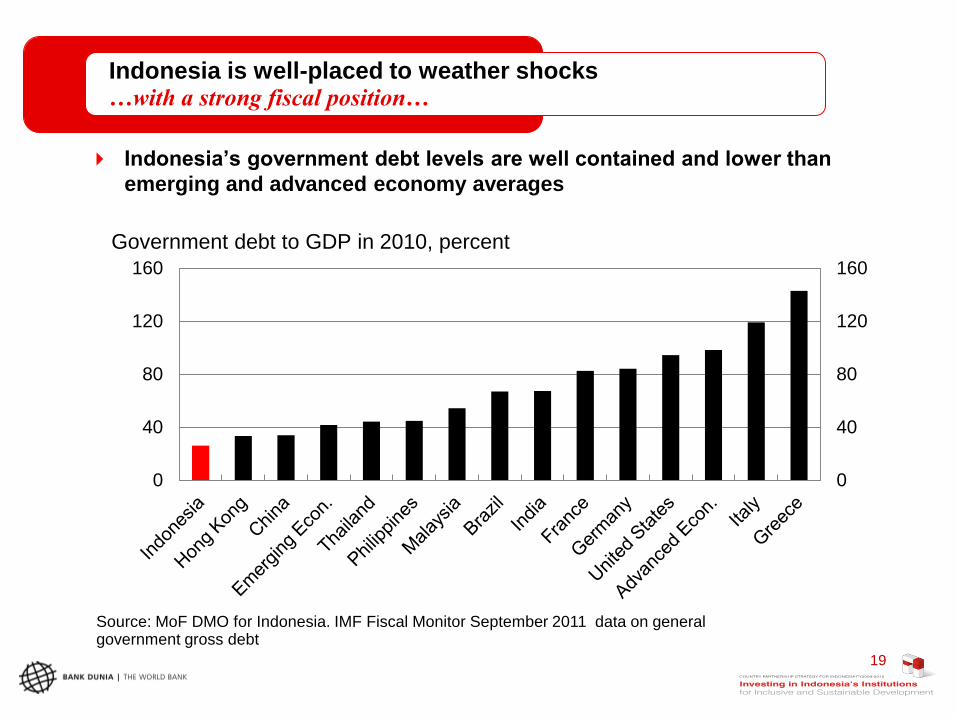
Source: MoF DMO for Indonesia. IMF Fiscal Monitor September 2011 data on general government gross debt
Indonesia’s government debt levels are well contained and lower than
emerging and advanced economy averages
0
40
80
120
160
0
40
80
120
160
Government debt to GDP in 2010, percent
Indonesia is well-placed to weather shocks …with a strong fiscal position…
19
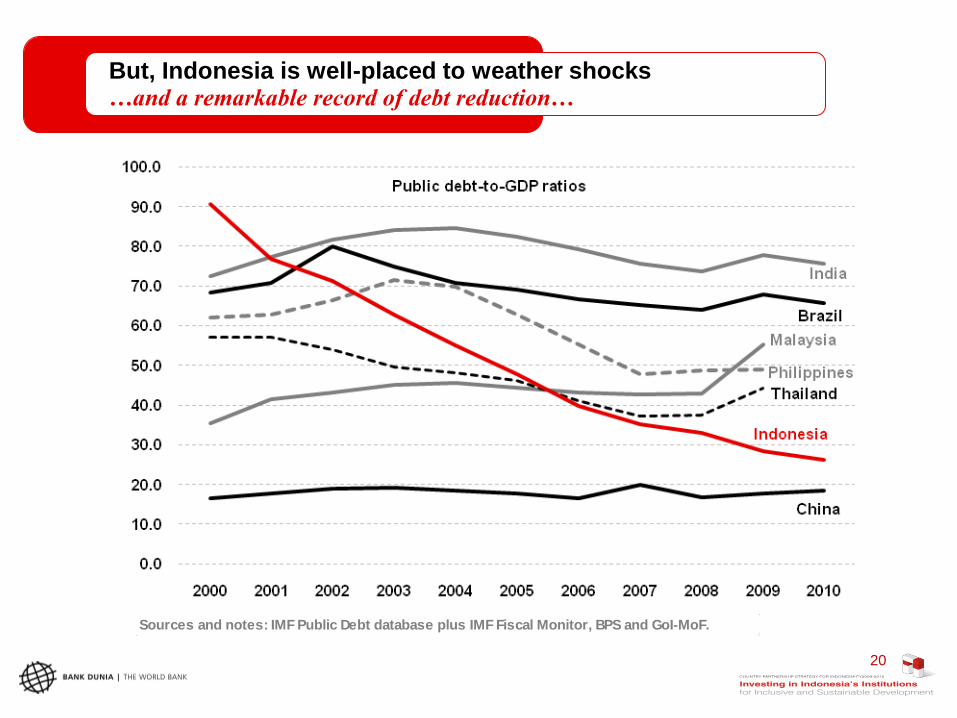
Sources and notes: IMF Public Debt database plus IMF Fiscal Monitor, BPS and GoI-MoF.
But, Indonesia is well-placed to weather shocks …and a remarkable record of debt reduction…
20
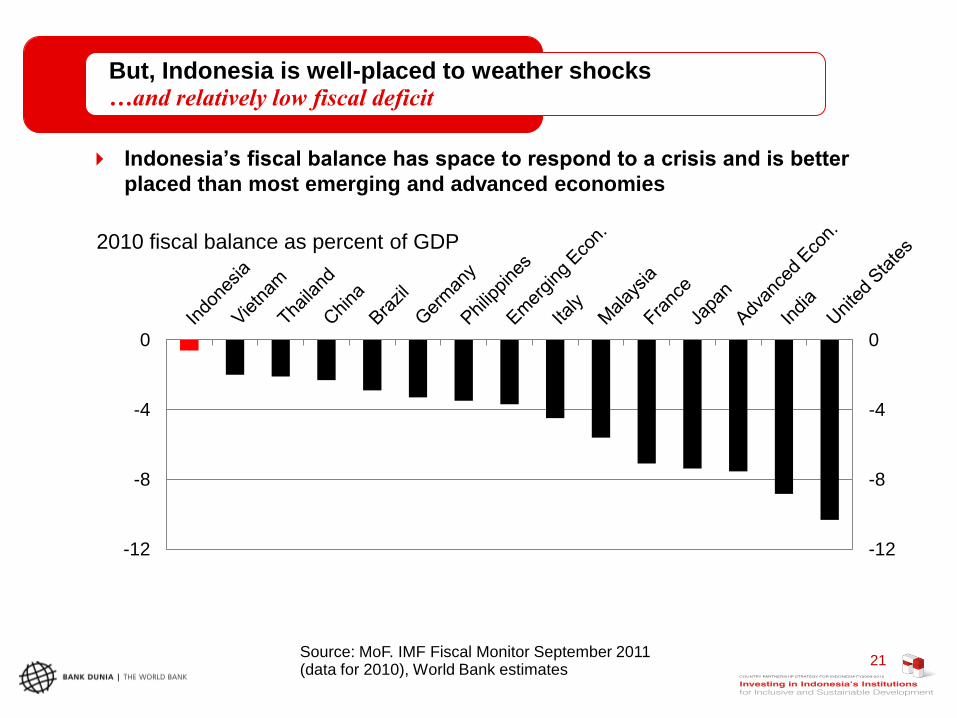
Source: MoF. IMF Fiscal Monitor September 2011 (data for 2010), World Bank estimates
Indonesia’s fiscal balance has space to respond to a crisis and is better
placed than most emerging and advanced economies
-12
-8
-4
0
-12
-8
-4
0
2010 fiscal balance as percent of GDP
But, Indonesia is well-placed to weather shocks …and relatively low fiscal deficit
21
Looking ahead: enhancing preparedness to ensure resilience
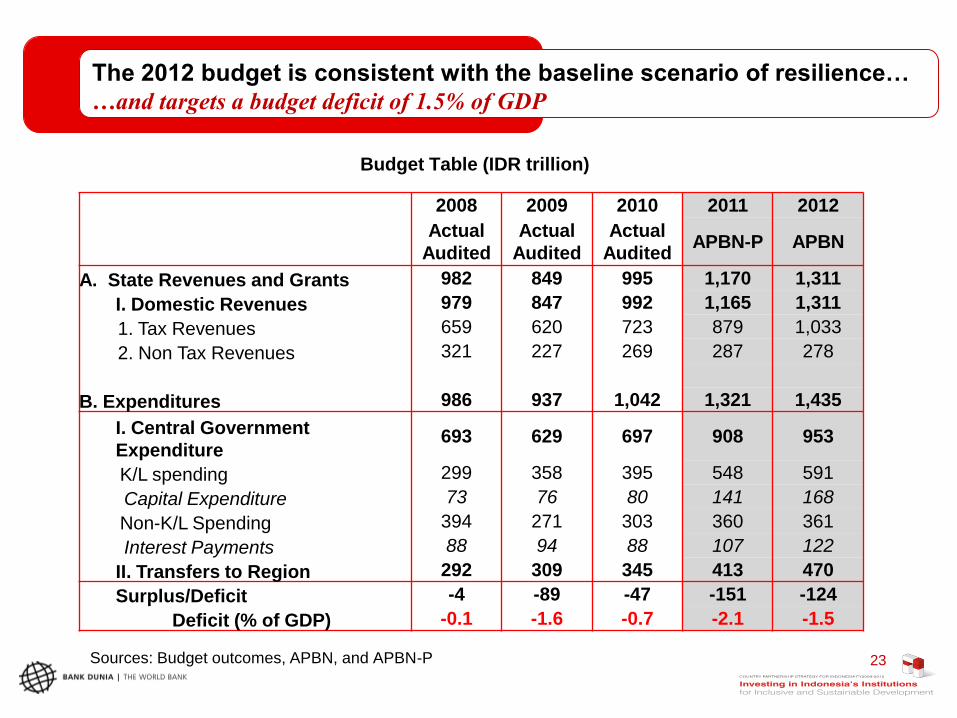
23 Sources: Budget outcomes, APBN, and APBN-P
Budget Table (IDR trillion)
The 2012 budget is consistent with the baseline scenario of resilience…
…and targets a budget deficit of 1.5% of GDP
2008 2009 2010 2011 2012
Actual
Audited
Actual
Audited
Actual
Audited APBN-P APBN
A. State Revenues and Grants 982 849 995 1,170 1,311
I. Domestic Revenues 979 847 992 1,165 1,311
1. Tax Revenues 659 620 723 879 1,033
2. Non Tax Revenues 321 227 269 287 278
B. Expenditures 986 937 1,042 1,321 1,435
I. Central Government
Expenditure 693 629 697 908 953
K/L spending 299 358 395 548 591
Capital Expenditure 73 76 80 141 168
Non-K/L Spending 394 271 303 360 361
Interest Payments 88 94 88 107 122
II. Transfers to Region 292 309 345 413 470
Surplus/Deficit -4 -89 -47 -151 -124
Deficit (% of GDP) -0.1 -1.6 -0.7 -2.1 -1.5
24
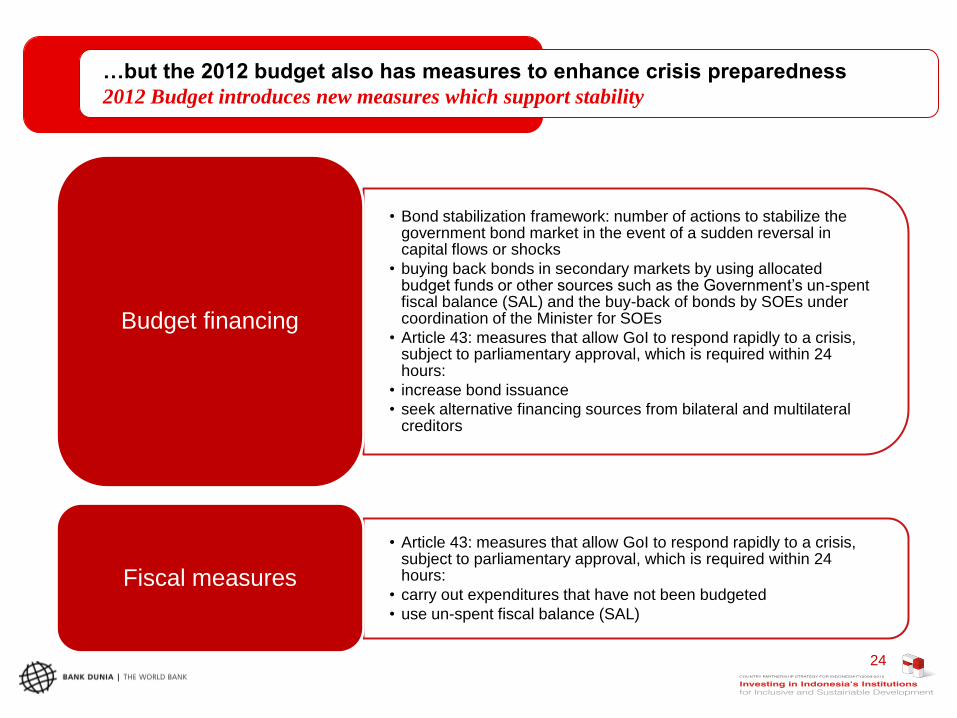
…but the 2012 budget also has measures to enhance crisis preparedness
2012 Budget introduces new measures which support stability
• Bond stabilization framework: number of actions to stabilize the government bond market in the event of a sudden reversal in capital flows or shocks
• buying back bonds in secondary markets by using allocated budget funds or other sources such as the Government’s un-spent fiscal balance (SAL) and the buy-back of bonds by SOEs under coordination of the Minister for SOEs
• Article 43: measures that allow GoI to respond rapidly to a crisis, subject to parliamentary approval, which is required within 24 hours:
• increase bond issuance
• seek alternative financing sources from bilateral and multilateral creditors
Budget financing
• Article 43: measures that allow GoI to respond rapidly to a crisis, subject to parliamentary approval, which is required within 24 hours:
• carry out expenditures that have not been budgeted
• use un-spent fiscal balance (SAL)
Fiscal measures
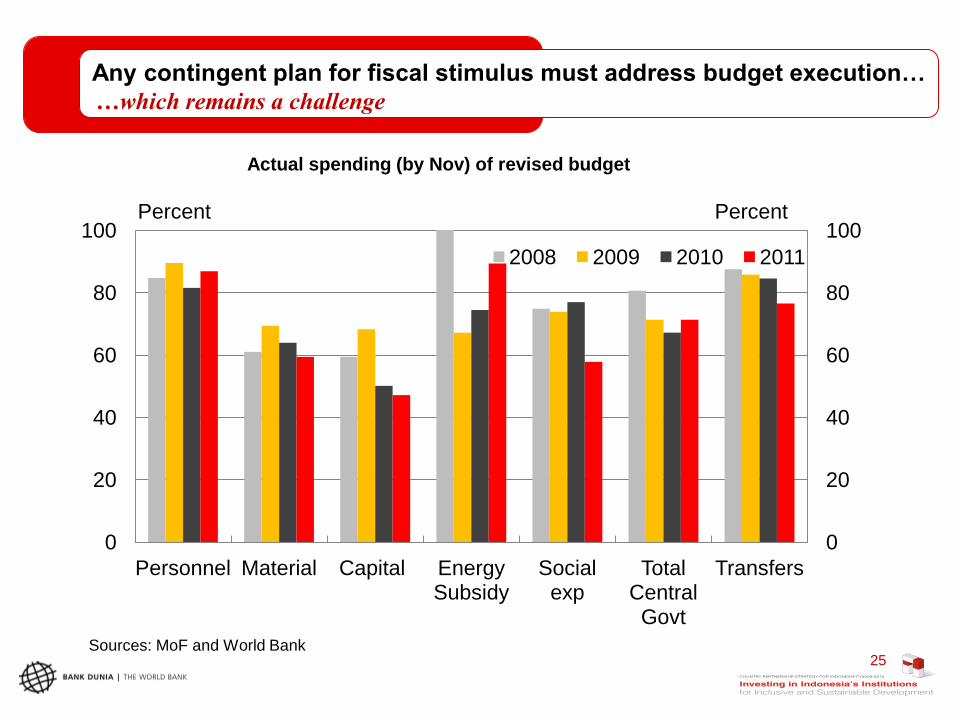
Any contingent plan for fiscal stimulus must address budget execution…
Sources: MoF and World Bank
Actual spending (by Nov) of revised budget
…which remains a challenge
0
20
40
60
80
100
0
20
40
60
80
100
Personnel Material Capital Energy Subsidy
Social exp
Total Central
Govt
Transfers
2008 2009 2010 2011
Percent Percent
25
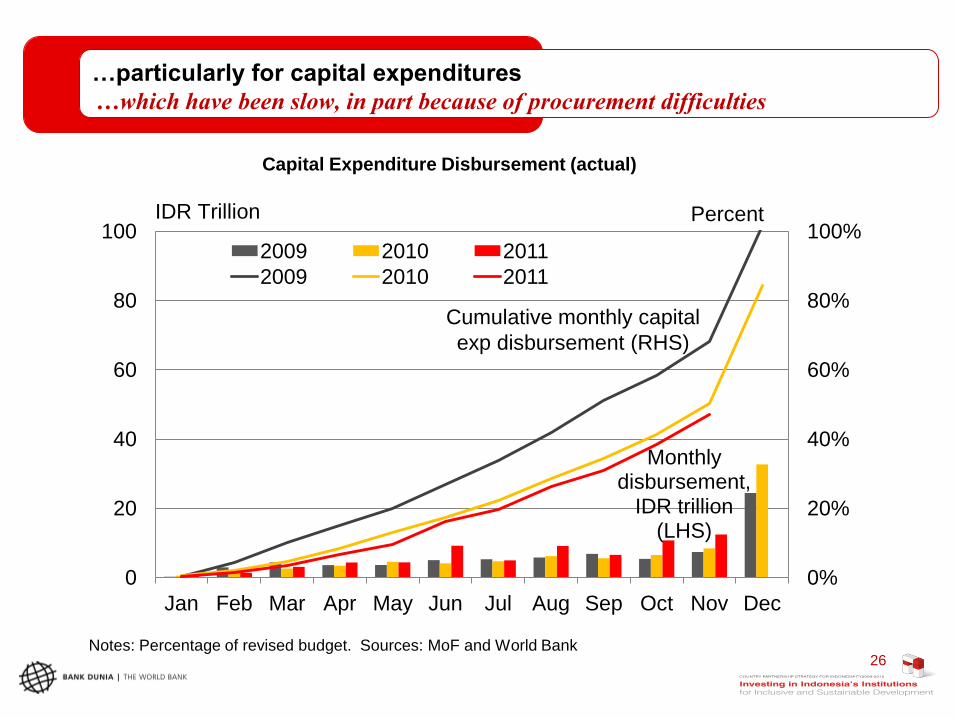
…particularly for capital expenditures
Notes: Percentage of revised budget. Sources: MoF and World Bank
Capital Expenditure Disbursement (actual)
…which have been slow, in part because of procurement difficulties
Monthly disbursement,
IDR trillion (LHS)
0%
20%
40%
60%
80%
100%
0
20
40
60
80
100
Jan Feb Mar Apr May Jun Jul Aug Sep Oct Nov Dec
2009 2010 2011
2009 2010 2011
IDR Trillion
Percent
Cumulative monthly capital
exp disbursement (RHS)
26
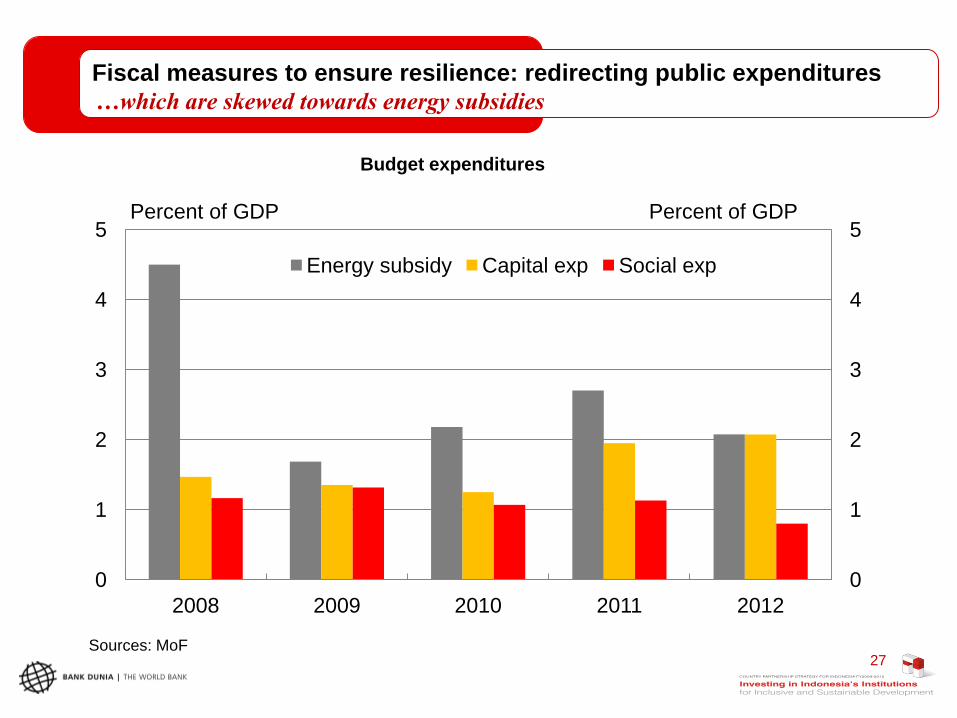
Fiscal measures to ensure resilience: redirecting public expenditures
Sources: MoF
Budget expenditures
…which are skewed towards energy subsidies
0
1
2
3
4
5
0
1
2
3
4
5
2008 2009 2010 2011 2012
Energy subsidy Capital exp Social exp
Percent of GDP Percent of GDP
27
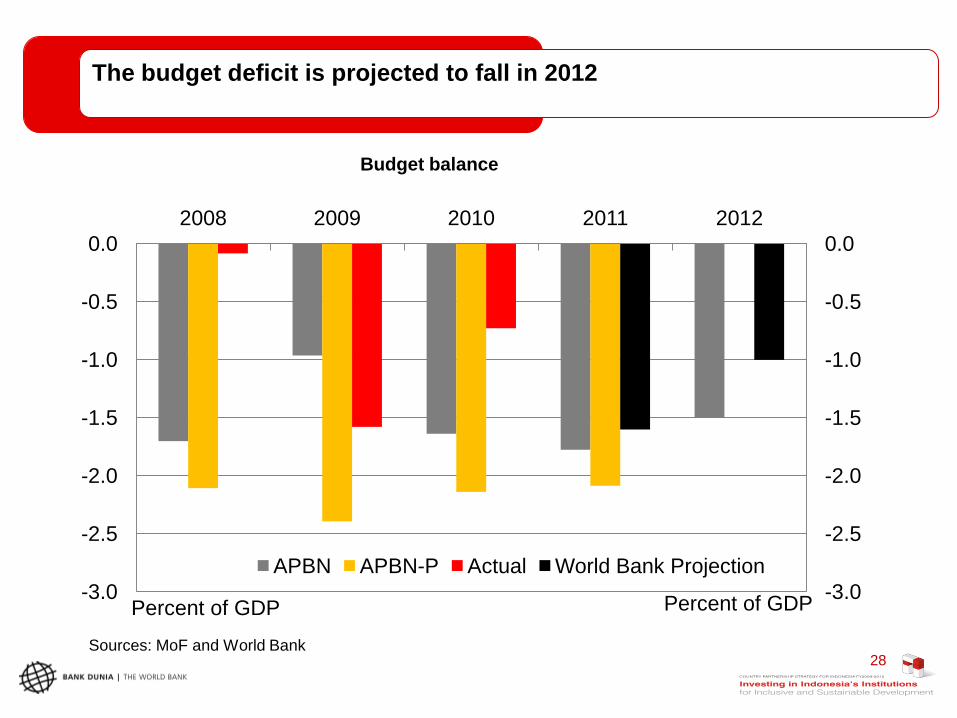
The budget deficit is projected to fall in 2012
Sources: MoF and World Bank
Budget balance
-3.0
-2.5
-2.0
-1.5
-1.0
-0.5
0.0
-3.0
-2.5
-2.0
-1.5
-1.0
-0.5
0.0
2008 2009 2010 2011 2012
APBN APBN-P Actual World Bank Projection
Percent of GDP Percent of GDP
28
Policies to enhance preparedness to ensure resilience
Robust contingency planning is critical
29
Currently, under the baseline scenario, no need for immediate emergency measures…
…in fact important to avoid policy missteps and hasty measures that might send the
wrong signal in a fragile market environment
But critical to prepare for more adverse crisis scenarios by:
revisiting and rehearsing financial crisis management protocols, and putting in place
needed financial stability regulations
considering contingent budget financing to support critical public expenditures
preparing contingent plans for fiscal stimulus measures to support growth
preparing contingent plans for social assistance measures to cushion poor and low-
income households adversely affected by economic shocks
…and also important to continue to push forward on key structural reforms
To enhance long-term growth prospects AND support investor confidence
To improve domestic competitiveness to help in adjustment to appreciation with likely
resumption of capital inflows over the medium-term
Policies to enhance preparedness to ensure resilience
Structural reforms to maintain and enhance competitiveness
30
Manufacturing sector, perhaps more than any other, is likely to come under stress in the
event of a global economic slowdown
Manufacturing sector, in the last decade, has experienced a growth recession…
…and though there are signs of a pick-up, will be particularly important to take steps to
enhance the competitiveness of the manufacturing sector so as to enable it to contribute to
both growth and high value-added job creation
Key to both ensuring the near-term resilience and to sustainably enhancing the medium-
term competitiveness of the manufacturing sector is:
addressing infrastructure bottlenecks
reducing regulatory uncertainty and burden
Short-term measures that do not address the underlying structural impediments to the
competitiveness of Indonesia’s manufacturing sector are unlikely to lead to sustained
Revitalizing and enhancing the competitiveness of the
Indonesian manufacturing sector
Sjamsu Rahardja Indonesia Senior Trade Economist
World Bank
32
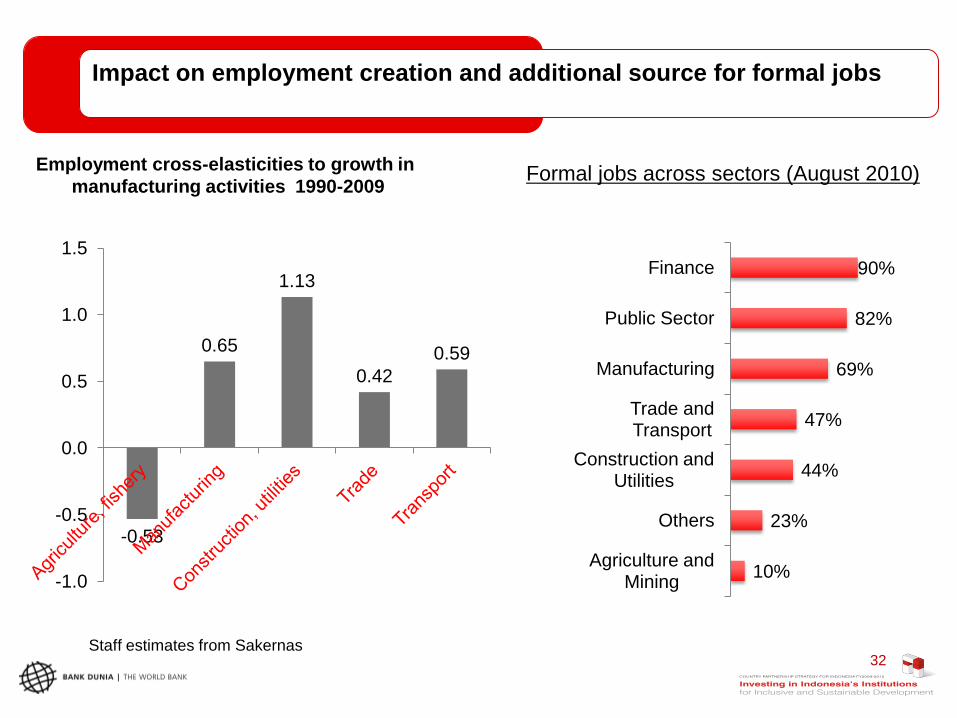
Impact on employment creation and additional source for formal jobs
Staff estimates from Sakernas
Employment cross-elasticities to growth in
manufacturing activities 1990-2009
-0.53
0.65
1.13
0.42
0.59
-1.0
-0.5
0.0
0.5
1.0
1.5 90%
82%
69%
47%
44%
23%
10%
Finance
Public Sector
Manufacturing
Trade and Transport
Construction and Utilities
Others
Agriculture and Mining
Formal jobs across sectors (August 2010)
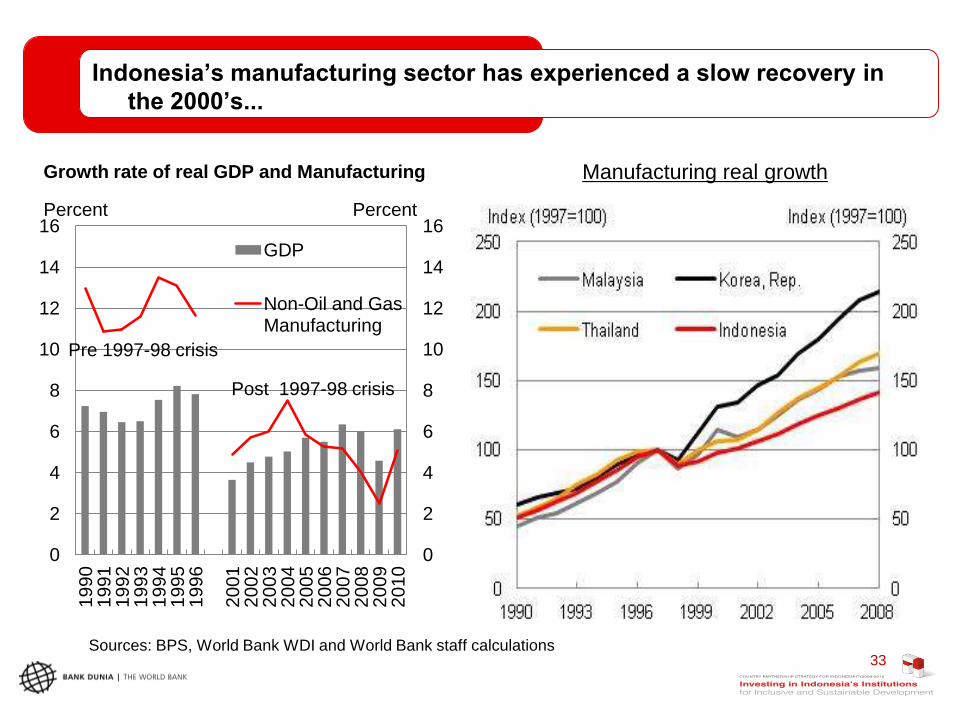
Indonesia’s manufacturing sector has experienced a slow recovery in
the 2000’s...
Sources: BPS, World Bank WDI and World Bank staff calculations
Growth rate of real GDP and Manufacturing
0
2
4
6
8
10
12
14
16
0
2
4
6
8
10
12
14
16
1990
1991
1992
1993
1994
1995
1996
2001
2002
2003
2004
2005
2006
2007
2008
2009
2010
GDP
Non-Oil and Gas Manufacturing
Pre 1997-98 crisis
Post 1997-98 crisis
Percent Percent
Manufacturing real growth
33
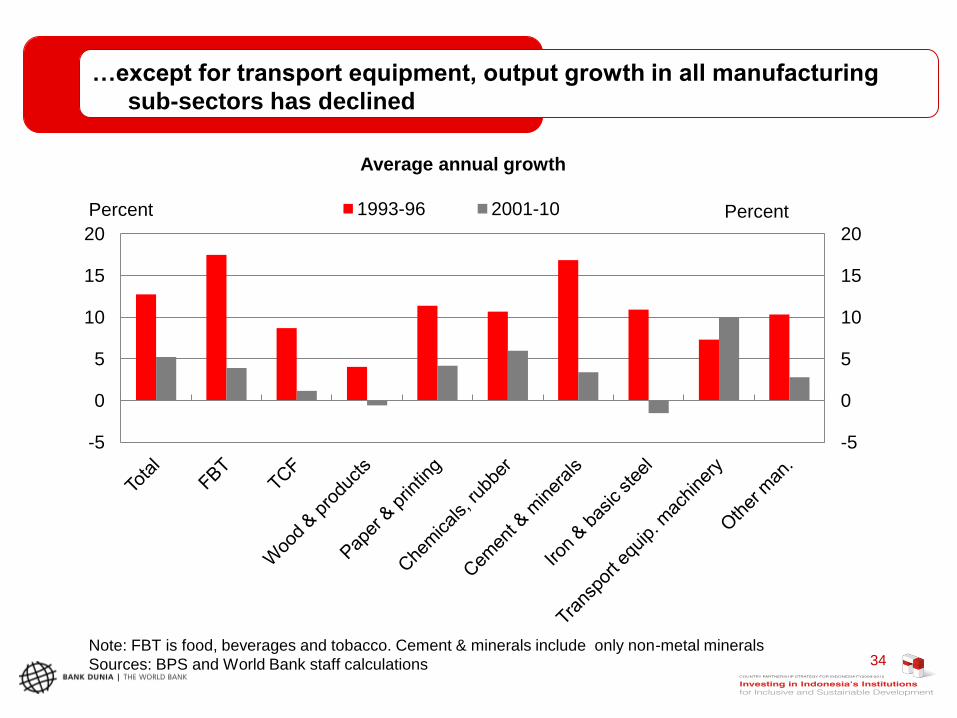
…except for transport equipment, output growth in all manufacturing
sub-sectors has declined
Note: FBT is food, beverages and tobacco. Cement & minerals include only non-metal minerals
Sources: BPS and World Bank staff calculations
Average annual growth
-5
0
5
10
15
20
-5
0
5
10
15
20
1993-96 2001-10 Percent Percent
34
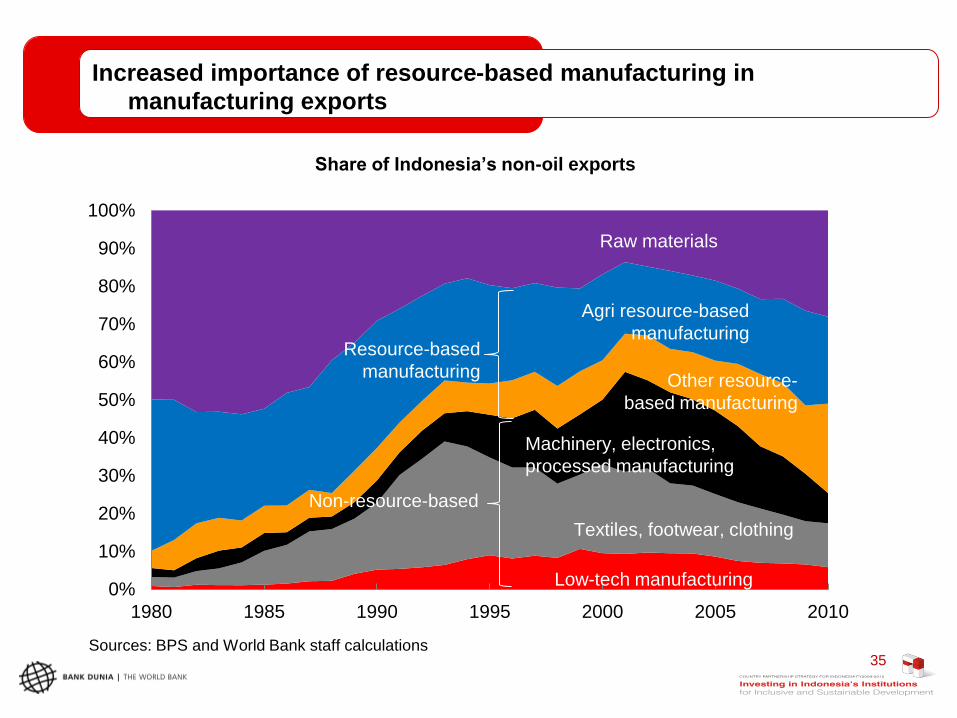
Increased importance of resource-based manufacturing in
manufacturing exports
Sources: BPS and World Bank staff calculations
Share of Indonesia’s non-oil exports
0%
10%
20%
30%
40%
50%
60%
70%
80%
90%
100%
1980 1985 1990 1995 2000 2005 2010
Machinery, electronics,
processed manufacturing
Textiles, footwear, clothing
Low-tech manufacturing
Non-resource-based
Resource-based
manufacturing
Raw materials
Agri resource-based
manufacturing
Other resource-
based manufacturing
35
What factors explain Indonesia’s recent manufacturing sector
performance?
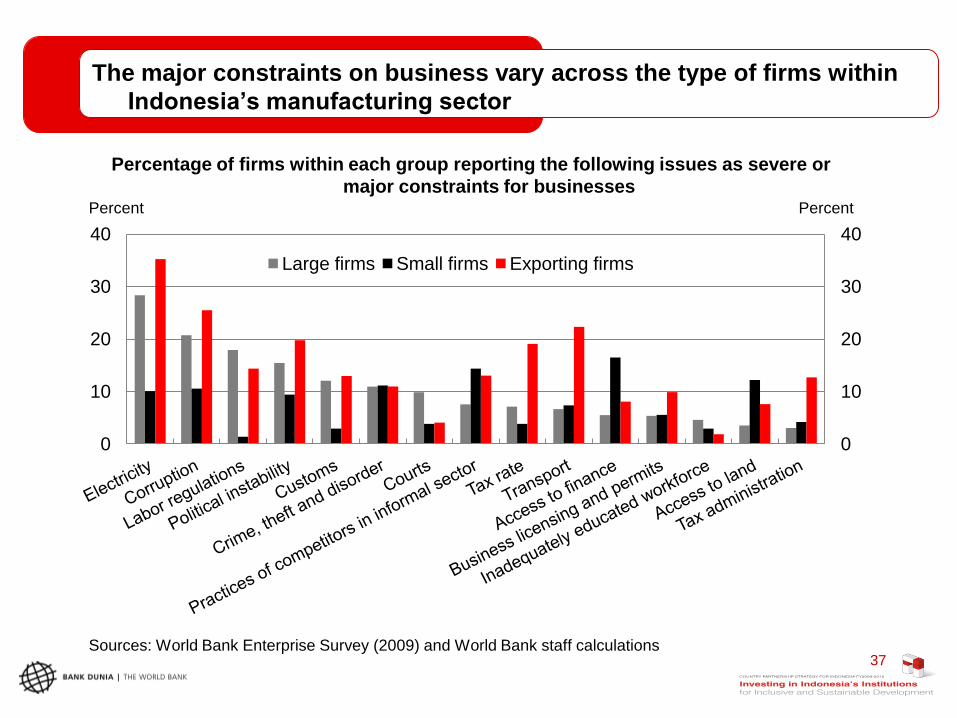
The major constraints on business vary across the type of firms within
Indonesia’s manufacturing sector
Sources: World Bank Enterprise Survey (2009) and World Bank staff calculations
Percentage of firms within each group reporting the following issues as severe or
major constraints for businesses
0
10
20
30
40
0
10
20
30
40
Large firms Small firms Exporting firms
Percent Percent
37
38
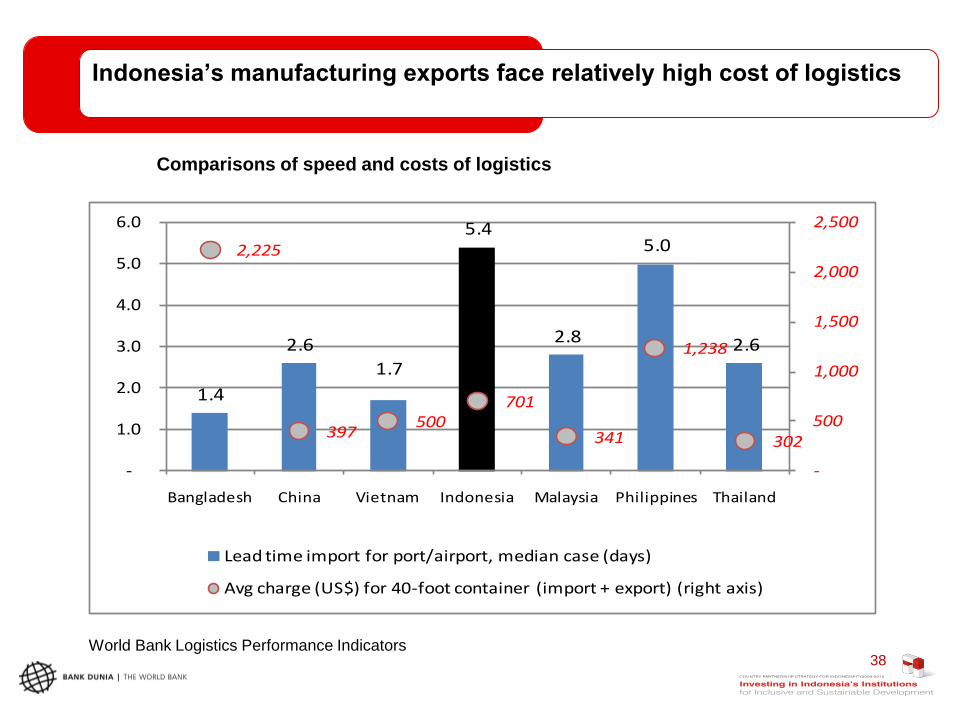
Indonesia’s manufacturing exports face relatively high cost of logistics
World Bank Logistics Performance Indicators
Comparisons of speed and costs of logistics
1.4
2.6
1.7
5.4
2.8
5.0
2.6
2,225
397 500
701
341
1,238
302
-
500
1,000
1,500
2,000
2,500
-
1.0
2.0
3.0
4.0
5.0
6.0
Bangladesh China Vietnam Indonesia Malaysia Philippines Thailand
Lead time import for port/airport, median case (days)
Avg charge (US$) for 40-foot container (import + export) (right axis)
39
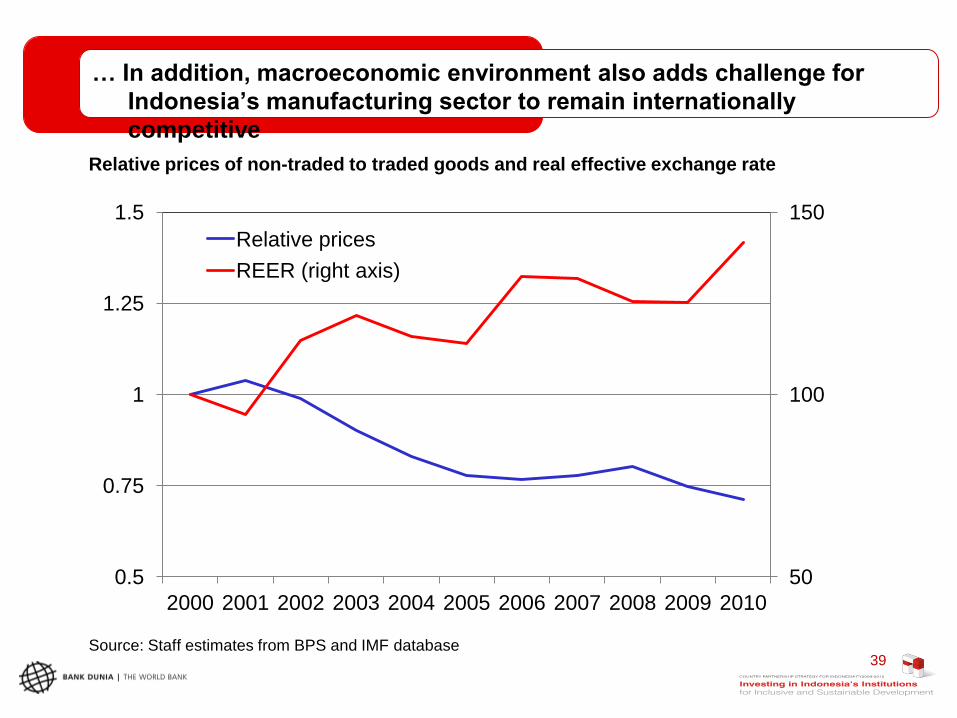
… In addition, macroeconomic environment also adds challenge for
Indonesia’s manufacturing sector to remain internationally
competitive
Source: Staff estimates from BPS and IMF database
Relative prices of non-traded to traded goods and real effective exchange rate
50
100
150
0.5
0.75
1
1.25
1.5
2000 2001 2002 2003 2004 2005 2006 2007 2008 2009 2010
Relative prices
REER (right axis)
Are we seeing renewed opportunities for Indonesia’s manufacturing
sector?
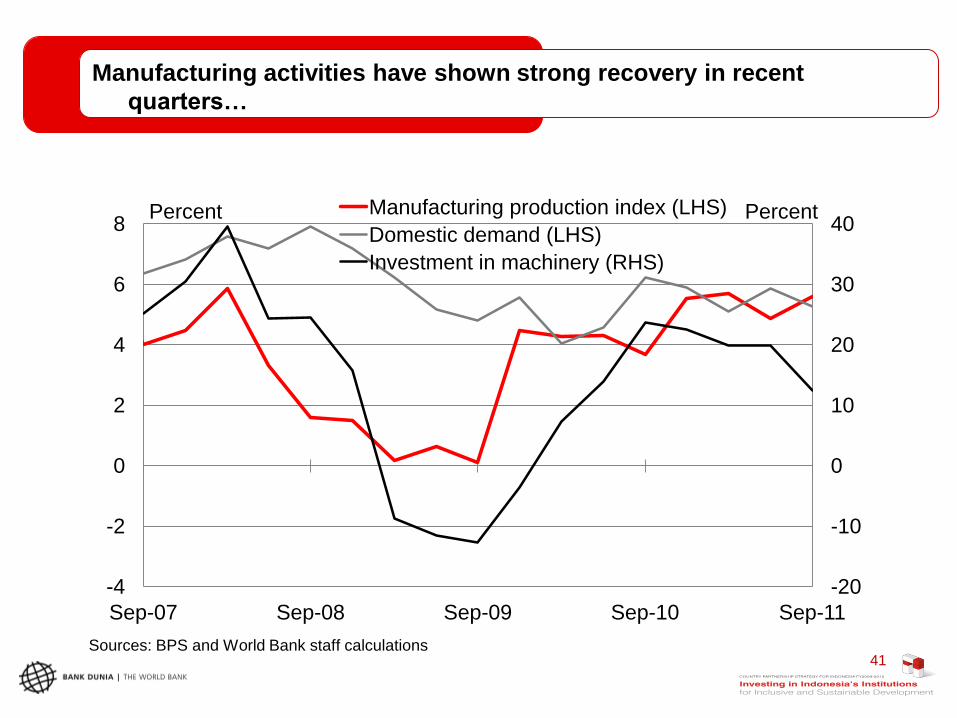
Manufacturing activities have shown strong recovery in recent
quarters…
Sources: BPS and World Bank staff calculations
-20
-10
0
10
20
30
40
-4
-2
0
2
4
6
8
Sep-07 Sep-08 Sep-09 Sep-10 Sep-11
Manufacturing production index (LHS)
Domestic demand (LHS)
Investment in machinery (RHS)
Percent Percent
41
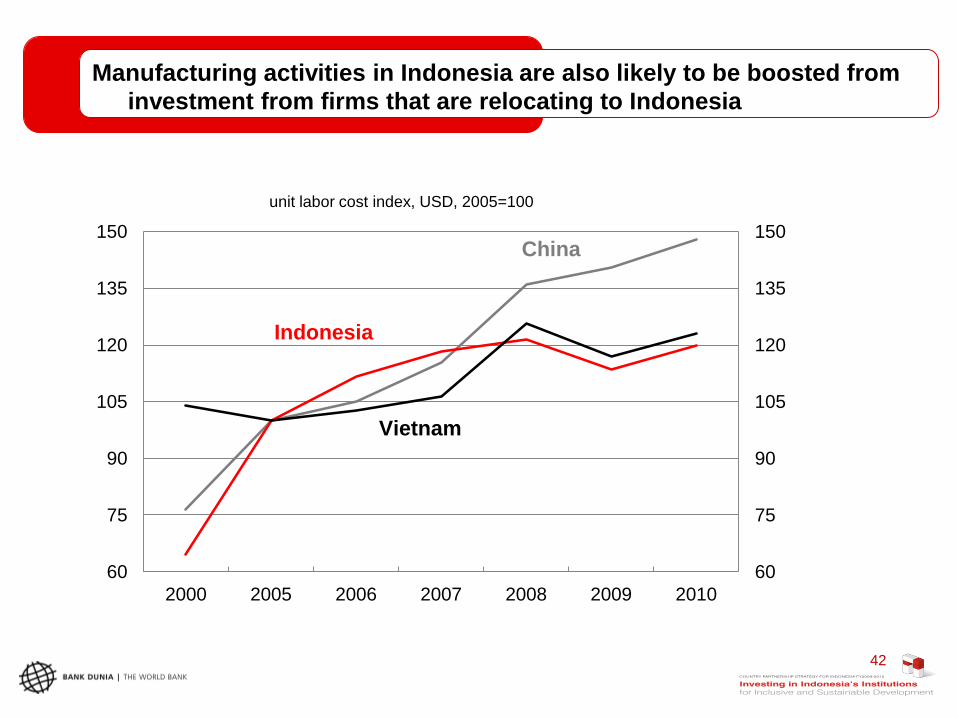
Manufacturing activities in Indonesia are also likely to be boosted from
investment from firms that are relocating to Indonesia
60
75
90
105
120
135
150
60
75
90
105
120
135
150
2000 2005 2006 2007 2008 2009 2010
China
Indonesia
Vietnam
unit labor cost index, USD, 2005=100
42
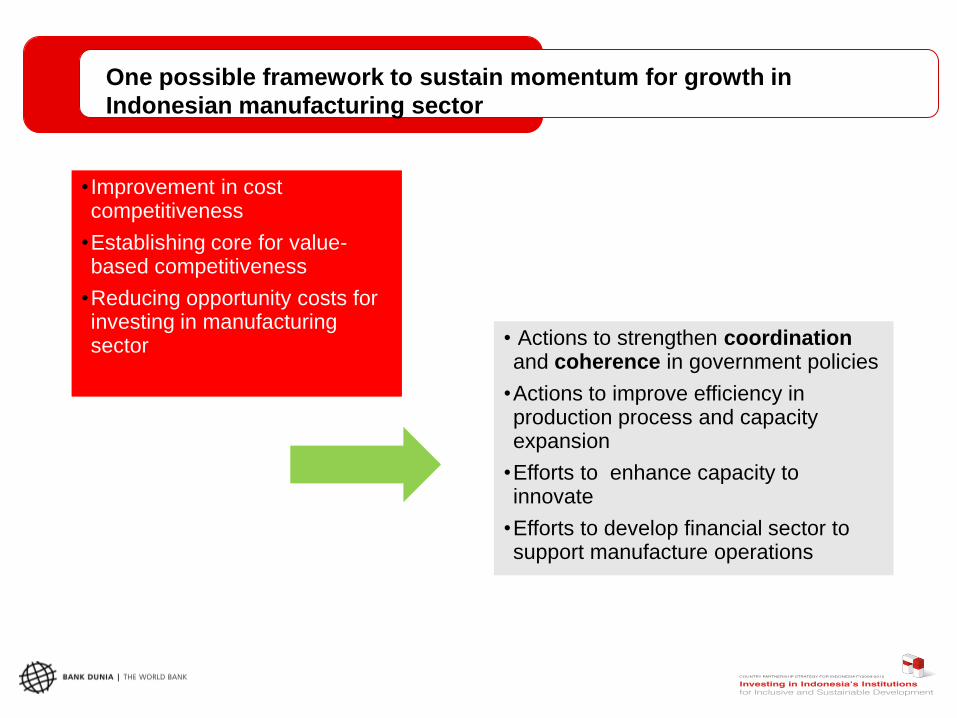
• Actions to strengthen coordination and coherence in government policies
•Actions to improve efficiency in production process and capacity expansion
•Efforts to enhance capacity to innovate
•Efforts to develop financial sector to support manufacture operations
• Improvement in cost competitiveness
•Establishing core for value-based competitiveness
•Reducing opportunity costs for investing in manufacturing sector
One possible framework to sustain momentum for growth in
Indonesian manufacturing sector
www.worldbank.org/id www.worldbank.org/indonesia
Indonesia Economic Quarterly: December 2011
Enhancing Preparedness, Ensuring Resilience
December 14, 2011 Jakarta, Indonesia