Individual response profiles in the behavioral assessment ... · Individual response profiles in...
13
European Journal of Personality, Vol. 2, 155-167 (1988) Individual response profiles in the behavioral assessment of personality JENS B. ASENDORPF Max-Planck-Institute for Psychological Research, Munich. Federal Republic of Germany Abstract A long-standing problem in the behavioural assessment of personality is the individual specificity of responses. Often, different persons externalize the same trait in different responses. One solution to this problem is to aggregate many different responses. The paper compares the power of response aggregationfor predicting self- and other-ratings of personality with two alternative strategies of response selection: the nomothetic strategy of selecting the response with the highest overall predictive power, and the more idiographic strategy of selecting, for each individual, the most extreme response. Seventy subjects were videotaped in a sequence of social situations inducing shyness to various degrees. Five different nonverbal measures of shyness all correlated significantly with the subjects’ self- or other-rated shyness, and showed low correlations across subjects and a substantial cross-situational consistency of response profiles. Response aggregation and both strategies of response selection were found to be equally powerful in predicting the subjects’ self- and other-ratings of shyness from the five behavioural responses. Therefore, these findings somewhat dampen the hope often expressed in recent theoretical discussions of personality assessment that more respect for the individual case may improve nomothetic assessment procedures. A long-standing problem in the assessment of personality by behavioural or physiological measures is the individual specificity of responses: often, different persons externalize the same trait in different responses. For example, the state of shyness in social encounters with strangers, the other sex, or authorities is accompanied, at the group level, by many different behavioural indicators such as long pauses in speech, hesitant speaking, gaze aversion, or restricted gestures. However, at the level of the individual, these indicators may not be interchange- able. When becoming shy, one person may react primarily with gaze aversion, Requests for reprints should be sent to Jens B. Asendorpf. Max-Planck-Institute for Psychological Research, Leopoldstr. 24, D-800 Munchen 40. Federal Republic of Germany. 0890-2070/88/020155-13$06.50 01988 by John Wiley & Sons, Ltd. Received 26 April 1987 Accepted 22 June 1987
Transcript of Individual response profiles in the behavioral assessment ... · Individual response profiles in...
European Journal of Personality, Vol. 2, 155-167 (1988)
Individual response profiles in the behavioral assessment of personality
JENS B. ASENDORPF Max-Planck-Institute for Psychological Research, Munich. Federal Republic of Germany
Abstract
A long-standing problem in the behavioural assessment of personality is the individual specificity of responses. Often, different persons externalize the same trait in different responses. One solution to this problem is to aggregate many different responses. The paper compares the power of response aggregation for predicting self- and other-ratings of personality with two alternative strategies of response selection: the nomothetic strategy of selecting the response with the highest overall predictive power, and the more idiographic strategy of selecting, for each individual, the most extreme response. Seventy subjects were videotaped in a sequence of social situations inducing shyness to various degrees. Five different nonverbal measures of shyness all correlated significantly with the subjects’ self- or other-rated shyness, and showed low correlations across subjects and a substantial cross-situational consistency of response profiles. Response aggregation and both strategies of response selection were found to be equally powerful in predicting the subjects’ self- and other-ratings of shyness f rom the five behavioural responses. Therefore, these findings somewhat dampen the hope often expressed in recent theoretical discussions of personality assessment that more respect for the individual case may improve nomothetic assessment procedures.
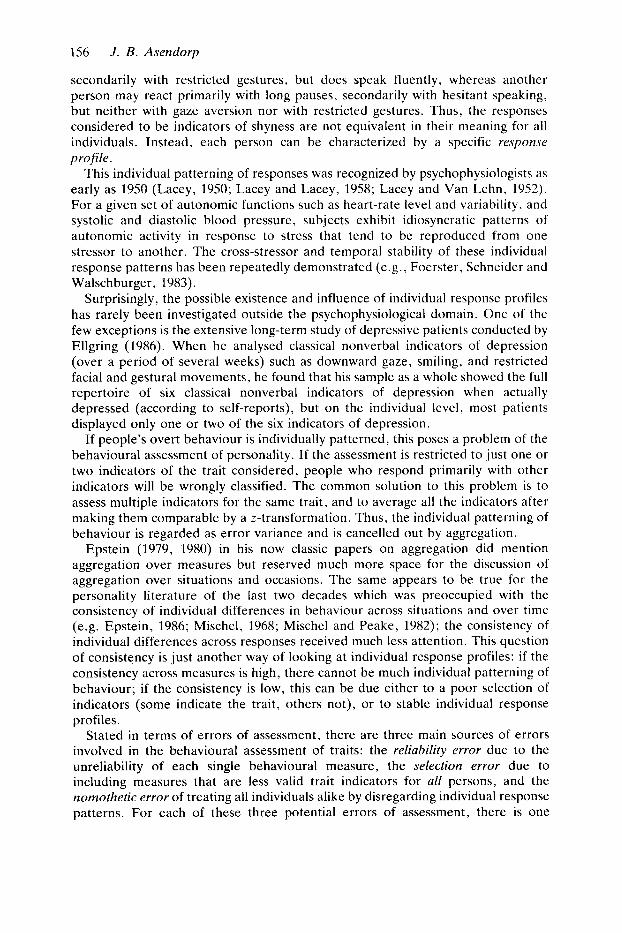
A long-standing problem in the assessment of personality by behavioural or physiological measures is the individual specificity of responses: often, different persons externalize the same trait in different responses. For example, the state of shyness in social encounters with strangers, the other sex, or authorities is accompanied, at the group level, by many different behavioural indicators such as long pauses in speech, hesitant speaking, gaze aversion, or restricted gestures. However, at the level of the individual, these indicators may not be interchange- able. When becoming shy, one person may react primarily with gaze aversion,
Requests for reprints should be sent to Jens B. Asendorpf. Max-Planck-Institute for Psychological Research, Leopoldstr. 24, D-800 Munchen 40. Federal Republic of Germany.
0890-2070/88/020155-13$06.50 01988 by John Wiley & Sons, Ltd.
Received 26 April 1987 Accepted 22 June 1987
156 J . B . Asendorp
secondarily with restricted gestures, but does speak fluently, whereas another person may react primarily with long pauses, secondarily with hesitant speaking, but neither with gaze aversion nor with restricted gestures. Thus, the responses considered to be indicators of shyness are not equivalent in their meaning for all individuals. Instead, each person can be characterized by a specific response profile.
This individual patterning of responses was recognized by psychophysiologists as early as 1950 (Lacey, 1950; Lacey and Lacey, 1958; Lacey and Van Lehn, 1952). For a given set of autonomic functions such as heart-rate level and variability, and systolic and diastolic blood pressure, subjects exhibit idiosyncratic patterns of autonomic activity in response to stress that tend to be reproduced from one stressor to another. The cross-stressor and temporal stability of these individual response patterns has been repeatedly demonstrated (e.g., Foerster, Schneider and Walschburger, 1983).
Surprisingly, the possible existence and influence of individual response profiles has rarely been investigated outside the psychophysiological domain. One of the few exceptions is the extensive long-term study of depressive patients conducted by Ellgring (1986). When he analysed classical nonverbal indicators of depression (over a period of several weeks) such as downward gaze, smiling, and restricted facial and gestural movements, he found that his sample as a whole showed the full repertoire of six classical nonverbal indicators of depression when actually depressed (according to self-reports), but on the individual level, most patients displayed only one or two of the six indicators of depression.
If people’s overt behaviour is individually patterned, this poses a problem of the behavioural assessment of personality. If the assessment is restricted to just one or two indicators of the trait considered, people who respond primarily with other indicators will be wrongly classified. The common solution to this problem is to assess multiple indicators for the same trait, and to average all the indicators after making them comparable by a 2-transformation. Thus, the individual patterning of behaviour is regarded as error variance and is cancelled out by aggregation.
Epstein (1979, 1980) in his now classic papers on aggregation did mention aggregation over measures but reserved much more space for the discussion of aggregation over situations and occasions. The same appears to be true for the personality literature of the last two decades which was preoccupied with the consistency of individual differences in behaviour across situations and over time (e.g. Epstein, 1986; Mischel, 1968; Mischel and Peake, 1982); the consistency of individual differences across responses received much less attention. This question of consistency is just another way of looking at individual response profiles: if the consistency across measures is high, there cannot be much individual patterning of behaviour; if the consistency is low, this can be due either to a poor selection of indicators (some indicate the trait, others not), or to stable individual response profiles.
Stated in terms of errors of assessment, there are three main sources of errors involved in the behavioural assessment of traits: the reliability error due to the unreliability of each single behavioural measure, the selection error due to including measures that are less valid trait indicators for all persons, and the nomothetic error of treating all individuals alike by disregarding individual response patterns. For each of these three potential errors of assessment, there is one
Response profiles 157
strategy which is best for reducing error; however, no strategy seems to exist that avoids all three errors simultaneously.
As Epstein (1979, 1980, 1983, 1986) has repeatedly pointed out, aggregating multiple measures is a good strategy to reduce reliability errors because error variance will be cancelled out relative to true variance. In fact, aggregation appears to be the best possible strategy for the reduction of any kind of unsystematic error inherent in behavioural measures. If the reliability of the measures cannot be increased any further, if the measures selected appear to be equally valid in terms of their correlation with some trait criterion, and if there are no stable individual response profiles, aggregation clearly is the best option to improve the behavioural assessment of traits.
However, aggregation of multiple measures may not always be the best option. Sometimes, there is an alternative of trying to reduce each of the three errors specifically. Thus, error variance can often be reduced by improving the reliability of measures. If some of the measures used appear to be less valid than others, it may be better to exclude the less valid measures even if only a very few or even just one measure is left for analysis. Selecting the most valid response should always be considered as an alternative to aggregating many responses. And finally, if individual response patterns do exist, this information can be used to select each individual’s most safient response neglecting all the other responses for that person.
Whereas the relative merits of aggregating many responses vs selecting the most valid responses have been discussed elsewhere (e.g. Epstein, 1983), I am not aware of any attempt in the literature to use information about individual patterns of overt responses in order to improve the assessment of traits within an empirical, nomothetic framework. One simple way of doing so is (a) to ascertain on a subject- by-subject base whether the behavioural measures obtained show individual response profiles that are consistent across situations, and, if this is indeed the case, (b) to select each person’s most extreme z-transformed response as the behavioural indicator of that person. This procedure is based on a nomothetic measurement procedure (computing z-scores, i.e. standardized deviations from the sample mean). but the procedure also uses idiographic information obtained for each person separately (selecting each subject’s most extreme score among all scores of that subject); the individualized scores are then again used in a nomothetic procedure that correlates them with other trait criteria (self- and other-ratings of the trait). Thus, the procedure consists of both idiographic and nomothetic elements. In the following, I refer to this procedure as the ‘method of salient response selection’.
The power of this method was first investigated in an earlier study using behavioural ratings (Asendorpf, 1986). However, the number of different ratings (only three) and their intercorrelations across subjects (rather high) were not well suited for an evaluation of salient response selection. The present analysis is based on five behavioural measures with low intercorrelations across subjects obtained from the video-tapes used already for the rating data reported in Asendorpf (1986). Response aggregation, selecting the single most valid response, and selecting each subject’s most salient response were compared in regard to their power of predicting self- and other-ratings of shyness. Since the present study focuses upon this methodological comparison, details of the situations and the assessment
158 J . B. Asendorp
procedures are outlined here only as far as it is necessary for the present purpose. A full description of the study is provided in Asendorpf (1985).
METHOD
Subjects
A self-selected sample of 307 students were pretested with a personality inventory containing a scale tapping shyness (cf. Asendorpf, 1987). Thirty low-shy and 40 shy subjects (half of each group female) came to the laboratory to participate in a study on ‘social perception’ (cover story). The low-shy subjects had scores in the lower tercile, and the shy subjects had scores in the upper quartile of the distribution of the shyness scores. The subjects received DMlO ($7) for participation and were assured that they could talk about their data with an ‘experienced psychologist’ later on.
Design
The design of the study included three social-interaction situations that were designed to induce shyness to a different degree. First, the subjects waited ostensibly for the ‘real experiment’ in the company of another ‘subject’. who was in fact a confederate. This procedure was aimed at inducing shyness due to stranger anxiety. Then, a video-camera was set up in the room, and both partners were instructed to get to know each other in order to evaluate their partner’s personality later on in a questionnaire. This procedure was aimed at inducing shyness due to social-evaluative anxiety. About 45 min later, the experimenter had some small-talk with the subject pretending that the experiment was already finished and they just had to wait for the money. This situation was aimed at inducing shyness due to the authority of the experimenter. All three situations (waiting with the confederate, getting-to-know the confederate, and conversation with the experimenter) were video-taped for three minutes through a one-way mirror providing a wide-angle view of both partners.
Dependent measures
Self-ratings of shyness
After each of the three situations, l..e subjects answered a questionnaire containing, among other scales, a seven-point rating scale of an intensity format (‘not at all’-‘very much’) labeled ‘During the last three minutes, I felt shy- inhibited’. The mean of the three self-ratings served as the subjects’ self-rated overall shyness in the experiment.
Other-ratings of shyness
The video-recordings of the three situations were presented to three judges who were blind to the subjects’ scores on the shyness scale and to the self-ratings of shyness. The judges rated the subjects’ shyness after each minute of recording on a
Response profiles 159
seven-point scale of the same format as the self-rating scale. The mean of the nine ratings of each judge per subject served as the judge’s shyness score for that subject. The mean shyness score of the three judges (a mean of 9x3=27 ratings) served as the subject’s other-rated shyness in the experiment.
Behavioral measures
The nine minutes of video-taped interaction per subject were coded for the onset and offset times of the following variables: speaking by the subject, speaking by the subject’s partner (i.e. the confederate or the experimenter), the subject’s gazing at the partner, the subject’s use of illustrators, i.e. hand/arm movements illustrating the subject’s speech content (cf. Ekman and Friesen, 1972). All codings were done on a microcomputer that was synchronized with the video-recorder by an interface. Thus, onset and offset times were coded simply by pressing a button. Speech was monitored continuously in the normal play mode of the video-recorder. Coding times were corrected for the mean reaction time of the coder that had been determined by a comparison of one full coding protocol with the coding times determined exactly by slow-motion analysis. Gazing and illustrators were always coded by slow-motion analysis. Thus, all coding times referred to the same time- base.
The onset and offset times were transformed into interval codes with an interval length of 0 .3 s. From these time sequences, the following variables were generated according to a priori hypotheses about their relation to shyness: total duration and mean length of the subject’s silences, total duration and mean length of the subject’s speech not accompanied by illustrators (‘restricted gesturing’), total duration and mean length of the subject’s averted gaze, proportion of the subject’s averted gaze during the subject‘s silences, proportion of the subject’s gaze aversion during speech, mean length of the pauses following the subject’s speaking, and mean length of the pauses following the partner’s speaking.
Of these 10 variables, four did not significantly correlate with both self- and other-rated shyness. Of the remaining six variables, duration and mean length of the subject’s silences correlated rather highly (r=0.74, obviously due to an intrinsic relation between these two variables). Since the mean length of subject’s silences was also intrinsically related to the two pause measures, it was dropped from analysis. The remaining five measures were: (a) total duration of the subject’s silences, (b) total duration of restricted gesturing (see above), (c) proportion of the subject’s averted gaze during silences, (d) mean length of the pauses following the subject’s speaking, and (e) mean length of the pauses following the partner’s speaking.
RESULTS
Reliabilities
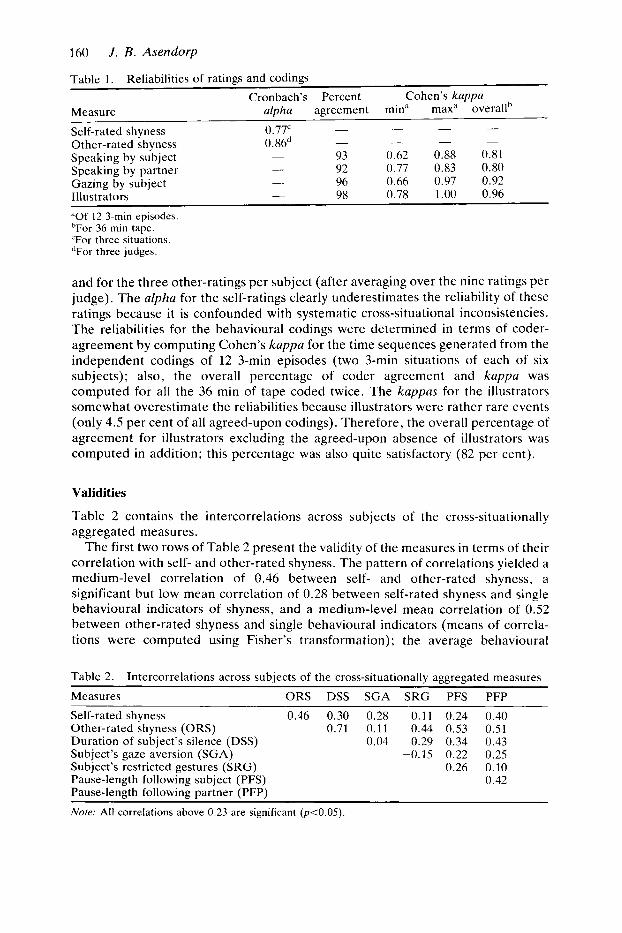
Table 1 contains the reliabilities of the shyness ratings and of the codings underlying the behavioural measures used in the analysis.
All reliabilities were quite high. The reliabilities for the shyness ratings were determined by computing Cronbach’s alpha for the three self-ratings per subject
160 J . B. Asendorp
Table 1.
Measure alpha agreement mina maxa overallh Self-rated shyness 0.77' Other-rated shyness 0.86d Speaking by subject - 93 0.62 0.88 0.81 Speaking by partner - 92 0.77 0.83 0.80 Gazing by subject - 96 0.66 0.97 0.92 Illustrators - 98 0.78 1.00 0.96
"Of 12 3-min episodes. 'For 36 min tape. 'For three situations. dFor three judges.
Reliabilities of ratings and codings Cronbach's Percent Cohen's kappa
- - - - - - - -
and for the three other-ratings per subject (after averaging over the nine ratings per judge). The alpha for the self-ratings clearly underestimates the reliability of these ratings because it is confounded with systematic cross-situational inconsistencies. The reliabilities for the behavioural codings were determined in terms of coder- agreement by computing Cohen's kappa for the time sequences generated from the independent codings of 12 3-min episodes (two 3-min situations of each of six subjects); also, the overall percentage of coder agreement and kappa was computed for all the 36 min of tape coded twice. The kappas for the illustrators somewhat overestimate the reliabilities because illustrators were rather rare events (only 4.5 per cent of all agreed-upon codings). Therefore, the overall percentage of agreement for illustrators excluding the agreed-upon absence of illustrators was computed in addition; this percentage was also quite satisfactory (82 per cent).
Validities
Table 2 contains the intercorrelations across subjects of the cross-situationally aggregated measures.
The first two rows of Table 2 present the validity of the measures in terms of their correlation with self- and other-rated shyness. The pattern of correlations yielded a medium-level correlation of 0.46 between self- and other-rated shyness, a significant but low mean correlation of 0.28 between self-rated shyness and single behavioural indicators of shyness, and a medium-level mean correlation of 0.52 between other-rated shyness and single behavioural indicators (means of correla- tions were computed using Fisher's transformation); the average behavioural
Table 2.
Measures ORS DSS SGA SRG PFS PFP Self-rated shyness 0.46 0.30 0.28 0.11 0.24 0.40 Other-rated shyness (ORS) 0.71 0.11 0.44 0.53 0.51 Duration of subject's silence (DSS) 0.04 0.29 0.34 0.43
Subject's restricted gestures (SRG) 0.26 0.10 Pause-length following subject (PFS) 0.42 Pause-lencth following Dartner (PFP)
Intercorrelations across subjects of the cross-situationally aggregated measures
Subject's gaze aversion (SGA) -0.15 0.22 0.25
Note: All correlations above 0.23 are significant (pt0.05)

Response profiles 161
measure predicted the subjects’ other-rated shyness significantly better than the subjects’ self-rated shyness (1(69)=2.1, p<0.05, for the difference between the correlations of 0.28 and 0.52, taking into account the correlation of 0.46 between the two predicted variables; cf. Olkin, 1967). The five behavioural measures showed low inter-correlations (mean intercorrelation 0.23) which call into question the merits of aggregating the subjects’ scores across measures: the internal consistency of the aggregated score was only alpha=0.57.
Cross-situational consistencies of single measures
Table 3 contains the consistency of individual differences in each measure across the three experimental situations.
The results show a substantial consistency for the self- and other-ratings of shyness; note, however, that in both cases the consistency may be inflated by transfer effects (the subjects might have remembered their rating in the preceding situation, and the judges clearly did so because all three situations for the same subject were presented to them consecutively). The consistencies of the single behavioural measures were of low or medium size (i.e. the measures of pause- length).
Table 3. Cross-situational consistencies of measures Measure ulpha Self-rated shyness 0.77 Other-rated shyness 0.78 Duration of subject’s silence 0.49 Subject’s gaze aversion 0.60 Subject’s restricted gestures 0.76 Pause-length following subject 0.20 Pause-length following partner 0.20
Nore: Reported are Cronhach’s alphas referring to the consistency o f individual differences in each measure across the three experimental settings.
Cross-situational consistency of individual response profiles
The consistency of individual response profiles, i.e. the stability of within-subject differences between the five behavioural measures across situations, was investi- gated as follows. First, the subjects’ behavioural measures were com.puted for each minute of video-recording and then z-transformed over subjects. The three 3-min situations were split into three 1-min situations in order to yield a more fine-grained analysis of the situational consistency of the response profiles. Thus, for each single subject there was a 5(z-transformed measures) ~9(si tuat ions) matrix. Then, for each subject the consistency of the response profiles across the nine situations was determined by computing the respective alpha. Thus, a high alpha indicates a high variance among the subject’s five z-transformed responses compared to the variance of the responses among the nine situations. Figure I shows the distribution of these alphas among all 70 subjects.
The distribution is skewed toward higher scores with a median alpha of 0.64. Thus, 50 per cent of the subjects had response profiles with a cross-situational

162 J . B. Asendorp
FREQUENCY 25
20
15
1C
c
( 60 5.2 6.4 6.6 6.8 51
ALPHA
MEDIAN ALPHA = . 6 4
Figure 1. profiles (Cronbach’s alphas for five responses and nine situations)
Distribution of the cross-situational consistencies of the individual response
stability of 0.64 or higher. Since an alpha of 0.63 or higher is significant, given five measures and nine situations, the majority of subjects (55 per cent) showed significantly stable response profiles (the significance of alpha is equivalent to the significance of the F-test for the between-response effect in the corresponding analysis of variance).
Prediction of self- and other-ratings from behaviour
Table 4 contains the multiple correlation among the five behavioural measures and self- and other-ratings of shyness and the comparable correlations among the following predictors and these self- and other-ratings: the aggregate (i.e. the mean of all five z-transformed responses), the best single response (i.e. the response with the highest correlation with the predicted variable among all five responses), the most salient response (i.e. each subject’s most extreme z-transformed response), and the minimal and the maximal z-transformed response of each subject.
Table 4 indicates that the three methods of aggregating responses, selecting the overall best single response, and selecting each subject’s most salient response yielded predictions of equal quality for both self- and other-rated shyness. There

Response profiles 163
Table 4. shvness
Correlations between various behavioural indices and self- and other-ratings of
Self-rated Other-rated shyness shyness Predictive measure
Optimal linear combination" 0.47 0.78 Aggregate of responses 0.44 0.72 Best single response 0.40 0.71 Most salient response" 0.40 0.65 Maximal response 0.40 0.54 Minimal response 0.24 0.57 Note: n = 70 subjects. "Multiple regression of predicted variable on all five responses. hMost salient response = max if abs(max)>abs(min)
min else
Table 5. Table 4)
Measure BSR" BSRh MSR MAR MIR
Intercorrelations across subjects of various behavioural measures of shyness (cf .
Aggregate of responses (AOR) 0.73 0.68 0.90 0.79 0.78 Best single response (BSR)" 0.43 0.63 0.67 0.42 Best single response (BSR)" 0.56 0.46 0.56 Most salient response (MSR) 0.83 0.72 Maximal response (MAR) 0.37 Minimal response (MIR)
~~~ ~~~
Note: n = 70 subjects. .'For predicting self-rated shynehs. "For predicting other-rated shyness.
were no significant differences among the respective correlations. The equivalence of the three methods of prediction in the present study becomes most obvious by looking at the cross-subject intercorrelations of the various predictors of Table 4 (cf. Table 5 ) . Most correlations were rather high.
One reason for the correlation of 0.90 between the aggregated score and the most salient response seems to be that the mean between-response variance of the subjects within situations was substantially lower (0.26) than the between-subject variance of responses within situations (which equals 1 per definition).
DISCUSSION
This study compared response aggregation, selecting the single most valid response, and selecting each subject's most salient response in regard to their power of predicting self- and other-ratings of shyness. Five reliable behavioural measures that all correlated significantly with either self- or other-rated shyness were used for this analysis. The consistency of individual differences in these measures was rather low across measures after aggregating each measure over situations, although the cross-situational consistency was rather high after aggregating each subject's responses in each situation over measures. One major reason for the low cross-response consistency appeared to be the fact that the

164 J . B. Asendorp
majority of subjects showed substantial differences within measures (i.e. response profiles) that were significantly stable across situations.
However, using the idiographic information about each subject’s most salient response did not prove to be superior to ignoring this information by either aggregating all responses or selecting the single most valid response. One reason for this result is the general trade-off between the three methods in terms of how they deal with the three types of error involved in the behavioural assessment of personality: the reliability error due to unsystematic errors in the measurement, the selection error due to selecting less valid trait indicators, and the nomothetic error due to ignoring the individual patterning of behaviour. Each method is best-suited to reduce one of these errors but only at the cost of ignoring the other two.
There may exist data sets where one or two of these errors are so predominant that one of the three methods is cleariy superior or inferior to the other two. In studies where only reliable and valid behavioural measures are used and where there is a substantial, but not an extreme amount of individual response specificity, such as in the present one, the data are affected by all three errors simultaneously and approximately to the same degree. In these cases, which seem to be the typical ones in personality assessment, all three methods of predicting personality from behaviour are equally appropriate.
Besides this general trade-off between the three methods, two additional factors limit the benefits of the method of salient response selection. First, the number of the behavioural measures constituting the response profiles has to be rather large in order to come to predictions that clearly deviate from the average response. It is an old statistical wisdom that it is hard to beat the mean; if there are only a few responses, any predictor (e.g. the maximal, the minimal, or the most extreme response) contributes so much to the mean that the cross-subject correlations between this predictor and the mean will be quite high. And second, the mean between-response variance of the subjects must be high compared to the between- subject variance of the responses. If not, information about response profiles is not of much practical value for distinguishing among persons.
In the present study, five different behavioural measures were used for the analysis of response profiles. This is not a high number but a reasonable one that does not prevent deviations from the mean a priori. It would not only be quite costly but also quite difficult to assess many more aspects of behaviour because the different behavioural measures are required to show low intercorrelations across persons. Thus, we probably cannot expect to find much more than about five behavioural measures per trait that all indicate the same trait but show clear inconsistencies across persons. This limitation of the number of responses also limits the advantage of the method of salient response selection.
Finally, the between-response variance of the subjects was rather small compared to the between-subject variance of the responses (only 26 per cent in the present study). This proportion may be higher for other traits although it is difficult to imagine a trait for which the variance of trait indicators within people is equal to or even exceeds their variance between people. This problem again limits the merits of using information about these profiles in general.
Taken together, the present study has shown that a substantial amount of individual patterning exists not only for physiological responses but also for overt nonverbal measures, at least for the trait of shyness. However, for the prediction of
Response profiles 165
self- and other-rated shyness using information about these individual response profiles by selecting each subject’s most salient response did not prove to be superior to ignoring this information. Several factors apparently limit the possible advantage of using idiographic information about response profiles within nomothetic predictions of personality. There does not seem to exist a simple way of improving nomothetic assessment procedures by idiographic information.
This empirical result sheds some light on a more fundamental, current issue of the psychology of personality. In recent years, the old debate about idiographic versus nomothetic approaches to personality has revived, and there are appeals from every quarter for more respect for the individual case in personality research (e.g. Lamiell, 1982; Runyan, 1982).
When the promises of an ‘idiographic enrichment’ of nomothetic procedures offered by the proponents of a more person-oriented personality research has been put to an empirical test, the results have been mixed: sometimes, such an enrichment proved fruitful (e.g. Pennebaker, 1982), sometimes not (e.g. Paunonen and Jackson, 1985, 1986). The results of the present study lead to a rather pessimistic conclusion concerning the merits of using idiographic information within nomothetic predictions. In the present case, many preconditions have to be met before the idiographic enrichment becomes powerful. If these preconditions are not met, and this seems to be true in many, if not most instances, disregarding the available idiographic information about response patterning by simply taking the most valid response or by aggregating all valid responses is not a bad strategy. As convincing as the call for more respect for the individual case may be from a theoretical stance, it is difficult to realize with real behavioural data for real people in real situations.
REFERENCES
Asendorpf, J . (1985). Studien zur Schiichternheit. Nr. 3: Selbst- und fremdbeurteilte Schiirhternheit von Studenten in realen Interaktionssituationen (Studies on shyness. No. 3: Self and other-rated shyness of students in real interactional situations), Res. Rep. (Paper 10/85), Max-Planck-Institute for Psychological Research, Munich, FRG.
Asendorpf, J . (1986). ‘Individual response hierarchies: a neglected issue in the assessment of states and traits’. In: Newstead, S. E . , Irvine, S. H. and Dann, P. L. (Eds) Human Assessment: Cognition and Motivation, NATO AS1 Series D, No. 27, Nijhoff, Dordrecht, pp. 400-401.
Asenclorpf, J . (1987). ‘Videotape reconstruction of emotions and cognitions related to shyness’, Journal of Personality and Social Psychology, 53: 542-549.
Ekman. P. and Friesen, W. V. (1972). ‘Hand movements’, Journal of Communication, 22: 353--374.
Ellgring, H. ( I 986). ‘Nonverbal expression of psychological states in psychiatric patients’, European Archives of Psychiatry and Neurological Sciences, 236: 31-34.
Epstein. S. (1979). ‘The stability of behaviour: I . On predicting most of the people much of the time’, Journal of Personality and Social Psychology, 37: 1097-1126.
Epstein S. (1080). ‘The stability of behavior: 11. Implications for psychological research’, American Psychologist, 35: 79(&806.
Epstein, S. (1983). ‘Aggregation and beyond: Some basic issues on the prediction of behavior’, Journal of Personality, 51: 36(&392.
Epstein, S. (1986). ‘Does aggregation produce spuriously high estimates of behavior stability?’ Journal of Personality and Social Psychology, 50: 1199-l210.

166 J . B . Asendorp
Foerster, F. , Schneider, H. J. and Walschburger, P. (1983). ‘The differentiation of individual-specific, stimulus-specific, and motivation-specific response patterns in activa- tion processes: An inquiry investigating their stability and possible importance in psychophysiology’, Biological Psychology, 17: 1-26.
Lacey, J. I. (1950). ‘Individual differences in somatic response patterns’, Journal of Comparative and Physiological Psychology, 43: 338-350.
Lacey, J. I. and Lacey, B. C. (1958). ‘Verification and extension of the principle of autonomic response-stereotypy’, American Journal of Psychology, 71: 50-73.
Lacey, J. 1. and Van Lehn, R. (1952). ‘Differential emphasis in somatic response to stress’, Psychosomatic Medicine, 14: 71-81.
Lamiell, J. T. (1982). ‘The case for an idiothetic psychology of personality: A conceptual and empirical foundation’. In: Maher, B. A. and Maher, W. B. (Eds) Progress in Experimental Personality Research, Vol. 11, Academic Press, New York, pp. 1-64.
Mischel, W. (1968). Personality and Assessment, Wiley, New York. Mischel, W. and Peake, P. K. (1982). ‘Beyond dkja vu in the search for cross-situational
consistency’, Psychological Review, 89: 730-755. Olkin, J. (1967). ‘Correlations revisited’. In: Stanley, J . C. (Ed.) Improving Experimental
Design and Statistical Analysis, Rand McNally, Chicago. Paunonen, S. V. and Jackson, D. N. (1985). ‘Idiographic measurement strategies for
personality and prediction: Some unredeemed promissory notes’, Psychological Review, 92: 486-511.
Paunonen, S. V. and Jackson, D. N. (1986). ‘Nomothetic and idiothetic measurement in personality’, Journal of Personality, 54: 447459.
Pennebaker, J. W. (1982). The Psychology of Physical Symptoms, Springer, New York. Runyan, W. M. (1982). Life Histories and Psychobiography: Explorations in Theory and
Method, Oxford University Press, New York.
RESUME
Un ancien probleme dans la determination des caracteristiques de personnalite par Ie biais d’indicateurs de comportement est celui de la specificit6 individuelle de ces indicateurs. Differentes personnes expriment souvent le m&me trait par des reponses differentes. AgrCger beaucoup de reponses differentes est une solution a ce probleme. Cet article compare la puissance de I’agregation de reponses pour la prediction des descriptions de soi- mCme et des jugements par d’autres personnes avec deux strategies alternatives de selection des reponses: la strategie nomothetique. ayant la plus haute validite, et la stratkgie plus idiographique axee sur la selection de la reponse la plus Claire et la plus forte pour chaque individu. 70 sujets ont Cte filmes dans une serie de situations suscitant, a divers degres, de la timidite. Cinq mesures non-verbales differentes de timidite correlaient toutes de faGon signifiante avec la timidite rapportee par les sujets eux-mCmes et avec la timidite indiquee par les autres. Ces cinq mesures non-verbales, calculees sur les sujets, correlaient faiblement entre elles. II etait toutefois question d’une consistance trans-situationnelle des profils de rkponses. L’agrkgation des reponses et les deux strategies pour la selection des reponses se sont averees egalement puissantes au niveau de la prediction des descriptions de soi-mCme de timidite et des jugements des autres, a partir des cinq reponses comportementales. Ce resultat empirique reduit quelque peu I’espoir souvent exprime dans les recentes discussions theoriques sur les mesures de personnalitk que les procedures de mesures nomothetiques pouveraient Ctre amCliorCes si I’on tenait plus compte du cas individuel.
ZUSAMMENFASSUNG
Ein altes Problem bei der Erfassung von Personlichkeitsmerkmalen durch Verhaltensindi- katoren ist dic individuelle Spezifitiit dieser Indikatoren: oft zeigt sich dasselbe Merkmal bei verschiedenen Personen an unterschiedlichen Verhaltensweisen. Eine Losung dieses Problems besteht darin, moglichst viele verschiedene Verhaltensindikatoren zu aggregieren.

Response profiles 167
Diese Arbeit vergleicht am Beispiel der Erfassung von selbst- und fremdbeurteilter Schuchternheit diesen Aggregationsansatz mit zwei alternativen Strategien der Verhaltens- selektion: der nomothetischen Strategie, den Indikator mit der hochsten Kriteriumskorrela- tion zu selegieren, und der idiographischeren Strategie, fur jede einzelne Person deren extremsten Indikator auszuwahlen. Siebzig Vpn wurden in einer Sequenz sozialer Situationen gefilmt, die in unterschiedlichem MaRe Schuchternheit auslosten. Funf verschiedene nichtverbale MaBe fur Schuchternheit korrelierten jeweils signifikant mit der selbst-oder der fremdbeurteilten Schuchternheit der Vpn, zeigten niedrige Interkorrela- tionen uber die Vpn und eine substantielle transsituative Konsistenz der Reaktionsprofile. Der Aggregationsansatz und beide Selektionsverfahren erwiesen sich als gleich gut geeignet fur die Vorhersage der selbst-und der fremdbeurteilten Schuchternheit aus den funf Verhaltensindikatoren. Dieses empirische Ergebnis dampft etwas die in theoretischen Arbeiten der letzten Zeit oft geauBerte Hoffnung, daB sich die Gute der nomothetischen Messung von Personlichkeitsmerkmalen durch starkere Berucksichtigung des Einzelfalls steigern IieBe.