Individual Attention Only 2011-05-23 - Dentsplydentsplymea.com/sites/default/files/Scientific...
86
Individual Attention Only 2011-05-23 With the compliments of DENTSPLY DETREY GmbH De-Trey-Str. 1 78467 Konstanz GERMANY T +49-7531-583-0 F +49-7531-583-104 www.dentsply.eu 2011-05-23
Transcript of Individual Attention Only 2011-05-23 - Dentsplydentsplymea.com/sites/default/files/Scientific...

Individual Attention Only
2011-05-23
With the compliments of
DENTSPLY DETREY GmbH De-Trey-Str. 1 78467 Konstanz GERMANY
T +49-7531-583-0 F +49-7531-583-104 www.dentsply.eu
2011-0
5-2
3

Scientific Compendium SDR™ 2
Table of contents
1 Introduction ................................................................................ 5
1.1 Product Description & Features .................................................................. 5
1.2 Research Development Background .......................................................... 6
2 The SDR Technology Overview ................................................. 6
2.1 Polymerization Shrinkage & Stress ............................................................. 6
2.2 Composition of SDR™ ............................................................................... 10
3 Indications for Use ................................................................... 13
4 Clinically Relevant, in-vitro Physical Properties .................... 13
4.1 Polymerization Effects ............................................................................... 13
4.1.1 Volumetric Shrinkage ........................................................................... 13
4.1.2 Polymerization Stress .......................................................................... 15
4.1.3 Curing Effectiveness ............................................................................ 21
4.2 Adhesion & Adaptation .............................................................................. 26
4.2.1 Enamel & Dentin Bonding .................................................................... 26
4.2.2 Class I Micro-tensile Bond Strength ................................................... 26
4.3 Microleakage & Marginal Integrity ............................................................. 28
4.3.1 Class I Restorations; Microleakage .................................................... 28
4.3.2 Class I Restorations – Internal Cavity Adaptation ............................. 30
4.3.3 Class II Restorations – Marginal Integrity .......................................... 31
4.3.4 Class II Restorations: Marginal Integrity after chewing simulation . 33
4.3.5 Class II Restorations; Microleakage ................................................... 37
4.3.6 Class II Restorations; Internal Cavity Adaptation .............................. 38
5 Other Mechanical, Physical & Miscellaneous Properties ...... 40
5.1 Compressive Strength & Modulus of Elasticity ....................................... 40
5.2 Flexural Strength & Modulus of Elasticity ................................................ 41
5.3 Fracture Toughness ................................................................................... 43
5.4 Diametral Tensile Strength ........................................................................ 44
5.5 Radiopacity ................................................................................................. 45
5.6 Water Solubility & Water Sorption ............................................................. 46
5.7 Compatibility with Universal Composites ................................................ 47

Scientific Compendium SDR™ 3
5.8 Compatibility with Adhesives .................................................................... 47
5.9 Color Stability.............................................................................................. 49
5.10 Fluoride Release ......................................................................................... 50
5.11 Overview Material Properties ..................................................................... 51
6 Clinical Evaluations ................................................................. 52
7 Summary ................................................................................... 59
8 Appendices: Additional Information ...................................... 60
8.1 Appendix A: Instructions for Use .............................................................. 61
8.2 Appendix B: Polymerization Shrinkage & Stress ..................................... 61
8.2.1 Volume Shrinkage ................................................................................ 61
8.2.2 Polymerization Stress: NIST Tensometer ........................................... 61
8.2.3 Polymerization Stress: Photoelastic Stress Measurement ............... 61
8.2.4 Polymerization Stress: Stress-Strain-Analyzer .................................. 65
8.3 Appendix C: Curing Effectiveness Methods ............................................ 66
8.3.1 Depth of Cure Based on ISO 4049:2009(E) ......................................... 66
8.3.2 Degree of Conversion: NIR Method .................................................... 66
8.3.3 Degree of Conversion: FTIR Method .................................................. 66
8.3.4 Knoop Hardness ................................................................................... 68
8.3.5 Barcol Hardness Method ..................................................................... 68
8.4 Appendix D: Shear Bond Strength to Dentin & Enamel Test Method .... 69
8.4.1 Enamel & Dentin Bonding; Notched-Edge (Ultradent) Shear Bond
Strength (SBS) to Tooth ....................................................................... 69
8.4.2 Class I Micro-tensile Bond Strength ................................................... 69
8.5 Appendix E: Microleakage, Gap and Marginal Integrity .......................... 70
8.5.1 Class I Cavity Preparation and Restoration ....................................... 70
8.5.2 Class I Microleakage ............................................................................ 71
8.5.3 Class I Internal Cavity Adaptation ....................................................... 72
8.5.4 Class II Cavity Preparation and Restoration ...................................... 72
8.5.5 Class II Marginal Integrity .................................................................... 73
8.5.6 Class II Microleakage ........................................................................... 73
8.5.7 Class II Internal Cavity Adaptation ...................................................... 74
8.6 Appendix F: Other Mechanical, Physical & Miscellaneous Properties .. 74

Scientific Compendium SDR™ 4
8.6.1 Compressive Strength & Modulus ...................................................... 74
8.6.2 Flexural Strength & Modulus ............................................................... 75
8.6.3 Fracture Toughness ............................................................................. 75
8.6.4 Diametral Strength ............................................................................... 75
8.6.5 Radiopacity ........................................................................................... 76
8.6.6 Water Solubility and Water Sorption .................................................. 76
8.6.7 Compatibility with Universal Composites .......................................... 76
8.6.8 Color Stability ....................................................................................... 77
8.6.9 Fluoride Release ................................................................................... 78
9 References ................................................................................ 79
10 Glossar and Abreviatons ......................................................... 81
11 List of Figures .......................................................................... 82
12 List of Tables ............................................................................ 85
Scientific Compendium SDR™ 5
1 Introduction
1.1 Product Description & Features
SDR™ Smart Dentin Replacement is a one-component, fluoride-containing, visible
light cured, radiopaque resin composite restorative material. It is designed to be used
as a base in class I and II restorations. SDR™ material has handling characteristics
typical of a ―flowable‖ composite, but can be placed in 4mm increments with minimal
polymerization stress. SDR™ material has a self-leveling feature that allows intimate
adaptation to the prepared cavity walls. Available in one universal shade, it is
designed to be overlayed with a methacrylate based universal/posterior composite
for replacing missing occlusal/facial enamel.
SDR™ material is used following application of a suitable dentin/enamel adhesive
and is compatible with all DENTSPLY adhesives designed for use with visible light
cured composite restoratives (See complete Directions for Use of selected adhesive).
Use of other dentin/enamel adhesive systems with SDR™ material is at the
discretion and sole responsibility of the dental practitioner.
SDR™ material is used in conjunction with a suitable universal/posterior restorative
material as an occlusal/facial enamel replacement and is compatible with numerous
restorative materials including DENTSPLY visible light cured methacrylate-based
universal/posterior restorative materials designed for posterior Class I & II
restorations.

Scientific Compendium SDR™ 6
While the features of SDR™ are described in this manual, a partial list is included
below.
Low Polymerization Shrinkage and Polymerization Stress
Large increment basing of up to 4 mm thickness
Optimized handling for easy placement and adaptability to cavity preparations
Pre-dosed Compula® Tips for direct intra-oral application
Chemically compatible with existing methacrylate based adhesives and composites
Fluoride Containing glass filler
1.2 Research Development Background
A great deal of discussion has taken place around the polymerization shrinkage of
composite restoratives in dental applications (Truffier-Boutry D, et al, 2006;
Peutzfeldt A, 1997). Much of the discussion focused on attempts to reduce
polymerization shrinkage in the thought that this reduction would have a beneficial
effect on the restorative procedure. Among the desired outcomes of this reduction in
shrinkage was improved marginal integrity, better adaptation to the cavity walls,
reduced cusp deflection, etc. While it is worthy to attempt to reduce these clinically
observable effects, perhaps too much emphasis was placed merely upon reduction
of polymerization shrinkage alone. Rather, within the last several years, DENTSPLY
Caulk has been focusing not simply on the amount of polymerization shrinkage, but
the resultant effect of this process, namely, polymerization stress.
2 The SDR Technology Overview
2.1 Polymerization Shrinkage & Stress
Background: Visible light cured resin composites contain multifunctional, reactive
molecules called monomers. When exposed to light, these monomers link together to
create large molecules called polymers, which, in turn, link together to form a

Scientific Compendium SDR™ 7
continuous network. The polymerization process requires that monomers physically
move closer together to chemically react via a free radical process. This process
results in a net loss of volume referred to as polymerization shrinkage if not restricted
by e.g. bonding to a cavity. When this shrinkage process is restricted stress builds up
in the material. In the initial stages of the polymerization, the monomers and small
polymer chains easily dissipate stress since they are free to move and relieve stress.
As more monomers react, the polymers link together to form a network. The point at
which a network is formed is called the gel point. As the reaction continues,
monomers and polymers continue to add to the network and eventually lose their
ability to move. The material becomes rigid. This point is called the vitrification point.
As the reaction continues, stress builds rapidly since stress cannot be dissipated by
movement anymore. The material resists shrinkage and results in a force on the
composite referred to as polymerization stress. Not only will this polymerization
stress be trapped within the composite itself, but it will also exert forces on bonded
interfaces to which the composite is attached.
It is the transfer of polymerization stress to tooth structure that is the cause of many
clinical problems. In a well bonded composite restoration, polymerization contraction
stress is transferred through the interface with the tooth. This force on tooth structure
may result in enamel fracture, cuspal movement, and cracked cusps. The cavity
design and its influence on the transfer of the developing polymerization stress are
documented in the dental literature (Feltzer, AJ, et al, 1987). The term, ―C-Factor‖
(Configuration-Factor) was used to describe this effect and relates the area of
bonded surfaces to the area of un-bonded surfaces. As this ratio increases, the
―C-Factor‖ increases, resulting in greater polymerization shrinkage stress on the
bonded cavity walls. This relationship is demonstrated in Figure 1. It is apparent that
Class I and II cavity designs have the highest C-Factors, making these types of
restorations most susceptible to the effects of polymerization stress.

Scientific Compendium SDR™ 8
Figure 1 As the area of bonded surfaces increase relative to unbonded surfaces, the C-factor increases. (Clinical pictures courtesy of Dr. Jeff Blank)
In less well bonded restorations, polymerization stress has the potential to initiate
failure of the composite-tooth interface (adhesive failure) if the forces of
polymerization stress exceed the bond strength. The resulting gap between the
composite and cavity walls may produce post-operative sensitivity, microleakage,
and/or secondary caries. If the bonding to the cavity walls is strong enough to avoid
gap formation during polymerization, the stress concentrated inside the composite
material can produce micro-cracks. As a result of this phenomenon, a restored tooth
remains under stress even when there is no functional loading upon it. This implies a
greater risk of failure during the tooth function. Therefore, if the magnitude of
polymerization stress due to shrinkage can be reduced, the resulting effect on clinical
success of composite systems may be improved.
Advantages of SDR™ Technology: Conventional dental composite materials are
composed of reactive organic resins and mineral fillers. SDR™ differs from
conventional resin by incorporation of Stress Decreasing Resin (SDR) technology.
When a resin system is exposed to visible light, polymerization proceeds rapidly with
concurrent volumetric shrinkage. With traditional resin systems, this rapid
polymerization and shrinkage leads to a large increase in polymerization stress as
shown in Figure 2. In contrast, with SDR™, under the same conditions, the increase
in stress with time is greatly reduced. SDR™ resin provides an approximate 20%
reduction in volumetric shrinkage and almost an 80% reduction in polymerization
stress compared to a traditional resin system.

Scientific Compendium SDR™ 9
Figure 2 Polymerization Stress development for traditional methacrylate resin compared to SDR™ Resin Technology
Of key note is the fact that curing rates and overall conversion are not sacrificed with
SDR™. As shown in Figure 3, FTIR analysis of double bond conversion during curing
of SDR resin and formulated SDR show very similar conversion rates to conventional
resin and conventional composites such as Esthet•X flow.
Figure 3 Degree of Double Bond Conversion vs. Time comparing neat resin or formulated product of Esthet•X flow to SDR™.
Further, the high degree of double bond conversion ensures the development of the
physical and mechanical properties required for the use of SDR™ material as a
posterior bulk fill flowable base. As shown in Figure 4, photo-rheology studies of the
modulus development during curing illustrate the rapid network formation and
strength development achieved with SDR™. The rate of modulus development of
SDR™ is quite similar to a conventional flowable composite such as Esthet•X flow.
0
1
2
3
4
5
0 0.5 1 1.5 2
Cu
rin
g S
tre
ss
[M
Pa
]
Time [Min.]
Traditional Resin
SDR Resin

Scientific Compendium SDR™ 10
Figure 4 Storage Modulus Development vs. Time for Traditional Flowable (Esthet•X flow) compared to SDR™
2.2 Composition of SDR™
As shown in Table 1, the composition of SDR™ is a complex formulation of both
conventional and novel components.
Table 1 The composition of SDR™ material comprises familiar and new components, each having specific functions in the overall composition
The novel SDR™ Resin technology (US Patents pending) is a urethane di-
methacrylate structure that is responsible for the reduction in polymerization
shrinkage and stress. SDR™ has very low overall shrinkage (3.5%) compared to
other conventional flowable composites. Lower volumetric shrinkage contributes to

Scientific Compendium SDR™ 11
overall lower shrinkage stress. This is due in part to the larger size of the SDR™
resin compared to conventional resin systems (molecular weight of 849 g/mol for
SDR™ resin compared to 513 g/mol for Bis-GMA). The SDR™ Technology
comprises the unique combination of such a large molecular structure with a
chemical moiety called a ―Polymerization Modulator‖ chemically embedded in the
center of the polymerizable resin backbone of the SDR™ resin monomer (see Figure
5).
Figure 5 Chemistry of SDR™ Technology.
The high molecular weight and the conformational flexibility around the centered
modulator impart optimized flexibility and network structure to SDR™ resin. Dynamic
Mechanical Analysis (DMA) can be used to characterize visco-elastic materials.
Figure 6 shows the tan Delta over temperature curve comparing SDR™ resin and
SDR™ composite to Esthet•X flow and the respective neat resin after curing. The
peaks in this graph represent the glass transition temperature (Tg). Both, SDR™
resin and SDR™ composite show not only a lower TG but also a higher tan Delta.
Simplifying, the tan Delta expresses the ratio between dissipation (resulting from
viscous behavior) and storage (resulting from elastic behavior) of energy induced into
the material. Higher tan Delta is related to higher dissipation of induced energy. As a
result SDR™ is able to dissipate more energy (and store less) when energy is
induced e.g. during polymerization.

Scientific Compendium SDR™ 12
Figure 6 Tan Delta vs. Temperature from Dynamic Mechanical Analysis (DMA) for neat resin or formulated product comparing Esthet•X flow to SDR™
The methacrylate functional groups in the resin allow reaction to other typical
methacrylate systems currently used in nearly all composite restorative materials.
Thus, traditional total or self-etch methacrylate based adhesives will react with the
SDR™ material via the same reaction as other traditional composite restoratives.
The other polymerizable resins noted above are used in other DENTSPLY products,
such as Esthet•X®HD Micro Matrix Restorative, TPH®3 Micro Matrix Restorative, etc.
These resins provide structural reinforcement of the restorative, as well as strong
crosslinking of the polymer network upon polymerization. The SDR™ formulation
takes advantage of high glass filler loading (68% by weight, 45% by volume) to both
decrease volumetric shrinkage and increase strength properties. The unique
combination of fillers with SDR™ resin provides high depth of cure, and the proper
rheology to achieve the unique self leveling characteristic for optimum adaptation and
marginal integrity. The photoinitiator system, and the colorant are also trusted
components used in other DENTSPLY restorative materials.
In summary, the unique structure of the Stress Decreasing Resin provides low stress
to the composite system. The optimized balance of properties exhibited by SDR™ is
a result of the combination of SDR™ resin with fillers and other formulation
components. SDR™ combines these features to deliver the first posterior flowable
base which can be bulk filled.

Scientific Compendium SDR™ 13
3 Indications for Use
SDR™ Smart Dentin Replacement is intended to be used as a
Base in cavity class I & II direct restorations
Liner under direct restorative materials – Class II box liner
SDR™ material is contraindicated for use with patients who have a history of severe
allergic reaction to methacrylate resins or any of the components. (See Appendix A
for complete Directions for Use.)
4 Clinically Relevant, in-vitro Physical Properties
The data presented in the following sections represents those in-vitro test procedures
that are designed to closely approximate clinically relevant properties of the SDR™
material. All results for individual test results presented were performed in the same
laboratories under identical conditions wherever possible. Thus, within each group of
test results, comparison among products may be inferred. Caution should be applied
when attempting to compare similar test results from different laboratories due to
potentially different test conditions, parameters, etc. Where noted, accepted,
standardized International Standards Organization (ISO) test methods were utilized
in performing the testing. Please refer to the appropriate Appendices for a description
of the test methodologies used for each respective property noted.
4.1 Polymerization Effects
4.1.1 Volumetric Shrinkage
The volumetric shrinkage of various flowable materials compared to SDR™ material
is recorded in Figure 7.

Scientific Compendium SDR™ 14
Figure 7 Volumetric Shrinkage of SDR™ material compared to other flowable materials
As will be noted from the results, the volumetric shrinkage of SDR™ material has
been optimized to be lower than the majority of flowable materials. As discussed
above, shrinkage observed on polymerization is a result of the chemical reaction of
monomers and pre-polymers within the uncured composite reacting to visible light
activation. The process of polymerization results in a net loss in volume which, if
taken alone, would imply that the goal would be to reduce the shrinkage to as low a
value as possible. On the other hand, ensuring maximum polymerization conversion
implies that maximum shrinkage must occur in order to maximize the properties of
the resulting polymer. Thus, this apparent conflict of minimizing shrinkage while
maximizing conversion has been resolved with the SDR™ Technology through a
reduction in the net polymerization stress that results from the shrinkage. Simply
reducing the polymerization shrinkage without addressing the polymerization stress
that is the result of the shrinkage process would be to overlook the root cause of the
adverse effects observed in numerous clinical restorations. Thus, with SDR™,
significant reduction in polymerization stress was the primary objective in designing a
truly unique and ground breaking development, as discussed below.

Scientific Compendium SDR™ 15
4.1.2 Polymerization Stress
It is well recognized that the polymerization stress resulting from the polymerization
shrinkage of composite restorations can lead to numerous adverse clinical effects,
including de-bonding, post-operative sensitivity, marginal discrepancies, etc.
(Yamazaki et al, 2006; Blaes 2008; Condon et al 2000; Ferracane 2008). The build-
up of polymerization stress is a direct result of the polymerization shrinkage and
constraint placed on the composite restoration. Constraint within the system is
commonly a result of the bonded interfaces to which the composite restorative is
attached. Thus, adhesive bonding of the composite restorative resists the contraction
stresses during polymerization shrinkage which can cause stresses to accumulate at
the bonded interface and within the material. SDR™ was designed to mediate the
polymerization reaction process so as to allow for low stress build-up during
developing the polymer.
Several different methodologies were used to measure and record the polymerization
stress developed upon light curing in different composite restorative materials (See
Appendix for description of each method). Although each method uses differing
techniques to observe the stress development, it will be noted that the overall results
remain consistent; SDR™ demonstrated the lowest overall stress development of all
materials evaluated.
4.1.2.1 National Institute of Standards and Technology (NIST) Tensometer Stress
Method
(Echmiller FC, 2004; Lu H et al, 2004)
The NIST Tensometer (see Appendix 8.2.2) is an industry recognized method for
direct measurement of polymerization stress within a composite material at the same
time the measurement of the shrinkage of the system is occurring. Materials of
varying viscosities and curing mechanism can be evaluated on the device, along with
the relative degree of bonded to unbounded interfaces (e.g. ―C-factor‖ [Feltzer AJ, et
al, 1987]). The reduction in polymerization stress using the SDR™ technology
compared to other composite flowable restoratives is presented in Figure 8. As can
be observed from the data, the polymerization stress developed by SDR™ material is
statistically significantly lower than all the traditional flowable materials evaluated. In

Scientific Compendium SDR™ 16
addition, the polymerization stress of SDR™ material is significantly lower than any of
the traditional Universal/Posterior composite restoratives recorded in Figure 9.
Figure 8 Polymerization Stress (NIST Tensometer) of SDR™ compared to other flowable materials

Scientific Compendium SDR™ 17
Figure 9 Polymerization Stress (NIST Tensometer) of SDR™ compared to other Universal/ Posterior Composite materials
4.1.2.2 Photoelastic Stress Method
The polymerization stress of SDR™ and several other materials was also evaluated
using a photoelastic apparatus to record stress development during light curing
(Ernst C-P et al 2009). A description of the methodology is shown in the diagram
below and in the Appendix 8.2.3.
Specifically designed photoelastic materials having a lower photoelastic constant
were prepared as holders for the tested polymerizing materials. The materials to be
evaluated were bonded into the holders using a visible light curing device (See
diagram at the left in Figure 10) and the photoelastic images recorded at 4 minutes
and 24 hours post-curing. The resulting isochromatic rings allowed for visualizing the
strain within the material. From the measured strain, stress values (MPa) were
calculated. The results of the testing of SDR™ and other flowable materials are
plotted in Figure 11 at t = 4 minutes and also 24 hours. Based on the results, the
investigator provided conclusions regarding the stress developed in SDR™ material
compared to other traditional flowable composites—see Table 2.

Scientific Compendium SDR™ 18
Figure 10 Polymerization Stress using Photoelastic stress methodology (Ernst CP, University of Mainz, Germany)
Figure 11 Polymerization Stress of SDR™ material compared to other Flowable materials, Composites, and ―low shrinkage materials‖ using Photoelastic Stress methodology (Ernst CP, 2009)

Scientific Compendium SDR™ 19
Table 2 Polymerization Stress of SDR™ material – Conclusions (Ernst CP, 2009)
4.1.2.3 Stress-Strain-Analyzer
Finally, the polymerization stress developed during the polymerization shrinkage of
several materials was also measured using a Stress-Strain-Analyzer which
continuously measured the contraction force generated by polymerizing the
restorative material during light exposure, taking into account the compliance of the
machine (Ilie N, 2007). The force generated was recorded in steps of 0.2 seconds for
up to 300 seconds after start of polymerization, with each experiment conducted at
room temperature and repeated ten (10) times for each material. Averaged curves of
contraction force for different time spans are shown in Figure 14 to Figure 12.
Figure 12 Averaged curves (mean of 10 runs) of contraction force within the first 5 seconds

Scientific Compendium SDR™ 20
Figure 13 Averaged curves of contraction force within the first 30 seconds
Figure 14 Averaged curves of contraction force up to 300 seconds
The polymerisation stress for SDR™ compared to two other flowable and universal
composites, as well as Filtek Silorane are shown in Figure 15. A description of the
methodology is presented in the Appendix 8.2.4.

Scientific Compendium SDR™ 21
Figure 15 Polymerization Stress of SDR™ material using a Stress-Strain-Analyzer (Ilie N, Academy of Dental Materials 2009 #10)
As can be seen from the Stress-Strain-Analyzer, the results show SDR™ having the
lowest overall stress developed and are in good agreement with the other two test
procedures performed independently.
4.1.3 Curing Effectiveness
4.1.3.1 Depth of Cure: ISO 4049
The depth of cure for various flowable restoratives was measured following the
procedure described in ISO 4049:2009(E). The restorative material was light cured
for 20 seconds in a stainless steel mold with a cylindrical chamber, 4mm in diameter
and 8mm deep (10mm deep for SDR™) with a Whatman No. 1 filter paper as
background using a Spectrum 800 halogen light at a light intensity of 500-550
mW/cm2. The uncured underside was scraped away using a plastic spatula and the
thickness of the remaining, cured composite was measured using a micrometer. The
depth of cure was determined to be equivalent to the remaining thickness of material
divided by two. The depth of cure as measured by ISO 4049 is shown below in
Figure 16.

Scientific Compendium SDR™ 22
Figure 16 Depth of Cure (ISO 4049) of SDR™ flow material compared to other Flowable materials, 20 second irradiation
As noted from the results, the depth of cure of SDR™ material exceeded all other
flowable materials by about 1 mm to over 2 mm. It should be noted that the ISO test
described is a reasonable approximation to curing within composite materials.
However, in order to ensure that the SDR™ material was completely cured
throughout the 4 mm increment recommended, additional, more discriminating tests
were performed and described as follows.
4.1.3.2 Degree of Conversion
With the recommendation for curing the SDR™ material in increments of 4 mm, it
was essential to not only establish the low polymerization stress as noted above, but
it was also critical to establish that the material had effective curing throughout a 4
mm increment. Thus, in addition to ISO depth of cure measurements, experiments
were conducted to evaluate the degree of conversion of SDR™ material versus the
thickness of material cured. The degree of conversion represents the extent to which
the monomers are converted into polymer for the composite restorative material. The
degree of conversion was measured using Attenuated Total Reflectance (ATR)-Near
Infrared analysis (NIR). The degree of conversion for a methacrylate based

Scientific Compendium SDR™ 23
restorative is typically on the order of 50 to 70%. Degree of Conversion higher that
70% for these filled restorative systems is not obtained due to inability for all the
methacrylate portions of the molecules to react completely, but this does not imply
inferior curing.
Figure 17 Degree of Conversion (%) of SDR™ material at varying thickness of cured material. (20 seconds curing time, NIR Analysis)
The graph in Figure 17 represents the degree of conversion (%) at the top of a cured
specimen of SDR™ material (nearest the curing light) and the % conversion at the
bottom of a cured specimen of 2 mm, 3 mm, 4 mm, and 5 mm, respectively. The
degree of conversion at both the top surface, as well as the bottom surface, is nearly
equivalent, confirming the excellent conversion of the SDR™ material even up to 5
mm. This is a key property that demonstrates acceptable conversion with the high
depth of cure recommended for SDR™ material. This, along with the low stress, is
one of the enabling properties that differentiate SDR™ material from other flowables.
This measurement of degree of conversion was also independently confirmed using
a similar methodology (Reis A, 2009). In this study, several flowable restoratives, as
well as one restorative material, were measured for degree of conversion versus
thickness of the specimen. While the absolute values are slightly lower using this
method to determine degree of conversion, the results for SDR™ material are very
consistent with the ATR-NIR results above. The degree of conversion at various
depths was plotted in Figure 18.

Scientific Compendium SDR™ 24
Figure 18 Degree of Conversion (%) versus depth of cure for 20 seconds by FTIR Analysis. (Note: Filtek Silorane cured 40 seconds) (Reis A, Univ. of Guarulhos, SP Brazil)
As can be seen from the results, the degree of conversion versus depth of different
materials varied considerably. One material (Tetric EvoFlow, Ivoclar-Vivadent)
recorded no measurable conversion at 6 mm. The considerably lower degree of
conversion versus depth for traditional flowables confirms that these materials should
only be placed in 1 to 2 mm increments. Again, SDR™ material demonstrated very
good conversions even to a depth of 6 mm from the light source, confirming bulk
placements up to 4 mm as recommended. Also note that the results for curing using
a quartz halogen (QTH) light were essentially equivalent to curing using a LED
device (Column 1 and 2 respectively in Figure 18).
4.1.3.3 Knoop Hardness
The Knoop Hardness was measured for a number of flowable composite restorative
materials versus SDR™ material. The ratio (%) of the Knoop hardness at the top
surface versus the Knoop Hardness at the bottom of a predetermined thickness of
material (2, 3, 4, and 5 mm) was then determined. A higher percentage ratio of the
bottom to top hardness values indicates a more effective curing efficiency through
the material. Typically, a value of 80% (bottom to top) is considered to be effectively
cured. As can be noted from Figure 19, the % ratio of Knoop Hardness bottom to top
at 2 mm is nearly 100% for all materials as expected, with the notable exception of
one material (Tetric EvoFlow, Ivoclar-Vivadent). However, for increasing thicknesses
of material, the % bottom to top ratio drops rapidly, except for SDR™ material, which
maintains a high % bottom to top ratio even through 5 mm thickness. These results
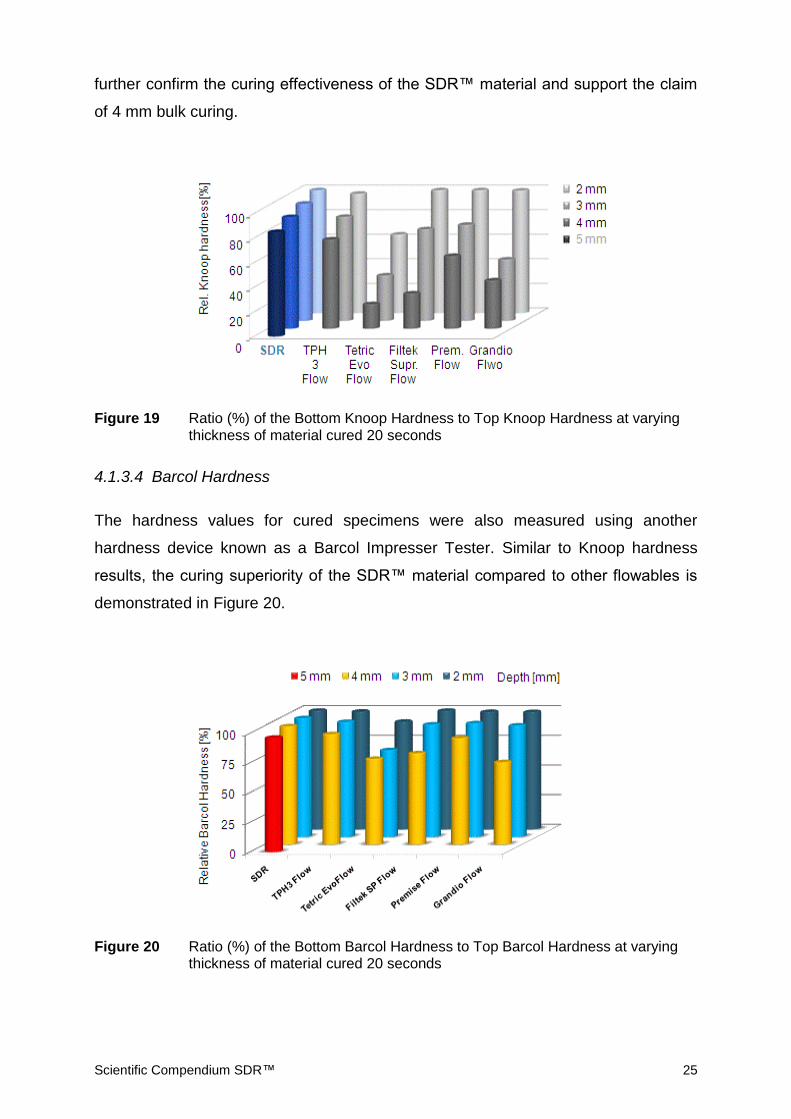
Scientific Compendium SDR™ 25
further confirm the curing effectiveness of the SDR™ material and support the claim
of 4 mm bulk curing.
Figure 19 Ratio (%) of the Bottom Knoop Hardness to Top Knoop Hardness at varying thickness of material cured 20 seconds
4.1.3.4 Barcol Hardness
The hardness values for cured specimens were also measured using another
hardness device known as a Barcol Impresser Tester. Similar to Knoop hardness
results, the curing superiority of the SDR™ material compared to other flowables is
demonstrated in Figure 20.
Figure 20 Ratio (%) of the Bottom Barcol Hardness to Top Barcol Hardness at varying thickness of material cured 20 seconds

Scientific Compendium SDR™ 26
4.2 Adhesion & Adaptation
4.2.1 Enamel & Dentin Bonding
The enamel and dentin bond strengths of SDR™ material were measured and
compared to the bond strengths of Esthet•X® flow liquid micro hybrid using an
Ultradent testing apparatus. The bonding agents used for testing were the
conventional, methacrylate based adhesives, Prime & Bond® NT™ total etch and
Xeno® IV Light Cured Self-Etching dental adhesives. As can be noted from Figure 21
below, the bond strengths of the SDR™ material are equivalent to those of the
conventional resin system used in Esthet•X® flow liquid micro hybrid, confirming the
complete compatibility with current methacrylate based adhesives.
Figure 21 Adhesive bond strength to human enamel & dentin using SDR™ material and Esthet•X® flow
4.2.2 Class I Micro-tensile Bond Strength
Dr. Andre F. Reis
The purpose of this study was to evaluate the micro-tensile bond strength at the
pulpal floor of Class I cavities restored with SDR™ material and Esthet•X®HD
composite, another flowable/universal composite material and the Filtek Silorane
system. The results are shown in Figure 22.

Scientific Compendium SDR™ 27
Figure 22 Micro-tensile bond strengths to human dentin restored in Class I cavities (Reis A, Univ. of Guarulhos, SP Brazil)
Freshly extracted human third molars were used in this study. Five teeth were used
for each experimental group (N=5). After disinfection and removal of soft tissues a
standardized Class I occlusal preparation (6 mm long X 4 mm wide X 5 mm deep)
was made in each tooth using coarse diamond burs operated in a high-speed hand-
piece using copious air-water spray.
Prepared teeth were randomly assigned to groups according to each restoration
protocol. The adhesive material(s) were applied according to the recommended
manufacturer’s directions. In the experiments using SDR™ material, the flowable
material was placed in 4 mm bulk increments and light cured for 20 seconds. An
occlusal layer of approximately 1 to 1 mm of Esthet•X® HD composite was
incrementally added to build the final anatomy of the teeth. In the group using Filtek
Supreme Flow, a 1 mm layer was applied and light cured for 20 seconds, followed by
incrementally placing 2, ~ 2 mm oblique layers of Filtek Supreme XT and light curing
for 20 seconds per increment. After placing Filtek Silorane Self-Etch Primer and
Bond according to the manufacturer’s directions, Filtek Silorane was placed
incrementally using the horizontal layering technique (increments of approximately 2
mm were used). Each increment was cured for 40 seconds.
Following restorative procedures, the specimens were placed in water for 24 hours
prior to testing. The restored teeth were sectioned in a bucco-lingual direction into
approximately 0.8 mm thick slabs with a diamond saw under water lubrication
(Isomet 1000, Buehler). Four or five slabs were obtained from each tooth. Each slab
was trimmed from both sides with an extra-fine diamond bur to reduce the cross-

Scientific Compendium SDR™ 28
sectional area at the interface of the pulpal wall to approximately 1 mm2. Bonded
specimens were tested in tension with a universal testing machine (EZ Test,
Shimadzu) using a Ciucchi’s jig at a crosshead speed of 1 mm/min. The μ-TBS
values were expressed in MPa, which was calculated by dividing the peak break by
the cross-sectional area of the bonded interface. Data were statistically analyzed by
one-way ANOVA and Tukey test at the 5% confidence level.
As noted in Figure 22, the micro-tensile bond strength of Prime & Bond® NT™ in
combination with SDR™ material and Esthe•X® HD composite provided statistically
significantly higher results than the other three systems, which were in themselves,
not statistically different. In addition, it should be noted that less steps were required
to complete the SDR™ material Esthet•X® HD composite restorations as compared
to either the flowable/universal restorative or the posterior restorative systems.
4.3 Microleakage & Marginal Integrity
Dr. Andre F. Reis, Guarulhos, SP Brazil
4.3.1 Class I Restorations; Microleakage
The purpose of this study was to evaluate the microleakage around Class I cavities
restored with SDR™ material and Esthet•X® HD composite, another
flowable/universal composite material and one posterior restorative. The results are
shown in Figure 23.

Scientific Compendium SDR™ 29
Figure 23 Microleakage on extracted human teeth using standardized Class I occlusal preparations. Specimens were stored 24 hours in water. (Reis A, Univ. of Guarulhos, SP Brazil)
The methodology used to prepare the cavities and restorative procedures were
identical to the methodology described in Section 4.2.2 above. After the restorative
procedures, teeth were placed in water for 24 hours prior to testing. Restored teeth
were coated with two layers of nail varnish applied up to within 1mm of the bonded
interfaces. In order to avoid desiccation artefacts, they were immersed in distilled
water for 20 min prior to immersion in the tracer solution for 24 hours. Ammoniacal
silver nitrate was prepared according to the protocol previously described (Tay et al,
2002). Tooth slabs were placed in the tracer solution in total darkness for 24 hours,
rinsed thoroughly in distilled water, and immersed in photo-developing solution for 8
hours under a fluorescent light to reduce silver ions into metallic silver grains within
gaps along the interface. The teeth were subsequently rinsed under running water to
remove external dye. The specimens were sectioned longitudinally through the
center of the restorations with a diamond saw (Isomet Buehler). Each cavity was
sectioned into three parts. The degree of dye penetration was then recorded (in mm)
for each one of the slabs and a mean value was obtained for each tooth. Dye
infiltration was expressed as a percentage of the total area of the cavity.
Microleakage values were statistically analyzed by One-way ANOVA and Tukey test
at the 5% confidence level.
As noted in Figure 23, the microleakage of Prime & Bond® NT™ adhesive in
combination with SDR™ material and Esthet•X® HD composite, trended lower than

Scientific Compendium SDR™ 30
other systems, though not statistically significant, and was restored in fewer steps
with shorter curing times, thus reducing the overall time to complete the restoration.
4.3.2 Class I Restorations – Internal Cavity Adaptation
The purpose of this study was to evaluate the extension of internal cavity adaptation
around Class I cavities restored with SDR™ material and Esthet•X® HD composite,
another flowable/universal composite material and one posterior restorative. The
results are shown in Figure 24.
Figure 24 In-vitro Cavity Adaptation of restored Class I cavities using SDR™ material and other systems (Reis A, Univ. of Guarulhos, SP Brazil)
Samples were prepared as described in Section 4.3.1 (Microleakage). After
restorative procedures teeth were placed in water for 24 hours. The specimens were
then sectioned longitudinally through the center of the restorations with a diamond
saw (Isomet Buehler). Each cavity was sectioned into three parts. The central slab in
each tooth was selected for gap formation analysis using a replica technique. Slabs
were embedded in epoxy resin and then finished with 400, 600, 1000 and 2000-grit
SiC paper under water and then polished with 6, 3, 1 and 0.25 μm diamond paste
using a polish cloth. An impression of the specimens was taken using a PVS
impression material and replicas were made with epoxy resin (Epoxycure, Buehler).
Replicas were sputter-coated with gold (MED 010) and observed under an SEM
(LEO 435 VP). Representative areas of the interfaces were photographed. The
extension of gaps was determined (in millimeters) using an image analysis software
(Image J, NIH). Gap extension was expressed as a percentage of the total cavity
contour. Results were statistically analyzed by ANOVA.

Scientific Compendium SDR™ 31
As noted in Figure 24, the internal cavity adaptation of Prime & Bond® NT™ adhesive
in combination with SDR™ material and Esthet•X® HD composite was nearly perfect,
taking note that the SDR™ material was placed in a bulk (4mm) increments. Curing
time for the SDR™ material/Esthet•X® HD composite combination was also
considerably shorter than that for the other systems.
4.3.3 Class II Restorations – Marginal Integrity
The purpose of this study was to evaluate the marginal integrity of Class II cavities
restored with SDR™ material and Esthet•X® HD composite. Another
flowable/universal composite material restored by two different procedures was also
included in the study.
Freshly extracted human third molars were used in this study. Five teeth were used
for each experimental group (N=5). After disinfection and removal of soft tissue, a
standardized MOD preparation was made in each tooth using a coarse diamond bur
operated in a high-speed hand-piece using copious air-water spray. The margin of
the mesial proximal box was placed in dentin (1 mm apical to the CEJ) and the distal
margin was placed in enamel (1 mm coronal to the CEJ). Prepared teeth were
randomly assigned to groups according to each restoration protocol. The prepared
teeth were mounted in a jig featuring artificial training teeth that served as adjacent
teeth. A contoured matrix band was placed around the teeth for restorative
procedures.
The adhesive (either Prime & Bond® NT™ adhesive or Scotchbond 1 XT) material
was applied according to the recommended manufacturer’s directions. In the
experiments using Prime & Bond® NT™/SDR™ material, the flowable material was
placed in 4 mm bulk increments and light cured for 20 seconds. An occlusal layer of
approximately 1 to 1 mm of Esthet-X® HD composite was incrementally added to
build the final anatomy of the teeth. In the group using Filtek Supreme Flow, after
application of Scotchbond 1 XT, a 1 mm layer was of the flowable material was
applied and light cured for 20 seconds, followed by incrementally placing ~ 2 mm
oblique layers of Filtek Supreme XT and light curing for 20 seconds per increment,
according to the manufacturer’s directions. In a third, experimental group, the
adhesive application was performed per manufacturer’s instructions, followed by a 4

Scientific Compendium SDR™ 32
mm bulk placement of Filtek Supreme Plus Flowable and light curing for 20 seconds.
An occlusal layer of approximately 1 mm of Filtek Supreme Plus was incrementally
added to build the final anatomy of the teeth, with each increment cured for 20
seconds. (Note: This final procedure is not recommended by the manufacturer,
but was performed to evaluate bulk placement performance of a flowable material
with higher shrinkage and polymerization stress.)
After restorative procedures, an impression of the proximal boxes of each specimen
was made with a VPS material (Aquasil Ultra XLV) and replicas were made using
epoxy resin (Epoxycure, Buehler) for SEM evaluations of the marginal integrity.
Replicas were sputter-coated with gold (MED 010) and observed under an SEM
(LEO 435 VP). Representative areas of the interfaces were photographed. The
extension of marginal defects was determined (in millimeters) using an image
analysis software (Image J, NIH). Results, expressed as a percentage of total
marginal lengths, were expressed as a percentage. The summary data is presented
in Figure 25.
Figure 25 Marginal Integrity of restored Class II cavities using SDR™ material and other systems (Reis A, Univ. of Guarulhos, SP Brazil)
The results of this evaluation confirm that the bulk (4mm) placement of SDR™
material in combination with Esthet•X® HD composite performs statistically equivalent
to that of the traditional, incrementally placed, 1 mm of flowable with universal
composite. The experimental group also confirms that bulk placement of a traditional
flowable material leads to statistically poorer results, presumably due to the higher
shrinkage and polymerization stress of the traditional flowable material.

Scientific Compendium SDR™ 33
4.3.4 Class II Restorations: Marginal Integrity after chewing simulation
Prof. Roland Frankenberger, Marburg, Germany
In this study, MOD restorations in human teeth were evaluated for marginal integrity
after simulated chewing conditions. The conditions of the tests (as summarized in
Figure 26) included thermal cycling for 2500 cycles between 5 and 55 degrees
centigrade, followed by 100,000 cycles in an in vitro chewing device with 50 N of
force applied for each cycle. Upon completion of the testing, the teeth were evaluated
for marginal integrity (and internal adaptation in a second study) using Scanning
Electron Microscopy (SEM), and the percentage of perfect margins was determined.
Figure 26 Protocol for in vitro cyclic fatigue of Class II restorations
In the first study, the Class II restoration tested included a 4 mm bulk placement of
SDR™ material, followed by Esthet•X® HD composite as capping material which was
compared to a control of Ceram•X™ nano ceramic composite applied in conventional
incremental layering technique.
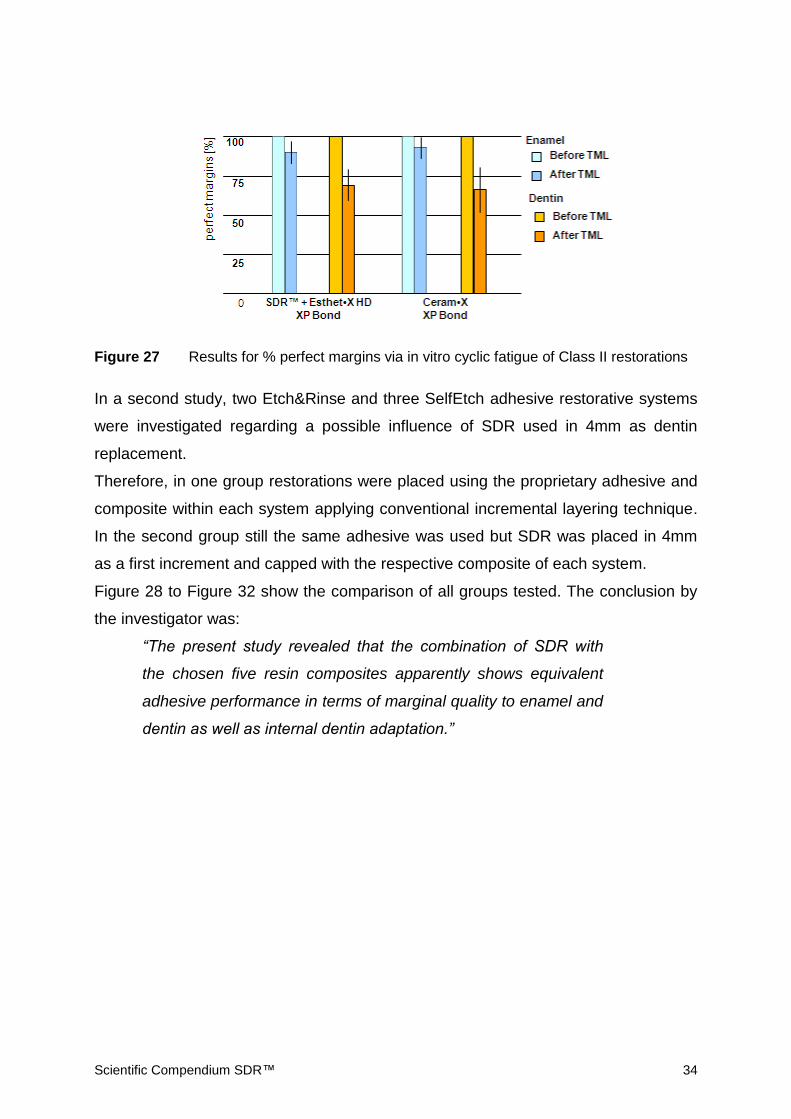
As depicted in Figure 27, the % perfect margins in both enamel and dentin, before
and after thermo-mechanical loading (TML) were equivalent for both test groups.
Thus, the bulk placement of the SDR™ material in combination with Esthet•X® HD
composite produced the same degree of perfect margins as Ceram-X™ nano ceramic
composite under the condition of the test procedure.
Scientific Compendium SDR™ 34
Figure 27 Results for % perfect margins via in vitro cyclic fatigue of Class II restorations
In a second study, two Etch&Rinse and three SelfEtch adhesive restorative systems
were investigated regarding a possible influence of SDR used in 4mm as dentin
replacement.
Therefore, in one group restorations were placed using the proprietary adhesive and
composite within each system applying conventional incremental layering technique.
In the second group still the same adhesive was used but SDR was placed in 4mm
as a first increment and capped with the respective composite of each system.
Figure 28 to Figure 32 show the comparison of all groups tested. The conclusion by
the investigator was:
“The present study revealed that the combination of SDR with
the chosen five resin composites apparently shows equivalent
adhesive performance in terms of marginal quality to enamel and
dentin as well as internal dentin adaptation.”

Scientific Compendium SDR™ 35
4.3.4.1 Marginal Integrity and Internal Adaptation – Etch&Rinse Adhesives
Figure 28 Percentage of perfect margins and internal adaptation before and after thermomechanical loading comparing incremental layering technique to SDR XP BOND + Ceram•X mono+
Figure 29 Percentage of perfect margins and internal adaptation before and after thermomechanical loading comparing incremental layering technique to SDR Syntac + Tetric EvoCeram

Scientific Compendium SDR™ 36
4.3.4.2 Marginal Integrity and Internal Adaptation – SelfEtch Adhesives
Figure 30 Percentage of perfect margins and internal adaptation before and after thermomechanical loading comparing incremental layering technique to SDR iBond SelfEtch + Venus Diamond
Figure 31 Percentage of perfect margins and internal adaptation before and after thermomechanical loading comparing incremental layering technique to SDR Adper Prompt L-Pop + Filtek Supreme XT

Scientific Compendium SDR™ 37
Figure 32 Percentage of perfect margins and internal adaptation before and after thermomechanical loading comparing incremental layering technique to SDR Xeno V + Ceram•X mono+
4.3.5 Class II Restorations; Microleakage
The purpose of this study was to evaluate the microleakage of Class II cavities
restored with SDR™ material and Esthet•X® HD composite. Another
flowable/universal composite material restored by two different procedures was also
included in the study.
Samples were prepared as described in Section 4.3.3 (Marginal Integrity). The
restored teeth were coated with two layers of nail varnish applied up to within 1 mm
of the bonded interfaces. In order to avoid desiccation effects, the teeth were
immersed in distilled water for 20 minutes prior to immersion in the tracer solution for
24 hours. Ammoniacal silver nitrate was prepared according to the protocol
previously described (Tay, FR et al, 2002). Tooth slabs were placed in the tracer
solution in total darkness for 24 hours, rinsed thoroughly with distilled water, and
immersed in photo-developing solution for 8 hours under a fluorescent light to reduce
silver ions into metallic silver grains within gaps along the interface.
The teeth were subsequently rinsed under running water to remove external dye. The
specimens were sectioned longitudinally through the center of the restorations with a
diamond saw (Isomet Buehler). Each cavity was sectioned into two parts. The dye
penetration was then recorded (in mm) for each slab and a mean value was obtained
for each tooth. Dye infiltration was expressed as a percentage of the total area of the

Scientific Compendium SDR™ 38
cavity. Microleakage values were statistically analyzed by Two-way ANOVA and
Tukey test at the 5% confidence level. The results are presented in Figure 33.
As noted in the marginal integrity section, the results of this evaluation again confirm
that the bulk (4mm) placement of SDR™ material in combination with Esthet•X® HD
composite performs statistically equivalently to that of the traditional, incrementally
placed, 1 mm of flowable with universal composite. Again, the experimental group
also confirms that bulk placement of a traditional flowable material leads to
statistically poorer results, presumably due to higher shrinkage and polymerization
stress.
Figure 33 Microleakage of restored Class II cavities using SDR™ material and other systems
4.3.6 Class II Restorations; Internal Cavity Adaptation
The purpose of this study was to evaluate the internal adaptation of Class II cavities
restored with SDR™ material and Esthet•X® HD composite. Another
flowable/universal composite material restored by two different procedures was also
included in the study.
Samples were prepared as described in Section 4.3.3 (Marginal Integrity). The
specimens were sectioned longitudinally through the center of the restorations with a
diamond saw (Isomet Buehler). One section of each tooth was selected for gap
formation analysis using a replica technique. Slabs were embedded in epoxy resin
and finished with 400, 600, 1200, and 2400-grit SiC paper under water and then
polished with 6, 3, 1, and 0.25 micron diamond paste using a polishing cloth. An
impression of the specimens was taken using a VPS impression material (Aquasil

Scientific Compendium SDR™ 39
Ultra XLV Smart Wetting® Impression Material) and replicas were made with epoxy
resin (Epoxycure, Buelher). Replicas were sputter-coated with gold (MED 010) and
observed under an SEM (LEO 435 VP). Representative areas of the interfaces were
photographed. The extension of interfacial gaps was determined (in mm) using an
image analysis software (Image J, NIH). Results were statistically analyzed by
ANOVA and Tukey Tests. The results are presented in Figure 34.
Figure 34 Internal Cavity Adaptation of restored Class II cavities using SDR™ material and other systems
As noted in the marginal integrity and microleakage sections, the results of this
evaluation of internal adaptation again confirm that the bulk (4mm) placement of
SDR™ material in combination with Esthet•X® HD composite performs statistically
equivalently to that of the traditional, incrementally placed, 1 mm of flowable with
universal composite. This feature is critically important to ensure that the entire
internal aspects of the cavity have been sufficiently coated with the flowable material.
Again, the experimental group also confirms that bulk placement of a traditional
flowable material leads to statistically poorer results, presumably due to higher
shrinkage and polymerization stress.

Scientific Compendium SDR™ 40
5 Other Mechanical, Physical & Miscellaneous Properties
The following sections describe additional mechanical, physical and miscellaneous
properties of SDR™ material. As will be noted from the extensive list of properties
that follow, the SDR™ material product often demonstrates the most advantageous
qualities in each set of test results. Descriptions of tests methods are included in the
Appendices. Where applicable, standardized test procedures following ISO
international standards were employed.
5.1 Compressive Strength & Modulus of Elasticity
Figure 35 Compressive strength & modulus of SDR™ material & other flowable composites
Scientific Compendium SDR™ 41
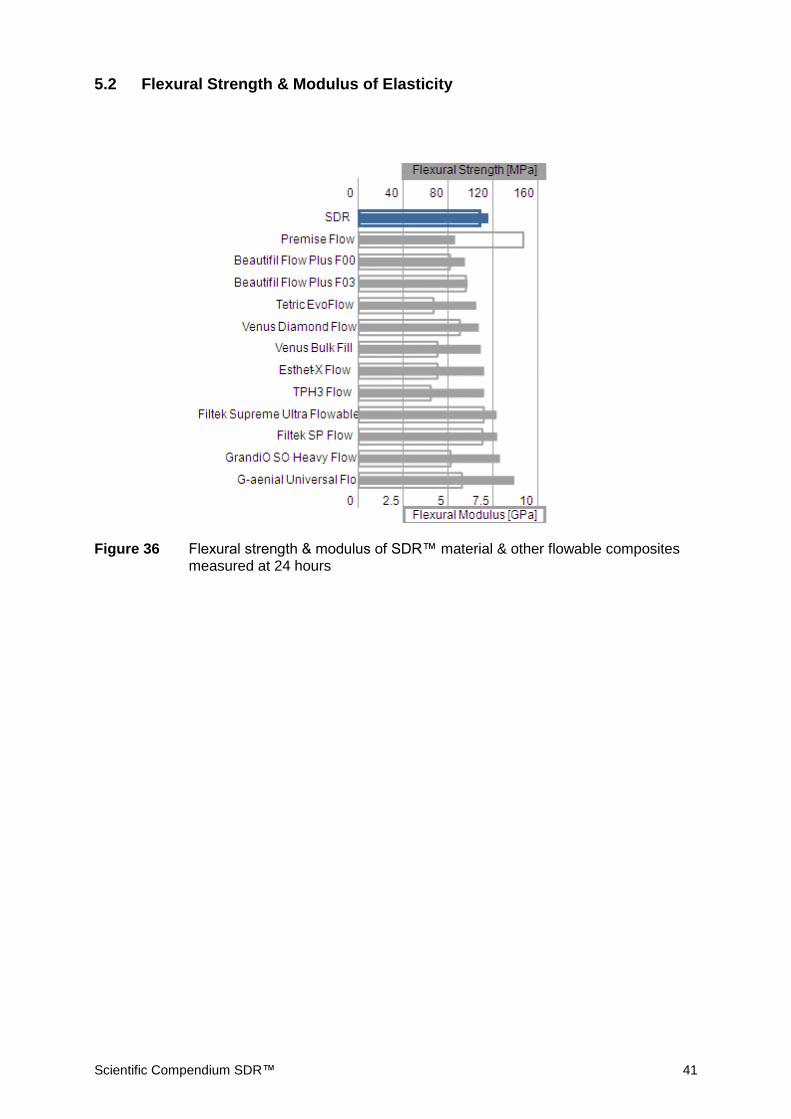
5.2 Flexural Strength & Modulus of Elasticity
Figure 36 Flexural strength & modulus of SDR™ material & other flowable composites measured at 24 hours

Scientific Compendium SDR™ 42
Figure 37 Flexural strength of SDR™ material & other composites measured at 24 hours (Shade A2 or Universal if not specified differently)
Figure 38 Flexural modulus of SDR™ material & other composites measured at 24 hours (Shade A2 or Universal if not specified differently)

Scientific Compendium SDR™ 43
5.3 Fracture Toughness
Figure 39 Fracture toughness of SDR™ material and other flowable composites
Figure 40 Fracture toughness of SDR™ material and other composites (Shade A2 or Universal if not specified differently)
Fracture toughness is a measurement to assess the resistance to crack propagation
within a restorative material when placed under occlusal loading. Resistance to
fracture and cracking in gingival and proximal margins is an important aspect of the
SDR™ material. As can be noted from Figure 39, SDR™ material has the highest
toughness among the flowable materials tested.

Scientific Compendium SDR™ 44
5.4 Diametral Tensile Strength
Figure 41 Diametral strength of SDR™ material & other flowable composites
Another measure of resistance to fracture is the diametral tensile strength of a
material. In this test, a compressive load is placed on the flat side of a short
cylindrical disk. The application of this compressive force results in tensile stress
within the specimen that passes through the center of the disk. The resulting tensile
stress is directly proportional to the applied compressive load applied. The testing
procedure approximates forces that can be placed on composites under chewing
forces observed in the mouth, measuring the resistance of the material to fractures.
Scientific Compendium SDR™ 45
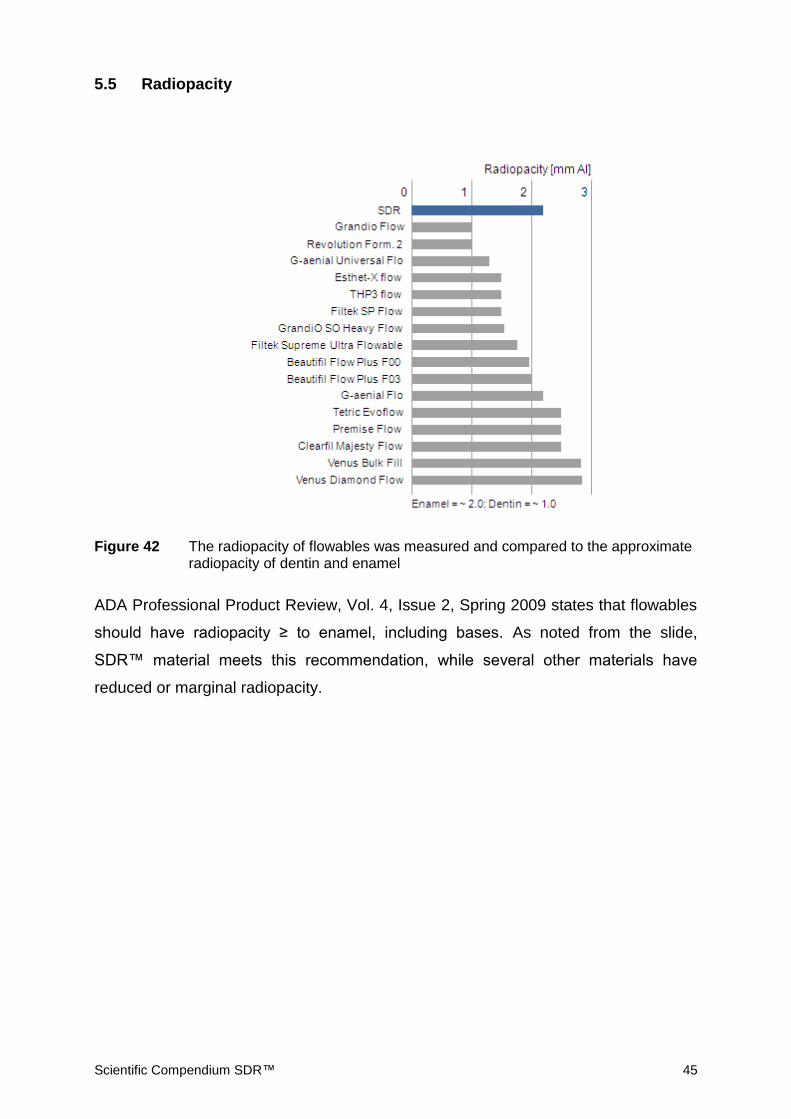
5.5 Radiopacity
Figure 42 The radiopacity of flowables was measured and compared to the approximate radiopacity of dentin and enamel
ADA Professional Product Review, Vol. 4, Issue 2, Spring 2009 states that flowables
should have radiopacity ≥ to enamel, including bases. As noted from the slide,
SDR™ material meets this recommendation, while several other materials have
reduced or marginal radiopacity.

Scientific Compendium SDR™ 46
5.6 Water Solubility & Water Sorption
Figure 43 Water solubility and water sorption using ISO standard test methods
Water solubility and water sorption play an important role in the lifespan of composite
restoratives. Limits for a materials water solubility and sorption have been
established in the International Standard Organization (ISO) standard for polymer
based restorative materials to be 7.5 µg/mm3 and 40 µg/mm3, respectively. SDR™
material falls within these parameters, having solubility and sorption values similar to
Esthet•X® flow and QuiXfil® Posterior Restorative.

Scientific Compendium SDR™ 47
5.7 Compatibility with Universal Composites
Figure 44 Compatibility of SDR™ material with various Universal / Posterior Composites (Shade A2 or Universal if not otherwise specified.)
As noted in the previous sections, the chemistry of SDR™ material comprises
traditional methacrylate functionality within the novel SDR™ resin technology. This
enables the SDR™ material to react effectively with traditional methacrylate based
adhesives and other composite restorative materials. When using the SDR™
material as a base or liner in a composite restoration, the ability to bond to the
overlaying restorative is obviously a critical requirement. In the test results on micro
tensile bond strength of layered samples shown above, the bond between SDR™
material and numerous universal composite restorative materials was evaluated. As
expected, there is a strong chemical bond between the SDR™ material and all of the
methacrylate based universal/posterior composite restorative materials.
5.8 Compatibility with Adhesives
In order to evaluate whether SDR adheres to a specific adhesive after application on
dentin SBS (Shear Bond Strength) was measured using the system composite

Scientific Compendium SDR™ 48
(composite of the same manufacturer as for the adhesive) in one group and SDR in
the other.
Figure 45 exemplarily shows the mean SBS of one adhesive when either the system
composite or SDR was bonded to dentin. Furthermore, the 95% confidence interval
is shown as well.
Finally the overlap between both confidence intervals is marked clearly showing that
SDR provides equal SBS compared to the system composite of the respective
adhesive. The overlap also describes the array of bond strength covered in this test.
Figure 45 Mean SBS and overlapping confidence interval
Figure 46 shows this overlap of confidence intervals for 6 composite/adhesive
combinations tested against SDR using the respective adhesive.

Scientific Compendium SDR™ 49
Figure 46 Compatibility of SDR with Etch&Rinse (E&R) and Self-Etch (SE) adhesives
From Figure 46 it can be concluded that there was no difference in SBS whether the
system composite or SDR was bonded to dentin.
5.9 Color Stability
Figure 47 The color stability of SDR™ material after water storage. Note: After exposure to UV Irradiation no noticeable color change was observed
The color stability of SDR™ material was evaluated following the procedures outlined
in the applicable ISO standards for color stability of restorative materials. As recorded

Scientific Compendium SDR™ 50
above, the color stability of SDR™ material is excellent and well below the delta E
value of 2.0, the point at which only those with very sharp visual acuity can begin to
observe a change in shade. No noticeable color change was observed with SDR™
material after excessive UV irradiation (see Appendix for details of the testing
protocol).
5.10 Fluoride Release
Figure 48 The Fluoride release of SDR™ material after storage in deionized water
Fluoride release from specimens of SDR™ material immersed in deionized water
was measured and recorded weekly. A measurable release of Fluoride was recorded
for each observation, with the release levels reaching a steady state after 15 weeks.

Scientific Compendium SDR™ 51
5.11 Overview Material Properties
SDR - Other technical data Value Unit
Fracture toughness 4.63 MPa*m1/2
Flexural Modulus 5753 MPa
Compressive strength 242 MPa
Compressive modulus 5539 MPa
Diametral tensile strength 50.7 MPa
Volume shrinkage 3.5 %
Water sorption 15.6 µg/mm³
Water solubility 2.4 µg/mm³
Depth of cure 4.1 mm
Radiopacity 2.2 mm Al
working time 90 sec
Filler content (weight / volume) 68 / 45 %
Filler size (average) 4.2 µm
Table 3 Overview Material Properties SDR

Scientific Compendium SDR™ 52
6 Clinical Evaluations
Principle Investigators:
Dr. John Burgess
Dr. Carlos Muñoz
Overview of Study Methods:
Subjects in need of Class I and/or Class II restorations were enrolled into the clinical
trials. Respective university standards were applied to isolation, anesthesia, caries
removal and basic cavity design. All cavity preparations were etched for 15 seconds
with 37% phosphoric acid, then rinsed and dried but not desiccated. Prime & Bond®
Bonding Agent (DENTSPLY Caulk, Milford, DE) was applied to all dentin and enamel
surfaces and light cured for 10 seconds. SDR™ (DENTSPLY Caulk, Milford, DE) was
then applied in increments up to 4mm as needed to fill the cavity up to the dento-
enamel junction (see Figure 49). An experimental low stress micro-hybrid composite
resin (DENTSPLY Caulk, Milford, DE) or Esthet•X® HD composite (DENTSPLY
Caulk, Milford, DE) was then layered onto the base to complete the anatomic form of
the restoration. Restorations were finished and polished using the Enhance®
Finishing System and the PoGo® One Step Diamond Micro-Polisher (DENTSPLY
Caulk, Milford, DE).
Figure 49 Schematic illustration of filling technique using SDR and a capping material.
Subjects were recalled for evaluation approximately six and twelve months following
placement of their restoration(s). The clinical parameters relevant to the base
material evaluated at Baseline (within one week of placing restorations) and at the six
month recall were as follows:

Scientific Compendium SDR™ 53
Fracture – records whether a restoration has fractured and if so whether localized or in bulk. Theoretically, bulk fracture could result from a deficiency in the base material.
Proximal Contact – evaluates the degree of contact obtained with adjacent teeth in the case of Class II restorations. In some situations the contact area of the restoration might consist of base material, either wholly or in part.
Recurrent Caries – records whether there are recurrent caries associated with the restoration. This parameter is relevant for Class II restorations since the base material is exposed along certain margins of the restoration where recurrent caries may develop.
Sensitivity – evaluates the presence or absence and severity of post operative sensitivity and may be relevant to the base material.
Gingival Index – a measure of the inflammatory state of the gingiva adjacent to the restoration. This parameter is relevant only to the base material in Class II restorations.
For details of the clinical scoring criteria see section Fehler! Verweisquelle konnte
nicht gefunden werden..
Results for Restorations SDR™ material:
Number of Subjects/Restorations
Total
Baseline 87/170
6 Months 81/156
12 Months 69/131
24 Months 63/123
Eighty-seven subjects were enrolled into this clinical trial, receiving a total of 170
Class I and Class II restorations. All restorations were evaluated at the Baseline
examination within seven days of the operative procedure. After 24 months, 123
restorations in 63 subjects were available for evaluation representing a recall rate of
72% for both subjects and restorations.

Scientific Compendium SDR™ 54
Fracture/Surface Defects
TOTAL
Baseline (%) A 167 (98)
B 3 (2)
C
6 Months (%) A 145 (93)
B 9 (6)
C 2 (1)
12 Months (%) A 124 (94)
B 6 (5)
C 1 (1)
24 Months (%) A 116 (94)
B 6 (5)
C 1 (1)
Defect free restorations constituted 98%, 93%, 94% and 94% of the Baseline, six
month, 12 month and 24 month recall evaluations respectively. The ―B‖ rating
indicates a small, repairable fracture or void confined to the occlusal surface.
Repairs in this category often require recountouring the restoration. Throughout this
trial a total of eight restorations were given this rating. The ―C‖ rating reflects a more
extensive defect compared with a ―B‖ rating and requires that the restoration be
repaired or replaced. During this trial a total of four restorations received the ―C‖
rating, one of which required replacement. All restoration defects occurred within the
capping agent and were not considered related to the base material.
Proximal Contact
TOTAL
Baseline (%) A 104 (91)
B 9 (8)
C 1 (1)
6 Months (%) A 100 (89)
B 11 (10)
C 1 (1)
12 Months (%) A 85 (92)
B 6 (7)
C 1 (1)
24 Months (%) A 69 (89)
B 5 (6)
C 4 (5)

Scientific Compendium SDR™ 55
For the four evaluation intervals interproximal surfaces received ―A‖ ratings of 91%,
89%, 92% and 89% respectively. An ―A‖ rating indicates the optimal level of contact.
Clinicians were able to achieve contact in Class II restorations quite readily using the
appropriate matrix techniques and contact was by and large maintained throughout
the trial. A few restorations decreased in scores while some increased. In addition to
the clinical evaluation, Class II study models of approximately two-thirds of the Class
II restorations were observed for broadening of contacts per past ADA guidelines for
posterior composite resins. Broadening of contacts would indicate interproximal wear
was occurring even if not reflected in clinical scores. No such broadening of
interproximal contacts was observed on study models at any recall interval.
Recurrent Caries
TOTAL
Baseline (%) A 170 (100)
C
6 Months (%) A 156 (100)
C
12 Months (%) A 130 (>99)
C 1 (<1)
24 Months (%) A 123 (100)
C
Recurrent caries was associated with one restoration on the occlusal surface
adjacent to the capping agent which was in need of repair. There were no
observations of recurrent caries associated with the base material.

Scientific Compendium SDR™ 56
Sensitivity – Categorical Method
Baseline (%) A 50 (100)
B
C
D
6 Months (%) A 45(100)
B
C
D
12 Months (%) A 35 (100)
B
C
D
24 Months (%) A 29 (91)
B 3 (9)
C
D
Sensitivity - VAS
Mean VAS Score
Baseline 1.85
6 Months 1.15
12 Months 1.49
24 Months 1.42
Sensitivity was scored differently at the two study sites due to differing levels of
experience with evaluation methods. At one site, subjects were interviewed in order
to record the level of sensitivity they were experiencing at Baseline (5-7 days
following treatment) and after six, 12 and 24 months. Mild sensitivity was associated
with three restorations but not until the 24 month recall evaluation. Given the low
severity and the delayed time of onset, a causal relationship for these three
restorations with the base material was considered unlikely.
At the other site, a cold stimulus was applied to the tooth and subjects were asked to
record their level of sensitivity by placing a mark on a 10 cm line. The line was
anchored at one end with a zero, indicating no sensitivity and at the other with a 10,
indicating the worst pain imaginable. The length of the interval between 0 and 10 was
measured and recorded as the VAS score. Sensitivity was evaluated 5-7 days

Scientific Compendium SDR™ 57
following treatment and at each recall evaluation. Scores of zero sensitivity are rare
in a vital tooth since a cold stimulus is being applied. The mean scores recorded at
all evaluation intervals are very low. In a study by Browning (Operative Dentistry,
2007, 32-2, 112), mean VAS scores of 2.1 were recorded following application of a
cold stimulus in teeth prior to treatment with Class I or II restorations, presumably a
normal response. The sensitivity evaluations at both sites are indicative of no post-
operative sensitivity.
Gingival Index
Mean Gingival Index
Baseline 0.24
6 Months 0.26
12 Months 0.30
24 Months 0.35
Gingival scores reflected no inflammation to mild inflammation of the gingival tissue
in contact with the base material both at Baseline (before treatment) and all recall
intervals. Since mild gingival inflammation, a score of 1, is common with or without a
restoration in place, these scores indicate an acceptable state of health and showed
little change on recall examinations. The base material therefore had no adverse
effects on the gingival tissue.
Retention
TOTAL
Baseline (%) A 170 (100)
C
6 Months (%) A 156 (100)
C
12 Months (%) A 131 (100)
C
24 Months A 122 (>99)
C 1 (<1)
One restoration that had a fracture within the capping agent in the marginal ridge
area was scored ―C‖ indicating a partial loss of the restoration.

Scientific Compendium SDR™ 58
Conclusions:
Based upon the parameters evaluated in these trials, the results presented in this
report support the conclusion that the low stress resin when used as a bulk fill base
in Class I and II restorations with a conventional universal composite resin as an
occlusal capping agent exhibited acceptable performance with respect to safety and
efficacy after two years. Several restorations showed minor surface defects. Three
fractures within the capping agent required repair and one restoration was replaced.
There was essentially no post-operative sensitivity related to the use of the low stress
resin, and the response of the gingiva in contact with the material was within normal
limits. There were no observations of recurrent caries associated with the low stress
resin and there were no reports of adverse events
Scientific Compendium SDR™ 59
7 Summary
In summary, SDR™ material has very low polymerization shrinkage coupled with
exceptionally low polymerization stress. In addition, SDR™ material possesses a
high depth of cure and degree of conversion that optimizes physical and mechanical
properties. As a result of these exceptional properties, SDR™ material is the 1st
flowable composite base suitable for bulk (4mm) placement in Class I and II cavities,
which can result in time savings of up to 30% over traditional restorations. As
demonstrated in this manual, the chemistry of SDR™ material, while unique in its
polymerization mechanism, remains compatible with all methacrylate based
chemistries, including total or self-etch adhesives and universal composites
restoratives. The optimized handling and self-leveling consistency of the SDR™
material is ideal cavity adaptation, especially in posterior restorations. Finally, the
universal shade of SDR™ material enables simplified placement options.

Scientific Compendium SDR™ 60
8 Appendices: Additional Information
For comparative measurements of various parameters following materials had been
used:
Flowable Composite Manufacturer
Beautifil Flow Plus F00 Shofu
Beautifil Flow Plus F03 Shofu
Clearfil Majesty™ Flow Kuraray
Esthet•X® flow DENTSPLY
Filtek Supreme Ultra Flowable 3M Espe
Filtek™ Supreme Plus Flowable 3M Espe
G-aenial Flo GC
G-aenial Universal Flo GC
Grandio Flow VOCO
GrandiO SO Heavy Flow VOCO
Premise™ Flowable Kerr
Revolution™ Formula 2 Kerr
Tetric® EvoFlow Ivoclar Vivadent
TPH®3 Flow DENTSPLY
Venus Bulk Fill Heraeus Kulzer
Venus Diamond Flow Heraeus Kulzer
Composite Manufacturer
Ceram•X mono+ DENTSPLY
Estelite Sigma Quick Tokuyama
Esthet•X DENTSPLY
Filtek Silorane 3M Espe
Filtek Supreme Plus (A2B) 3M Espe
Filtek Supreme Plus (A2E) 3M Espe
Filtek Z100 3M Espe
Filtek Z250 3M Espe
Gradia Direct Anterior GC
GrandiO VOCO
Herculite XRV Kerr
Point 4 Kerr
Premise (Body) Kerr
Premise (Clear) Kerr
Quixfil DENTSPLY
Tetric EvoCeram Ivoclar Vivadent
TPH3 DENTSPLY
Venus Heraeus Kulzer
Venus Diamond Heraeus Kulzer
Scientific Compendium SDR™ 61
8.1 Appendix A: Instructions for Use
The up-to-date version can be found in all European languages on www.dentsply.eu.
8.2 Appendix B: Polymerization Shrinkage & Stress
8.2.1 Volume Shrinkage
Composite specimens were prepared by curing the composite in a stainless steel
mold, 2.5 mm thick x 10mm in diameter, with Triad 2000 for 2 minutes each side. The
densities of uncured and 24 hour post-cured restorative materials were determined
using a Helium Pycnometer (MicroMeritics AccuPycII 1340). The volume shrinkage
was calculated as:
% volume shrinkage = [density(cured) – density (uncured)] /
density (cured) x 100
8.2.2 Polymerization Stress: NIST Tensometer
NIST Tensometer (Eichmiller FC, 2004; Lu H et al, 2004) was used to determine
polymerization stress. The polished quartz glass rods were silanated by 2 layers of
2% A-174 silane/acetone solution. Uncured restorative material was injected into a
cell between two glass rods, 6 mm diameter x 2.25 mm deep. The composite was
cured with a Spectrum 800 halogen light at a light intensity of 300-400 mW/cm2 for 60
seconds. The stress was recorded 60 minutes post-cure.
8.2.3 Polymerization Stress: Photoelastic Stress Measurement
Prof. C.P. Ernst, Mainz, Gemany
Conventional PMMA acrylic materials using a photoelastic constant of f = 230 N/mm
have been used in a photoelastic investigation of visible light curing. Specially
designed photoelastic materials with a lower photoelastic constant (f = 10.5 N/mm),
such as Araldit B (Tiedemann & Betz GmbH, Garmisch-Partenkirchen, Germany),
allow the determination of isochromatic rings, visualizing the strain in the material.
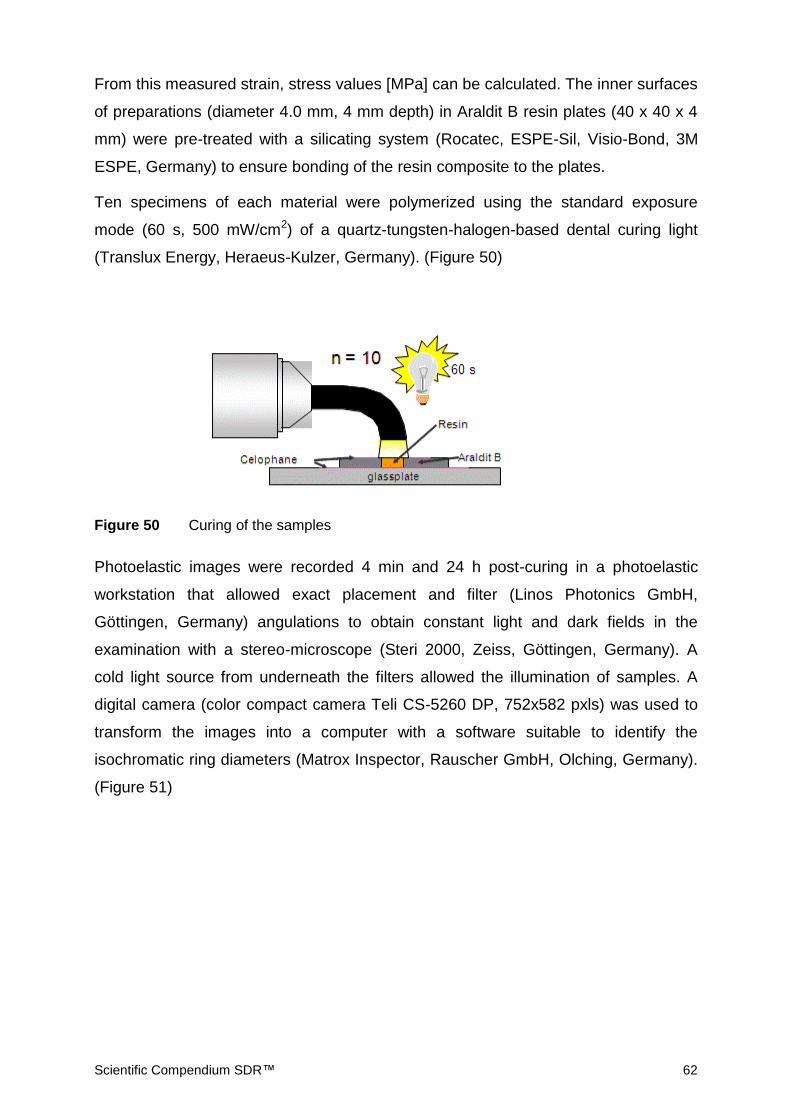
Scientific Compendium SDR™ 62
From this measured strain, stress values [MPa] can be calculated. The inner surfaces
of preparations (diameter 4.0 mm, 4 mm depth) in Araldit B resin plates (40 x 40 x 4
mm) were pre-treated with a silicating system (Rocatec, ESPE-Sil, Visio-Bond, 3M
ESPE, Germany) to ensure bonding of the resin composite to the plates.
Ten specimens of each material were polymerized using the standard exposure
mode (60 s, 500 mW/cm2) of a quartz-tungsten-halogen-based dental curing light
(Translux Energy, Heraeus-Kulzer, Germany). (Figure 50)
Figure 50 Curing of the samples
Photoelastic images were recorded 4 min and 24 h post-curing in a photoelastic
workstation that allowed exact placement and filter (Linos Photonics GmbH,
Göttingen, Germany) angulations to obtain constant light and dark fields in the
examination with a stereo-microscope (Steri 2000, Zeiss, Göttingen, Germany). A
cold light source from underneath the filters allowed the illumination of samples. A
digital camera (color compact camera Teli CS-5260 DP, 752x582 pxls) was used to
transform the images into a computer with a software suitable to identify the
isochromatic ring diameters (Matrox Inspector, Rauscher GmbH, Olching, Germany).
(Figure 51)

Scientific Compendium SDR™ 63
Figure 51 Set-up to measure isochromatic rings after polymerisation
Photoelastic stress investigations are based on certain fundamental physical
principles. The main photoelastic equation is
= C d/
where:
is the material strain
C is a material constant [10-6 mm s2/kg]
is the wavelength of the light [nm]
d is the thickness of the specimen [mm]
the main strain-difference
The material constant C, as well as the wavelength
common photoelastic constant f (f = C) which is 10.5 N/mm for the Araldit B-
material used in this study. By placing this constant into the first equation the result
is:
= d/ f

Scientific Compendium SDR™ 64
To obtain polymerization stress values from the isochromatic-diameters, the
equation has to be reformulated:
where:
x is the order of the isochromatic ring
D2x the diameter of the isochromatic ring [mm]
D2i is the diameter of the resin filling (specimen) [mm]
f is the photoelastic constant [N/mm]
d is the thickness of the Araldit platelets [mm].
Because the terms f (=10.5 N/mm), d (= 4.0 mm), and Di (= 4 mm) remain constant,
they can be combined in a common constant ―k‖, allowing use of an even simpler
equation
Polymerization stress data (MPa) were calculated on the basis of the localization and
diameter of the first order isochromatic curves, obtained from the Araldit plates
(Figure 52).
Figure 52 Visualization of the isochromatic rings found in a photoelastic investigation on photo-curable resin composites. The isochromatic ring of first order was chosen for all materials investigated
From an isochromatic ring of zero order, only the inner part of the ring is visible. The
first order isochromatic ring (number of isochromatic order rises from outside to
D2
x f x
D2i d
k x D2
x

Scientific Compendium SDR™ 65
inside) is the first completely visible ring in a photoelastic image. The higher the
isochromatic ring order number, the closer it is to the restoration. While the strain
difference between the first and second isochromatic rings is almost 100 %, the
difference will become smaller the higher the order number of the ring. For example,
the difference between a ring of ninth and tenth order will only be 10 %. To obtain
comparable results with low standard deviations, an isochromatic ring of a lower
order should be chosen. Due to the fact that the first order isochromatic ring is thicker
than higher order rings, it is more difficult to measure its diameter exactly. The
second order isochromatic ring is thinner and therefore easier to detect than that of
the first order. But isochromatic rings of second order were not seen in some of the
low shrinkage materials. Therefore, to obtain compatibility, the first order
isochromatic rings were chosen for all samples to determine polymerization
shrinkage data. Additionally, higher isochromatic ring orders than two were not seen
in each material investigated.
8.2.4 Polymerization Stress: Stress-Strain-Analyzer
Dr. N. Ilie, Munich, Germany
Five commercially available and two experimental composite materials were
analyzed in this study by measuring their shrinkage behaviour during polymerization
as well as the mechanical properties. The polymerization stress and the time until
gelation of the tested material was investigated with a Stress-Strain-Analyzer (SSA
T80, Engineering Consultancy Peter Dullin Jr., Munich) which continuously measured
the contraction force generated by polymerizing the restorative material with the light
exposure mentioned above, with compensation of the compliance of the machine.
The composite specimens were placed between two aluminium attachments with a
distance of 4 mm and a height of 2 mm. One attachment was connected to a load
sensor and the other to a Piezo-actuator. A PTFE coated plastic tray was fixed on the
testing machine, exactly fitting the two attachments, building a simulated cavity
between the attachments (C-factor: 0.3). The functional surfaces of the two
attachments were cleaned and coated with ROCATEC-Pre, -Plus (ESPE), followed
by further application of a silane-coupling agent (ESPE-Sil, ESPE). The tested
composite was then applied in one 2 mm increment. The contraction force generated
by polymerizing the composite was continuously measured and recorded for 300 s
after photo-initiation. Each experiment was conducted at room temperature and
repeated ten times for each material. Maximum contraction stress during the

Scientific Compendium SDR™ 66
recorded time and time (t0.5N) needed to exceed a force threshold of 0.5 N (arbitrarily
defined as the time until gelation) were compared.
8.3 Appendix C: Curing Effectiveness Methods
8.3.1 Depth of Cure Based on ISO 4049:2009(E)
The restorative material was light cured for 20 seconds in a stainless steel mold with
a cylindrical chamber, 4mm in diameter and 8mm long (10mm long for SDR™) and a
Whatman No. 1 filter paper as background with a Spectrum 800 halogen light at a
light intensity of 500-550 mW/cm2. The uncured side was scraped away using a
plastic spatula and the thickness of the remaining, cured composite was measured
by a micrometer. The depth of cure was the remaining thickness divided by two.
8.3.2 Degree of Conversion: NIR Method
The restorative material was filled in a stainless steel mold with a cylindrical chamber,
13mm in diameter and various depths (2mm, 3mm, 4mm, and 5mm). The mold was
sandwiched between two micro slides and was placed on top of a Whatman No. 1
filter paper as background. The restorative was light cured for 20 seconds with a
Spectrum 800 halogen light at a light intensity of 500-550 mW/cm2. On a Nicolet
6700 FTIR, a Smart NIR Updrift Accessory was installed. The unreacted -C=C-
concentration in the composite was determined by the area under the NIR spectra
peak of -C=C- overtone at 6163cm-1. The C=C conversion was calculated by
Conversion% = (1 - Area (cured) / Area (uncured)) * 100%
The conversion for both the top and the bottom surfaces was measured at 1 hour
and 24 hours post cure.
8.3.3 Degree of Conversion: FTIR Method
Dr. Andre F. Reis, Guarulhos, SP Brazil
Five composite resins were tested in the study: SDR™ material (R0999-1 U, Lot
080512 – DENTSPLY Caulk), Esthet•X flow (A2 Lot 080804 - DENTSPLY Caulk),

Scientific Compendium SDR™ 67
Filtek Supreme Plus flow (A2 Lot 8GH - 3M ESPE), Filtek LS (Lot 8AP - 3M ESPE)
and Tetric Evoflow (A2 Lot L36209 - Ivoclar Vivadent). Three polytetrafluorethylene
split molds (2mm deep and 3 mm diameter) were filled with composite resin, and
placed one on top of the other. A mylar strip was placed in between, so depth of cure
(DOC) could be measured at the top surface, at 2, 4 and 6 mm. Except for Filtek LS,
which was light cured for 40 seconds as recommended by manufacturer, flowables
were irradiated from the top surface for 20s using a visible light curing unit with a
power output of 650 mW/cm2 (Demetron Optilux 501C). SDR™ material was also
cured with a light-emitting diode (LED) unit (Bluephase 16i Vivadent), with a power
output of 1100 mW/cm2.
Five specimens of each experimental group were prepared to obtain the degree of
conversion (DC) at each depth. The absorption spectrums for polymerized
composites were obtained in the form of a tablet on a Spectrum 100 FTIR
spectrometer (PerkinElmer - USA) for the transmission method, operating with 64
scans at a resolution of 4 cm-1 within a wavelength of 4000-650 cm-1. For the
measurement of absorption spectrums of uncured resins, the composite was inserted
in the circular metallic matrix (5mm in diameter and 2mm in thickness) and covered
by a polyester matrix between two glass plates under a weight of 10kgf to assure the
compaction of the non-polymerized resin in the matrix. The absorption spectrums of
the cured resins were obtained in the same manner as described above.
The direct form of determining the polymerization DC is based on the measurement
of the reduction in the intensity of the stretching band of carbon-to-carbon aliphatic
double bonds (C=C) of methacrylate, at 1637 cm-1, when the monomer is converted
to polymer. This spectroscopic procedure depends on the presence of an absorption
band that is not modified with the polymerization, and serves as a normalization
standard of monomer and polymer spectrums. For example, composites that have
aromatic monomers, with a band of absorption in 1608 cm-1 can serve as internal
standards of normalization; this eliminates the necessity to consider the thickness of
the sample. The value of the conversion degree (DC) will be obtained by the
equation 1.
)1(1001U
CDC

Scientific Compendium SDR™ 68
Where C and U are reasons of intensity between aliphatic and aromatic C=C
absorptions, after and before the polymerization, respectively. Thus the percentage
of carbonic double linking that is not reacted during the polymerization reaction is
determined. The DC is determined by the subtraction of the residual percentage of
aliphatic C=C from 100%.
Low shrinkage composite resin (Filtek LS), do not contain aliphatic C C groups,
consequently, the DC cannot be calculated from Eq. (1). The mean DC of Filtek LS
specimens were identified through regions of the FTIR spectra between 730 and
950 cm-1 which corresponded with the oxirane ring-opening regions. A common
internal standard was the absorption of aromatic C C at 1608 cm−1.
8.3.4 Knoop Hardness
The restorative material was filled in a stainless steel mold with a cylindrical chamber,
13mm in diameter and various depths (2mm, 3mm, 4mm, and 5mm). The mold was
sandwiched between two micro slides and was placed on top of a Whatman No. 1
filter paper as background. The restorative was light cured for 20 seconds with a
Spectrum 800 halogen light at a light intensity of 500-550 mW/cm2. The Knoop
hardness was measured with a LECO LM700AT Microhardness Tester with 200 gf
test load and 5 second dwell time. The Knoop hardness for both the top and the
bottom surfaces was measured at 1 hour and 24 hours post cure.
8.3.5 Barcol Hardness Method
The restorative material was filled in a stainless steel mold with a cylindrical chamber,
13mm in diameter and various depths (2mm, 3mm, 4mm, and 5mm). The mold was
sandwiched between two micro slides and was placed on top of a Whatman No. 1
filter paper as background. The restorative was light cured for 20 seconds with a
Spectrum 800 halogen light at a light intensity of 500-550 mW/cm2. The hard Barcol
hardness for both the top and the bottom surfaces was measured with a Hard Barcol
Impresser Tester at 1 hour and 24 hours post cure.

Scientific Compendium SDR™ 69
8.4 Appendix D: Shear Bond Strength to Dentin & Enamel Test Method
8.4.1 Enamel & Dentin Bonding; Notched-Edge (Ultradent) Shear Bond
Strength (SBS) to Tooth
Freshly extracted, caries-free and un-restored human molars were used. Teeth were
sectioned longitudinally through the mesial, occlusal, and distal surfaces using a
water-cooled diamond grit cutting disc. The sectioned molars were mounted in a
cylindrical block using cold-cure acrylics, with the buccal surface exposed. The
exposed surface was then coarse ground on a model trimmer until a flat dentin or
enamel surface is exposed. Prior to the bonding of specimen, tooth was wet-ground
on grinding wheel under running water use 120-grit SiC sanding paper, followed by
320-grit SiC sanding paper, until the surface was even and smooth when visually
inspected.
The Ultradent bonding jig with a defined bond area (diameter 2.38mm) and height
(2mm) was used. Tooth surface was prepared (etching, rinsing, etc) according to the
bonding agent’s DFU. The adhesive was applied and cured per its DFU. Then
Ultradent mold opening was centered over the treated substrate. Composite was
carefully placed into the mold and cured with a halogen at a light intensity of
550mW/cm2 for 40 seconds. After curing, the mold insert was carefully removed from
the bonding clamp without applying any bending and shearing force to the bonded
specimen. The bonded specimen was stored in 37 C DI-water for 24 hour before
SBS testing. SBS test was performed on Instron 4400 at a crosshead speed of 1
mm/min.
8.4.2 Class I Micro-tensile Bond Strength
Dr. Andre F. Reis, Guarulhos, SP Brazil
Freshly extracted human third molars were used in this study. Five teeth were used
for each experimental group (N=5). After disinfection and removal of soft tissues a
standardized Class I occlusal preparation (6 mm long X 4 mm wide X 5 mm deep)
was made in each tooth using coarse diamond burs operated in a high-speed hand-
piece using copious air-water spray.
Prepared teeth were randomly assigned to groups according to each restoration
protocol. The adhesive material(s) were applied according to the recommended

Scientific Compendium SDR™ 70
manufacturer’s directions. In the experiments using SDR™ material, the flowable
material was placed in 4 mm bulk increments and light cured for 20 seconds. An
occlusal layer of approximately 1 to 1 mm of Esthet•X® HD composite was
incrementally added to build the final anatomy of the teeth. In the group using Filtek
Supreme Flow, a 1 mm layer was applied and light cured for 20 seconds, followed by
incrementally placing 2, ~ 2 mm oblique layers of Filtek Supreme Plus and light
curing for 20 seconds per increment. After placing Filtek LS Self-Etch Primer and
Bond according to the manufacturer’s directions, Filtek LS Posterior Composite was
placed incrementally using the horizontal layering technique (increments of
approximately 2 mm were used). Each increment was cured for 40 seconds.
After restorative procedures, the specimens were placed in water for 24 hours prior
to testing. The restored teeth were sectioned in a bucco-lingual direction into
approximately 0.8 mm thick slabs with a diamond saw under water lubrication
(Isomet 1000, Buehler). Four or five slabs were obtained from each tooth. Each slab
was trimmed from both sides with an extra-fine diamond bur to reduce the cross-
sectional area at the interface of the pulpal wall to approximately 1 mm2. Bonded
specimens were tested in tension with a universal testing machine (EZ Test,
Shimadzu) using a Ciucchi’s jig at a crosshead speed of 1 mm/min. The μ-TBS
values were expressed in MPa, which was calculated by dividing the peak break by
the cross-sectional area of the bonded interface. Data were statistically analyzed by
one-way ANOVA and Tukey test at the 5% confidence level.
8.5 Appendix E: Microleakage, Gap and Marginal Integrity
Dr. Andre F. Reis, Guarulhos, SP Brazil
8.5.1 Class I Cavity Preparation and Restoration
Freshly extracted human third molars were used in this study. Five teeth were used
for each experimental group (N=5). After disinfection and removal of soft tissues a
standardized Class I occlusal preparation (6 mm long X 4 mm wide X 5 mm deep)
was made in each tooth using coarse diamond burs operated in a high-speed hand-
Scientific Compendium SDR™ 71
piece using copious air-water spray. Prepared teeth were randomly assigned to
groups according to each restoration protocol. The adhesive material(s) were applied
according to the recommended manufacturer’s directions. In the experiments using
SDR™ material, the flowable material was placed in 4 mm bulk increments and light
cured for 20 seconds. An occlusal layer of approximately 1 to 1 mm of Esthet•X® HD
composite was incrementally added to build the final anatomy of the teeth. In the
group using Filtek Supreme Flow, a 1 mm layer was applied and light cured for 20
seconds, followed by incrementally placing 2, ~ 2 mm oblique layers of Filtek
Supreme Plus and light curing for 20 seconds per increment. After placing Filtek LS
Self-Etch Primer and Bond according to the manufacturer’s directions, Filtek LS
Posterior Composite was placed incrementally using the horizontal layering
technique (increments of approximately 2 mm were used). Each increment was cured
for 40 seconds.
8.5.2 Class I Microleakage
After the restorative procedures, teeth were placed in water for 24 hours prior to
testing. Restored teeth were coated with two layers of nail varnish applied up to
within 1mm of the bonded interfaces. In order to avoid desiccation artifacts, they
were immersed in distilled water for 20 min prior to immersion in the tracer solution
for 24 hours. Ammoniacal silver nitrate were prepared according to the protocol
previously described (Tay, et al, 2002). Tooth slabs were placed in the tracer solution
in total darkness for 24 hours, rinsed thoroughly in distilled water, and immersed in
photo-developing solution for 8 hours under a fluorescent light to reduce silver ions
into metallic silver grains within gaps along the interface. The teeth were
subsequently rinsed under running water to remove external dye. The specimens
were sectioned longitudinally through the center of the restorations with a diamond
saw (Isomet Buehler). Each cavity was sectioned into three parts. The degree of dye
penetration was then recorded (in mm) for each one of the slabs and a mean value
was obtained for each tooth. Dye infiltration was expressed as a percentage of the
total area of the cavity. Microleakage values were statistically analyzed by One-way
ANOVA and Tukey test at the 5% confidence level.

Scientific Compendium SDR™ 72
8.5.3 Class I Internal Cavity Adaptation
Samples were prepared as described above. After the restorative procedures, teeth
were placed in water for 24 hours prior to testing. The specimens were sectioned
longitudinally through the center of the restorations with a diamond saw (Isomet
Buehler). Each cavity was sectioned into three parts. The central slab in each tooth
was selected for gap formation analysis using a replica technique. Slabs were
embedded in epoxy resin and then finished with 400, 600, 1000 and 2000-grit SiC
paper under water and then polished with 6, 3, 1 and 0.25 μm diamond paste using a
polish cloth. An impression of the specimens was taken using a PVS impression
material and replicas were made with epoxy resin (Epoxycure, Buehler). Replicas
were sputter-coated with gold (MED 010) and observed under an SEM (LEO 435
VP). Representative areas of the interfaces were photographed. The extension of
gaps was determined (in millimeters) using an image analysis software (Image J,
NIH). Gap extension was expressed as a percentage of the total cavity contour.
Results were statistically analyzed by ANOVA.
8.5.4 Class II Cavity Preparation and Restoration
Freshly extracted human third molars were used in this study. Five teeth were used
for each experimental group (N=5). After disinfection and removal of soft tissue, a
standardized Class II MOD preparation was made in each tooth using a coarse
diamond bur operated in a high-speed hand-piece using copious air-water spray. The
margin of the mesial proximal box was placed in dentin (1 mm apical to the CEJ) and
the distal margin was placed in enamel (1 mm coronal to the CEJ). Prepared teeth
were randomly assigned to groups according to each restoration protocol. The
prepared teeth were mounted in a jig featuring artificial training teeth that served as
adjacent teeth. A contoured matrix band was placed around the teeth for restorative
procedures.
The adhesive (either Prime & Bond® NT™ or Scotchbond 1 XT) material was applied
according to the recommended manufacturer’s directions. In the experiments using
Prime & Bond® NT™/SDR™ material, the flowable material was placed in 4 mm bulk
increments and light cured for 20 seconds. An occlusal layer of approximately 1 to 1
mm of
Scientific Compendium SDR™ 73
Esthet•X® HD composite was incrementally added to build the final anatomy of the
teeth. In the group using Filtek Supreme Flow, after application of Scotchbond 1 XT,
a 1 mm layer was of the flowable material was applied and light cured for 20
seconds, followed by incrementally placing ~ 2 mm oblique layers of Filtek Supreme
Plus and light curing for 20 seconds per increment, according to the manufacturer’s
directions. In a third, experimental group, the adhesive application was performed per
manufacturer’s instructions, followed by a 4 mm bulk placement of Filtek Supreme
Plus Flowable and light curing for 20 seconds. An occlusal layer of approximately 1
mm of Filtek Supreme Plus was incrementally added to build the final anatomy of the
teeth, with each increment cured for 20 seconds. (Note: This final procedure is not
recommended by the manufacturer, but was performed to evaluate bulk placement
performance of a flowable material with higher shrinkage and polymerization stress.)
8.5.5 Class II Marginal Integrity
After restorative procedures, an impression of the proximal boxes of each specimen
was made with a VPS material (Aquasil Ultra XLV) and replicas were made using
epoxy resin (Epoxycure, Buehler) for SEM evaluations of the marginal integrity.
Replicas were sputter-coated with gold (MED 010) and observed under an SEM
(LEO 435 VP). Representative areas of the interfaces were photographed. The
extension of marginal defects was determined (in millimeters) using an image
analysis software (Image J, NIH). Results, expressed as a percentage of total
marginal lengths, were expressed as a percentage.
8.5.6 Class II Microleakage
The restored teeth were coated with two layers of nail varnish applied up to within 1
mm of the bonded interfaces. In order to avoid desiccation effects, the teeth were
immersed in distilled water for 20 minutes prior to immersion in the tracer solution for
24 hours. Ammoniacal silver nitrate was prepared according to the protocol
previously described (Tay FR et al, 2002). Tooth slabs were placed in the tracer
solution in total darkness for 24 hours, rinsed thoroughly with distilled water, and
immersed in photo-developing solution for 8 hours under a fluorescent light to reduce
silver ions into metallic silver grains within gaps along the interface.

Scientific Compendium SDR™ 74
The teeth were subsequently rinsed under running water to remove external dye. The
specimens were sectioned longitudinally through the center of the restorations with a
diamond saw (Isomet Buehler). Each cavity was sectioned into two parts. The dye
penetration was then recorded (in mm) for each slab and a mean value was obtained
for each tooth. Dye infiltration was expressed as a percentage of the total area of the
cavity. Microleakage values were statistically analyzed by Two-way ANOVA and
Tukey test at the 5% confidence level.
8.5.7 Class II Internal Cavity Adaptation
The specimens were sectioned longitudinally through the center of the restorations
with a diamond saw (Isomet Buehler). One section of each tooth was selected for
gap formation analysis using a replica technique. Slabs were embedded in epoxy
resin and finished with 400, 600, 1200, and 2400-grit SiC paper under water and then
polished with 6, 3, 1, and 0.25 micron diamond paste using a polishing cloth. An
impression of the specimens was taken using a VPS impression material (Aquasil
Ultra XLV) and replicas were made with epoxy resin (Epoxycure, Buelher). Replicas
were sputter-coated with gold (MED 010) and observed under an SEM (LEO 435
VP). Representative areas of the interfaces were photographed. The extension of
interfacial gaps was determined (in mm) using an image analysis software (Image J,
NIH). Results were statistically analyzed by ANOVA and Tukey Tests.
8.6 Appendix F: Other Mechanical, Physical & Miscellaneous Properties
8.6.1 Compressive Strength & Modulus
A Teflon mold for the preparation of a cylindrical specimen (7 mm long x 4mm in
diameter), was filled with restorative composite and sandwiched between two Mylar
cover sheets. The composite was light cured from both sides for 20 seconds using a
Spectrum 800 halogen light at a light intensity of 550 mW/cm2. After storage in
deionized water at 370C for 24 hours, the specimens were polished to 6mm long x
4mm in diameter using 600 grit sand paper. The compressive strength and modulus
were obtained using an Instron 4400R at crosshead speed of 5 mm/min.

Scientific Compendium SDR™ 75
8.6.2 Flexural Strength & Modulus
(Based on ISO 4049:2009(E)). Stainless steel molds with a stick-shaped chamber
(25 x 2 x 2 mm) was filled with composite and covered with a Mylar sheet. The stick-
shaped specimens were light cured for 3 times 20 seconds with a Spectrum 800
halogen light at a light intensity of 550 mW/cm2. After storage in deionized water at
37°C for 24 hours, the flexural strength and modulus were obtained under a three-
point loading using an Instron 4400R at a crosshead speed of 0.75 mm/min.
8.6.3 Fracture Toughness
A Teflon triangular prism mold with dimensions 6 x 6 x 6 x 12 mm was slightly overfilled
with the restorative composite. Any excess material was expressed from the mold by
covering the material under pressure with a Mylar sheet and a glass slide. The
composite was light cured using a Spectrum 800 halogen light at a light intensity of 550
mW/cm2 for 2 minutes. The specimen was further cured in Triad 2000 for 2 minutes.
The cured specimen was removed from the mold and the flash was removed from the
edges using a razor knife and then carefully sanding using 600 grit sandpaper. A preset
crack initiation point, approximately 0.1mm deep, was made midway along the bottom
edge of a specimen using a razor blade. The specimens were stored in deionized water
at 37°C for 24 hours. The specimens were then placed into a mounting assembly with
the crack initiation aligned with the split line of the holder and secured in place by two
screw-tightened clamps. The assembly was loaded in tensile mode on Instron 4400R at
a crosshead speed of 0.1 mm/min.
8.6.4 Diametral Strength
Cylindrical shaped mold with dimensions of 6 mm in diameter and 3 mm in height
was filled with restorative composite and sandwiched between two Mylar cover
sheets. The composites were light cured from both sides for 20 seconds with a
Spectrum 800 halogen light at a light intensity of 550 mW/cm2. After storage in
deionized water at 37° C for 24 hours, the diametral tensile strength was obtained
using an Instron 4400R at a crosshead speed of 10 mm/min.

Scientific Compendium SDR™ 76
8.6.5 Radiopacity
The testing was based on ISO 4049:2009(E). The composite specimen was cured in
stainless steel disk mold, 1mm thick x 30mm in diameter, using a Triad 2000 for 2
minutes on each side. Radiopacity of the restorative material was determined by
comparing the optical density of a radiograph of a 1.0 mm thick cured material to that
of a 0.5, 1, 1.5, 2.0, 2.5, 3.0 mm stepped standard aluminum block.
8.6.6 Water Solubility and Water Sorption
This test was based on ISO 4049:2009(E). The light cured specimens (1 mm thick by
15 mm in diameter) were transferred, to a desiccators maintained at 37°C. After 22
hours, the specimens were removed and stored in a second desiccator maintained at
23°C for 2 hours and then weighed. This cycle was repeated until a constant mass,
m1, was obtained. After the final drying, measurements were made of the diameter
and the thickness in order to calculate the volume, V. The specimens were immersed
in water at 37° C for 7 days in such a way that they are vertical, having a minimum of
3 mm separation between specimens. After 7 days, the specimens were removed,
washed with water, surface water blotted until free from visible moisture, dried in the
air for 15 seconds, and weighed 1 min. after removal from the water. This mass was
recorded as m2. After this weighing, the specimens were reconditioned to constant
mass in the desiccator. Record the constant mass as m3.
The values for water sorption, Wsp, were calculated using the following equation:
Wsp = (m2 – m3) / V
The values for solubility, Wsl, were calculated using the following equation:
Wsl = (m1 – m3) / V
8.6.7 Compatibility with Universal Composites
A 10 mm x 10 mm x 10 mm mold was used for this testing. A 4 mm bulk filled layer of
SDR™ material was placed in the mold and cured for 20 seconds. Additional
universal composite material was next incrementally filled and cured per DFU on top
of the SDR™ material, up to a total of an additional 4mm. The cured specimen (10
mm x 10 mm x 8 mm in height) was stored at 37°C in deionized water overnight.

Scientific Compendium SDR™ 77
Each specimen was then cut into 1mm x 1mm rods and tested for Micro-Tensile
strength. 50 specimens are tested for each material, including only those specimens
that broke at the composite/flowable interface.
8.6.8 Color Stability
8.6.8.1 Water Storage
A circular mold, with internal dimensions 30 mm diameter x 1mm height, was placed on
a Mylar covered glass plate and slightly overfilled with SDR™ composite. The second
glass plate was positioned on top of a piece of Mylar covering the mold. The two plates
and mold were secured together using binder clips and the composite was light cured in
Triad 2000 for 2 minutes on each side. The specimens were removed from the molds.
The initial color and opacity values were measured in the CIE L*a*b* scale on a Greta
Macbeth Color-EYE 3100. The specimens were stored in deionized water at 37°C for
different time and the total change in color, E and opacity, were measured and
calculated.
8.6.8.2 Ultraviolet Irradiation
A circular mold, with internal dimensions 20 mm in diameter and 0.5 mm in height, was
placed on a Mylar covered glass plate and slightly overfilled with SDR™ material. The
second glass plate was positioned on top of a piece of Mylar covering the mold. The two
plates and mold were secured together using a binder clip and the composite was light
cured with Spectrum 800 at a light intensity of 550 mW/cm2 for 10 seconds on each
quadrant, starting in the middle and then overlapping clockwise until the whole chip area
had been cured. Specimen 1: After removal from the mold, the specimen was stored in
the dark, dry in the oven at 37°C for 7 days. This is the standard specimen. Specimen 2:
After removal from the mold, the specimen was stored in the dark, dry in the oven at
37°C for 24 hrs. After this time, specimen 2 was removed from the oven and half of it
was blanked off using aluminum foil. Specimen 2 was next immersed in water at 37°C,
placed in a Heraeus Suntest unit, and exposed to UV radiation for 24 hrs. After
exposure, the metal foil was removed. Specimen 2 was transferred back to the oven at
37°C and stored in the dark, dry for 5 more days. The color of both halves of specimen
2 was compared with each other and with the standard specimen 1. The color
comparison was carried out in accordance with ISO 7491.

Scientific Compendium SDR™ 78
Results:
When compared to the standard specimen, no noticeable color change was observed
with SDR™ restorative universal shade of among the specimens stored at the specified
conditions.
8.6.9 Fluoride Release
Fluoride ion release was determined using an Accumet® AR50 Dual Channel
pH/Ion/Conductivity Meter with a Fluoride ion electrode. Disc samples of the
composite, 1 mm thick by 20 mm in diameter, were immersed in 20ml of deionized
water for one-week intervals. The Fluoride ion content of the solution was determined
until the reading was below 0.1ppm. The cumulative Fluoride ion release is
determined by adding the weekly Fluoride ion release to that of the previous week.
Two specimens were prepared and measured. The average value was recorded.

Scientific Compendium SDR™ 79
9 References
Blaes J, 2008, Dental Economics, June, Vol. 98, No. 6.
Condon J et al, 2000, ―Assessing the Effects of Composite Formulation on
Polymerization stress‖, J Am Dent Assoc, Vol. 131, No. 4, pp 497-503.
Latta MA, 2007, ―Shear Bond strength and physicochemical interactions of XP Bond‖,
J Adhes Dent, Vol. 9, pp 245-248.
Eichmiller FC, 2004, ―Polymer Shrinkage Tensometer‖, US Patent 6,871,550, March
29, 2004.
Ernst C-P, Busemann I, Schattenber A, Willershausen B, 2009, ―Determination of
polymerization shrinkage stress in low shrinkage resin composites using
an improved cavity design‖, Data on File.
Feltzer, AJ, et al, 1987, ―Setting stress in composite resins in relation to configuration
of the restoration‖, J Dent Res, Vol. 66, pp 1636-1639.
Ferracane JL, 2008, ―Glass Ionomer liner Reduces Contraction Stress‖, Operative
Dentistry, Vol. 33, No. 3, pp 247-257.
Frankenberger R, et. al., 2008, ―Luting of ceramic inlays in vitro: Marginal quality of
self-etch and etch-and-rinse adhesives versus self-etch cements‖, Dental
Materials, Vol 24, pp 185-191.
Frankenberger R, 2008, Data on File.
Frankenberger R, Tay FR, 2005, ―Self-etch vs. Etch-and-rinse adhesives; effect of
thermo-mechanical fatigue loading on marginal quality of bonded resin
composite restorations‖, Vol. 21, No. 5, pp 397-412.
Ilie N, 2007, ―Study Report, DENTSPLY 2007‖, Data on File.
Lu H, Stansbury JW, Dickens SH, Eichmiller FC, Bowman CN, 2004, ―Probing the
origins and control of shrinkage stress in dental resin-composites‖, J Mat
Sci Mater Sci Med, Vol. 15, No. 10, pp 1097-1103.
Peutzfeldt A, 1997, ―Resin composites in dentistry: the monomer systems‖, Eur J
Oral Sci, Vol. 105, No. 2, pp 97-110.
Reis A, 2009, ―Depth of Cure analysis of a novel composite restorative system for
posterior teeth‖, Data on File.

Scientific Compendium SDR™ 80
Reis A, 2009, ―Evaluation of a novel composite restorative system for posterior teeth:
microleakage, bond strength, and gap formation analysis (Class I
Cavities)‖, Data on File.
Reis, A, 2009, ―Evaluation of a novel composite restorative system for posterior
teeth: microleakage, bond strength, and gap formation on Class II MOD
cavities‖, Data on File.
Tay FR, Pashley DH, Yoshiyama M, 2002, ―Two modes of nanoleakage expression
in single step adhesives, J Dent Res, Vol. 81, pp 472-476.
Truffier-Boutry D, et al, 2006, ―A physic-chemical explanation of the post-
polymerization shrinkage in dental resins‖, Dent Mater, Vol. 22, No. 5, pp
405-412.
Yamazaki PC et al, 2006 ―Microleakage Evaluation of a New Low-Shrinkage
composite Restorative Material‖, Operative Dentistry, Vol. 31, No. 6, pp
670-676.

Scientific Compendium SDR™ 81
10 Glossar and Abreviatons
ATR Attenuated Total Reflectance
IFU Instructions for Use
E&R Etch&Rinse Etching with phosphoric acid which has to be rinsed off (formerly referred to as Total Etch Technique)
FTIR Fourier Transform Infra-Red Spectrometry
LED Light Emitting Diode
NIR Near Infrared analysis
NIST National Institute of Standards and Technology
QTH Quartz Tungsten Halogen
SBS Shear Bond Strength
SDR Smart Dentin Replacement
Stress Decreasing Resin
SEM Scanning Electron Microscope
TC Thermo Cycles, Cycling
TML Thermo Mechanical Loading
VAS Visual Analogue Scale

Scientific Compendium SDR™ 82
11 List of Figures
Figure 1 As the area of bonded surfaces increase relative to unbonded surfaces, the C-factor
increases. (Clinical pictures courtesy of Dr. Jeff Blank) ................................................... 8
Figure 2 Polymerization Stress development for traditional methacrylate resin compared to
SDR™ Resin Technology ................................................................................................ 9
Figure 3 Degree of Double Bond Conversion vs. Time comparing neat resin or formulated
product of Esthet•X flow to SDR™. .................................................................................. 9
Figure 4 Storage Modulus Development vs. Time for Traditional Flowable (Esthet•X flow)
compared to SDR™ ....................................................................................................... 10
Figure 5 Chemistry of SDR™ Technology. .................................................................................. 11
Figure 6 Tan Delta vs. Temperature from Dynamic Mechanical Analysis (DMA) for neat resin or
formulated product comparing Esthet•X flow to SDR™ ................................................. 12
Figure 7 Volumetric Shrinkage of SDR™ material compared to other flowable materials ........... 14
Figure 8 Polymerization Stress (NIST Tensometer) of SDR™ compared to other flowable
materials ......................................................................................................................... 16
Figure 9 Polymerization Stress (NIST Tensometer) of SDR™ compared to other Universal/
Posterior Composite materials ....................................................................................... 17
Figure 10 Polymerization Stress using Photoelastic stress methodology (Ernst CP, University of
Mainz, Germany) ............................................................................................................ 18
Figure 11 Polymerization Stress of SDR™ material compared to other Flowable materials,
Composites, and ―low shrinkage materials‖ using Photoelastic Stress methodology
(Ernst CP, 2009) ............................................................................................................. 18
Figure 12 Averaged curves (mean of 10 runs) of contraction force within the first 5 seconds ...... 19
Figure 13 Averaged curves of contraction force within the first 30 seconds .................................. 20
Figure 14 Averaged curves of contraction force up to 300 seconds .............................................. 20
Figure 15 Polymerization Stress of SDR™ material using a Stress-Strain-Analyzer (Ilie N,
Academy of Dental Materials 2009 #10) ........................................................................ 21
Figure 16 Depth of Cure (ISO 4049) of SDR™ flow material compared to other Flowable
materials, 20 second irradiation ..................................................................................... 22
Figure 17 Degree of Conversion (%) of SDR™ material at varying thickness of cured material. (20
seconds curing time, NIR Analysis)................................................................................ 23
Figure 18 Degree of Conversion (%) versus depth of cure for 20 seconds by FTIR Analysis. (Note:
Filtek Silorane cured 40 seconds) (Reis A, Univ. of Guarulhos, SP Brazil) ................... 24
Figure 19 Ratio (%) of the Bottom Knoop Hardness to Top Knoop Hardness at varying thickness
of material cured 20 seconds ......................................................................................... 25
Figure 20 Ratio (%) of the Bottom Barcol Hardness to Top Barcol Hardness at varying thickness
of material cured 20 seconds ......................................................................................... 25
Figure 21 Adhesive bond strength to human enamel & dentin using SDR™ material and Esthet•X®
flow ................................................................................................................................. 26
Figure 22 Micro-tensile bond strengths to human dentin restored in Class I cavities (Reis A, Univ.
of Guarulhos, SP Brazil) ................................................................................................. 27

Scientific Compendium SDR™ 83
Figure 23 Microleakage on extracted human teeth using standardized Class I occlusal
preparations. Specimens were stored 24 hours in water. (Reis A, Univ. of Guarulhos,
SP Brazil) ........................................................................................................................ 29
Figure 24 In-vitro Cavity Adaptation of restored Class I cavities using SDR™ material and other
systems (Reis A, Univ. of Guarulhos, SP Brazil) ........................................................... 30
Figure 25 Marginal Integrity of restored Class II cavities using SDR™ material and other systems
(Reis A, Univ. of Guarulhos, SP Brazil) .......................................................................... 32
Figure 26 Protocol for in vitro cyclic fatigue of Class II restorations ............................................... 33
Figure 27 Results for % perfect margins via in vitro cyclic fatigue of Class II restorations ............ 34
Figure 28 Percentage of perfect margins and internal adaptation before and after
thermomechanical loading comparing incremental layering technique to SDR XP BOND
+ Ceram•X mono+ .......................................................................................................... 35
Figure 29 Percentage of perfect margins and internal adaptation before and after
thermomechanical loading comparing incremental layering technique to SDR Syntac +
Tetric EvoCeram............................................................................................................. 35
Figure 30 Percentage of perfect margins and internal adaptation before and after
thermomechanical loading comparing incremental layering technique to SDR iBond
SelfEtch + Venus Diamond ............................................................................................ 36
Figure 31 Percentage of perfect margins and internal adaptation before and after
thermomechanical loading comparing incremental layering technique to SDR Adper
Prompt L-Pop + Filtek Supreme XT ............................................................................... 36
Figure 32 Percentage of perfect margins and internal adaptation before and after
thermomechanical loading comparing incremental layering technique to SDR Xeno V +
Ceram•X mono+ ............................................................................................................. 37
Figure 33 Microleakage of restored Class II cavities using SDR™ material and other systems ... 38
Figure 34 Internal Cavity Adaptation of restored Class II cavities using SDR™ material and other
systems .......................................................................................................................... 39
Figure 35 Compressive strength & modulus of SDR™ material & other flowable composites ...... 40
Figure 36 Flexural strength & modulus of SDR™ material & other flowable composites measured
at 24 hours ...................................................................................................................... 41
Figure 37 Flexural strength of SDR™ material & other composites measured at 24 hours (Shade
A2 or Universal if not specified differently) ..................................................................... 42
Figure 38 Flexural modulus of SDR™ material & other composites measured at 24 hours (Shade
A2 or Universal if not specified differently) ..................................................................... 42
Figure 39 Fracture toughness of SDR™
material and other flowable composites .......................... 43
Figure 40 Fracture toughness of SDR™
material and other composites (Shade A2 or Universal if
not specified differently) ................................................................................................. 43
Figure 41 Diametral strength of SDR™ material & other flowable composites .............................. 44
Figure 42 The radiopacity of flowables was measured and compared to the approximate
radiopacity of dentin and enamel ................................................................................... 45
Figure 43 Water solubility and water sorption using ISO standard test methods........................... 46

Scientific Compendium SDR™ 84
Figure 44 Compatibility of SDR™
material with various Universal / Posterior Composites (Shade
A2 or Universal if not otherwise specified.) .................................................................... 47
Figure 45 Mean SBS and overlapping confidence interval ............................................................ 48
Figure 46 Compatibility of SDR with Etch&Rinse (E&R) and Self-Etch (SE) adhesives ................ 49
Figure 47 The color stability of SDR™
material after water storage. Note: After exposure to UV
Irradiation no noticeable color change was observed .................................................... 49
Figure 48 The Fluoride release of SDR™
material after storage in deionized water ...................... 50
Figure 49 Schematic illustration of filling technique using SDR and a capping material. .............. 52
Figure 50 Curing of the samples .................................................................................................... 62
Figure 51 Set-up to measure isochromatic rings after polymerisation ........................................... 63
Figure 52 Visualization of the isochromatic rings found in a photoelastic investigation on photo-
curable resin composites. The isochromatic ring of first order was chosen for all
materials investigated ..................................................................................................... 64

Scientific Compendium SDR™ 85
12 List of Tables
Table 1 The composition of SDR™ material comprises familiar and new components, each
having specific functions in the overall composition....................................................... 10
Table 2 Polymerization Stress of SDR™ material – Conclusions (Ernst CP, 2009) ................... 19
Table 3 Overview Material Properties SDR................................................................................. 51

Scientific Compendium SDR™ 86
The following materials are not trademarks of DENTSPLY International.
Brand (abbreviation, Manufacturer):
Adper Prompt L-Pop (3M ESPE)
Beautifil Flow Plus (Shofu)
Clearfil Majesty Flow (Kuraray)
Clearfil Majesty posterior (CFM Post, Kuraray)
ELS (Saremco)
Empress II (Ivoclar Vivadent)
Estelite Sigma Quick (Tokuyama)
Excite DSC (Ivoclar Vivadent)
Filtek Supreme Plus (3M ESPE)
Filtek Supreme Plus Flowable (FS flow, Filtek SP flow, 3M ESPE)
Filtek Supreme Ultra Flowable (3M Espe)
Filtek Supreme XT (F Sup XT/Filtek Supr. XT, 3M ESPE)
Filtek Supreme XT flow (F Sup XT flow, Filtek SP flow, Filtek Supr. Flow, 3M ESPE)
Filtek Silorane (3M ESPE)
Filtek Z100 (3M ESPE)
Filtek Z250 (3M ESPE)
G-aenial Flo (GC)
G-aenial Universal Flo (GC)
Grandio (Voco)
Grandio Flow (Voco)
GrandiO SO Heavy Flow (VOCO)
Herculite XRV (Kerr)
iBond SE (Heraeus)
Point 4 (Kerr)
Premise (Kerr)
Premise Flow (Kerr)
Revolution Form 2 (Kerr)
Scotchbond 1 XT (SB1XT, SB, 3M ESPE)
Syntac (Ivoclar Vivadent)
Tetric EvoCeram (Ivoclar Vivadent)
Tetric Evoflow (Ivoclar Vivadent)
Venus (Heraeus)
Venus Bulk Fill (Heraeus Kulzer)
Venus Diamond (Heraeus)
Venus Diamond Flow (Heraeus Kulzer)