Indirect emissions from rendered animal fats used for ... II... · Indirect emissions from rendered...
28
Indirect emissions from rendered animal fats used for biodiesel Final report Task 4a of ENER/C1/2013-412 - Confidential –
Transcript of Indirect emissions from rendered animal fats used for ... II... · Indirect emissions from rendered...
Indirect emissions from rendered animal fats used for
biodiesel Final report Task 4a of ENER/C1/2013-412
- Confidential –

ECOFYS Netherlands B.V. | Kanaalweg 15G | 3526 KL Utrecht| T +31 (0)30 662-3300 | F +31 (0)30 662-3301 | E [email protected] | I www.ecofys.com
Chamber of Commerce 30161191
Indirect emissions from rendered animal fats used for biodiesel Final report Task 4a of ENER/C1/2013-412
- Confidential –
By: Claire Chudziak and Sébastien Haye (E4tech)
Date: 20 June 2016
Project number: 15199
Reviewers: Hugo Valin (IIASA,
Daan Peters, Matthias Spöttle
(Ecofys)
This study has been commissioned and funded by the European Commission.
A cooperation of Ecofys, IIASA, Agra CEAS and E4tech

ECOFYS Netherlands B.V. | Kanaalweg 15G | 3526 KL Utrecht| T +31 (0)30 662-3300 | F +31 (0)30 662-3301 | E [email protected] | I www.ecofys.com
Chamber of Commerce 30161191
Table of contents
1 Introduction 1
1.1 Aim of the case study 1
1.2 Study scope 1
2 Animal fats markets in the EU 3
2.1 Availability of animal fats 3
2.2 Prices 4
2.3 Uses of animal fats 5
2.3.1 Process fuel and power generation 6
2.3.2 Biofuels 7
2.3.3 Oleochemicals 10
2.3.4 Animal feed 12
2.4 Potential substitution effects taking place 12
3 Modelling of ILUC impacts 14
3.1 Current demand, supply and prices 14
3.1.1 Parameters 15
3.2 Scenarios 15
3.3 Results 17
3.3.1 Interpretation 18
4 Conclusions and recommendations 21
5 References 23
Appendix I – Scenarios used in the evaluation tool 24

Indirect emissions from rendered animal fats used for biodiesel 1
1 Introduction
This study report is part of the Study on Estimation of indirect land-use change emissions from
bioenergy (ENER/C1/2013-412, Task 4a).
1.1 Aim of the case study
The aim of this case study is to estimate to which extent Indirect Land-Use Change (ILUC) would take
place following an increased use of animal fats (AF) for biodiesel production. It is based on interviews
with relevant stakeholders in the sector (e.g. renderers, biodiesel producers, chemical companies,
etc.) and explorative analysis using the evaluation tool developed by IIASA in Task 3. The production
of AF does not directly impact land use, as AF are by-products from the meat industry. However, it is
possible that an increase in demand for AF, as a result of an incentive towards the use of waste and
by-products in EU biofuel policy, could have an impact on the price and availability of AF. Reduced
availability and competition with other sectors using AF may lead to substitution effects and ILUC.
Where the substitute materials are based on agriculture or forestry, it is possible to estimate an ILUC
effect for AF derived biodiesel. Based on the interviews conducted among various experts, this case
study assumes that substitution of AF will be mainly by palm oil from South-East Asia.
In addition to LUC emissions, this study also quantifies indirect emissions due to increased use of
fossil fuels by renderers in replacement of animal fats, should they become too expensive due to an
increased demand from the biodiesel sector.
This report firstly outlines the animal fat market in the EU, based on literature, market data and
stakeholder interviews. Subsequently, the evaluation tool (created as part of Task 3 of contract
ENER/C1/2013-412) was used to calculate the ILUC impacts and indirect greenhouse gas (GHG)
emissions of an increased use of AF for biodiesel production under different scenarios.
1.2 Study scope
This study focuses on rendered animal fats (category 1, 2 and 3) obtained by rendering animal
remains after the initial removal of meat, hides and food grade fats are considered. These are fats
obtained from internal organs, heads and tissues. Food grade animal fats for human consumption are
excluded from the analysis.
Rendered animal fats produced in the EU are divided into 3 categories as defined in the Animal By-
Products Regulation 1069/2009.
Indirect emissions from rendered animal fats used for biodiesel 2
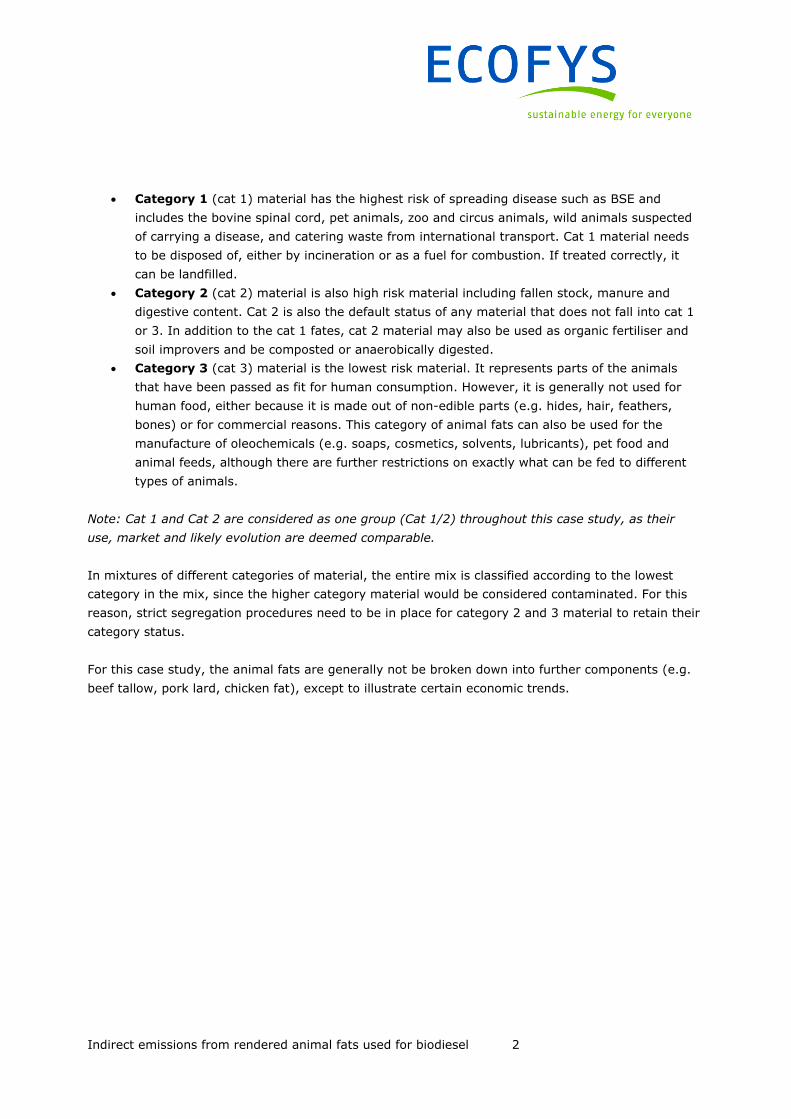
Category 1 (cat 1) material has the highest risk of spreading disease such as BSE and
includes the bovine spinal cord, pet animals, zoo and circus animals, wild animals suspected
of carrying a disease, and catering waste from international transport. Cat 1 material needs
to be disposed of, either by incineration or as a fuel for combustion. If treated correctly, it
can be landfilled.
Category 2 (cat 2) material is also high risk material including fallen stock, manure and
digestive content. Cat 2 is also the default status of any material that does not fall into cat 1
or 3. In addition to the cat 1 fates, cat 2 material may also be used as organic fertiliser and
soil improvers and be composted or anaerobically digested.
Category 3 (cat 3) material is the lowest risk material. It represents parts of the animals
that have been passed as fit for human consumption. However, it is generally not used for
human food, either because it is made out of non-edible parts (e.g. hides, hair, feathers,
bones) or for commercial reasons. This category of animal fats can also be used for the
manufacture of oleochemicals (e.g. soaps, cosmetics, solvents, lubricants), pet food and
animal feeds, although there are further restrictions on exactly what can be fed to different
types of animals.
Note: Cat 1 and Cat 2 are considered as one group (Cat 1/2) throughout this case study, as their
use, market and likely evolution are deemed comparable.
In mixtures of different categories of material, the entire mix is classified according to the lowest
category in the mix, since the higher category material would be considered contaminated. For this
reason, strict segregation procedures need to be in place for category 2 and 3 material to retain their
category status.
For this case study, the animal fats are generally not be broken down into further components (e.g.
beef tallow, pork lard, chicken fat), except to illustrate certain economic trends.
Indirect emissions from rendered animal fats used for biodiesel 3
2 Animal fats markets in the EU
In an attempt to understand and articulate the animal fats sector in the EU, interviews were
conducted among stakeholders from a number of organisations. These include:
Argent
Saria
APAG (European Oleochemicals and Allied Products Group)
Croda International PLC
FABRA (Foodchain and biomass renewables association)
Demeter
Emery Oleochemicals
Greenergy
Neste Oil
FEFAC (European Feed Manufacturers’ Federation)
The following sub-sections are based on these interviews, as well as literature review.
2.1 Availability of animal fats
There is a finite stock of animal fats that can be produced in the EU, which is dependent on the
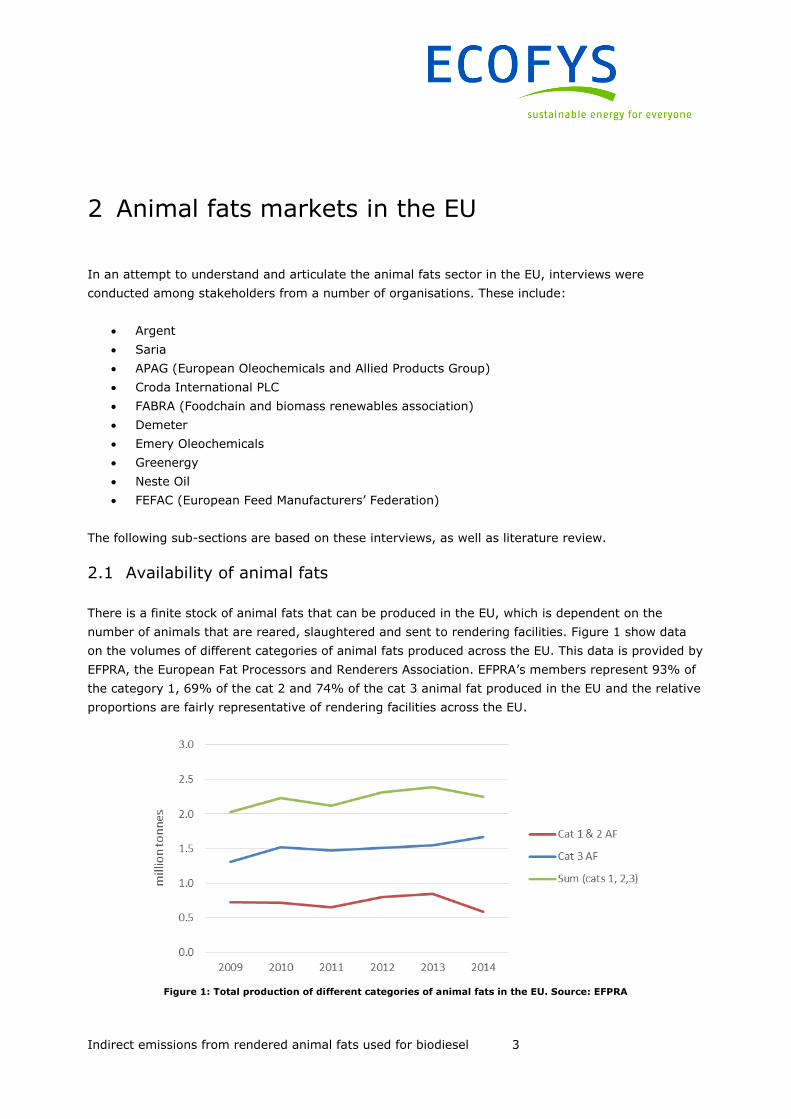
number of animals that are reared, slaughtered and sent to rendering facilities. Figure 1 show data
on the volumes of different categories of animal fats produced across the EU. This data is provided by
EFPRA, the European Fat Processors and Renderers Association. EFPRA’s members represent 93% of
the category 1, 69% of the cat 2 and 74% of the cat 3 animal fat produced in the EU and the relative
proportions are fairly representative of rendering facilities across the EU.
Figure 1: Total production of different categories of animal fats in the EU. Source: EFPRA
Indirect emissions from rendered animal fats used for biodiesel 4
As can be seen in Figure 1, the production of animal fat from raw material has been fairly stable over
the last 5 years. From year to year there are fluctuations in preferences for different types of animal
meats. For example, interviews reveal that the last few years have seen a decline in beef production,
a stabilisation of pig meat production and an increase in poultry meat production. Only in recent
years has there been a slight increase in the production of cat 3 AFs and a decline in the production
of cat 1&2 AFs. This could be explained by an improvement in the segregation processes at the
rendering facility to produce more cat 3 material, which receives a higher price. Some of the
interviewees suggest that since beef production generates cat 1 material, a decline in beef
consumption would lead to a decline in cat 1 production. Another explanation lays with the fact that
some MS have lifted restrictions over use of certain AF categories.
Restrictions on cat 1 material are currently being relaxed (Ecofys, 2014), and this trend is expected
to continue in the coming years, resulting in a slight increase in cat 3 material and a slight reduction
of cat 1 material. However, the exact change in volume is uncertain as it will depend on the extent to
which rendering facilities currently producing largely cat 1 material are willing to invest in segregation
procedures to produce potentially small additional amounts of cat 3 animal by-products. Increase in
cat 3 AF could be significantly offset by incentives over the use of cat 1-2 AF for biodiesel production
(e.g. double counting), which might raise the prices of cat 1-2 AF to a point where they would
become more profitable than cat 3 AF. This study evaluated to which extent cat 3 AF might be
increasingly used to produce biodiesel. This could happen as a result of cat 1-2 AF price increasing
above cat 3 AF price or to benefit from double counting via downgrading.
Since countries outside the EU do not have the same categorisation of animal by-products, the
possibility to import animal fats, especially from the United States, is currently limited. There are
some imports and exports of animal fats from the EU, but the industries that could use cat 1 AFs (i.e.
biofuels, rendering, power) appear unlikely to consider AF imports in response to increased
competition in the EU, due to the additional costs associated with transporting AFs, compared to
substitution by fossil fuels.
2.2 Prices
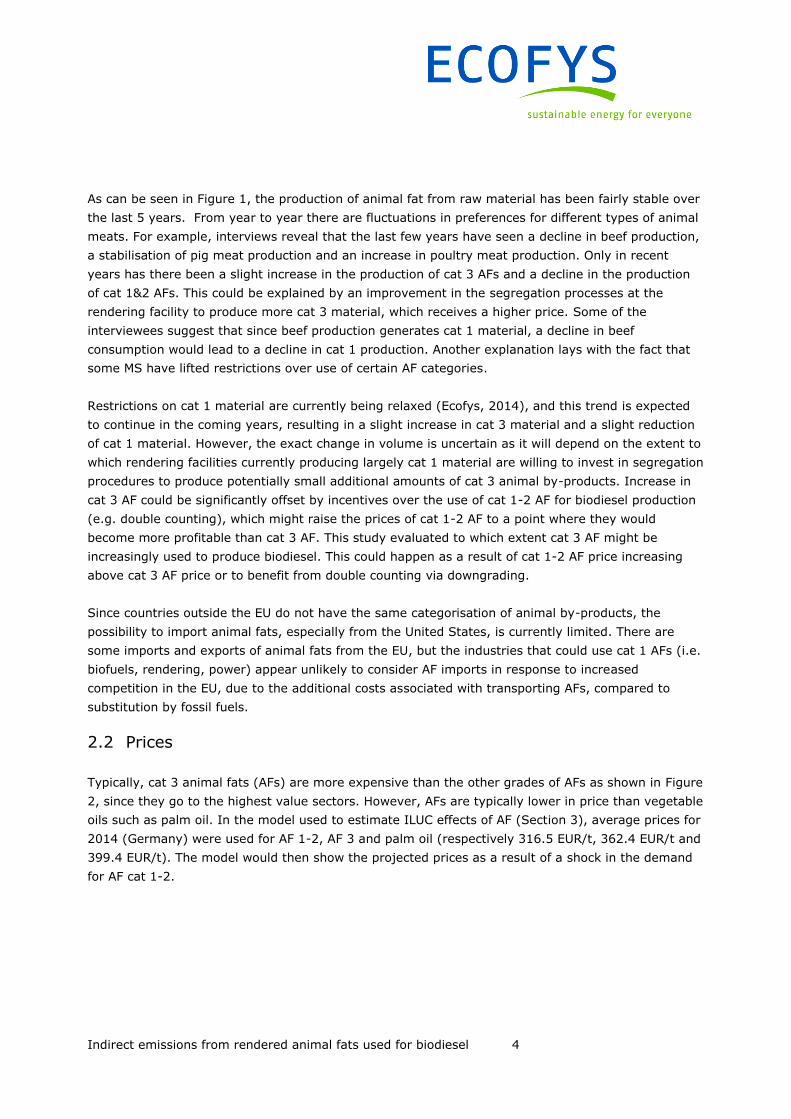
Typically, cat 3 animal fats (AFs) are more expensive than the other grades of AFs as shown in Figure
2, since they go to the highest value sectors. However, AFs are typically lower in price than vegetable
oils such as palm oil. In the model used to estimate ILUC effects of AF (Section 3), average prices for
2014 (Germany) were used for AF 1-2, AF 3 and palm oil (respectively 316.5 EUR/t, 362.4 EUR/t and
399.4 EUR/t). The model would then show the projected prices as a result of a shock in the demand
for AF cat 1-2.

Indirect emissions from rendered animal fats used for biodiesel 5
Figure 2: Prices of animal fats relative to palm oil and used cooking oils. Source: F.O. Licht, Oil World (own
calculation in task 2 of this project)
A wide variation in the price of animal and vegetable fats can be observed over time. In addition, AFs
may not be bought on an open market but instead bought directly from renderers. Other factors that
affect the price are the distance which the AFs have to be transported, the time of year, how far in
advance you want to secure feedstocks and the exact specification of the AFs. Based on discussions
with the rendering industry, there are typically no long-term contracts for animal fats; AFs can
typically only be bought up to three months in advance, which is determined by the visibility given by
the slaughterhouses that have always worked on these timeframes.
2.3 Uses of animal fats
The key applications for the categories of AFs considered in this case study are:1
As a process fuel in the rendering facility for process heat and power (no data available on
this at an EU level)
1 Source for all values in this section: EFPRA (2015)
Indirect emissions from rendered animal fats used for biodiesel 6
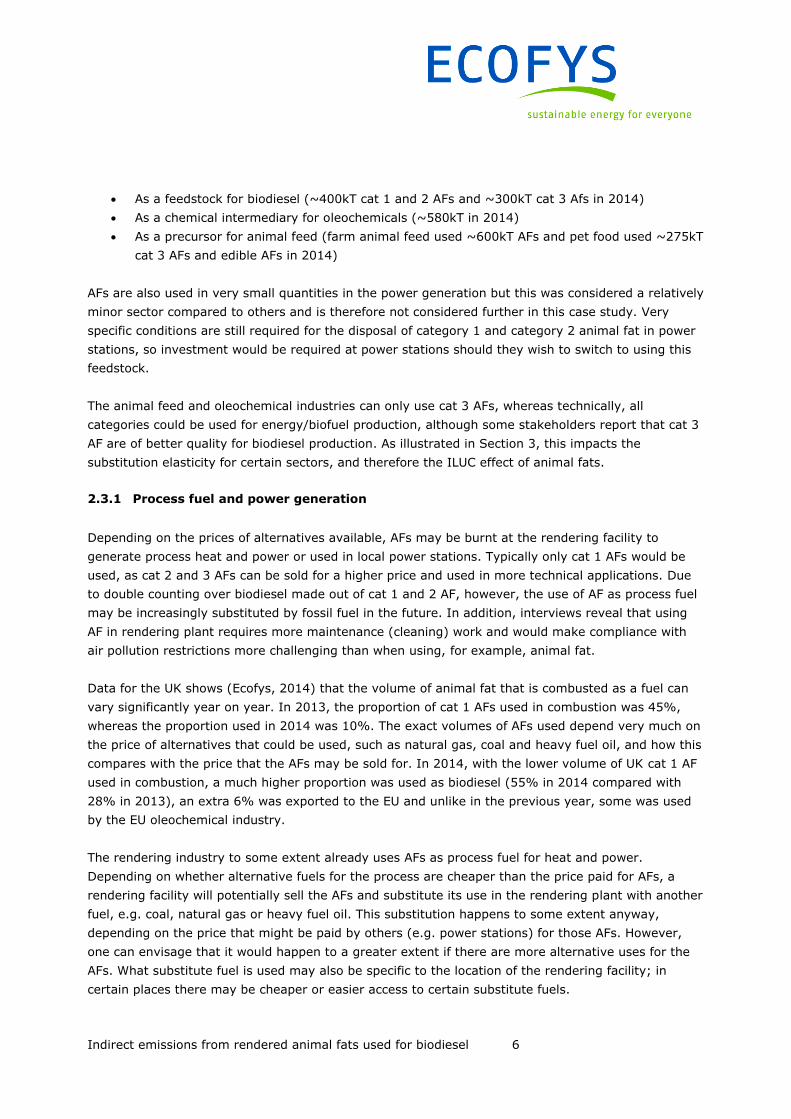
As a feedstock for biodiesel (~400kT cat 1 and 2 AFs and ~300kT cat 3 Afs in 2014)
As a chemical intermediary for oleochemicals (~580kT in 2014)
As a precursor for animal feed (farm animal feed used ~600kT AFs and pet food used ~275kT
cat 3 AFs and edible AFs in 2014)
AFs are also used in very small quantities in the power generation but this was considered a relatively
minor sector compared to others and is therefore not considered further in this case study. Very
specific conditions are still required for the disposal of category 1 and category 2 animal fat in power
stations, so investment would be required at power stations should they wish to switch to using this
feedstock.
The animal feed and oleochemical industries can only use cat 3 AFs, whereas technically, all
categories could be used for energy/biofuel production, although some stakeholders report that cat 3
AF are of better quality for biodiesel production. As illustrated in Section 3, this impacts the
substitution elasticity for certain sectors, and therefore the ILUC effect of animal fats.
2.3.1 Process fuel and power generation
Depending on the prices of alternatives available, AFs may be burnt at the rendering facility to
generate process heat and power or used in local power stations. Typically only cat 1 AFs would be
used, as cat 2 and 3 AFs can be sold for a higher price and used in more technical applications. Due
to double counting over biodiesel made out of cat 1 and 2 AF, however, the use of AF as process fuel
may be increasingly substituted by fossil fuel in the future. In addition, interviews reveal that using
AF in rendering plant requires more maintenance (cleaning) work and would make compliance with
air pollution restrictions more challenging than when using, for example, animal fat.
Data for the UK shows (Ecofys, 2014) that the volume of animal fat that is combusted as a fuel can
vary significantly year on year. In 2013, the proportion of cat 1 AFs used in combustion was 45%,
whereas the proportion used in 2014 was 10%. The exact volumes of AFs used depend very much on
the price of alternatives that could be used, such as natural gas, coal and heavy fuel oil, and how this
compares with the price that the AFs may be sold for. In 2014, with the lower volume of UK cat 1 AF
used in combustion, a much higher proportion was used as biodiesel (55% in 2014 compared with
28% in 2013), an extra 6% was exported to the EU and unlike in the previous year, some was used
by the EU oleochemical industry.
The rendering industry to some extent already uses AFs as process fuel for heat and power.
Depending on whether alternative fuels for the process are cheaper than the price paid for AFs, a
rendering facility will potentially sell the AFs and substitute its use in the rendering plant with another
fuel, e.g. coal, natural gas or heavy fuel oil. This substitution happens to some extent anyway,
depending on the price that might be paid by others (e.g. power stations) for those AFs. However,
one can envisage that it would happen to a greater extent if there are more alternative uses for the
AFs. What substitute fuel is used may also be specific to the location of the rendering facility; in
certain places there may be cheaper or easier access to certain substitute fuels.
Indirect emissions from rendered animal fats used for biodiesel 7
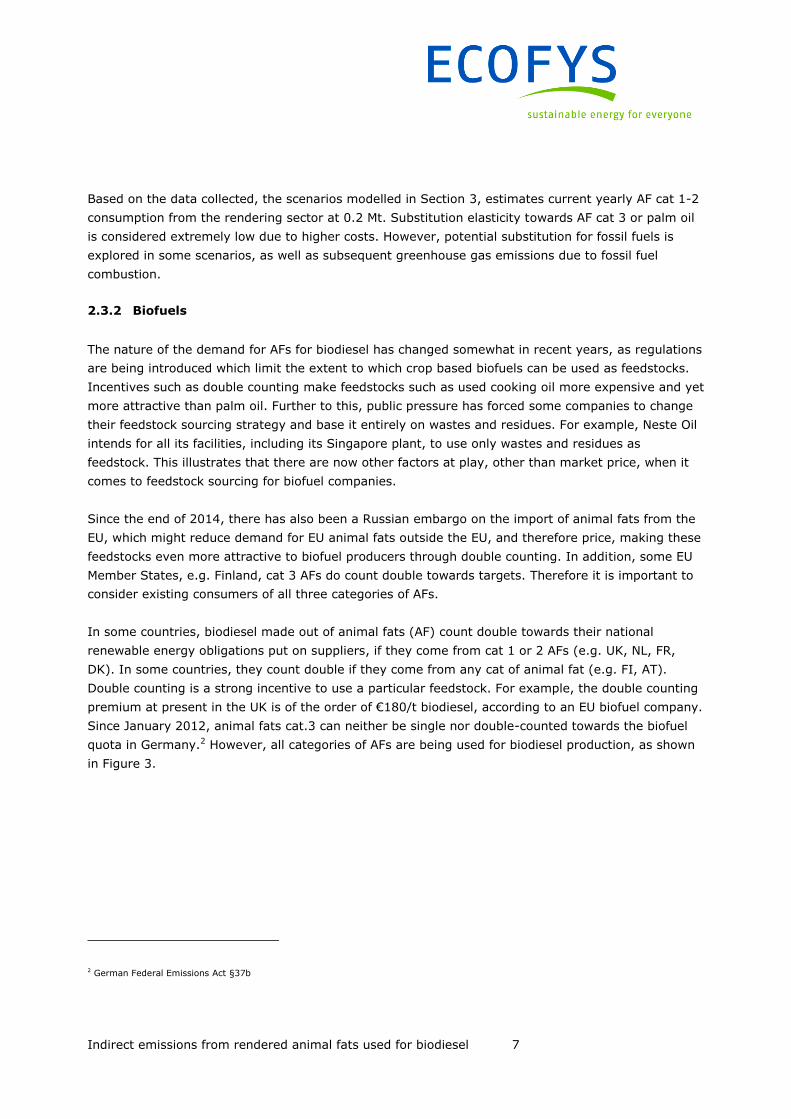
Based on the data collected, the scenarios modelled in Section 3, estimates current yearly AF cat 1-2
consumption from the rendering sector at 0.2 Mt. Substitution elasticity towards AF cat 3 or palm oil
is considered extremely low due to higher costs. However, potential substitution for fossil fuels is
explored in some scenarios, as well as subsequent greenhouse gas emissions due to fossil fuel
combustion.
2.3.2 Biofuels
The nature of the demand for AFs for biodiesel has changed somewhat in recent years, as regulations
are being introduced which limit the extent to which crop based biofuels can be used as feedstocks.
Incentives such as double counting make feedstocks such as used cooking oil more expensive and yet
more attractive than palm oil. Further to this, public pressure has forced some companies to change
their feedstock sourcing strategy and base it entirely on wastes and residues. For example, Neste Oil
intends for all its facilities, including its Singapore plant, to use only wastes and residues as
feedstock. This illustrates that there are now other factors at play, other than market price, when it
comes to feedstock sourcing for biofuel companies.
Since the end of 2014, there has also been a Russian embargo on the import of animal fats from the
EU, which might reduce demand for EU animal fats outside the EU, and therefore price, making these
feedstocks even more attractive to biofuel producers through double counting. In addition, some EU
Member States, e.g. Finland, cat 3 AFs do count double towards targets. Therefore it is important to
consider existing consumers of all three categories of AFs.
In some countries, biodiesel made out of animal fats (AF) count double towards their national
renewable energy obligations put on suppliers, if they come from cat 1 or 2 AFs (e.g. UK, NL, FR,
DK). In some countries, they count double if they come from any cat of animal fat (e.g. FI, AT).
Double counting is a strong incentive to use a particular feedstock. For example, the double counting
premium at present in the UK is of the order of €180/t biodiesel, according to an EU biofuel company.
Since January 2012, animal fats cat.3 can neither be single nor double-counted towards the biofuel
quota in Germany.2 However, all categories of AFs are being used for biodiesel production, as shown
in Figure 3.
2 German Federal Emissions Act §37b
Indirect emissions from rendered animal fats used for biodiesel 8
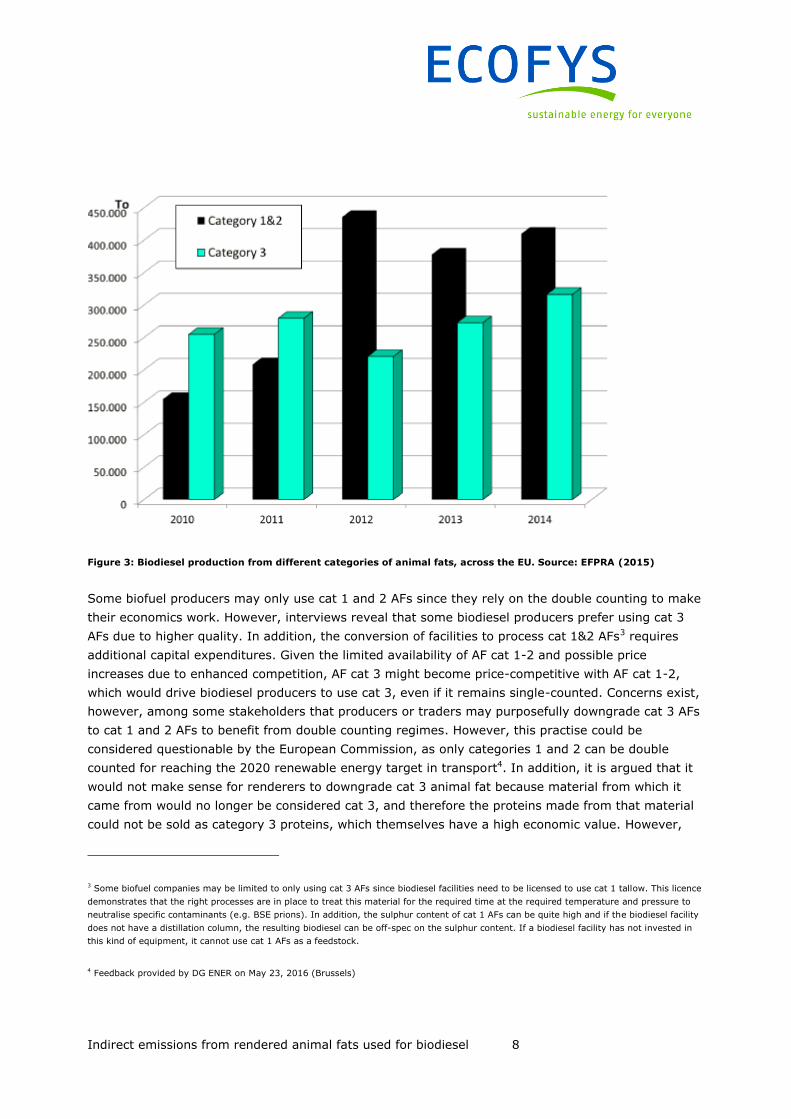
Figure 3: Biodiesel production from different categories of animal fats, across the EU. Source: EFPRA (2015)
Some biofuel producers may only use cat 1 and 2 AFs since they rely on the double counting to make
their economics work. However, interviews reveal that some biodiesel producers prefer using cat 3
AFs due to higher quality. In addition, the conversion of facilities to process cat 1&2 AFs3 requires
additional capital expenditures. Given the limited availability of AF cat 1-2 and possible price
increases due to enhanced competition, AF cat 3 might become price-competitive with AF cat 1-2,
which would drive biodiesel producers to use cat 3, even if it remains single-counted. Concerns exist,
however, among some stakeholders that producers or traders may purposefully downgrade cat 3 AFs
to cat 1 and 2 AFs to benefit from double counting regimes. However, this practise could be
considered questionable by the European Commission, as only categories 1 and 2 can be double
counted for reaching the 2020 renewable energy target in transport4. In addition, it is argued that it
would not make sense for renderers to downgrade cat 3 animal fat because material from which it
came from would no longer be considered cat 3, and therefore the proteins made from that material
could not be sold as category 3 proteins, which themselves have a high economic value. However,
3 Some biofuel companies may be limited to only using cat 3 AFs since biodiesel facilities need to be licensed to use cat 1 tallow. This licence
demonstrates that the right processes are in place to treat this material for the required time at the required temperature and pressure to
neutralise specific contaminants (e.g. BSE prions). In addition, the sulphur content of cat 1 AFs can be quite high and if the biodiesel facility
does not have a distillation column, the resulting biodiesel can be off-spec on the sulphur content. If a biodiesel facility has not invested in
this kind of equipment, it cannot use cat 1 AFs as a feedstock.
4 Feedback provided by DG ENER on May 23, 2016 (Brussels)

Indirect emissions from rendered animal fats used for biodiesel 9
there may always be a risk of a fraud, by transporting the cat 3 AFs to a cat 1 facility for example.
Others have also pointed out that edible fats could also be downgraded and that this may explain the
dip in in the production of food grade tallow and lard since 2012 (see Figure 4 – tallow and lard,
along with chicken fat, are the main components of animal fats). However, there may also be very
legitimate reasons for this dip, such as particular diseases in these years that have resulted in more
food grade AFs rendered unfit for human consumption.
Figure 4: Production of food grade tallow and lard. Source: EFPRA (2015)
In the model used in this study to evaluate ILUC emissions, an increased use of AF cat 3 for biodiesel
production was included in certain scenarios. This could either occur as a result of an increase in cat
1-2 price up to a point where it would be more profitable to produce single-counted AF cat 3 biodiesel
than double-counted AF cat 1-2 biodiesel, which would be legal. An increased use of cat 3 biodiesel
could also be foreseen through the deliberate illegal downgrading of cat 3 AF as cat 1-2 AF to benefit
from double counting regime. The model used in this study does not differentiate between these two
alternatives, as in both cases, an increased amount of AF cat 3 would be used for biodiesel
production, which would create competition with other sectors using AF cat 3, and therefore ILUC.
An increased use of AF cat 3 for biodiesel production is explored in Section 3. Based on the data
collection conducted for the purpose of the current study, the consumption of AF cat 1-2 and AF cat 3
by the biodiesel industry is estimated at 0.4 Mt/year and 0.3 Mt/year respectively. While the demand
elasticity for the biodiesel industry is considered nil, a high substitution elasticity is assumed in
certain scenarios, which correspond to an increased use of cat 3 for biodiesel production (through
downgrading of cat 1-2 or not) and substitution of AF cat 3 by palm oil in other sectors.
Indirect emissions from rendered animal fats used for biodiesel 10
2.3.3 Oleochemicals
Note: Companies that are not using AFs as feedstock are not included in the “oleochemical industry”
throughout the document.
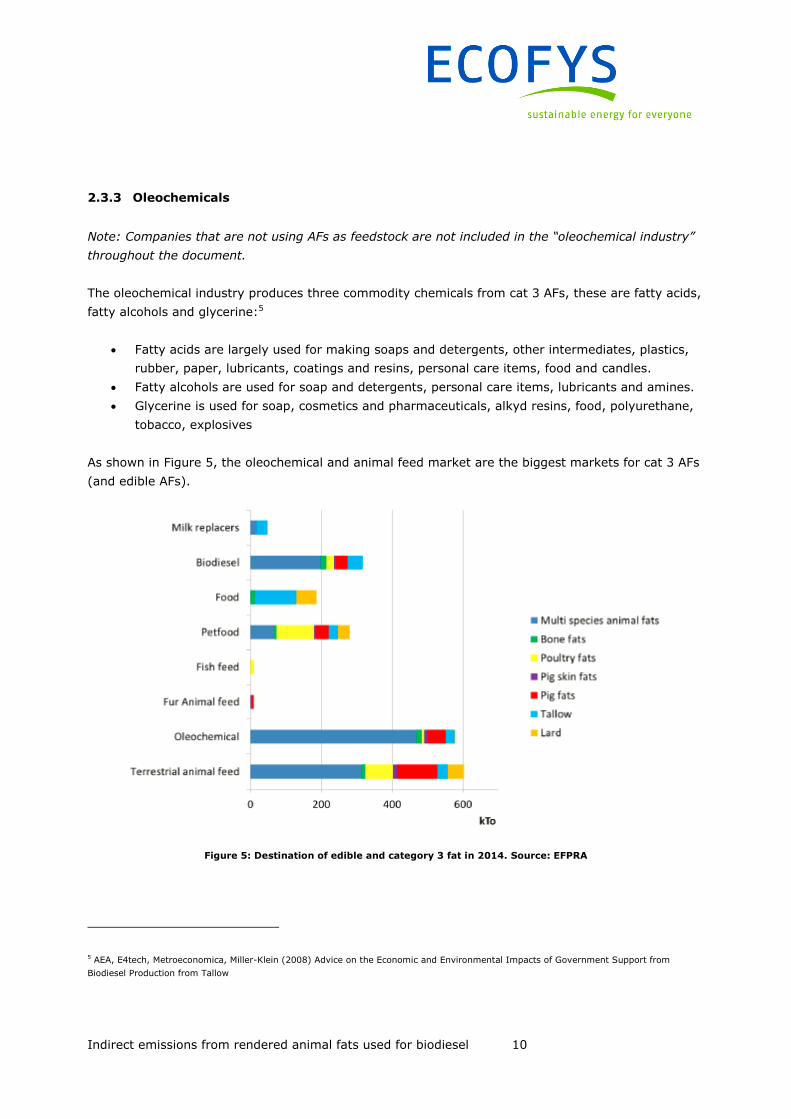
The oleochemical industry produces three commodity chemicals from cat 3 AFs, these are fatty acids,
fatty alcohols and glycerine:5
Fatty acids are largely used for making soaps and detergents, other intermediates, plastics,
rubber, paper, lubricants, coatings and resins, personal care items, food and candles.
Fatty alcohols are used for soap and detergents, personal care items, lubricants and amines.
Glycerine is used for soap, cosmetics and pharmaceuticals, alkyd resins, food, polyurethane,
tobacco, explosives
As shown in Figure 5, the oleochemical and animal feed market are the biggest markets for cat 3 AFs
(and edible AFs).
Figure 5: Destination of edible and category 3 fat in 2014. Source: EFPRA
5 AEA, E4tech, Metroeconomica, Miller-Klein (2008) Advice on the Economic and Environmental Impacts of Government Support from
Biodiesel Production from Tallow

Indirect emissions from rendered animal fats used for biodiesel 11
The type of AF used by the oleochemical industry in Europe is mainly cat 3 AFs; only 2% of
oleochemicals in Europe were sourced from cat 1 and 2 AFs in 2014 (EFPRA, 2015).
However, the oleochemical industry in Europe is not homogeneous. There are companies which still
use traditional feedstocks such as AFs produced in the EU, and there are other companies that have
merged with Indonesian and Malaysian companies and no longer use these traditional feedstocks but
instead use palm oil (fruit and/or kernel), not bought on the market but sourced through their
vertically integrated companies.
According to the representatives of the EU oleochemical industry interviewed for this project, the
additional support given to biofuel producers in the form of double counting increases the price of all
categories of feedstock, including category 3 feedstock that they wish to use for oleochemicals. As
noted earlier, since AFs do not get sorted into the same categorisation outside the EU, it is not
possible to import cat 3 AFs into the EU and thereby expand the pool of feedstocks available to the
EU oleochemicals industry (and biodiesel industry).
As the price of AFs increase and competition for AF will likely become more intense, it becomes
pertinent to understand what options are open to the oleochemical industry to substitute for the AFs.
According to the industry, palm oil is the best substitute for AFs, since it is the closest chemically to
AFs; i.e. it has suitable proportions of oleic and stearic acids which are required for the products they
make from the fats.
However, substituting animal fats with palm oil can be economically damaging for companies without
vertical integration of palm production (see above), due to higher trading prices Since 2011,
Indonesia has discouraged crude palm oil exports, in order to encourage value added industries to
develop there, by having a lower export tax on refined palm oil products, than on crude palm oil. This
resulted in a wave of capacity building to make refined palm oil, as crude palm oil products are barely
profitable. Companies are now focusing on oleochemicals made from refined palm products to
increase their margins.
Without access to low cost AF feedstocks, some players fear that the EU oleochemical industry will
fold and EU oleochemical demand will be displaced onto palm oil production in SE Asia. in addition to
the economic risks for oleochemical companies, palm oil production is currently marked with a high
greenhouse gas intensity from land-use change (8.2 t CO2 eq/t of PO) due to the assumption that
new palm plantation will be planted on drained peat swamps or deforested areas. A global application
in certification of palm oil imports to a credible sustainability standard (e.g. RSPO, Rainforest
Alliance) would significantly reduce environmental and socio-economic risks in palm production areas,
and therefore decrease the GHG intensity from land-use change.
In Section 3, the current annual consumption of AF cat 3 and palm oil by the oleochemical industry is
estimated at 0.6Mt and 0.7Mt respectively. A very low demand elasticity is attributed to this sector
and a limited substitution elasticity is tested in certain scenarios.

Indirect emissions from rendered animal fats used for biodiesel 12
2.3.4 Animal feed
FEFAC, the European Feed Manufacturers’ federation does not collect industry wide data on the
proportion of the fat in its feed that comes from animal fats and the proportion that comes from
vegetable oils. This can be explained by the fact that only 2% of industrial compound feed is made up
of fats and oils (personal communication, FEFAC). The main types of vegetable oils that are used in
feed are palm oil and rapeseed oil. Other oils e.g. soybean oil or sunflower oil are used at lower
levels. The fatty acid composition of the fats or oils used is important not just for the nutrition of the
animal but it also has implications on the quality of the final meat – e.g. saturated fatty acids are
preferred for chicken feed as it increases the chicken meat’s firmness.
In the UK, the animal feed industry for consumable products does not use AFs from land based
animals. However, in mainland Europe, the restrictions on using AFs in animal feed are different; in
general animal fats can be used in animal feed. However, there is still some market resistance to
using animal fats in feed, even though it has been deemed safe in the legislation. Furthermore, in
Germany, there are additional national regulations which mean that no animal fats are used in feed
there. Thus there are still some market and legal barriers which limit the extent to which it is used in
this sector.
The animal feed industry also uses cat 3 AFs. As for the oleochemical industry, it is not possible to
import cat 3 AFs from outside the EU, so the pool of available feedstock is limited to what is available
in the EU. However, the animal feed industry only sees the fat portion of the animal feed as a minor
component and so the importance of the availability of animal fats is not seen as so critical to this
sector.
The animal feed sector appears to be able to substitute its animal fat use fairly easily with vegetable
oils such as crude palm oil and palm fatty acids and rapeseed oil. Other oils that may be used include
soybean and sunflower oil. But these oils are not considered to have as desirable properties as palm
and rapeseed.
2.4 Potential substitution effects taking place
Task 4a aims to estimate the effect of an increased consumption of animal fats cat 1-2 by the
biodiesel industry. By decreasing the available supply of AF cat 1-2, biodiesel would drive prices up,
thus possibly leading to substitution in other sectors, which would use alternative products in
replacement, including the biodiesel industry itself turning to AF cat 3. This section describes to which
extent the different sectors covered in Task 4a could replace AF cat 1-2, based on the interviews
conducted.
Rendering industry: Natural gas, coal or HFO would likely replace AF (with varying increases in
emissions compared with AF). Technically this AF could be imported from outside the EU but this
is unlikely to make economic sense for process fuel.
Indirect emissions from rendered animal fats used for biodiesel 13
Animal feed: The animal fat would be replaced by crude palm oil and rapeseed oil. More AF
could not be imported from outside EU because outside the EU there is not the same
categorisation of animal fats.
Oleochemicals: This could potentially be replaced by palm oil as a feedstock due to similar
chemical properties, or potentially more likely, by palm based products produced in SE Asia. Used
cooking oil seems an unlikely substitute due to the double counting regime for biofuels and
difference in chemical composition (Volatile quality - as UCO can consist of different vegetable oil
the length of the carbon chain cannot always be guaranteed, this however is an essential criteria
for the processing into oleochemical products.6) More cat 3 would not be imported from outside
EU because outside the EU there is not the same categorisation of AFs, so all imported AF is
considered to be cat 1.
Biofuels: As imports of AF are highly unlikely, biodiesel producers may consider using AF cat 3
for single counted biodiesel, either for quality reasons (See Section 2.3.2) or because of an
increase in AF cat 1-2 prices. There is also a possibility for a deliberate labelling of AF cat 3 as cat
1-2 (downgrading) to benefit from double counting regimes, although this would not modify the
modelling results. Biodiesel producers may also consider an increased use of palm oil should AF
prices become too high.
6 Ecofys, 2013. Low ILUC potential of wastes and residues for biofuels

Indirect emissions from rendered animal fats used for biodiesel 14
3 Modelling of ILUC impacts
Potential ILUC impacts of an increase in AF consumption in the EU were explored using an ILUC
evaluation tool specifically developed in this project. This tool, based on a partial equilibrium
framework, represents in a stylised form the different markets displacements associated to a change
in AFs use as biofuel (also called “shock”). The full description of the evaluation tool is available in the
‘Evaluation Tool user guide’ (IIASA 2016)
3.1 Current demand, supply and prices
The data collected through literature review and interviews were used to evaluate current AF and
palm oil demand levels by the different sectors considered in this project, as summarised in Table 1.
Demand
(Mt) Biodiesel7 Oleochemical Rendering Feed Food
Total
Cat 1&2
AF
0.4 0 0.2 0 0 0.6
Cat 3 Afs 0.3 0.6 0 0.7 0 1.6
Veg oil 2 0.7 0 1.4 3 7.1
Table 1: Current demand levels for animal fats and palm oil in the different sectors considered
Similarly, Table 2 describes the estimated current supply levels used in the evaluation tool as
reference.
Supply (Mt)
Cat 1&2
AF
0.6
Cat 3 AF 1.6
Palm oil 7.1
Table 2: Current supply levels for the different feedstocks considered
7 In the evaluation tool, two entries were used for biodiesel, one of which was used to simulate two types of substitution, one by vegetal oil,
one through downgrading. For the purpose of the report, biodiesel values are consolidated into one entry.
Indirect emissions from rendered animal fats used for biodiesel 15
The prices used in the evaluation tool were the average 2014 AF prices in Germany (316.5 EUR/t and
362.4 EUR/t for AF cat 1-2 and cat 3 respectively) and the average 2014 palm oil price from ARA
(and 399.4 EUR/t).
3.1.1 Parameters
The evaluation tool is used to estimate the effect of a “shock” in the demand for animal fats cat 1-2,
i.e. an increase in the demand by the biodiesel sector, which could be induced, among other things,
by policy incentives such as double counting. Three sizes of shock were tested in this evaluation:
1) High shock: increase of demand in AF cat 1-2 by 0.5 Mt (corresponding to almost the entire
current production – see Table 2);
2) Medium shock: increase of demand in AF cat 1-2 by 0.3 Mt;
3) Small shock: increase of demand in AF cat 1-2 by 0.2 Mt.
Response to the shock for different scenarios is evaluated by adjusting different parameters,
including:
- Changes in the supply of AF and PO (supply elasticity);
- Changes in the demand for AF and PO from the different sectors (demand elasticity);
- Feedstock substitution (substitution elasticity).
The evaluation tool provides an estimate of the effect of the shock on the above parameters, as well
as the impact on the prices of AF cat 1-2, cat 3 and palm oil, as well as the ILUC-induced CO2
emissions generated by each additional ton of AF cat 1-2 required by the biodiesel industry.
In the specific scenarios where renderers would substitute animal fats with fossil fuels, indirect GHG
emissions from the combustion of fossil fuel are estimated in addition to ILUC emissions.
3.2 Scenarios
Scenarios were built around different assumptions regarding the elasticities of supply, demand and
substitution of the different sectors which currently consume AF cat 1-2.
The supply elasticity was deemed nil for AF cat 1-2 and cat 3, given that they represent a by-
product from the meat industry and their production within the EU cannot be increased by the sole
demand from the biodiesel industry. Imports from US are currently limited and were not modelled.
Palm oil is therefore considered the only feedstock with supply elasticity; following recommendations
from Hertel (2007), the supply elasticity for palm oil was estimated at 3.3.
The demand elasticity was deemed nil or very low for all sectors considered in the study, with the
exception of the rendering sector: in scenarios where the possibility for renderers to substitute AF for
fossil fuel, a high demand elasticity (5) was used.
Indirect emissions from rendered animal fats used for biodiesel 16
The substitution elasticity was deemed very low (0.2) in the rendering and food industry, given
that only one feedstock is currently used. The substitution elasticity for oleochemical industry was 0
in scenarios where the shock was deemed to not affect AF cat 3 prices and 1 where AF cat 3 prices
were impacted. In order to integrate the possibility of an increased use of AF cat 3 instead of cat 1-2
(which includes single-counted cat 3 biodiesel and the deliberate downgrading of cat 3 into cat 1-2 to
benefit from double-counting regime) by the biodiesel industry, moderate (5) and high (10)
substitution elasticities were tested for biodiesel.
16 scenarios were tested through the evaluation tool (full description of scenarios is available in
Appendix I), the objective being to test variations in the elasticities and shock sizes. The possibility
for renderers to replace AF by fossil fuels in their processing was also explored, as it could yield to
indirect GHG emissions.
Several scenarios were deemed unrealistic, based on the resulting forecasts in terms of AF and palm
oil prices. “Realistic” scenarios are those for which AF cat 1-2 prices are either inferior, equal or
reasonably superior to AF cat 3 prices (Table 3), with the exception of scenario 1a, which was
retained to illustrate the possible effect of a high shock combined with a restriction on the use of AF
cat 3 for biodiesel (in such case, the model results in AF cat 1-2 skyrocketing above 18’000USD/t!).
The “blue” scenarios assume a high shock; “yellow” scenarios all assume a medium shock; finally,
the “green” scenarios assume a low shock. Variations among scenarios regard the difference in
substitution from the oleochemical industry as a result from the shock, whether renderers might
substitute animal fats for fossil fuels and whether AF cat 3 would be used for biodiesel
(“downgrading”).

Indirect emissions from rendered animal fats used for biodiesel 17
Table 3: Scenarios used in the evaluation tool8
3.3 Results
Table 4 describes the indirect greenhouse gas emissions from an increase in AF consumption by the
biodiesel sector in EU, based on the results obtained via the evaluation tool (expressed in tCO2eq/t of
AF cat 1-2). Indirect emissions include both ILUC emissions and emissions from substitution by
renderers towards fossil fuels (three variations are tested here: coal, oil and natural gas). The total
adds up ILUC and fossil fuel emissions.
The main result is that there would indeed be a significant indirect impact of an increased use of
animal fats for biodiesel production. Considering ILUC emissions only, results show significant
8 All other elasticities remain constant
Scenario Description Shock size Demand elasticitiesSubstitution elasticities
# Mt rendering BD1 BD2 oleochem
1aHigh shock. Increased use of AF3 for Biodiesel.
Shock does not affect Cat 3 prices so no
response from oleochemicals.0.5 0.2 1 10 0
1c
High shock. Increased use of AF3 for Biodiesel.
Renderers substitute AF w FF. Shock does not
affect Cat 3 prices so no response from
oleochemicals.
0.5 5 1 10 0
2bMedium shock. Increased use of AF3 for
Biodiesel. Shock does not affect Cat 3 prices
so no response from oleochemicals.0.3 0.2 1 10 0
2c
Medium shock. Increased use of AF3 for
Biodiesel. Renderers substitute AF w FF.
Shock does not affect Cat 3 prices so no
response from oleochemicals.
0.3 5 1 10 0
2f
Medium shock. Increased use of AF3 for
Biodiesel. Renderers substitute AF w FF.
Shock does affect Cat 3 prices so response
from oleochemicals.
0.3 5 1 10 1
3b
Low shock. No ncreased use of AF3 for
Biodiesel. Renderers substitute AF w FF.
Shock does not affect Cat 3 prices so no
response from oleochemicals.
0.2 5 1 1 0
3d
Low shock. Moderate increased use of AF3 for
Biodiesel. Renderers substitute AF w FF.
Shock does affect Cat 3 prices so response
from oleochemicals.
0.2 5 1 5 1
3eLow shock. Increased use of AF3 for Biodiesel.
Shock does not affect Cat 3 prices so no
response from oleochemicals.0.2 0.2 1 10 0

Indirect emissions from rendered animal fats used for biodiesel 18
variations (from 1.5 to 4.9). As mentioned in the previous section, scenario 1a yields unrealistic
results in terms of price changes and is therefore not considered in the analysis of ILUC emissions.
When considering additional emissions from fossil fuel in scenarios where renderers substitute AF
with fossil fuels, variations between the scenarios tend to decrease (2.1 to 4.8), the demand
elasticity from the rendering industry being a key driver(e.g. comparing scenarios 2b and 2c).
Table 4: Indirect CO2 emissions from animal fat biodiesel (Note: indirect emissions are expressed in tCO2eq/t cat
1&2 animal facts consumed)
3.3.1 Interpretation
Because the evaluation tool only looked at a limited scope of products and variables and assumptions
were not supported by sound econometric research, results shall not be considered as accurate
projections. However, they provide meaningful trends, with regards to the most impactful factors in
terms of indirect GHG emissions from an increased used of animal fats by the biodiesel industry.
Scenario Description
# ILUC coal oil nat gas Total
1aHigh shock. Increased use of AF3 for Biodiesel.
Shock does not affect Cat 3 prices so no
response from oleochemicals.11.5 1.0 0.8 0.5 12.1 to 12.5
1c
High shock. Increased use of AF3 for Biodiesel.
Renderers substitute AF w FF. Shock does not
affect Cat 3 prices so no response from
oleochemicals.
3 1.8 1.4 1.0 4 to 4.8
2bMedium shock. Increased use of AF3 for
Biodiesel. Shock does not affect Cat 3 prices
so no response from oleochemicals.4.9 0.0 0.0 0.0 4.9
2c
Medium shock. Increased use of AF3 for
Biodiesel. Renderers substitute AF w FF.
Shock does not affect Cat 3 prices so no
response from oleochemicals.
1.9 2.3 1.7 1.3 2.1 to 3.2
2f
Medium shock. Increased use of AF3 for
Biodiesel. Renderers substitute AF w FF.
Shock does affect Cat 3 prices so response
from oleochemicals.
2.8 2.1 1.6 1.2 4 to 5
3b
Low shock. No ncreased use of AF3 for
Biodiesel. Renderers substitute AF w FF.
Shock does not affect Cat 3 prices so no
response from oleochemicals.
1.5 3.2 2.4 1.8 3.2 to 4.7
3d
Low shock. Moderate increased use of AF3 for
Biodiesel. Renderers substitute AF w FF.
Shock does affect Cat 3 prices so response
from oleochemicals.
1.9 2.5 1.9 1.4 3.3 to 4.5
3eLow shock. Increased use of AF3 for Biodiesel.
Shock does not affect Cat 3 prices so no
response from oleochemicals.3.7 0.0 0.0 0.0 3.7
Indirect GHG emissions (tCO2eq/t cat 1&2 af)
Indirect emissions from rendered animal fats used for biodiesel 19
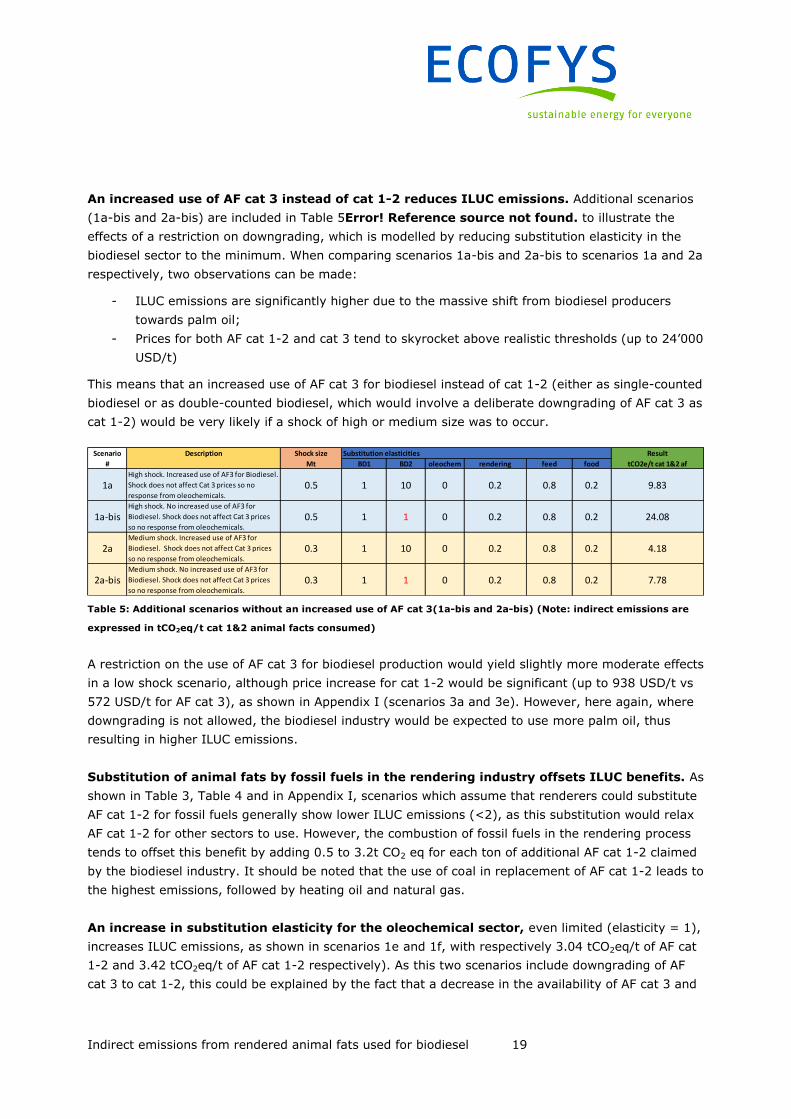
An increased use of AF cat 3 instead of cat 1-2 reduces ILUC emissions. Additional scenarios
(1a-bis and 2a-bis) are included in Table 5Error! Reference source not found. to illustrate the
effects of a restriction on downgrading, which is modelled by reducing substitution elasticity in the
biodiesel sector to the minimum. When comparing scenarios 1a-bis and 2a-bis to scenarios 1a and 2a
respectively, two observations can be made:
- ILUC emissions are significantly higher due to the massive shift from biodiesel producers
towards palm oil;
- Prices for both AF cat 1-2 and cat 3 tend to skyrocket above realistic thresholds (up to 24’000
USD/t)
This means that an increased use of AF cat 3 for biodiesel instead of cat 1-2 (either as single-counted
biodiesel or as double-counted biodiesel, which would involve a deliberate downgrading of AF cat 3 as
cat 1-2) would be very likely if a shock of high or medium size was to occur.
Table 5: Additional scenarios without an increased use of AF cat 3(1a-bis and 2a-bis) (Note: indirect emissions are
expressed in tCO2eq/t cat 1&2 animal facts consumed)
A restriction on the use of AF cat 3 for biodiesel production would yield slightly more moderate effects
in a low shock scenario, although price increase for cat 1-2 would be significant (up to 938 USD/t vs
572 USD/t for AF cat 3), as shown in Appendix I (scenarios 3a and 3e). However, here again, where
downgrading is not allowed, the biodiesel industry would be expected to use more palm oil, thus
resulting in higher ILUC emissions.
Substitution of animal fats by fossil fuels in the rendering industry offsets ILUC benefits. As
shown in Table 3, Table 4 and in Appendix I, scenarios which assume that renderers could substitute
AF cat 1-2 for fossil fuels generally show lower ILUC emissions (<2), as this substitution would relax
AF cat 1-2 for other sectors to use. However, the combustion of fossil fuels in the rendering process
tends to offset this benefit by adding 0.5 to 3.2t CO2 eq for each ton of additional AF cat 1-2 claimed
by the biodiesel industry. It should be noted that the use of coal in replacement of AF cat 1-2 leads to
the highest emissions, followed by heating oil and natural gas.
An increase in substitution elasticity for the oleochemical sector, even limited (elasticity = 1),
increases ILUC emissions, as shown in scenarios 1e and 1f, with respectively 3.04 tCO2eq/t of AF cat
1-2 and 3.42 tCO2eq/t of AF cat 1-2 respectively). As this two scenarios include downgrading of AF
cat 3 to cat 1-2, this could be explained by the fact that a decrease in the availability of AF cat 3 and
Scenario Description Shock size Substitution elasticities Result
# Mt BD1 BD2 oleochem rendering feed food tCO2e/t cat 1&2 af
1aHigh shock. Increased use of AF3 for Biodiesel.
Shock does not affect Cat 3 prices so no
response from oleochemicals.0.5 1 10 0 0.2 0.8 0.2 9.83
1a-bisHigh shock. No increased use of AF3 for
Biodiesel. Shock does not affect Cat 3 prices
so no response from oleochemicals.0.5 1 1 0 0.2 0.8 0.2 24.08
2aMedium shock. Increased use of AF3 for
Biodiesel. Shock does not affect Cat 3 prices
so no response from oleochemicals.0.3 1 10 0 0.2 0.8 0.2 4.18
2a-bisMedium shock. No increased use of AF3 for
Biodiesel. Shock does not affect Cat 3 prices
so no response from oleochemicals.0.3 1 1 0 0.2 0.8 0.2 7.78

Indirect emissions from rendered animal fats used for biodiesel 20
subsequent price increase would push the oleochemical sector could substitute AF cat 3 for palm oil,
which is not permitted in scenario 1f (substitution elasticity = 0).
The possibility to use AF cat 3 for biodiesel and/or the relaxing of animals by renderers
attenuates the impact of the shock size. In scenarios without an increased use of AF cat 3 or
substitution with fossil fuels by renderers, the size of the shock amplifies ILUC emission. For instance,
in scenarios 1a-bis, 2a-bis (Table 5) and 3a (Appendix), ILUC emissions are respectively 24.1, 7.8
and 5.2 tCO2eq/t of AF cat 1-2. When comparing scenarios 1c (High shock), 2c (Medium shock) and
3d (Low shock), which allow for some cat 3 into biodiesel production and substitution by renderers,
the iLUC emissions are respectively 2.98, 1.87 and 1.95 tCO2eq/t of AF cat 1-2. Note that the reason
for the slightly lower emissions in scenario 2c, compared to 3d is that the only a moderate increase in
use of cat 3 AF is modelled in 3d.
Indirect emissions from rendered animal fats used for biodiesel 21
4 Conclusions and recommendations
This study quantifies indirect emissions from both indirect land use change and fossil fuel
displacement from the use of rendered animal fats for biodiesel in the EU. For the modelling, an ILUC
evaluation tool is used that has been developed by IIASA for the European Commission. Results from
the evaluation tool need to be considered carefully in light of the simplified approach used and
estimates based on data collection. Consequently, this study should not be used to extract single-
point data, but to understand how the different economic parameters considered may influence
indirect GHG emissions of an increased use of animal fats by the biodiesel industry, all other things
equal. Importantly, this study illustrates that an increased use of animal fats by the biodiesel industry
would lead to indirect effects through ILUC and fossil fuel combustion.
The lowest value obtained in Table 4 (2.1 tCO2eq/t of AF cat 1-2 corresponds to 53.3gCO2eq/MJ of AF
cat 1-2, which is comparable to the mean ILUC Factor used for oil crops in the recent ILUC directive9.
Interestingly, an increased used of AF cat 3 instead of cat 1-2, either as single-counted biodiesel or
through a deliberate downgrading of cat 1-2 as cat 3 to benefit from double counting, would reduce
ILUC emissions and price effects, all other things equal. An increased use of AF cat 3 and/or the
substitution of animal fats by fossil fuels in rendering facilities also results in attenuating the size of
the shock.
The simplification of assumptions in this study might constitute sources of uncertainty however.
Future studies could therefore focus on improving certain elements, such as:
- The different elasticities explored in the evaluation tool should be further refined and cross-
checked with econometric data;
- The likelihood of renderers to use fossil fuels in replacement of animal fats should be further
investigated;
- Different assumptions regarding substitution by vegetal oil should be explored, as Task 4a
built upon the general assumption that an increased demand for vegetal oil would
systematically be fulfilled by palm oil;
- Possible distinction between different palm oil grade (crude palm oil vs refined and bleached
oil; fruit oil vs kernel oil; palm oil vs palm fatty acid distillates), which could impact price,
supply and demand projections;
- Expand geographic scope beyond EU and explore the possibility of animal fat imports, which
could change in the future, thus adding to the existing supply and reducing ILUC effects;
9 Annex V http://eur-lex.europa.eu/legal-content/EN/TXT/PDF/?uri=CELEX:32015L1513&from=EN

Indirect emissions from rendered animal fats used for biodiesel 22
- Evaluate potential improvements in the recovery of waste in the meat industry, which might
as well increase the supply of AF and reduce ILUC effects through an increased production of
palm;
- Understand to which extend double-counting might incentivise deliberate downgrading of AF
cat 3 into cat 1-2.
Indirect emissions from rendered animal fats used for biodiesel 23
5 References
Ecofys (2014) Status of the tallow (animal fat) market – 2013 Update. Sacha Alberici, Gemma Toop,
Ulf Weddige. By order of UK Department of Transport (DfT).
EFPRA (2015) Statistical overview of the animal by-products industry in the EU in 2014. Presentation
by Dirk Dobbelaere at the EFPRA Congress in Cracow on 5/06/2015. Available at:
http://efpracracow2015.com/upload/conf/DD%20cracow%202015.pdf
IIASA (2016) Evaluation Tool user guide. Prepared for the European Commission as part of Task 3 of
contract ENER/C1/2013-412
Indirect emissions from rendered animal fats used for biodiesel 24
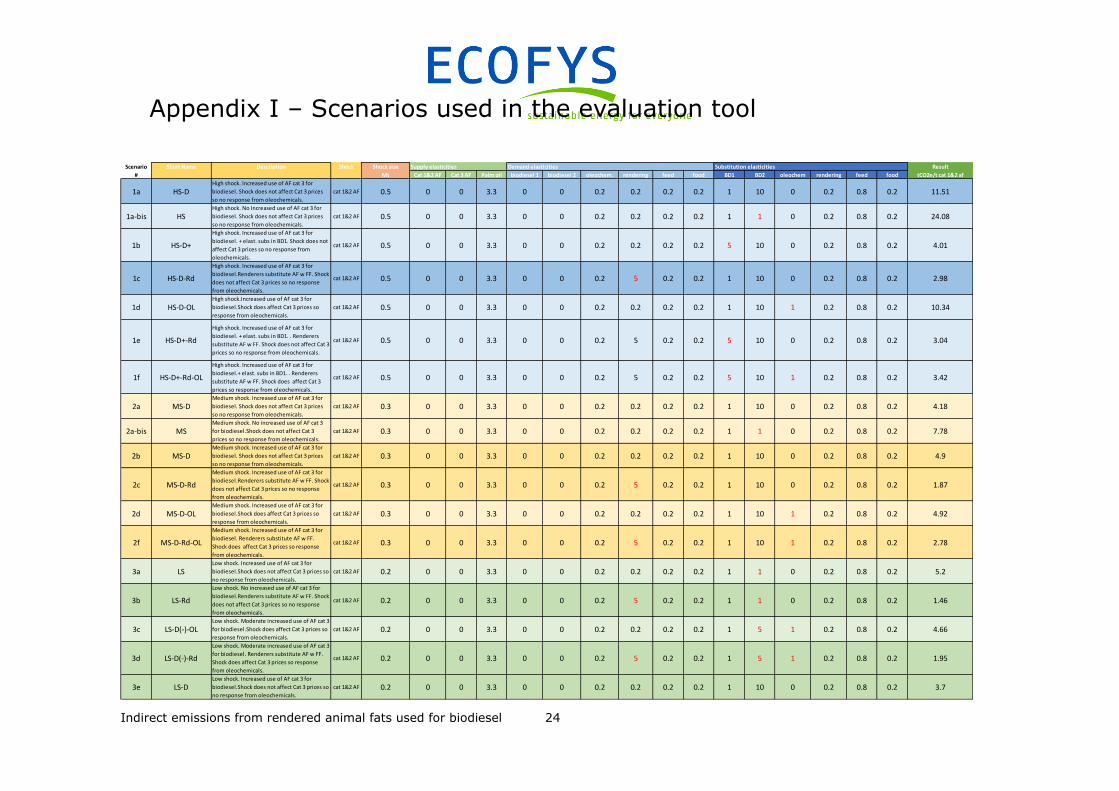
Appendix I – Scenarios used in the evaluation tool
Scenario Short Name Description Shock Shock size Supply elasticities Demand elasticities Substitution elasticities Result
# Mt Cat 1&2 AF Cat 3 AF Palm oil biodiesel 1 biodiesel 2 oleochem. rendering feed food BD1 BD2 oleochem rendering feed food tCO2e/t cat 1&2 af
1a HS-DHigh shock. Increased use of AF cat 3 for
biodiesel. Shock does not affect Cat 3 prices
so no response from oleochemicals.
cat 1&2 AF 0.5 0 0 3.3 0 0 0.2 0.2 0.2 0.2 1 10 0 0.2 0.8 0.2 11.51
1a-bis HSHigh shock. No Increased use of AF cat 3 for
biodiesel. Shock does not affect Cat 3 prices
so no response from oleochemicals.
cat 1&2 AF 0.5 0 0 3.3 0 0 0.2 0.2 0.2 0.2 1 1 0 0.2 0.8 0.2 24.08
1b HS-D+
High shock. Increased use of AF cat 3 for
biodiesel. + elast. subs in BD1. Shock does not
affect Cat 3 prices so no response from
oleochemicals.
cat 1&2 AF 0.5 0 0 3.3 0 0 0.2 0.2 0.2 0.2 5 10 0 0.2 0.8 0.2 4.01
1c HS-D-Rd
High shock. Increased use of AF cat 3 for
biodiesel.Renderers substitute AF w FF. Shock
does not affect Cat 3 prices so no response
from oleochemicals.
cat 1&2 AF 0.5 0 0 3.3 0 0 0.2 5 0.2 0.2 1 10 0 0.2 0.8 0.2 2.98
1d HS-D-OLHigh shock.Increased use of AF cat 3 for
biodiesel.Shock does affect Cat 3 prices so
response from oleochemicals.
cat 1&2 AF 0.5 0 0 3.3 0 0 0.2 0.2 0.2 0.2 1 10 1 0.2 0.8 0.2 10.34
1e HS-D+-Rd
High shock. Increased use of AF cat 3 for
biodiesel. + elast. subs in BD1. . Renderers
substitute AF w FF. Shock does not affect Cat 3
prices so no response from oleochemicals.
cat 1&2 AF 0.5 0 0 3.3 0 0 0.2 5 0.2 0.2 5 10 0 0.2 0.8 0.2 3.04
1f HS-D+-Rd-OL
High shock. Increased use of AF cat 3 for
biodiesel.+ elast. subs in BD1. . Renderers
substitute AF w FF. Shock does affect Cat 3
prices so response from oleochemicals.
cat 1&2 AF 0.5 0 0 3.3 0 0 0.2 5 0.2 0.2 5 10 1 0.2 0.8 0.2 3.42
2a MS-DMedium shock. Increased use of AF cat 3 for
biodiesel. Shock does not affect Cat 3 prices
so no response from oleochemicals.
cat 1&2 AF 0.3 0 0 3.3 0 0 0.2 0.2 0.2 0.2 1 10 0 0.2 0.8 0.2 4.18
2a-bis MSMedium shock. No increased use of AF cat 3
for biodiesel.Shock does not affect Cat 3
prices so no response from oleochemicals.
cat 1&2 AF 0.3 0 0 3.3 0 0 0.2 0.2 0.2 0.2 1 1 0 0.2 0.8 0.2 7.78
2b MS-DMedium shock. Increased use of AF cat 3 for
biodiesel. Shock does not affect Cat 3 prices
so no response from oleochemicals.
cat 1&2 AF 0.3 0 0 3.3 0 0 0.2 0.2 0.2 0.2 1 10 0 0.2 0.8 0.2 4.9
2c MS-D-Rd
Medium shock. Increased use of AF cat 3 for
biodiesel.Renderers substitute AF w FF. Shock
does not affect Cat 3 prices so no response
from oleochemicals.
cat 1&2 AF 0.3 0 0 3.3 0 0 0.2 5 0.2 0.2 1 10 0 0.2 0.8 0.2 1.87
2d MS-D-OLMedium shock. Increased use of AF cat 3 for
biodiesel.Shock does affect Cat 3 prices so
response from oleochemicals.
cat 1&2 AF 0.3 0 0 3.3 0 0 0.2 0.2 0.2 0.2 1 10 1 0.2 0.8 0.2 4.92
2f MS-D-Rd-OL
Medium shock. Increased use of AF cat 3 for
biodiesel. Renderers substitute AF w FF.
Shock does affect Cat 3 prices so response
from oleochemicals.
cat 1&2 AF 0.3 0 0 3.3 0 0 0.2 5 0.2 0.2 1 10 1 0.2 0.8 0.2 2.78
3a LSLow shock. Increased use of AF cat 3 for
biodiesel.Shock does not affect Cat 3 prices so
no response from oleochemicals.
cat 1&2 AF 0.2 0 0 3.3 0 0 0.2 0.2 0.2 0.2 1 1 0 0.2 0.8 0.2 5.2
3b LS-Rd
Low shock. No increased use of AF cat 3 for
biodiesel.Renderers substitute AF w FF. Shock
does not affect Cat 3 prices so no response
from oleochemicals.
cat 1&2 AF 0.2 0 0 3.3 0 0 0.2 5 0.2 0.2 1 1 0 0.2 0.8 0.2 1.46
3c LS-D(-)-OLLow shock. Moderate increased use of AF cat 3
for biodiesel.Shock does affect Cat 3 prices so
response from oleochemicals.
cat 1&2 AF 0.2 0 0 3.3 0 0 0.2 0.2 0.2 0.2 1 5 1 0.2 0.8 0.2 4.66
3d LS-D(-)-Rd
Low shock. Moderate increased use of AF cat 3
for biodiesel. Renderers substitute AF w FF.
Shock does affect Cat 3 prices so response
from oleochemicals.
cat 1&2 AF 0.2 0 0 3.3 0 0 0.2 5 0.2 0.2 1 5 1 0.2 0.8 0.2 1.95
3e LS-DLow shock. Increased use of AF cat 3 for
biodiesel.Shock does not affect Cat 3 prices so
no response from oleochemicals.
cat 1&2 AF 0.2 0 0 3.3 0 0 0.2 0.2 0.2 0.2 1 10 0 0.2 0.8 0.2 3.7