Dale Reed Lecturer, Computer Science University of Illinois at Chicago (UIC) [email protected].

Can Self-Explanation Improve Metacomprehension Accuracy for Illustrated Text?
BY
ALLISON J. JAEGER
B.A., University of Illinois at Chicago, 2007
THESIS
Submitted as partial fulfillment of the requirements
for the degree of Master of Arts in Psychology
in the Graduate College of the
University of Illinois at Chicago, 2012
Chicago, Illinois
Defense Committee:
Jennifer Wiley, Chair and Advisor
Thomas Griffin
Susan Goldman
Mike Stieff, Chemistry and Learning Sciences

ii
I dedicate my thesis to my mother, Phyllis Jaeger. You have been my role model and inspiration
throughout all of my endeavors, I am the woman I am today because of you. Additional thanks
and dedication to Christopher Berena, whose endless support and confidence in my abilities kept
me going every day.

iii
AKNOWLEDGEMENTS
I would like to thank my advisor, Jennifer Wiley, for the support and advice she provided
as I planned and carried out my research. I am forever grateful for your mentorship. Thank you
to the members of my thesis committee, Thomas Griffin, Susan Goldman, and Mike Stieff, for
your suggestions and ideas. I would also like to thank the other members of the Wiley Lab and
my officemates for their feedback and support. Finally, this data could never have been collected
and analyzed without the help of my research assistants. Samantha Hicks, Rick Leonard, and
Nicole Rivera thank you for all of your hard work, you were amazing.
AJJ

iv
TABLE OF CONTENTS
CHAPTER PAGE
I. INTRODUCTION………………………………………………………………….. 1
A. What is monitoring accuracy? ……………………………………………… 1
B. A basic model of metacomprehension accuracy……………………………. 3
C. How Could Illustrations Affect Metacomprehension………………………. 5
D. Aims for current study……………………………………………………… 8
II. METHOD………………………………………………………………………….... 9
A. Participants………………………………………………………………...... 9
B. Design………………………………………………………………………. 10
C. Materials…………………………………………………………………….. 10
1. Texts………………………………………………………………… 10
2. Images………………………………………………………………. 10
3. Judgments…………………………………………………………… 11
4. Tests…………………………………………………………………. 11
5. Questionnaire………………………………………………………... 12
6. Spatial Ability Test………………………………………………….. 13
D. Procedure……………………………………………………………………. 13
III. RESULTS…………………………………………………………………………... 15
A. Metacognitive Judgments…………………………………………………… 15
B. Test Performance…………………………………………………………… 17
C. Monitoring Accuracy……………………………………………………….. 19
D. Self-reports of Cue Use…………………………………………………….. 21
E. Cue Use as a Predictor of Metacomprehension Accuracy…………………. 23
F. Cue Use Profile Frequency………………………………………………… 24
IV. DISCUSSION……………………………………………………………………... 26
REFERENCES…………………………………………………………………….. 30
APPENDICES…………………………………………………………………….. 34
Appendix A………………………………………………………………... 34
Appendix B………………………………………………………………... 39
Appendix C………………………………………………………………... 42
Appendix D………………………………………………………………... 43
Appendix E………………………………………………………………... 47
Appendix F………………………………………………………………... 48
INSTITUTIONAL REVIEW BOARD APPROVAL FORM……………………. 51
VITA……………………………………………………………………………… 54

v
LIST OF TABLES
TABLE PAGE
I. Demographic Measures and Judgments by Image Condition and
Instruction Type……………………………………………………………. 16
II. Mean Memory and Inference Test Performance for Each Test Topic…….. 17
III. Judgment Profiles as a function of Image Condition and Instruction
Type………………………………………………………………………... 25
IV. Correlation Matrix for Demographics, Test Performance, and
Monitoring Accuracy……………………………………………………... 50

vi
LIST OF FIGURES
FIGURE PAGE
1. Mean inference and memory test performance as a function of
image condition and instruction type………………………………………. 18
2. Mean metamemory and metacomprehension accuracy as a function
of image condition and instruction type…………………………………… 20
3. Mean metacomprehension accuracy as a function of cue use……………... 24

vii
SUMMARY
Previous work has suggested that adding illustrations to expository science texts can
decrease metacomprehension accuracy. Not only are students unable to take advantage of the
illustrations for informing their self-assessments, it seems they can actually be hurt by them. One
hypothesis to account for these findings is that illustrations increase the salience of cues not
based in representations of the text. In turn, this may influence readers to base their judgments on
these cues rather than more valid cues based in the quality of their situation models. To test this
hypothesis the current study investigated whether providing students with a self-explanation
instruction would help to improve their metacomprehension accuracy for illustrated text. Self-
explanation instructions were used because they have been shown to assist in mental model
construction and inference generation, which also leads to increased access to cues based in
readers’ situation models. Benefits of self-explanation were seen in conditions where participants
read texts paired with conceptual images, but these same benefits were not found when texts
were paired with decorative images or no images. An analysis of the cues participants reported
using to make their metacognitive judgments indicated that participants were not using cues
based in their situation model representations of the text in the no-image and decorative images
conditions. Instead, participants in these conditions reported using cues such as their surface
memory for the text, characteristics of the text, or information about the reader such as their
interest or prior knowledge in the topics to make their judgments rather than their comprehension
of the text. Future studies will investigate if further benefits in metacomprehension accuracy can
be found when students are instructed how best to use the images during self-explanation.

1
I. INTRODUCTION
Being able to accurately monitor one’s own learning plays a critical role in effective
learning and studying behaviors (Thiede, Anderson, & Therriault, 2003). Specifically, it is
important that students are able to differentiate the material they have learned well from the
material they have not learned well. Many science topics are challenging, and for some domains
like geology, biology and chemistry, a popular way of supporting understanding is through
providing visualizations such as illustrations, photos, videos or animations (Balluerka, 1995;
Mayer, 1994; Mayer & Gallini, 1990). Although there is a fairly large amount of research
looking at how and when providing visualizations may affect learning (Butcher, 2006; Hegarty
& Just, 1993; Moreno & Mayer, 1999), much less is known about how the presence of
visualizations may affect students’ judgements of understanding, or their comprehension
monitoring accuracy.
What is Monitoring Accuracy?
For the purpose of this research, comprehension monitoring accuracy or
metacomprehension accuracy refers to the ability to predict how well one will do on a set of
comprehension tests after reading a set of texts. Several measures of metacomprehension
compare metacognitive judgments with actual performance, but each one does so in a slightly
different manner. These measures include absolute accuracy, confidence bias, and relative
accuracy (Maki, 1998). Absolute accuracy is computed as the mean absolute deviation between
judged and actual performance. This measure is sometimes referred to as calibration because it
gives an idea of how far off a person’s judgments are from actual performance. Confidence bias
is a similar measure but actually concerns the direction of people’s misjudgments and is
sometimes referred to as over-/under confidence. This measure is computed as the signed

2
difference between mean judgments and mean performance. Finally, relative accuracy refers to a
participant’s accuracy in predicting performance on one text relative to other texts (Glenberg &
Epstein, 1985; Maki & Berry, 1984). As recommended by Nelson (1984), relative monitoring
accuracy is computed as an intra-individual correlation between readers’ judgments of learning
for each text relative to the other texts, and their actual performance on each test relative to other
tests. Correlations can range from -1 to +1, with correlations near 0 or below representing chance
to poor accuracy. Correlations near +1 would indicate very good discrimination between texts
one has understood well from those one has not.
While all three measures of metacomprehension accuracy offers insights into the
differences between judged and actual performance, absolute accuracy and confidence bias can
be influenced by factors that do not affect relative accuracy measures. Specifically, absolute
accuracy and confidence bias are dependent upon mean performance levels. This can be
problematic because it can in turn allow for non-metacognitive factors to influence the accuracy
scores obtained, for example by things such as text or test difficulty and amount of prior
knowledge. Because relative accuracy is less affected by non-metacognitive factors, it is this
measure that is most commonly used in studies of metacomprehension accuracy and is also the
measure that will be employed in the current study.
Even though relative accuracy is less affected by non-metacognitive factors, typical intra-
individual correlations between peoples’ predictive judgments of learning from text and their
actual test performance are generally only around .27. Maki (1998) reported this correlation
between comprehension judgments and test performance across 25 studies from her own lab.
Research from Dunlosky’s laboratory noted the same mean accuracy when averaged across 36
different conditions (Dunlosky & Lipko, 2007). In a recent review, Thiede, Griffin, Wiley and

3
Redford (2009) found the same figure for average correlations across all studies in the literature.
Yet, despite how poor monitoring from text tends to be, accurate monitoring matters because it is
what allows students to differentiate what is necessary to restudy, which is in turn critical for
effective self-regulated learning (Thiede, Anderson, & Therriault, 2003).
A Basic Model of Metacomprehension Accuracy
As mentioned earlier, metacomprehension accuracy is determined in part by the
judgments that are made by a reader. Koriat (1997) proposed the cue-utilization account to
explain the accuracy of judgments of learning as a function of the cues that are used as the basis
for judgments. This account posits that people have a variety of cues that they can use to predict
their performance, and that the accuracy of these predictions hinges upon whether the chosen
cues are consistent with the factors that will affect their performance on the test. Although the
cue-utilization account was originally formulated to explain predictions of performance in
paired-associate learning paradigms, it is still useful in understanding the mechanisms that may
be underlying metacomprehension accuracy.
When asked to make judgments of their comprehension of a text, readers have access to
many cues that could affect how these judgments are made. Some cues, referred to as heuristic
cues, are available to the reader before, during, or after the text has been read, and are not
directly related to the process of creating a mental model of the text. Some examples of heuristic
cues include topic interest, prior knowledge, fluency and mood. Other cues, referred to as
representation-based, only become available during or after reading a text and develop from the
process of attempting to create a mental model or situation model level representation of that
text. Examples of this type of cue include how able the reader is to summarize or explain the
text, and how accessible or coherent the representation of the text is (Griffin, Jee, & Wiley,

4
2009). While surface memory for the text can also serve as a representation-based cue,
comprehension requires that the reader create a mental representation of the ideas from the text
(Kintsch, 1998), therefore situation model representation-based cues tend to be more accurate
predictors of performance on comprehension tests. However, readers more commonly tend to
rely on heuristic cues, perhaps because they are more salient than representation-based cues, and
require less effort (Griffin, Jee, & Wiley, 2009), although they generally result in poorer
metacomprehension accuracy. Specifically, research conducted by Thiede, Griffin, Wiley, and
Anderson (2010) found that students tended to report using five distinct cues to make their
judgments; their comprehension of the text, their memory for the text, their prior knowledge,
their interest, or surface features of the text. Results from their study indicated that, while the use
of comprehension cues was reported least often, those students who did report basing their
judgments on comprehension cues had the most accurate metacomprehension.
Despite peoples’ tendency to make inaccurate judgments about their comprehension of a
text, several studies have demonstrated that some specific contexts are more likely to invoke the
use of situation model representation-based cues, which in turn have shown large improvements
in metacomprehension accuracy. This line of research is aimed at investigating manipulations
that make cues based in the situation model representation of the text more accessible to readers.
For example, readers have been shown to be more accurate when they generate their judgments
following a delay between reading and judging. The idea behind this phenomenon is that as time
passes, surface cues decay and become less accessible, forcing the readers to rely on situation
model cues (Thiede, Dunlosky, Wiley & Griffin, 2005). Additionally, having readers create
concept maps while reading has helped to increase accuracy, also by making situation model
cues more accessible than under normal circumstances (Redford, Thiede, Wiley & Griffin,

5
accepted). Another study conducted by Thiede, Wiley and Griffin (2011) demonstrated that
metacomprehension accuracy could be increased if participants knew what kind of test to expect.
Specifically, students who expected inference tests instead of memory tests generated more
accurate predictions for inference tests. Thiede et al. (2011) argue that this increased accuracy is
due to the fact that the test expectancy manipulation is helpful in making the purpose for reading
more clear and therefore, once again, directs students to more helpful cues.
Another technique that has been shown to improve metacomprehension accuracy is self-
explanation (Griffin, Wiley & Thiede, 2008). The term self-explanation refers to the process of
generating explanations to one’s self while reading an expository text. It is similar to the concept
of elaboration, but with the main goal being to make sense of what one is learning rather than
simply memorizing (Chi, 2000). By prompting students to make connections and note relations
across sentences, to consider the meaning and relevance of each sentence, and to think about the
overall purpose or theme of the text, students are more likely to construct a mental model and to
make inferences to fill in gaps in the text which leads to better learning from text (Chi, De
Leeuw, Chiu, & LaVancher, 1994). In addition, because self-explanation gets readers to focus on
their mental models, it also increases their access to cues based in their situation model
representations of the text. Therefore, self-explaining can lead to readers making more accurate
judgments about their level of understanding (Griffin, Wiley & Thiede, 2008).
How Could Illustrations Affect Metacomprehension?
Although research has supported the idea that illustrations can improve the
comprehension of expository text under certain circumstances, much less research has explored
how they may affect metacomprehension accuracy. From a theoretical perspective one could
argue that including illustrations or images alongside expository text could improve
6
metacomprehension accuracy. Ainsworth and Loizou (2003) conducted a study in which they
had participants learn about the circulatory system either through a diagram or from text alone
while self-explaining. The results of this study showed that students in the diagram condition
performed significantly better on their post-tests than students in the text condition. More
importantly, they found that students in the diagram condition made more self-explanation
statements than students in the text condition, suggesting that illustrations were helping the
learners to create more coherent mental models. This increase in self-explanation statements and
more coherent situation models could increase the salience of more appropriate representation-
based cues. Based on this idea, one could hypothesize that adding conceptually-relevant
illustrations to expository text could lead to more accurate metacomprehension judgments.
Alternatively, one could also hypothesize that including illustrations alongside expository
text could harm metacomprehension accuracy. A study conducted by Serra and Dunlosky (2010)
investigated whether people believed that learning from multimedia was more effective than
learning from text alone, and whether this perception would be reflected in their
metacomprehension judgments. To test this hypothesis they had participants first complete a
questionnaire that assessed their beliefs about multimedia learning and its effectiveness.
Participants also read a text, either with diagrams of how lightning forms, with photographs of
lightning strikes, or without images at all, and made judgments after each paragraph which asked
them to estimate the likelihood that they would be able to answer questions about that paragraph.
After reading, they completed a comprehension test that was the same across all conditions.
Results from the multimedia beliefs questionnaire revealed that all participants strongly
endorsed the belief that multimedia presentations produce better learning than text alone.
Furthermore they found that people in the text only condition tended to make lower

7
comprehension judgments than people in either image condition, which were both high.
Although judgments did not differ for both image conditions, test performance did. Test
performance was only better in the diagrams condition. The photos did not improve test
performance over the plain text condition. These results suggest that peoples’ beliefs about
multimedia learning can affect their metacomprehension judgments. The higher judgments for
the two image conditions as compared to the plain text condition suggest that readers’ judgments
are based at least in part on their beliefs about the superior learning effects of multimedia.
Additionally, the fact that judgments did not differ between the two image conditions, but
learning did, further supports the idea that people rely on some type of multimedia heuristic to
make their judgments rather than the actual experience of learning from the text. The
indiscriminate use of this type of heuristic could reduce the absolute accuracy of people’s
judgments of text learning in multimedia situations.
Although the use of a heuristic would not necessarily affect relative accuracy, the
presence of illustrations in expository text could still disrupt monitoring processes. The presence
of illustrations could decrease relative accuracy because they may provide readers with more
cues, many of which would not be based in their representation of the text. For example,
different illustrations could cause readers to enjoy different texts more (Harp & Mayer, 1997) or
perhaps make certain texts more distinct than others (Roediger & Guynn, 1996), while not
increasing understanding of the main concepts or increasing the salience of more appropriate
representation-based cues.
Results from an unpublished pilot study (Jaeger & Wiley, 2010) support the hypothesis
that the presence of illustrations may actually harm metacomprehension accuracy. In this study
students read expository texts that were either paired with no image, a conceptual image, or a

8
decorative image and were asked to make metacomprehension judgments following each text.
Results from this study indicated that students’ metacomprehension accuracy was differentially
affected across the three image conditions. There was no difference in students’
metacomprehension accuracy between the no-image and conceptual image conditions. However,
students in the decorative condition had less accurate metacomprehension than students in the
no-image condition. Thus, in this study, students were unable to take advantage of the
illustrations in the conceptual image condition, and were actually harmed by the presence of
images in the decorative condition.
Aims for the Current Study
In an attempt to increase monitoring accuracy for illustrated text we were interested in
extending and combining some aspects of the work of Ainsworth and Loizou (2003) and Griffin,
Wiley and Thiede (2008). Specifically, the current study sought to examine students’ test
performance and monitoring accuracy as a function of the type of image they saw while reading
an expository science text and whether or not they were instructed to self-explain while reading.
Based on the previously mentioned research demonstrating increased metacognitive
accuracy for students who self-explain during reading, it was predicted that self-explaining
would lead to more accurate monitoring for students in all conditions because it would make
representation-based cues more salient. Results from the pilot experiment showed that adding
decorative images to expository text resulted in less accurate monitoring judgments, but adding a
self-explanation strategy could reverse this result. Further, by adding a self-explanation
instruction, students’ metacomprehension accuracy in the conceptual image condition could
improve beyond that of participants in the no image condition because it has been shown that
diagrams facilitate self-explaining more so than text alone.

9
At the end of this study, students will also be asked to self-report the cues they used as a
basis for their judgments. Based on Thiede et al. (2010), it is also predicted that students who
report using comprehension as a basis for their judgments will have the most accurate
metacomprehension because these cues are consistent with the type of information needed to
perform well on inference tests. It is further predicted that because conceptual images provide an
additional route to developing a situation model representation of the processes being described
in the text, students in this condition will have more accurate metacomprehension than students
in the no image or decorative image conditions. Finally, it is also predicted that because self-
explanation increases the salience of situation model representation-based cues, all students
instructed to self-explain will have increased metacomprehension accuracy as compared to those
not instructed to self-explain. However based on Ainsworth and Loizou (2003), it is predicted
that this increase will be greatest in the conceptual image condition because diagrams have been
shown to facilitate the creation of more self-explanation statements.
II. METHOD
Participants
As partial fulfillment of a course requirement, 163 undergraduate college students (64
male) were recruited from the Introductory Psychology Subject Pool at the University of Illinois
at Chicago. Any participants who had indeterminate judgments (N=10), failed to comply with
task instructions (N=24), or who were not proficient English speakers (N=6) were not retained
for the final analyses. Three participants were also removed as outliers for having completed a
very high number of college science courses (i.e. more than 10). When participants have no
variance in the judgments they make across the texts it is not possible to compute their relative
accuracy scores, and therefore their data could not be used. Participants were classified as not

10
following task instructions if the experimenter reported them as problematic during the
experimental session (i.e. talking, cell phone use, sleeping) or if the log files indicated that they
did not read the task instructions or target texts. Participants were considered as not proficient
in English if they were enrolled in a remedial English course at the time of the experiment.
All analyses are performed on the final sample size of N = 120 (48 males). More detailed
demographic information of the analyzed sample can be found Table 1.
Design
The design was a 3 (Image condition: no image, conceptual image, decorative image) x 2
(Test type: inference, memory) x 2 (Instruction condition: self-explain, no self-explain) mixed
design. Image condition and instruction condition were fully crossed, between-subjects variables.
There were a total of 20 participants randomly assigned to each of these 6 conditions. Test type
was a within-subjects variable; all students completed both types of tests.
Materials
Texts. Participants read five explanatory texts that each described complex causal
phenomena from the natural sciences (i.e., Biological evolution, Volcano formation and eruption,
Ice ages, Cheese making, and Lightning formation); see Appendix A for an example. The texts
were presented in size 12 font, varied in length from 800-1000 words and had Flesch-Kincaid
grade levels of 11-12 and Flesch reading ease scores in the Difficult range of 31-49. A sixth text
on the scientific method served as a practice text. Participants read the texts on IBM-compatible
PC’s in Mozilla Firefox 6.0. All browser toolbars were unavailable to the participants during the
experiment.
Images. In the decorative and conceptual image conditions, each text was paired with
only one image. Conceptual images depicted a process involved in each scientific phenomenon

11
described by the text. Decorative images were aesthetically pleasing and related to topic of the
text, but they did not offer any information about any process underlying the phenomenon
described by the text. A set of example images can be found in Appendix A.
Judgments. After reading each text, participants were instructed to make predictive
judgments. The judgment specifically asked them, “How many questions out of 5 will you
answer correctly on a test?” After responding to this question, they moved on to read the next
text. Each participant made one judgment for each of the five texts they read.
Tests. For each text, two five-item, multiple-choice tests were created. One test
consisted of memory-based items, which referred to ideas that could be taken directly from the
text. An example of a memory-based item is, “How many of the world’s volcanoes are located
on the perimeter of the Pacific Ocean?” because the definition is found verbatim in this sentence
from the text, “More than half of the world’s active volcanoes above sea level encircle the
Pacific Ocean to form the circum-Pacific ‘Ring of Fire’.” The range of difficulty for the
memory-based items was 11 to 93 percent correct.
The other test consisted of inference-based items, which required the reader to make
connections between different parts of the text to generate the answers. An example of an
inference-based item is, “Where is the least likely place for a volcano to occur?” The answer to
this question is not explicitly stated in a single sentence, but can be inferred based on information
from these two sentences from the text, “Volcanoes are not randomly distributed over the Earth’s
surface. Most are concentrated on the edges of continents, along island chains, or beneath the sea
forming long mountain ranges.” Of the twenty-five inference items, two required the reader to
make an inference from a single sentence in the text, fifteen required the reader to make a
connection across two to three adjacent sentences within a paragraph, three items required an

12
inference across two sentences within the same paragraph that were not adjacent, and five items
required the connection of two sentences from sequential paragraphs presented on the same page.
Correct responses for two of the items were based on negations of statements in the text.
Furthermore, of the twenty-five inference items, twelve were related to spatial information. The
range of difficulty for the inference-based items was 14 to 74 percent correct.
The purpose for including these two types of tests was to be able to assess both students’
surface level representations of the text as well as their situation model representations of the
texts. The memory items tested only the surface level representation because they required
recalling verbatim facts from the text, whereas the inference items relied on readers’ situation
model representations of the texts. A set of memory and inference test items is included in
Appendix A. Test order followed the same order as reading and judgment. Test type was
blocked, and counter-balanced so that some participants received the set of five memory tests
first, and some participants received the set of five inference tests first.
Questionnaire. Each participant completed a paper-and-pencil questionnaire which is
included as Appendix B. This questionnaire asked participants to report their gender, age, year in
school, intended major, the number of college level science courses taken, and the students’
composite, math, and science ACT scores. This questionnaire also assessed what participants’
native language was, and if it was not English, how long they have been fluently speaking
English.
All participants were asked to rate on a 1-7 Likert scale how interesting they felt the texts
were and how hard they tried on the task. Participants in the decorative and conceptual image
conditions were also asked to rate how interesting they felt the images they saw were, how often
they looked at them, and how helpful they were for their understanding of the text.

13
Finally, students in all three conditions received two open-ended questions at the end of
the questionnaire. The first asked students to describe the way in which they read the texts. The
second question asked the students to describe what information they used when trying to decide
if a passage was given a high judgment rating or low judgment rating.
Spatial ability test. Each student completed a computerized version of the paper-folding
test from the Kit of Factor-Referenced Cognitive Tests (Ekstrom, French, Harman, & Derman,
1976). This task was used to assess participants’ spatial ability. This task consists of two parts,
each containing 10 items. Items were presented one at a time and answers had to be selected by
pressing the letter keys that corresponded to the figures. Measures were timed such that
participants had six minutes to complete the two portions of the task, allowing three minutes for
each portion. Participants’ scores were the number of correct responses. An example of this task
can be found in Appendix C.
Procedure
A script of the full procedure can be found in Appendix D. Prior to beginning the
experiment, each participant completed an informed consent form. Participants completed the
main portion of the experiment on the computer. The experimenter instructed each participant to
click a link that allowed him or her to begin the task. This link displayed an introductory
instructions page which stated,
“In this study, you will be reading a series of texts, estimating how many
questions you can get correct on a five item multiple-choice test, and then taking a
test to see how well you actually do. That is, you will read, predict, and test for
each text.”

14
All conditions received the same set of introductory instructions. After reading the
introductory instructions all participants read the practice text, were asked to make a
metacognitive judgment following reading, and then were given a practice inference test with
five multiple choice items. Once participants completed the practice test they saw an additional
instructions page which stated,
“You will now read a set of five texts. The procedure is a little different. For these
texts, you will read all of the texts one after another and predict your performance.
Then you will take the tests for all of the texts.”
After receiving this instruction students assigned to the no self-explain condition went directly
into reading the first target text. However, additional instructions were given to participants
randomly assigned to the self-explanation condition. Taken from Griffin, Wiley, and Thiede
(2008), the self-explanation instruction stated,
“In addition as you read each text, you should try to explain to yourself the
meaning and relevance of each sentence or paragraph to the overall purpose of the
text. Ask yourself questions like:
What new information does this paragraph add?
How does it relate to previous paragraphs?
Does it provide important insights into the major theme of the text?
Does the paragraph raise new questions in your mind?
Try your best to think about these issues and ask yourself these kinds of
questions about each text as you read. As you finish each paragraph, before you
move on to the next paragraph, explain to yourself what that paragraph meant.”
Following these instructions, students in the self-explain condition read the first target text.

15
After reading each text, participants made their predictive judgments. Once all
judgments were made, students completed the two sets of multiple-choice tests. Because all of
the tests were administered in the same order that the texts were read, the time between reading a
text and taking the test on that text was the same across all five topics. After the tests, each
participant completed the questionnaire. Once the participants finished the questionnaire they
completed the paper folding task on the computer. Finally, participants were given a debriefing
sheet, which can be found in Appendix E, and thanked for their participation. The entire session
took approximately 90 minutes to complete.
III. RESULTS
The current study examined whether the type of image participants were exposed to (no
image, conceptual, decorative) while reading expository science texts and the type of instruction
they received (self-explain, no self-explain) influenced the accuracy of their comprehension
judgments. To determine how these variables affected metacomprehension accuracy we
conducted a series of ANOVAs. To follow up significant interactions within these ANOVAs
orthogonal contrasts were conducted.
Metacognitive Judgments
The primary focus of this investigation is monitoring accuracy; however, as monitoring
accuracy is the relationship between metacognitive judgments and test performance, we first
report data on these variables.
For each participant, we computed the mean metacognitive judgment across the five
critical texts. The mean of the means was computed across participants in each group. As shown
in Table I, a 3 (Image Condition: no image, decorative, conceptual) x 2 (Instruction Type: self-
explain, no self-explain) analysis of variance (ANOVA) indicated that the mean metacognitive

16
judgments did not differ across image conditions or instruction conditions and there was no
interaction, Fs < 1. Importantly, similar variance in judgments was seen across image and
instruction conditions, Fs < 1.
Table I. Demographic Measures and Judgments by Image Condition and Instruction Type
Note. Gender, Native English, and Undeclared majors are shown as frequencies; the number of students out of 20.
All other items are shown as means with standard deviations in parentheses
No Self-Explain Self-Explain
No Image Conceptual Decorative No Image Conceptual Decorative
Gender (# males) 13 8 9 7 4 10
Native English 12 7 10 11 8 7
Undeclared Majors 7 7 7 3 5 8
Age 18.50 (.83) 18.90 (1.21) 18.55 (.69) 19.15 (2.66) 19.15 (1.76) 18.68 (.75)
Year in School 1.20 (.52) 1.35 (.75) 1.30 (.47) 1.30 (.57) 1.40 (.75) 1.25 (.55)
Number of Science Courses 0.53 (1.02) 1.65 (2.89) 1.21 (1.13) 1.53 (1.68) 1.33 (1.46) 1.26 (1.24)
ACT Composite 23.58 (3.04) 24.40 (3.30) 23.25 (4.10) 24.31 (3.90) 24.35 (3.39) 23.25 (3.73)
ACT Math 23.22 (4.60) 25.42 (5.87) 24.42 (4.75) 25.00 (5.38) 25.05 (4.54) 22.72 (5.37)
ACT Science 22.11 (4.57) 23.39 (4.92) 23.11 (4.20) 23.44 (4.20) 22.89 (4.23) 22.44 (3.96)
Interest in Texts 5.25 (2.10) 4.90 (2.33) 5.00 (2.34) 5.00 (2.11) 4.90 (2.15) 5.90 (2.00)
Effort 5.70 (1.63) 4.85 (2.06) 5.25 (2.02) 5.94 (1.22) 6.20 (1.61) 5.95 (1.54)
Interest in Image --- 5.50 (2.50) 5.50 (2.95) --- 5.35 (2.25) 5.05 (2.72)
Looked at Image --- 5.85 (2.62) 6.40 (2.68) --- 5.30 (2.70) 5.80 (2.98)
Helpfulness of Image --- 5.60 (2.66) 3.25 (2.63) --- 4.85 (2.70) 4.40 (3.50)
Judgments 2.52 (.68) 2.58 (.83) 2.46 (.80) 2.64 (.75) 2.58 (.76) 2.51 (.70)
17
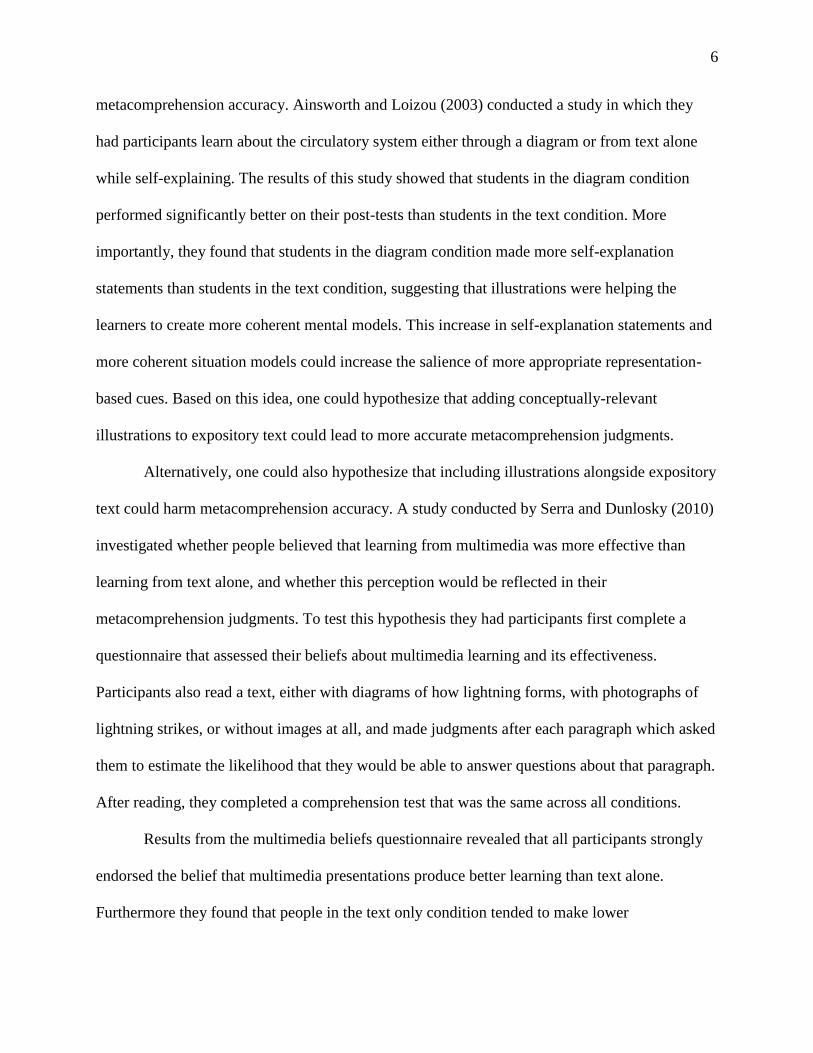
Test Performance
For each text, we computed the mean memory and inference test performance (see Table
II). Average test performance on the memory and inference tests is also presented in the two
panels in Figure 1.
Table II. Mean Memory and Inference Test Performance for Each Test Topic
Note. All items are shown as means with standard deviations in parentheses
Test Topic M SD M SD
Evolution 2.63 1.22 2.42 1.33
Ice Ages 3.08 1.17 2.10 1.02
Cheese Making 2.62 1.29 2.85 1.24
Lightning 3.16 1.18 2.39 1.27
Volcanoes 1.76 1.01 1.79 0.99
Total 2.65 0.81 2.31 0.72
Memory Inference

18
Figure 1. Mean inference and memory test performance as a function of image condition and
instruction type. Error bars represent the standard errors.
The results of a 2 (Test type: memory, inference) X 3 (Image condition: no image,
decorative, conceptual) X 2 (Instruction type: self-explain, no self-explain) repeated-measures
ANOVA showed a main effect for test type such that students performed better on memory tests
than inference tests, F(1, 114) = 27.42, p < .001, η² = .19. There was not a main effect for image
condition, nor was there a main effect for self-explanation, Fs < 1. The three-way interaction
between test type, image condition, and self-explanation was not significant, F < 1. Results also
indicated no two-way interaction between test type and self-explanation or between image
condition and instruction type, Fs < 1. However, the interaction between test type and image
condition was significant, F(2, 114) = 4.60, p < .01, η² = .08.
To follow up this significant two way interaction we conducted orthogonal contrasts
which indicated that there was no significant difference between memory and inference test
performance in the conceptual image condition, F(1, 38) = 1.57, ns, but there were significant
differences between memory and inference test performance in the decorative, F(1, 38) = 5.28, p

19
< .05, η² = .16, and no image conditions, F(1, 38) = 29.23, p < .001, η² = .48. In other words,
when the texts were paired with conceptual images, students’ inference and memory test
performance was equal. But, when the texts were paired with either no image or decorative
images students’ memory test performance was greater than their inference test performance. A
lack of any self-explanation or image condition effect on test performance is important for being
able to more clearly interpret the metacomprehension accuracy results. Specifically, a lack of
differences in test performance across conditions allows metacomprehension accuracy results to
be less attributable to changes in test performance and more attributable to other factors that can
affect accuracy. Finally, participants showed similar variance in their performance on the
inference tests both across instruction condition, F(1, 114) = 1.24, ns, and image condition, F <
1. Similarly, when looking at the variance in participants’ performance on the memory tests,
again there was no difference across instruction condition, F < 1, or image condition, F(2, 114) =
1.82, ns.
Monitoring Accuracy
The main analyses of interest are these on monitoring accuracy. As recommended by
Griffin, Jee, and Wiley (2009), monitoring accuracy was operationalized as the intra-individual
Pearson correlation between a person’s metacognitive judgments and test performance across the
five critical texts. Two Pearson correlations were computed for each participant, one between
judgments and performance on the memory tests (metamemory) and one between judgments and
performance on the inference tests (metacomprehension). A mean Pearson correlation was then
computed across participants in each image condition by each instruction type, for each test
(memory and inference) as shown in the two panels of Figure 2.

20
Figure 2. Mean metamemory and metacomprehension accuracy as a function of image condition
and instruction type. Error bars represent the standard errors.
A 2 (Test type: memory, inference) X 3 (Image condition: no image, conceptual,
seductive) X 2 (Instruction type: self-explain, no self-explain) repeated measures ANOVA
revealed that there was no main effect for test type, F < 1. There was also not a significant main
effect for instruction type, F(1, 114) = 1.55, p = .22. There was however a main effect for image
condition, F(2, 114) = 3.08, p < .05, η² = .05. To follow up the main effect for image condition
we conducted orthogonal contrasts. Results indicated that participants in the conceptual image
condition had more accurate monitoring than participants in the no image condition, F(1, 114) =
5.54, p < .05, however there were no differences between the conceptual image condition and the
decorative image condition, F(1, 114) = 3.42, ns, or between the decorative and no image
conditions, F < 1.

21
The three-way interaction between test type, image condition, and self-explanation was
not significant, F(2, 114) = 2.01, p = .14. Results also indicated no two-way interaction between
test type and image condition or between image condition and instruction type, F’s < 1, however
the interaction between test type and instruction type was marginally significant, F(1, 114) =
3.35, p = .07, η² = .03. As you can see in Figure 2, self-explanation tended to increase
metamemory accuracy more than metacomprehension accuracy.
Even though the three-way interaction between test type, image condition and instruction
type was not significant, to address our a priori hypotheses about metacomprehension accuracy
we examined whether self-explanation led to improvements in any of the three image conditions.
As shown in the right panel of Figure 2, significant differences in metacomprehension accuracy
were found across image conditions when students were instructed to self-explain, F(2, 57) =
3.35, p < .05. Orthogonal contrasts indicated that participants in the conceptual image condition
had more accurate metacomprehension than either participants in the no image condition, F(1,
57) = 4.77, p < .03, or the decorative image condition F(1, 57) = 6.54, p < .01, which did not
differ. When students were not instructed to self-explain no differences were found across the
three image conditions, F < 1. This result suggests that self-explanation specifically improved
metacomprehension only for conceptually illustrated text.
Self-Reports of Cue Use
Because the results we obtained for monitoring accuracy indicated that self-explanation
improved metacomprehension only for conceptually illustrated text and no differences were
found across image conditions when students were not instructed to self-explain, we wanted to
see if differences in reported cue use might help to explain these findings. Prior research has
identified several different categories of cues that readers report using to make their judgments,

22
however this research has indicated that some cues are better for predicting readers’ memory for
a text, whereas others are better for predicting readers’ actual comprehension of a text (Rawson,
Dunlosky & Thiede, 2000; Thiede, Griffin, Wiley & Redford, 2009; Wiley, Griffin & Thiede,
2005). Specifically, when tests of comprehension tap the situation model of a text,
metacomprehension accuracy should increase if readers use cues that also tap into that situation
model when making judgments of their comprehension. Furthermore, if readers are using cues
other than those related to the situation model, their attempts at monitoring may be misdirected,
resulting in poorer metacomprehension accuracy.
Based on research by Thiede et al. (2010), we split participants’ responses to the open-
ended question about the information they used to make their judgments into 4 main categories:
surface, reader, memory, and comprehension. Participants who reported using qualities of the
text such as its length were classified as using surface cues. Those who reported relying on their
interest or prior knowledge were classified as using reader-based cues. Participants who referred
to using their ability to recall the text, but not their comprehension were classified as using
memory-based cues. Those who reported relying on their ability to understand or explain the text
were classified as using comprehension-based cues. Additionally, several participants responded
with uninterpretable responses and were classified as other (N = 7); these participants were
dropped from the following analyses.
This coding scheme used a “best cue” approach where a priori expectations about cue use
were used to guide the coding. Cues based on information from the text should be more
predictive of monitoring accuracy than cues based on information not from the text such as
characteristics of the reader, therefore if participants made any mention of textual information,
even if they also mentioned non-textual information, they were classified by the type of textual

23
information they reported using. Furthermore, comprehension-based cues were expected to be
the most predictive of comprehension monitoring accuracy, memory-based cues were expected
to be the next most predictive because they are based on content from the text, surface cues were
expected to be the third most predictive because they are related to text, but not its’ content, and
reader-based cues were expected to be the least predictive because they are not related to any
attempt at processing the text. The “best cue” coding technique was used because it reflects our
willingness to take any evidence we can find indicating that a participant may have a better
understanding of what it means to comprehend. Specifically, this coding technique was chosen
because it reflects the belief that even if, for example, a participant reports basing their
judgments on both prior knowledge and how well they understood the text, the fact that they are
partially attributing their judgments to their comprehension suggests a fundamental difference in
their understanding as compared to a participant that only reports using prior knowledge. The
interrater reliability was calculated using Krippendorf’s Alpha and revealed that between two
coders who were blind to the condition, reliability was quite high (α = .91). In cases of
disagreement, raters reached consensus on the coding through discussion.
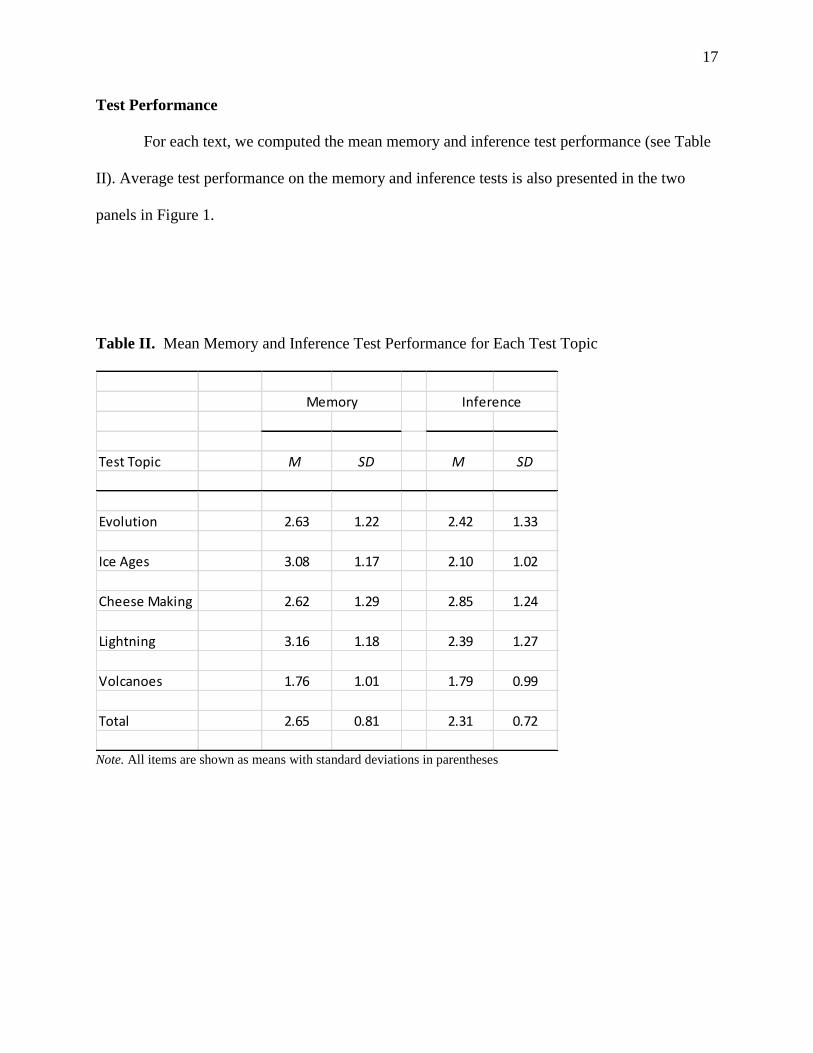
Cue Use as a Predictor of Metacomprehension Accuracy
Again following Thiede et al. (2010), we conducted a one-way ANOVA to see if reported
cue use was related to metacomprehension accuracy. As shown in Figure 3, results indicated that
there was a significant difference in metacomprehension accuracy across cue use profiles, F(3,
109) = 4.27, p < .01. Orthogonal contrasts indicated that participants who based their judgments
on comprehension cues had more accurate metacomprehension than participants who used
surface cues, F(1, 109) = 7.54, p < .01, memory cues, F(1, 109) = 5.92, p < .02, or readers cues,
F(1, 109) = 11.90, p < .001, which did not differ from each other.
24
Figure 3. Mean metacomprehension accuracy as a function of cue use. Error bars represent the
standard errors.
Cue Use Profile Frequency
Although the previous results indicate that judgments based on comprehension cues are
the best predictor of metacomprehension accuracy as compared to memory, surface or reader
cues, students only reported using them to make their comprehension judgments about 9% of the
time (see Table III). Overall, comprehension-based profiles were the least common (N = 10),
while memory-based (N = 44) and reader-based profiles (N = 44) were the most common.
Due to small sample sizes in several cells Fisher’s Exact tests, rather than Chi-square
tests, were computed in order to investigate the conditions under which comprehension-based
cues were reported being used to make judgments. The first Fisher’s Exact test looked at the
frequency of comprehension-based cues compared to all other types of cues as a function of the
type of instruction participants received. This test revealed that the number of participants who

25
reported using comprehension-based cues did not differ by instruction condition; the likelihood
of using comprehension cues when students were instructed to self-explain was 9% (5/57) as
well as when they were not instructed to self-explain (5/56), p = .62.
Table III. Judgment Profiles as a function of Image Condition and Instruction Type
A second Fisher’s Exact test was conducted to look at the frequency of comprehension-
based cues as compared to all other cues as a function of the type of images participants were
exposed to while reading. Because the number of participants who reported using comprehension
cues in the no image and decorative image conditions were so small (one in the no image
condition and two in the decorative image condition), these two conditions were collapsed for
the purpose of this test. This test revealed that the number of participants who reported using
No Image Conceptual Decorative Total
Instruction Type Judgment Profile N N N
No Self-Explain Comprehension 1 3 1 5
Memory 7 8 7 22
Surface 5 1 2 8
Reader 4 8 10 22
Self-Explain Comprehension 0 4 1 5
Memory 9 7 6 22
Surface 2 2 3 7
Reader 9 4 9 22

26
comprehension cues did differ by image condition, such that the likelihood of participants in the
conceptual image condition reporting using comprehension cues was 19% (7/37) whereas
participants in the decorative and no image conditions only had a 4% likelihood of using
comprehension cues (3/76), p = .01.
IV. DISCUSSION
The current study sought to examine how student’s metacomprehension accuracy was
affected as a function of the type of image they saw while reading expository text and whether or
not they were instructed to self-explain while reading. Results revealed that there were no
differences in metacomprehension accuracy across the three image conditions when no self-
explanation instructions were given. This indicates that without directing students to process the
text more deeply and attend to more valid cues such as through self-explanation, they may not do
so on their own.
However when instructed to self-explain while reading, significant differences in
metacomprehension accuracy across image conditions were found. Specifically, participants in
the conceptual image condition had more accurate metacomprehension than participants in the
no image condition and the decorative image condition. While our goal of instructing students to
self-explain was to increase access to representation-based cues and ultimately lead to more
accurate metacomprehension across all image conditions, this result suggests that this was only
the case in the conceptual image condition. These results failed to replicate earlier findings from
Griffin, Wiley and Thiede (2008) in which they showed increased metacomprehension for non-
illustrated text when readers were instructed to self-explain. One possible explanation for these
unexpected findings is that students in the conceptual image condition may have been self-
explaining the more relevant underlying process information in the text, while students in the no

27
image and decorative image conditions may have been self-explaining the less relevant details of
the text.
The results from the self-reported cue use data lend support to this explanation.
Specifically, most often participants reported using their memory for the text or reader-based
information such as their interest in the text to make their judgments, while least often using
information based on their comprehension of the processes being described in the text. Further
comprehension cues were most often reported by participants in the conceptual image condition
and these students also had the most accurate metacomprehension. These results replicate those
from Thiede et al. (2010) in which they also found that the use of comprehension based cues lead
to the formation of the most accurate metacomprehension judgments.
The results of this study also indicated that there was no change in participants’
judgments due to image condition. Average judgment ratings were the same regardless of the
type of image participants saw while reading the texts. This finding is inconsistent with previous
findings from Serra and Dunlosky (2010) in which they found higher judgment ratings for
illustrated text as compared to non-illustrated text.
Neither the image condition nor the self-explanation effects can be attributed to effects on
test performance itself, because there were no differences in test performance across conditions.
The lack of an effect for image condition on test performance is not surprising. Prior findings
have shown that images can decrease comprehension depending on the relevance of the
information depicted and also the individual characteristics of the learner, such as working
memory capacity (Sanchez & Wiley, 2006). As for the lack of a self-explanation effect, the self-
explanation instruction used here was not designed to impact test performance. The instruction
did not involve any practice, feedback or training in how to construct quality explanations, which

28
has been central to interventions designed to increase comprehension itself (e.g., Chi, 2000;
McNamara, 2004). Instead, the self-explanation instruction was intended to prompt readers to
attempt to make intertextual explanations, which would increase readers’ access to more valid
cues, therefore allowing them to make judgments based on the quality of their situation model
(Griffin, et al., 2008).
An important next step is exploring why self-explanation did not lead to stronger benefits
in metacomprehension in general. Not only did Griffin et al. (2008) find increases in
metacomprehension accuracy when students were instructed to self-explain, but those benefits
were much greater than the highest levels achieved in the current study. Future work will explore
why this higher degree of benefit was not found in the current study.
A second important future direction is refining self-explanation instructions specifically
for illustrated text. Many studies have investigated self-explanation instructions in multimedia;
however these studies have confined their instructions to the textual information only (Chi,
Bassok, Lewis, Reimann, & Glaser, 1989). Research on self-explanation in multimedia has
shown that it can facilitate integration across media (Aleven & Koedinger, 2002; Scevak, Moore,
& Kirby, 1993) however, other research has demonstrated that students tend to be poor at
attending only to relevant parts of diagrams or images and could be distracted by irrelevant
details (Sanchez & Wiley, 2006). Based on these ideas, providing students not only with
instructions to self-explain the textual information, but also instructions on how to self-explain
the pictorial information may lead to the highest levels of metacomprehension accuracy. The use
of think aloud protocols in future studies would help to provide further insight into what readers
are explaining across the texts and images.

29
In sum, because images are used so heavily in science domains in an attempt to increase
readers’ comprehension, it is important to understand what kinds of images help or hurt
comprehension and how they do so. It is also important to understand how different types of
images can affect students’ judgments of their comprehension and ultimately how this can affect
their future studying behaviors. The current results offer insight into not only how different
images may affect monitoring accuracy, but also how self-explanation can alter these effects.
While the current study did not find consistent benefits for self-explanation across all image
conditions, it did offer some further insights into the role that cue use plays in making accurate
metacognitive judgments. It is important to acknowledge that these results are limited in that
were not collected in real world learning situations and therefore do not account for factors such
as motivation, which may play a role in students’ learning and studying behaviors. However,
understanding the conditions under which metacomprehension is more or less accurate is
important because it affects the way people study and restudy, which determines how well they
learn in the long-term (Thiede, Anderson, & Therriault, 2003). These issues become especially
important as more instruction occurs in multimedia contexts.

30
References
Ainsworth, S. & Loizou, A. T. (2003). The effects of self-explaining when learning with text or
diagrams. Cognitive Science, 27, 669-681.
Aleven, V., & Koedinger, K. (2002). An effective metacognitive strategy: Learning by doing and
explaining with a computer-based cognitive tutor. Cognitive Science, 26, 147 – 179.
Balluerka, N. (1995). The influence of instructions, outlines, and illustrations on the recall of
scientific texts. Contemporary Educational Psychology, 20(3), 369 – 375.
Black, A. A. (2005). Spatial ability and earth science conceptual understanding. Journal of
Geoscience Education, 53(4), 402-414.
Bodner, G. M., & McMillen, T. L. B. (1986). Cognitive restructuring as an early stage in
problem solving. Journal of Research in Science Teaching, 23(8), 727-737.
Butcher, K. R. (2006). Learning from text with diagrams: Promoting mental model development
and inference generation. Journal of Educational Psychology, 98, 182–197.
Carter, C. S., LaRussa, M. A., & Bodner, G. M. (1987). A study of two measures of spatial
ability as predictors of success in different levels of general chemistry. Journal of
Research in Science Teaching, 24, 645-657.
Chandler, P., & Sweller, J. (1991). Cognitive load theory and the format of instruction.
Cognition and Instruction, 8, 293-332.
Chi, M. T. H. (2000). Self-explaining expository texts: The dual processes of generating
inferences and repairing mental models. In R. Glaser (Ed.), Advances in instructional
psychology, Vol. 5 (161-238). Mahwah, NJ: Lawrence Erlbaum Associates.
Chi, M. T. H., Bassok, M., Lewis, M. Reinmann, P., & Glaser, R. (1989). Self-explanations:
How students study and use examples in learning to solve problems. Cognitive Science,
5, 145 – 182.
Chi, M. T. H. (2000). Self-explaining: the dual processes of generating inferences and repairing
mental models. In R. Glaser (Ed.), Advances in instructional psychology, (pp. 161–238).
Mahwah, NJ: Lawrence Erlbaum Associates.
Chi, M., Deleeuw, N., Chiu, M., & Lavancher, C. (1994). Eliciting self-explanations improves
understanding. Cognitive Science, 18, 439-477.
Dunlosky, J., & Lipko, A. (2007). Metacomprehension: A brief history of how to improve its
accuracy. Current Directions in Psychological Science, 16, 228-232.
Ekstrom, R., French, J., Harman, H., & Derman, D. (1976). Kit of Factor-references Cognitive

31
Tests. Princeton, NJ: Educational Testing Service.
Glenberg, A. M., & Epstein, W. (1985). Calibration of comprehension. Journal of Experimental
Psychology: Learning, Memory, and Cognition, 11, 702-718.
Griffin, T. D., Jee, B. D. & Wiley, J. (2009). The effects of domain knowledge on
metacomprehension accuracy. Memory and Cognition, 37 (7), 1001-1013.
Griffin, T. D., Wiley, J., & Thiede, K. W. (2008). Individual differences, rereading, and self-
explanation: Concurrent processing and cue validity as constraints on
metacomprehension accuracy. Memory and Cognition, 36, 93-103.
Harp, S. F., & Mayer, R. E. (1997). The role of interest in learning from scientific text and
illustrations: On the distinction between emotional and cognitive interest. Journal of
Educational Psychology, 89, 92-102.
Hegarty, M., & Just, M. A. (1993). Constructing mental models of machines from text and
diagrams. Journal of Memory and Language,32, 717-742.
Jaeger, A. & Wiley, J. (2010). Seductive Images and the Metacomprehension of Science Texts.
Poster presented at the 32nd
Annual Meeting of the Cognitive Science Society, Portland,
OR.
Kintsch, W. (1998). Comprehension: A new paradigm for cognition. New York: Cambridge
University Press.
Koriat, A. (1997). Monitoring one’s own knowledge during study: A cue utilization approach to
judgments of learning. Journal of Experimental Psychology: General, 126, 349-370.
Koroghlanian, C., & Klein, J. D. (2004). The effect of audio and animation in multimedia
instruction. Journal of Educational Multimedia and Hypermedia, 13(1), 23-45.
Lowe, R. K. (1994). Selectivity in diagrams: reading beyond the lines. Educational Psychology,
14, 467 – 491.
Lubinski, D. (2010). Spatial ability and STEM: a sleeping giant for talent identification and
development. Personality and Individual Differences, 49, 344−351.
Maki, R. H. (1998). Test predictions over text material. In D. J. Hacker, J. Dunlosky, & A. C.
Graesser (Eds.), Metacognition in educational theory and practice (pp. 117-145).
Hillsdale, NJ: Erlbaum.
Maki, R. H., & Berry, S. L. (1984). Metacomprehension of text material. Journal of
Experimental Psychology: Learning, Memory and Cognition, 10, 663-679.
Mayer, R. E. (1994). Visual aids to knowledge construction: Building mental representations

32
from pictures and words. In W. Schnotz & R. W. Kulhavy (Eds.) Comprehension and
Graphics, (8).
Mayer, R. E., & Gallini, J. K. (1990). When is an illustration worth ten thousand words? Journal
of Educational Psychology, 82(4), 715 – 726.
McNamara, D. S. (2004). SERT: Self-explanation reading training. Discourse Processes, 38, 1-
30.
Moreno, R., & Mayer, R. E. (1999). Cognitive principles of multimedia learning: The role of
modality and contiguity. Journal of Educational Psychology, 91, 358–368.
Nelson, T. O. (1984). A comparison of current measures of the accuracy of feeling-of-knowing
predictions. Psychological Bulletin, 95, 109-133.
Pribyl, J. R., & Bodner, G. M. (1987). Spatial ability and its role in organic chemistry: A study of
four organic courses. Journal of Research in Science Teaching, 24(3), 229-240.
Rawson, K. A., Dunlosky, J., & Thiede, K. W. (2000). The rereading effect: Metacomprehension
accuracy improves across reading trials. Memory and Cognition, 28, 1004-1010.
Redford, J. S., Thiede, K. W., Wiley, J. & Griffin, T. D. (accepted, pending minor revisions)
Concept mapping improves metacomprehension accuracy among 7th graders. Learning
& Instruction.
Roediger, H. L., & Guynn, M. J. (1996). Retrieval processes. In E. L. Bjork & R. A. Bjork
(Eds.), Memory (pp.197–236). New York: Academic Press.
Sanchez, C., & Wiley, J. (2006). Effects of working memory capacity on learning from
illustrated text. Memory & Cognition, 34(2), 344-355.
Scevak, J. J., Moore, P. J., & Kirby, J. R. (1993). Training students to use maps to increase text
recall. Contemporary Educational Psychology, 18, 401 – 413.
Serra, M. J. & Dunlosky, J. (2010). Metacomprehension judgments reflect the belief that
diagrams improve learning from text. Memory, 1-14.
Sibley, D. F. (2005). Visual abilities and misconceptions about plate tectonics. Journal of
Geoscience Education, 53(4), 471-477.
Sweller, J. (2005). The redundancy principle in multimedia learning. In R. E. Mayer (Ed.),
Cambridge handbook of multimedia learning (pp. 159-167). Cambridge, UK: Cambridge
University Press.
Thiede, K. W., Anderson, M. C. M., & Therriault, D. (2003). Accuracy of metacognitive
monitoring affects learning of texts. Journal of Educational Psychology, 95, 66-73.
33
Thiede, K. W., Dunlosky, J., Griffin, T. D., & Wiley, J. (2005). Understanding the delayed
keyword effect on metacomprehension accuracy. Journal of Experimental Psychology:
Learning, Memory, and Cognition, 31(6), 1267-1280.
Thiede, K. W., Griffin, T. D., Wiley, J., & Anderson, M. (2010). Poor metacomprehension
accuracy as a result of inappropriate cue use. Discourse Processes.
Thiede, K. W., Griffin, T. D., Wiley, J., & Redford, J. (2009). Metacognitive monitoring during
and after reading. In D. J. Hacker, J. Dunlosky & A. C. Graesser (Eds). Handbook of
Metacognition in Education, pp. 85-106. Routledge.
Thiede, K. W., Wiley, J., & Griffin, T. D. (2011). Test expectancy affects metacomprehension
accuracy. British Journal of Educational Psychology.
Wai, J., Lubinski, D., & Benbow, C. P. (2009). Spatial ability for STEM domains: Aligning over
50 years of cumulative psychological knowledge solidifies its importance. Journal of
Educational Psychology, 101(4), 817 – 835.
Wiley, J., Griffin, T. D., & Thiede, K. W. (2005) Putting the comprehension in
metacomprehension. Journal of General Psychology, 132(4), 408-428.
Wiley, J. & Sanchez, C.A. (2010).Constraints on learning from expository science texts. In N.L.
Stein & S. Raudenbush (Eds.), Developmental Cognitive Science Goes to School (pp. 45-
58). Routledge Education: New York, NY.
Wu, H., & Shah, P. (2004). Exploring visuospatial thinking in chemistry learning. Science
Education, 88(3), 465-492.

34
Appendix A: Example Text, Images and Tests
VOLCANOES
On May 18, 1980, Mount St. Helens Volcano in Washington exploded violently. As early as
March 31, seismographs began recording volcanic tremor, a type of continuous, rhythmic ground
shaking. Such continuous vibrations are thought to reflect subsurface movement of fluids, either
gas or magma, and suggested that magma and associated gases were on the move within the
volcano. Early on May 18, following a magnitude-5.1 earthquake about 1 mile beneath the
volcano, the bulged, unstable north flank of Mount St. Helens suddenly began to collapse,
producing the largest landslide-debris avalanche recorded. Within seconds, eruptions began. The
sudden removal of the upper part of the volcano by the landslides triggered the almost
instantaneous expansion (explosion) of steam and gases within the volcano. The abrupt pressure
release uncorked the volcano. A strong, vertically directed explosion of ash and steam began
very shortly after the lateral blast and rose very quickly. In less than 10 minutes, the ash column
reached an altitude of more than 12 miles and began to expand into a mushroom-shaped ash
cloud.
Volcanoes are not randomly distributed over the Earth's surface. Most are concentrated on the
edges of continents, along island chains, or beneath the sea forming long mountain ranges. More
than half of the world's active volcanoes above sea level encircle the Pacific Ocean to form the
circum-Pacific "Ring of Fire." Plate tectonics tells us that the Earth's rigid outer shell is broken
into a dozen or so plates. These plates are riding on currents in the hot, mobile uppermost layer
of the mantle. When plates interact at their margins, important geological processes take place,
such as the formation of mountain belts, volcanoes and most earthquakes.
Though hidden underwater, the global mid-ocean ridge system is the most prominent
topographic feature on the surface of our planet. In 1961, scientists began to theorize that mid-
ocean ridges mark structurally weak zones where ocean plates were being ripped in two. New
magma from deep within the Earth rises easily through these weak zones and eventually erupts
along the crest of the ridges to create new oceanic crust. This process, called seafloor spreading,
has built the mid-ocean ridges. Henry Hess reasoned that the ocean basins were perpetually
being "recycled," with the creation of new crust and the destruction of old oceanic lithosphere
occurring simultaneously. He suggested that new oceanic crust continuously spreads away from
the ridges in a conveyor belt-like motion. Many millions of years later, the oceanic crust
eventually descends into the oceanic trenches -- very deep, narrow canyons along the rim of the
Pacific Ocean basin. The amount of crust remains constant. When a divergence of plates
occurs in one area, a convergence of plates occurs in another.
There are 3 types of converging plate boundaries: Oceanic-Oceanic, Oceanic-Continental and
Continental-Continental. When an oceanic-continental convergence occurs, one plate will most
commonly subduct beneath the other plate creating a trench. The oceanic plate is denser than the
continental plates, so the oceanic plate is usually subducted. For example, the east edge of the
Juan de Fuca Plate is plunging beneath the North American Plate. As the oceanic crust is forced
deep into the Earth's interior beneath the continental plate, it encounters high temperatures and
pressures. The melting of the crust forms magma. Some of this newly formed magma rises

35
toward the Earth's surface. Arcs of volcanoes usually form above a subduction zone.
Earthquakes can also be caused by the collision of oceanic and continental plates. In the
Philippines, the Java trench is associated with volcanic islands as well as earthquakes. Further,
the movement of magma in subduction zones can also trigger deep earthquakes.
An oceanic-oceanic convergence often results in the formation of an island arc system. As one
plate subducts it melts within the mantle. The magma rises to the surface of the ocean floor and
forms volcanoes. If the activity continues, the volcano may grow tall enough to create an island.
A continental-continental convergence generally does not involve subduction. Instead, the two
plates squeeze and deform each other, resulting in a mountain range such as the Himalayas.
Earthquakes are also associated with high mountain ranges where intense compression is taking
place.
Scientists have defined two major types of volcanoes: shield volcanoes and stratovolcanoes.
Shield volcanoes are the largest volcanoes on Earth. They are gently sloping, such as those in
Hawaii. Their lavas flow great distances from the active vents. Hawaiian magmas have a low
viscosity, and gases can escape prior to an eruption. Like most oceanic volcanoes, their magma
comes from the melting of crust in the ocean plates. Hawaiian eruptions are noted for their non-
explosive nature and approachability.
Stratovolcanoes are typically located near convergent plate boundaries where subduction is
occurring, particularly around the Pacific basin. The magma produced by subduction is generally
high in viscosity. The high viscosity does not allow gas to readily escape from the magma. When
the magma reaches the vent of the volcano, gas bubbles begin to form and to grow. The rapid
expansion of the gas tears the magma apart, and the volcano erupts violently, producing great
volumes of ash. If enough gas escapes, the volcano can produce a sticky, slow-moving lava
flow. Flows travel only a short distance from the vent before they solidify. The volcano tends to
grow both vertically and laterally, resulting in a cone shape with steep slopes. Stratovolcanoes
are not as voluminous as shield volcanoes.
There are dramatic differences in eruptions of Hawaiian volcanoes like Kilauea and Mount St.
Helens. The different abundances of elements in magma, especially silica, exert the primary
control on the explosiveness of an eruption. The viscosity of magma is greatly influenced by its
silica content. Magmas which are low in silica tend to be very fluid. Most rocks in Hawaii are
basalt. Basalts are characterized by a relatively low abundance of silica and high abundances of
iron and magnesium. In contrast, most volcanic rocks along continental margins are andesite or
dacite. Andesite or dacite are characterized by a relatively high abundance of silica and low
abundances of iron and magnesium. Because Hawaiian magma is fluid, gas dissolved in the
magma can escape prior to the eruption. In contrast, large amounts of gas is trapped inside
andesitic or dacitic magmas. The gas cannot escape until the magma enters the throat of the
volcano. When magma nears the vent, the gas bubbles nucleate and grow. The outward pressure
exerted by the bubbles is greater than the strength of the magma. The lava fragments and is
ejected violently at high velocity.

36
Conceptual Image:
Decorative image:

37
Inference Test:
Volcanoes Test
Where is the least likely place for a volcano?
A. in the middle of a continent
B. at the edge of an ocean
C. on islands
D. under the ocean
What happens where plates diverge?
A. a trench forms that subducts oceanic crust
B. earthquakes
C. violent eruptions
D. new crust is formed
Which is true of converging oceanic and continental plates?
A. the oceanic plate is pushed deep into the mantle
B. they are generally free of earthquakes
C. continental plates are denser than oceanic plates
D. the two plates push up on each other and form mountains
What causes violent volcanic eruptions?
A. fluid magmas that are low in silica
B. magmas that come from melted continental plates
C. magmas that are high in basalt
D. magmas that come from melted oceanic plates
Which does not cause the creation of volcanoes?
A. oceanic-continental plate convergence
B. oceanic-oceanic plate convergence
C. continental-continental plate convergence
D. magma rising to the earth's surface

38
Memory Test:
Volcanoes Test
What magnitude earthquake accompanied the Mt. St. Helens eruption?
A. 2.3
B. 4.2
C. 5.1
D. 7.2
How many of the world's volcanoes are located on the perimeter of the Pacific Ocean?
A. none
B. about a third
C. over half
D. almost all
How many plates make up the earth's crust?
A. 2
B. 7
C. 12
D. about 20
What is true of shield volcanoes?
A. they have steep sides
B. they are the largest
C. they erupt violently
D. they are also known as stratovolcanoes
What is true of andesitic magma?
A. it contains low amounts of silica
B. it contains low amounts of sulfur
C. it contains high amounts of magnesium
D. it contains high amounts of gas

39
Appendix B: Demographic Questionnaire
Age_________ Sex (circle one) M F
Year in School: Freshman Sophomore Junior Senior
What is your intended major:
Are you bilingual (or multilingual)? (circle one) YES NO
What is/are your native language(s)?
If English is not your first language, AT WHAT AGE did you start speaking English fluently?
Please answer the following to the best of your ability:
ACT COMPOSITE Score ______ (0-36) SAT VERBAL Score _______ (0-800)
ACT MATH Score ______ (0-36) SAT MATH Score _______ (0-800)
ACT SCIENCE Score ______ (0-36)
How many college courses (if any) have you taken in science and what were they?
How interesting was the material in the texts?
1 2 3 4 5 6 7 8 9 10 Not at all interesting Very Interesting
How much did you look at the images provided with the texts?
1 2 3 4 5 6 7 8 9 10 Not at all Very Much
How interesting were the images?
1 2 3 4 5 6 7 8 9 10 Not at all interesting Very Interesting
How helpful were the images for your understanding of the texts?
1 2 3 4 5 6 7 8 9 10 Unhelpful Very Helpful
Overall, how hard did you try to learn the information in the texts? (please be honest)
1 2 3 4 5 6 7 8 9 10 Not at all Very Much

40
Evolution
How interesting was the evolution image?
1 2 3 4 5 6 7 8 9 10 Not at all interesting Very Interesting
How much did you look at the image provided with the evolution text?
1 2 3 4 5 6 7 8 9 10 Not at all Very Much
How helpful was the image for your understanding of the evolution text?
1 2 3 4 5 6 7 8 9 10 Unhelpful Very Helpful
Ice Ages
How interesting was the ice ages image?
1 2 3 4 5 6 7 8 9 10 Not at all Very Much
How much did you look at the image provided with the ice ages text?
1 2 3 4 5 6 7 8 9 10 Not at all Very Much
How helpful was the image for your understanding of the ice ages text?
1 2 3 4 5 6 7 8 9 10 Unhelpful Very Helpful
Cheese Making
How interesting was the cheese making image?
1 2 3 4 5 6 7 8 9 10 Not at all Very Much
How much did you look at the image provided with the cheese making text?
1 2 3 4 5 6 7 8 9 10 Not at all Very Much
How helpful was the image for your understanding of the cheese making text?
1 2 3 4 5 6 7 8 9 10 Unhelpful Very Helpful

41
Lightning
How interesting was the lightning image?
1 2 3 4 5 6 7 8 9 10 Not at all Very Much
How much did you look at the image provided with the lightning text?
1 2 3 4 5 6 7 8 9 10 Not at all Very Much
How helpful was the image for your understanding of the lightning text?
1 2 3 4 5 6 7 8 9 10 Unhelpful Very Helpful
Volcanoes
How interesting was the volcanoes image?
1 2 3 4 5 6 7 8 9 10 Not at all Very Much
How much did you look at the image provided with the volcanoes text?
1 2 3 4 5 6 7 8 9 10 Not at all Very Much
How helpful was the image for your understanding of the volcanoes text?
1 2 3 4 5 6 7 8 9 10 Unhelpful Very Helpful
Please give short answer responses to the following questions:
1.) Describe the way that you tried to read the texts?
2.) You just rated your comprehension of five different passages. What did you use to decide
whether your comprehension of a passage was given a high rating or a low rating?

42
Appendix C: Paper Folding Task

43
Appendix D: Complete Task Instructions
Instructions
In this study, you will be reading a series of texts, estimating how many questions you can get
correct on a five item multiple-choice test, and then taking a test to see how well you actually
do. That is, you will read, predict, and test for each text.
The literature suggests that people study differently depending on the kind of test they
expect. You will be taking tests that assess your ability to make connections between the
different parts of a text (i.e., link the parts of the text).
The first text is provided to give you practice with these kinds of tests. For this text, you will get
the test right after you predict your performance.
The procedure is a little different for the last set of texts. For those texts, you will read all the
texts one after another, then predict your performance on each text one after another, and then
take tests for all of the texts.
Do the best you can. Thank you for participating in this study!!!
Students read practice text
You will take a test of the material you just read.
How many questions out of 5 do you think you can correctly answer?
0 1 2 3 4 5
Students complete set of practice inference items
You will now read a set of five texts.
Press to Submit Your Answ er and Proceed

44
The procedure is a little different. For these texts, you will read all the texts one after another
and predict your performance. Then you will take tests for all of the texts.
Task instructions diverge here. Students assigned to the no self-explain condition go directly into
reading the first target text. However, additional instructions are given to participants randomly
assigned to the self-explanation condition; see these instructions below.
In addition as you read each text, you should try to explain to yourself the meaning and relevance
of each sentence or paragraph to the overall purpose of the text. Ask yourself questions like:
What new information does this paragraph add?
How does it relate to previous paragraphs?
Does it provide important insights into the major theme of the text?
Does the paragraph raise new questions in your mind?
For example, take this paragraph about hail and sleet. Some possible comments you could ask
yourself are in red:
Sleet are raindrops that freeze on their way down.
Hailstones freeze in the cloud then start to fall.
I wonder what difference that could make?
Because ice balls are lighter than raindrops, the wind can blow hailstones back up into the
clouds.
What happens when hail goes back into the clouds?
Water freezes around hailstones again and again in the clouds, until they are heavy enough to
reach the ground.
So that would mean hailstones are usually larger than sleet.
If you look at sleet and hail, hail has many more layers of ice.
That makes sense if they freeze more than once
Try your best to think about these issues and ask yourself these kinds of questions about each
text as you read. As you finish each paragraph, before you move on to the next paragraph,
explain to yourself what that paragraph meant.
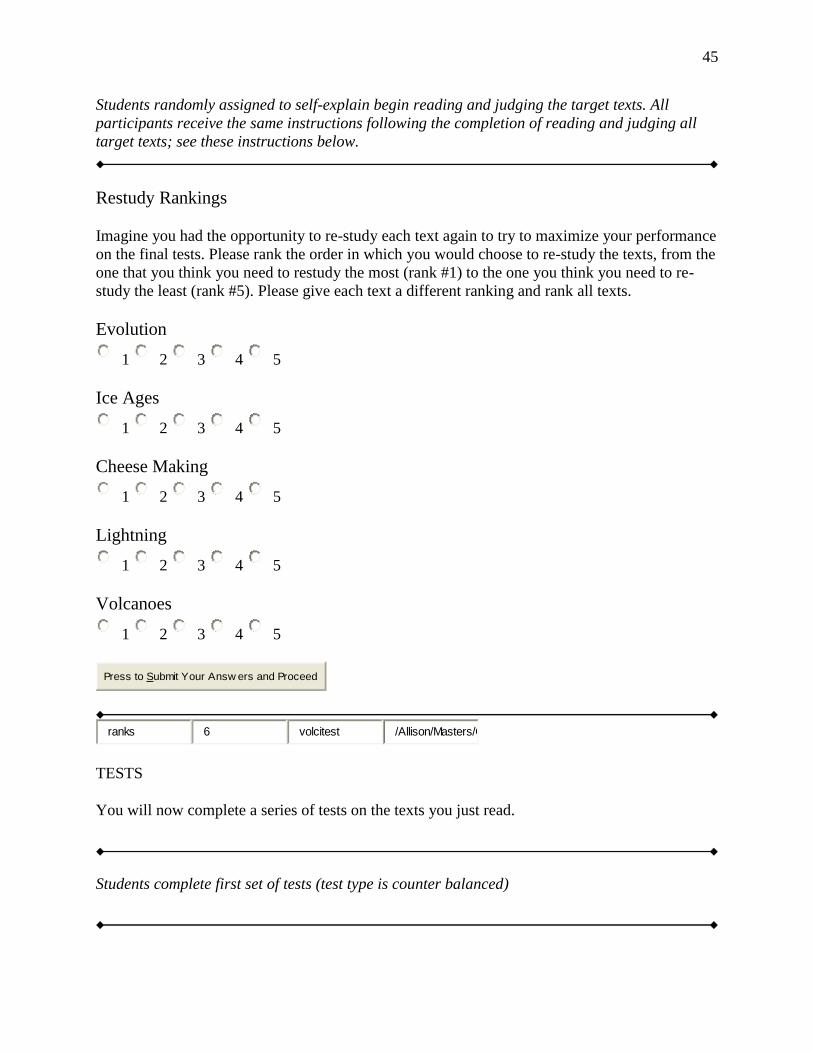
45
Students randomly assigned to self-explain begin reading and judging the target texts. All
participants receive the same instructions following the completion of reading and judging all
target texts; see these instructions below.
Restudy Rankings
Imagine you had the opportunity to re-study each text again to try to maximize your performance
on the final tests. Please rank the order in which you would choose to re-study the texts, from the
one that you think you need to restudy the most (rank #1) to the one you think you need to re-
study the least (rank #5). Please give each text a different ranking and rank all texts.
Evolution
1 2 3 4 5
Ice Ages
1 2 3 4 5
Cheese Making
1 2 3 4 5
Lightning
1 2 3 4 5
Volcanoes
1 2 3 4 5
TESTS
You will now complete a series of tests on the texts you just read.
Students complete first set of tests (test type is counter balanced)
Press to Submit Your Answ ers and Proceed
ranks 6 volcitest /Allison/Masters/C

46
You will now complete a second series of tests on the texts you just read.
Students complete second set of tests (test type is counter balanced)
END OF PART I
Please raise your hand and wait for the experimenter!

47
Appendix E: Debriefing Form
Impact of Web Design on Reading and Learning
The experiment you participated in is looking at how different types of images affect the way
people understand text. In this experiment, students read texts that varied in the number and kind
of images provided. We are interested in whether these differences in design affect the way
people judge and learn from the texts.
We ask that you don’t discuss this experiment with other as it may contaminate our data.
Thank you for your participation in this project.
If you have any questions about your participation in this experiment, please contact Jennifer
Wiley at 996-5591 or email at [email protected].

48
Appendix F: Spatial Ability Analyses
A vast body of research has focused on the role that spatial ability plays in mathematics
and science learning (Lubinski, 2010). Specifically, research has shown that high intellectual
orientation dominated by high mathematical and spatial abilities, relative to verbal abilities, tend
to be salient characteristics of individuals with advanced educational credentials in STEM
(science, technology, engineering, and math) careers (Wai, Lubinski, & Benbow, 2009). Because
of the long standing belief that spatial skills play a role in science learning we conducted several
exploratory analyses to examine the effects of spatial ability on monitoring accuracy.
It was predicted that spatial ability would positively correlate with inference and memory
test performance because, as previously mentioned, prior research has shown that students high
in spatial skills also tend to be high performers in math and science domains. The relationship
between spatial ability and metacomprehension accuracy is much less clear, but it could be
argued that being high in spatial skills would help a reader to make more accurate
metacomprehension judgments. Research has shown that students high in science knowledge as
compared to those low in science knowledge attend to different aspects of visual displays and
extract different information from these displays. An example from meteorology found that
novices were more likely to focus on the weather maps’ superficial features whereas experts
focused on the more thematically and casually relevant information (Lowe, 1994). This attention
to more relevant cues should lead these high spatial students to also make more accurate
judgments of their comprehension.
To explore the relationship between spatial ability, as measured by the paper folding task,
and other variables in our study we looked at correlations between several demographics
variables, test scores and metacomprehension accuracy. As seen in Table IV, the results for
49
paper folding positively correlate with students self-reported ACT scores and the number of
science classes taken as well as performance on both the memory and inference tests. In terms of
metacomprehension accuracy however, our hypothesis was not supported and no correlations
were found with spatial ability. Furthermore, no correlations were found between paper folding
and metacomprehension accuracy in each image condition (conceptual r = -.02, decorative r = -
.03, no image r = -.04).
In terms of memory and inference test performance, several significant correlations were
observed. In the no image condition there was a significant correlation between paper folding
and inference test performance (r = .37, p < .05), however the correlation between paper folding
and memory test performance was marginal (r = .28, p = .08). In the conceptual image condition
there was a significant correlation between paper folding and memory test performance (r = .31,
p < .05), however the correlation with inference test performance did not reach significance (r =
.24, ns). No significant correlations were found between paper folding and test performance in
the decorative image condition.
The significant correlations found here are consistent with previous work indicating that
students high in spatial skills tend to perform better in science related areas such as biology
(Koroghlanian & Klein, 2004) and chemistry (Bodner & McMillen, 1986; Carter, LaRussa, &
Bodner, 1987; Pribyl & Bodner, 1987; Wu & Shah, 2004). Koroghlanian and Klein (2004)
showed that students high in spatial skills learned better than students low in spatial skills on
illustrated texts about meiosis, while Bodner and collogues have demonstrated that spatial ability
is correlated with performance on chemistry exams. Finally, an importantly for this experiment,
spatial ability has also been shown to be related to the understanding of earth science topics such
as geology (Black, 2005; Sibley, 2005).

50
Table IV. Correlation Matrix for Demographics, Test Performance, and Monitoring Accuracy
Variable Paper Folding ACT comp ACT Math ACT science Sci Courses Memory Test Inference Test Metamemory Metacomp Average Judge
Paper Folding ----
ACT comp .34** ----
ACT math .40** .77** ----
ACT science .29** .78** .67** ----
Sci Courses .32** .34** .34** .41** ----
Memory Test .22* .41** .29** .43** .21* ----
Inference test .21* .36** .35** .40** .20* .56** ----
Metamemory -0.08 -0.14 -0.09 -0.15 0.05 -0.02 0.03 ----
Metacomp 0.01 0.14 0.18 0.08 0.07 -0.03 0.11 0.06 ----
Average Judge 0.05 -0.02 0.01 0.04 0.04 .24** 0.16 -0.05 -0.01 ----

51

52

53

54
CURRICULUM VITAE
Allison J. Jaeger
Department of Psychology
University of Illinois at Chicago
1007 W. Harrison St M/C 285
Chicago, IL 60607 Email: [email protected]
Education:
PhD expected 2015, University of Illinois at Chicago
Major: Cognitive Psychology Minor: Learning Technologies
B.A. in Psychology (applied track), December 2007, University of Illinois at Chicago
Honors and Awards:
Student Research Award, 2nd
prize, UIC Undergraduate Research Symposium, 2008
UIC Dean’s List, Spring 2006 – Fall 2007
Graduated Cum Laude, December 2007
Inducted Psi Chi International Honor Society, Spring 2011
National Science Foundation Travel Grant, July 2011
Publications:
Wiley, J., Ash, I. K., Sanchez, C. A., & Jaeger, A. (2011). Clarifying readers' goals for
learning from expository science texts. In M. McCrudden, J. Magliano, and G.
Schraw, (Eds.) Text relevance and learning from text (pp. 353-374). Greenwich,
CT: Information Age Publishing.
Moher, T., Wiley, J., Jaeger, A., Lopez Silva, B., Novellis, F., & Kilb, D. (2010).
Spatial and temporal embedding for science inquiry: An empirical study of
student learning. Proceedings of the International Conference of the Learning
Sciences, Chicago, IL.
Manuscripts in preparation:
Jaeger, A. & Wiley, J. (in preparation). The effects of images on metacomprehension
accuracy.
Jaeger, A, Wiley, J., & Moher, T. (in preparation). The role of spatial ability in learning
from whole-class simulations in science.
Presentations:
Griffin, T. D., Jaeger, A. J., Jarosz, A. F., Thiede, K. W., & Wiley, J. (July, 2012).
Improving Metacomprehension in an Undergraduate Course in Research
Methods. Paper submitted to the Society for Text and Discourse, Montreal,
Canada.

55
Jaeger, A. J. & Wiley, J. (May, 2012). Pay no attention to that image! Effects of Image
Use Instructions on Metacomprehension of Illustrated Text. Paper to be presented
at the 84th
Annual Meeting of the Midwestern Psychological Association.
Chicago, IL.
Jaeger, A. J. & Wiley, J. (2011). Reducing Illusions of Comprehension from Illustrated
Text. Poster presented at the 52nd
Annual Meeting of the Psychonomic Society,
Seattle, WA.
Jaeger, A. & Wiley, J. (2011). Using Explanation to Improve Metacomprehension of
Illustrated Science Texts. Paper presented at the Society for Text and Discourse,
Poitiers, France.
Jaeger, A., Wiley, J., Moher, T., Lopez-Silva, B. A., & Novellis, F. (2011).
Embedded Simulations Support Learning in Geoscience. Paper presented in a
structured poster session at the American Educational Research Association, New
Orleans, LA.
Jaeger, A., Wiley, J., & Griffin, T. (2010). Metacomprehension accuracy from
illustrated text. Poster presented at the 51st Annual Meeting of the Psychonomic
Society, St. Louis, MO.
Ricks, T. R., Jaeger, A., & Wiley, J. (2010). The impact of knowledge and mnemonic
chunking strategies in eliminating the fan effect. Poster presented at the 51st
Annual Meeting of the Psychonomic Society, St. Louis, MO.
Jaeger, A. & Wiley, J. (2010). The Effects of Images on Comprehension and
Metacomprehension of Science Texts. Poster presented at the Society for Text &
Discourse, Chicago, IL.
Jaeger, A. & Wiley, J. (2010). Seductive Images and the Metacomprehension of Science
Texts. Poster presented at the 32nd
Annual Meeting of the Cognitive Science
Society, Portland, OR.
Moher, T., Wiley, J., Jaeger, A., Lopez Silva, B., Novellis, F., & Kilb, D. (2010).
Spatial and temporal embedding for science inquiry: An empirical study of
student learning. Paper presented at the International Conference of the Learning
Sciences, Chicago, IL.
Jaeger, A., (2010, April). The Effects of Images on Comprehension and
Metacomprehension of Science Texts. Talk presented at the UIC Cognitive Brown
Bag Series, Chicago, IL.
Jaeger, A., Moher, T., Wiley, J., Malcolm, P., Lopez-Silva, B. A., Gnoli, A. & Brown, J.
(2009). WallCology: Using Embedded Phenomena to Motivate Learning About
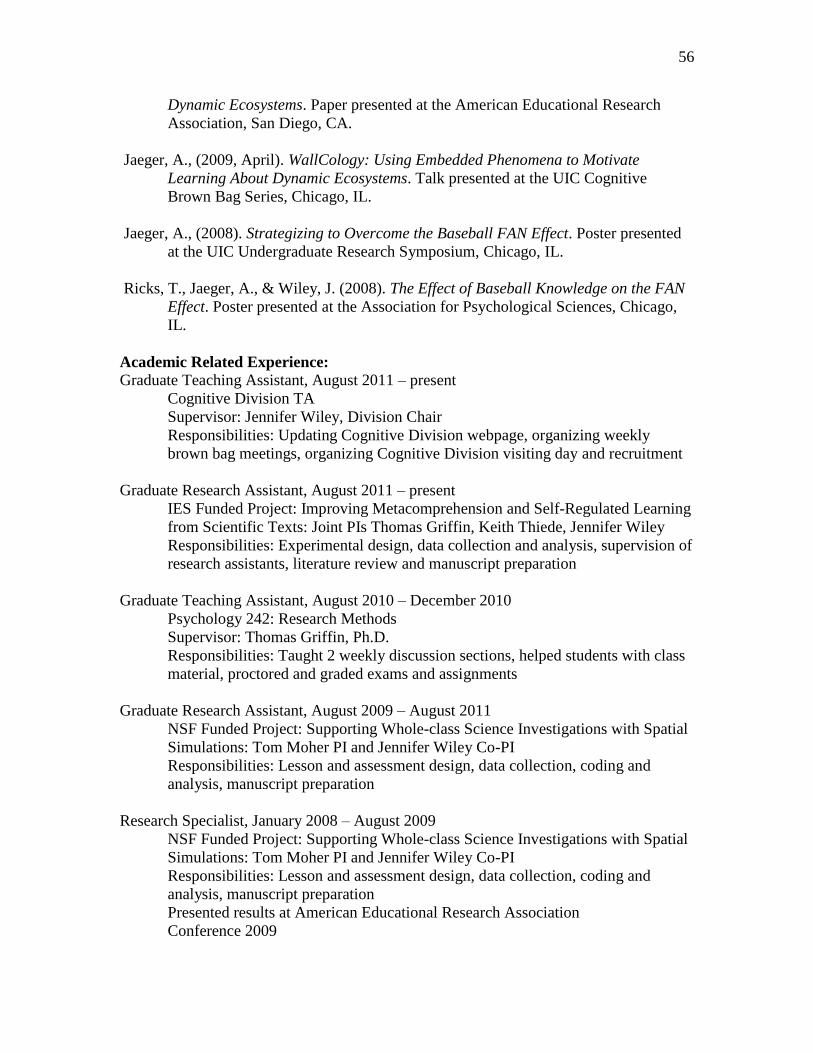
56
Dynamic Ecosystems. Paper presented at the American Educational Research
Association, San Diego, CA.
Jaeger, A., (2009, April). WallCology: Using Embedded Phenomena to Motivate
Learning About Dynamic Ecosystems. Talk presented at the UIC Cognitive
Brown Bag Series, Chicago, IL.
Jaeger, A., (2008). Strategizing to Overcome the Baseball FAN Effect. Poster presented
at the UIC Undergraduate Research Symposium, Chicago, IL.
Ricks, T., Jaeger, A., & Wiley, J. (2008). The Effect of Baseball Knowledge on the FAN
Effect. Poster presented at the Association for Psychological Sciences, Chicago,
IL.
Academic Related Experience:
Graduate Teaching Assistant, August 2011 – present
Cognitive Division TA
Supervisor: Jennifer Wiley, Division Chair
Responsibilities: Updating Cognitive Division webpage, organizing weekly
brown bag meetings, organizing Cognitive Division visiting day and recruitment
Graduate Research Assistant, August 2011 – present
IES Funded Project: Improving Metacomprehension and Self-Regulated Learning
from Scientific Texts: Joint PIs Thomas Griffin, Keith Thiede, Jennifer Wiley
Responsibilities: Experimental design, data collection and analysis, supervision of
research assistants, literature review and manuscript preparation
Graduate Teaching Assistant, August 2010 – December 2010
Psychology 242: Research Methods
Supervisor: Thomas Griffin, Ph.D.
Responsibilities: Taught 2 weekly discussion sections, helped students with class
material, proctored and graded exams and assignments
Graduate Research Assistant, August 2009 – August 2011
NSF Funded Project: Supporting Whole-class Science Investigations with Spatial
Simulations: Tom Moher PI and Jennifer Wiley Co-PI
Responsibilities: Lesson and assessment design, data collection, coding and
analysis, manuscript preparation
Research Specialist, January 2008 – August 2009
NSF Funded Project: Supporting Whole-class Science Investigations with Spatial
Simulations: Tom Moher PI and Jennifer Wiley Co-PI
Responsibilities: Lesson and assessment design, data collection, coding and
analysis, manuscript preparation
Presented results at American Educational Research Association
Conference 2009
57
Directed Research with Professor Wiley, Fall 2007
Research Assistant for projects investigating the effects of domain knowledge on
memory
Responsibilities: Ran participants, coded and analyzed data
Presented results at Undergraduate research fair
Internship at the National Runaway Switch Board, August 2007 – December 2007
Certified youth crisis counselor through 45 hour training
Weekly shifts as a telephone crisis counselor, provided referrals for many issues
including medical, legal, housing, addiction, and abuse, and also updated juvenile
court referral databases.
UIC In-Touch Crisis Hotline Volunteer, April 2007 – July 2008
Completed required paraprofessional training, PSCH 394
General supportive counseling, crisis intervention, and referrals for diverse
community members
Passed qualifications to counsel independently and supervise new trainees
Undergraduate Mentoring
Michelle Evans (F09, S10) Comprehension and Metacomprehension of Illustrated
Science Texts
Nicole Rivera (F10) Comprehension and Metacomprehension of Science Texts
Samantha Hicks (S10, F11) Whole-class Science Investigations with Spatial
Simulations
Rick Leonard (S10) Whole-class Science Investigations with Spatial Simulations
Melissa Pasierb (S12) Comprehension and Metacomprehension of Science Texts
Stephanie Blakeslee (S12) Comprehension and Metacomprehension of Science Texts
Professional Organization Activities
Student Member, Society for Text and Discourse
Student Member, American Educational Research Association
Student Member, Cognitive Science Society
Student Member, Midwestern Psychological Association
Student Member of Organizing Committee, 20th
Annual Meeting of the Society for
Text and Discourse, Chicago, August 2010
Conference Reviewer, 21st Annual Meeting of the Society for Text and Discourse,
Poitiers, France, July 2011
Other Activities/Skills:
Working knowledge of NetLogo
German Language Study Abroad – Humboldt University, Summer 2007
German language proficiency

58
Professional References
Jennifer Wiley, Ph.D.
Associate Professor
Department of Psychology
University of Illinois at Chicago
1007 W. Harrison St. (M/C 285)
Chicago, Il 60607
Phone: (312) 355-2501
Email: [email protected]
Thomas Griffin, Ph. D.
Assistant Research Professor
Department of Psychology
University of Illinois at Chicago
1007 W. Harrison St. (M/C 285)
Chicago, Il 60607
Phone: (312) 355-2501
Email: [email protected]
Tom Moher, Ph. D.
Associate Professor
Department of Computer Science
University of Illinois at Chicago
851 S. Morgan (M/C 152)
Chicago, Il 60607
Phone: (312) 996-4562
Email: [email protected]
Susan Goldman, Ph.D.
Distinguished Professor
Department of Psychology and
Education
University of Illinois at Chicago
1007 W. Harrison St. (M/C 285)
Chicago, Il 60607
Phone: (312) 996-4462
Email: [email protected]