INDICATORS FOR THE POST-2020 GLOBAL BIODIVERSITY …
57
CBD Distr. GENERAL CBD/SBSTTA/24/INF/16 4 January 2021 ENGLISH ONLY SUBSIDIARY BODY ON SCIENTIFIC, TECHNICAL AND TECHNOLOGICAL ADVICE Twenty-fourth meeting Venue and dates to be determined Item 3 of the provisional agenda* INDICATORS FOR THE POST-2020 GLOBAL BIODIVERSITY FRAMEWORK Note by the Executive Secretary BACKGROUND 1. The Executive Secretary is pleased to circulate herewith, for the information of participants in the twenty-fourth meeting of the Subsidiary Body on Scientific, Technical and Technological Advice, an information document on indicators for the post-2020 global biodiversity framework, prepared by the United Nations Environment Programme World Conservation Monitoring Centre (UNEP-WCMC), in collaboration with the Biodiversity Indicators Partnership (BIP) and incorporating inputs from peer review. 2. The attached information document has not been formally edited or formatted. It is being circulated in the form in which it was received. * CBD/SBSTTA/24/1.
Transcript of INDICATORS FOR THE POST-2020 GLOBAL BIODIVERSITY …

CBD
Distr.
GENERAL
CBD/SBSTTA/24/INF/16
4 January 2021
ENGLISH ONLY
SUBSIDIARY BODY ON SCIENTIFIC,
TECHNICAL AND TECHNOLOGICAL ADVICE
Twenty-fourth meeting
Venue and dates to be determined
Item 3 of the provisional agenda*
INDICATORS FOR THE POST-2020 GLOBAL BIODIVERSITY FRAMEWORK
Note by the Executive Secretary
BACKGROUND
1. The Executive Secretary is pleased to circulate herewith, for the information of participants in the
twenty-fourth meeting of the Subsidiary Body on Scientific, Technical and Technological Advice, an
information document on indicators for the post-2020 global biodiversity framework, prepared by the
United Nations Environment Programme World Conservation Monitoring Centre (UNEP-WCMC), in
collaboration with the Biodiversity Indicators Partnership (BIP) and incorporating inputs from peer review.
2. The attached information document has not been formally edited or formatted. It is being circulated
in the form in which it was received.
* CBD/SBSTTA/24/1.

CBD/SBSTTA/24/INF/16
Page 2
INDICATORS FOR THE POST-2020 GLOBAL BIODIVERSITY
FRAMEWORK
Information Document prepared for SBSTTA24 by UNEP-WCMC in collaboration
with the Biodiversity Indicators Partnership and incorporating inputs from peer
review
Note by the Executive Secretary

CBD/SBSTTA/24/INF/16
Page 3
1. INTRODUCTION
This document provides information on available indicators for the draft goals and targets of the post-2020
global biodiversity framework, based on the version of the draft monitoring framework that was available
for peer review in May 2020. It includes analysis of available indicators and provides observations to assist
the further development of the monitoring framework. The document builds on two information documents
previously provided to the 23rd meeting of the Subsidiary Body on Scientific, Technical and Technological
Advice, CBD/SBSTTA/23/INF/31 and CBD/SBSTTA/23/INF/4,2 and has been prepared in response to
Recommendation 23/1 of that meeting (paragraph 13)3 and recommendation 2/1 of the second meeting of
the Open-ended Working Group on the Post-2020 Global Biodiversity Framework (paragraph 3).4 This
version of the document CBD/SBSTTA/23/INF/3 has been updated based on submissions provided by
Parties, other Governments and observers in response to notification 2020-045 - an invitation to participate
in the ‘Peer review of draft documents for the twenty-fourth meeting of the Subsidiary Body on Scientific,
Technical and Technological Advice (SBSTTA 24).5
The document includes an analysis of the availability and suitability of indicators that can be used to
measure the progress in implementation of post-2020 global biodiversity framework, noting:
a. Where indicators already exist and are available for use for the different draft goals and targets;
b. Where published indicator methodologies are available;
c. Whether indicators are available for use at the national level as well as global scale, and where
data used to create global indicators can be accurately aggregated from national data or
disaggregated to the national scale;
d. Whether the same indicators are used to measure progress under other conventions and
intergovernmental processes, including the Sustainable Development Goals (SDGs).
This document also provides considerations in relation to indicator availability for baselines for monitoring
progress towards the implementation of the post-2020 global biodiversity framework. In addition, the
document highlights various work underway to develop systems to track progress at the global and national
scale towards the post-2020 global biodiversity framework, once adopted.
The information presented in this document is derived from data provided by members of the Biodiversity
Indicators Partnership (BIP),6 and indicator information submitted to the Secretariat of the CBD by Parties,
other Governments and observers via the official peer review process.
1 CBD/SBSTTA/23/INF/3 2 CBD/SBSTTA/23/INF/4 3 Requests the Executive Secretary to submit for peer review by Parties and stakeholders the document on “Indicators for global and
national biodiversity targets: experience and indicator resources for development of the post-2020 global biodiversity framework”, and,
in collaboration with other members of the Biodiversity Indicators Partnership, to prepare an analysis of the use of indicators in the
sixth national reports, and, drawing upon this information as well as the inputs to the peer review and other relevant information,
including CBD/SBSTTA/23/INF/3, to prepare a document that identifies the range of relevant existing indicators, baselines, baseline
dates, or other appropriate methods for monitoring changes in biodiversity, indicator gaps, and, where relevant, options for filling such
gaps and for a monitoring framework for the post-2020 global biodiversity framework, taking into account the outcomes of the second
meeting of the Open-ended Working Group on the Post-2020 Global Biodiversity Framework, and to issue the document no later than
six weeks in advance of the twenty-fourth meeting of the Subsidiary Body on Scientific, Technical and Technological Advice for its
consideration. 4 Invites the Subsidiary Body on Scientific, Technical and Technological Advice at its twenty-fourth meeting to carry out a scientific and technical review of the updated goals and targets, and related indicators and baselines, of the draft global biodiversity framework, as well as the revised appendices to the framework, and to provide advice to the Working Group at its third meeting. 5 Notification 2020-045 6 www.bipindicators.net

CBD/SBSTTA/24/INF/16
Page 4
To undertake this review UNEP-WCMC compiled all indicator information identified in the peer review
submissions and used a published methodology7 to assess indicator suitability. The results of this detailed
assessment are provided in Annex 1. The document reflects work-in-progress and will be updated as the
draft post-2020 global biodiversity framework and monitoring framework evolve during 2021. Further efforts
are required to identify indicators related to those areas of the monitoring framework where gaps remain
and to assess relevant indicators that become available during 2021.
2. FACTORS TO CONSIDER IN THE SELECTION AND USE OF INDICATORS IN THE MONITORING FRAMEWORK
This section outlines considerations that Parties may find useful when deliberating upon draft goals, targets
and indicators to support the monitoring framework for the post-2020 global biodiversity framework. Some
of these considerations include the drafting of SMART goals and targets, the capacity and systems to
develop indicators, issues relating to data aggregation/disaggregation, the use of headline indicators, and
enhancing synergies for indicator use across conventions and other intergovernmental processes. This
section also highlights some attributes and criteria relating to indicators that Parties may wish to consider.
2.1 The measurability of proposed goals and targets of the post-2020 framework
At the second meeting of the Open-ended Working Group (OEWG) in February 2020,8 Parties recognised
the importance of including SMART goals and targets in the post-2020 global biodiversity framework.
Measurable targets provide clarity on their concepts and intentions, enhance the potential availability of
indicators and supporting datasets to track progress towards them, and facilitate assessment of progress
towards their delivery. The draft monitoring framework for the post-2020 global biodiversity framework,
which was made available for peer review in May 2020 (based on updated goals and targets requested by
the second meeting of the OEWG) included “target components” and “monitoring elements” as well as a
number of suggested indicators.9 The updated version of the draft monitoring framework (after peer review)
is presented in the Annex of document CBD/SBSTTA/24/3/Add.1.10 This version includes some changes
to the framework, such as the deletion of monitoring elements, as well as the addition of three groups of
indicators - headline, component and complementary indicators
Given the current availability of indicators and data, various target components are difficult to measure.
However, some of these gaps can be filled by ongoing work that is likely to become available during 2021,
and other gaps can be filled by targeted investment. In addition, clarity in the wording of the proposed goals
and targets as the post-2020 framework further develops will greatly assist the identification or development
of suitable indicators. In addition to available indicators, the consideration of multiple lines of evidence, such
as from scientific and participatory assessments, and expert knowledge, including with indigenous peoples
and local communities (IPLCs) will be vital in tracking progress.
2.2 Capacity and systems to produce indicators
For an indicator to effectively measure progress towards the adopted goals and targets, there will need to
be a time series with sufficient data points in line with the timeframe of the post-2020 global biodiversity
7 Tittensor, D P et al. (2014) A mid-term analysis of progress toward international biodiversity targets. Science, 346:6208, pp 241-244. Available at: https://science.sciencemag.org/content/346/6206/241
8 CBD/WG2020/2/4 9 https://www.cbd.int/sbstta/sbstta-24/post2020-monitoring-en.pdf 10 CBD/SBSTTA/24/3/Add.1
CBD/SBSTTA/24/INF/16
Page 5
framework. However, the number of data points required for specific indicators may vary depending on the
issue/component being measured.
The production of an indicator requires a monitoring system to produce primary data, such as field
observations or remote sensing of biodiversity, the compilation and analysis of the derived data, and the
presentation of the information in an accessible and useable format for end-users. Generating such
information requires sufficient resourcing. Lack of adequate resources to support this process can present
a barrier to effective monitoring of progress towards the adopted goals and targets. It is therefore important
to consider and plan for the quantity, quality and accessibility of the data and other resources required to
deliver indicators, especially through strengthened national biodiversity monitoring systems.
Having a champion institution (indicator producer or custodian agency) that has the mandate to develop,
calculate based on collated data, and regularly update the indicator is encouraged. For example, the SDG
indicator framework works on the principle that each indicator has a custodian agency which is committed
to its future production. This helps to ensure regular compilation of data and enhances the indicator’s
sustainability. Indicator producers or custodians take many forms, for example UN agencies, non-
governmental organisations, intergovernmental organisations, national government agencies, national
statistical offices, universities, and collaborations across these groups.
2.3 Roles and linkages between global and national indicators
The post-2020 global biodiversity framework will be implemented primarily at the national level. It is
therefore important that the relative roles and suitability of both global and national indicators are
considered.
The primary role of global indicators will be to measure progress at the global level towards both the
proposed goals and targets. Various global indicators will be aggregated from national level data, and/or
can otherwise be disaggregated to measure progress at the national level.11 Each indicator needs to be
conceptually valid and technically feasible for a global scale measurement. Some indicators will be direct
measurements of the target subject, such as forest extent, protected areas coverage or the use of positive
incentives. Other indicators may be indices derived from a combination of measures. Others might
represent action that has been taken, such as number of Parties that have developed national gender action
plans.
Some global scale indicators are derived from national datasets or national contributions, and the same
data can readily be used to provide indicators at national or regional scale. An example of this is protected
area coverage, where a large network of national focal points provides both spatial and associated attribute
data on national protected and conserved areas in a standardised format to UNEP-WCMC, for inclusion
and dissemination through Protected Planet12 and the World Database on Protected Areas (WDPA).13
Some global indicators are produced from data obtained by remote sensing and/or curated global scale
datasets on biodiversity features, such as forest or coral reef condition, or the status and trends in
threatened species or species populations. These subjects and datasets are often transboundary in nature
but can be disaggregated for national use. Data prepared in a globally consistent manner and
disaggregated for national use can lower the barriers to reporting for countries. However, there are
sometimes challenges when global data are downscaled for national use due to lack of resolution or
11 For example: www.ibat-alliance.org/countryprofiles, CBD/SBSTTA/23/INF/3 12 www.protectedplanet.net/ 13 https://www.protectedplanet.net/en/legal

CBD/SBSTTA/24/INF/16
Page 6
applicability at national level. Political acceptability for use, and classifications/definitions (e.g. of forests)
varies between countries, and globally-consistent approaches deployed in global databases means that
where countries have their own national datasets for similar attributes as are captured in the global
databases, global and national data and trends may not be the same in all cases.
Regional scale analyses of goals and targets, across countries or even at continental scale may often also
depend on regional-scale indicators, which can help to provide context for national targets, strategies and
reporting, including for transboundary issues such as migratory species. Similarly, many countries have
sub-national systems of government and biodiversity policy making and action, and so indicators and data
are needed at a sub-national scale. Identification of indicators that work flexibly at multiple scales is
therefore highly desirable.
2.4 Criteria for indicator selection and development
The following criteria are suggested to aid the selection of indicators. The criteria reflect the collective
experience, expertise and knowledge of the members of the Biodiversity Indicators Partnership in
supporting global and national indicator development under previous strategic plans. Few indicators will
meet all these criteria, rather they act as guiding principles to aid the selection and development of
indicators. Annex 1 to this document provides the findings from an assessment of suitability of available
indicators for the draft monitoring framework14 in relation to a number of these criteria (denoted with *):
Alignment with the goal or target, with clear evidence of how change in the indicator illustrates
change in the issue of concern. *
Availability and suitability for use at global and national scales. *
Scientific robustness – the methodology for the indicator and the underlying data are published in
a peer reviewed location that can be accessed, and the methodology can be repeated by other
scientists or agencies with the same overall result obtained.
Data are expected to be updated regularly throughout the duration of the post-2020 global
biodiversity framework, and historical data are available to determine long-term trends. *
Good geographic coverage of data (e.g. global indicator). *
Indicator already in use (e.g. by the CBD, other conventions, SDGs, the Intergovernmental
Science-Policy Platform on Biodiversity and Ecosystem Services - IPBES). *
Easily understandable: a) it is conceptually clear how the indicator relates to the goal or target, b)
in its presentation, and c) in the interpretation of the data.
“Championed” by an institution responsible for the indicator’s continued availability and
communication. *
Balanced representation of both outcome and process/effort-related related indicators.
2.5 Use of headline indicators in the post-2020 monitoring framework
Information document CBD/SBSTTA/23/INF/415 considers the different models used to track progress
towards the Sustainable Development Goals (SDGs) and the current Strategic Plan for Biodiversity 2011-
2020. The SDGs have an agreed official list of indicators, whereas the current Strategic Plan for Biodiversity
14 https://www.cbd.int/sbstta/sbstta-24/post2020-monitoring-en.pdf 15 CBD/SBSTTA23/INF/4

CBD/SBSTTA/24/INF/16
Page 7
has an “indicative list” that was developed by the Ad-hoc Technical Expert Group on Indicators for the
Strategic Plan 2011-2020 and welcomed at the 13th meeting of the Conference of the Parties (Decision
XIII/28).16 However, there has been limited uptake in the use of indicators from the indicative list by Parties,
according to an assessment of Sixth National Reports conducted by NatureServe.17 This seems to be partly
due to the delayed identification of global indicators for the Aichi Biodiversity Targets after their adoption.
Also, Parties mostly used their own indicator methodologies, thereby making it difficult to aggregate
collective national progress to determine global progress. For the global assessments of progress towards
the Aichi Biodiversity Targets, indicator results have been compiled with the assistance of the Biodiversity
Indicators Partnership.
The notion of a list of “headline” indicators for use by Parties in their national reports for reporting on their
implementation of the post-2020 global biodiversity framework has been raised on various occasions during
the development of the post-2020 global biodiversity framework. This idea was further explored in
information document CBD/SBSTTA23/INF/3.18 A proposed list of headline indicators is now available in
documents CBD/SBSTTA/24/319 and CBD/SBSTTA/24/3Add.120 with suggested recommendations for
Parties to use headline indicators in their national reports, along with additional indicators (component and
complementary indicators) as appropriate and according to national circumstances. A brief analysis linking
suitable and available indicators with the proposed headline indicators is provided in Annex 3.
An internationally agreed set of headline indicators could help prioritise efforts to ensure consistency in
methodology and data collection processes to enable aggregation from national to global scale. Agreement
on a set of headline indicators that are quantitative, consistent and comparable across countries could help
achieve greater transparency and measurability between global and national targets. This could also allow
a cumulative assessment of the responses taken across countries and their impacts on outcomes to identify
whether national commitments and implementation are on track to meet the post-2020 global biodiversity
targets and goals.21 Importantly, it could also enable the identification of priority capacity and resource
needs to support implementation of the post-2020 global biodiversity framework.
2.6 Indicators that are used to measure progress towards other conventions and intergovernmental processes
The post‑2020 global biodiversity framework is intended to be a universal framework and it is highly
preferable that the indicators used in the framework are useful across biodiversity-related conventions and
intergovernmental processes, including the 2030 Agenda for Sustainable Development. This will enable
consistent messaging and reduce costs and the reporting burden placed on Parties. UNEP-WCMC
assessed the suitability of all available indicators proposed via peer review (see section 3 of this document)
and recorded whether available indicators are being used in the SDG global indicator framework, other
conventions and intergovernmental processes (e.g. IPBES). The results from this assessment demonstrate
that out of 155 available and suitable indicators for the draft goals and targets (Annex 1 and 2), 64 are being
used to monitor progress towards SDGs, and 39 are being used for other conventions or intergovernmental
processes. Drawing on indicators from across conventions and intergovernmental processes could help to
16 Decision XIII/28 17 Bhatt, R et al. (2020) Analysis of the Use of Indicators in the 6th National Reports for the Secretariat of the Convention on Biological Diversity. NatureServe Technical Report for the Secretariat of the Convention on Biological Diversity. Arlington, Virginia. 18 CBD/SBSTTA23/INF/3 19 CBD/SBSTTA/24/3 20 CBD/SBSTTA/24/3Add.1 21 CBD/SBSTTA23/INF/3

CBD/SBSTTA/24/INF/16
Page 8
reduce the reporting burden and promote the effective use of resources at all scales for the monitoring of
progress towards the post-2020 goals and targets.
2.7 Gender considerations
Submissions from Parties and relevant stakeholders on the scope and content of the post-2020 framework
have frequently stated the importance of effectively addressing gender considerations in the post-2020
framework22 and this important consideration is reflected in Decision 14/34,23 which states that efforts
should be made to advance the collection, analysis and use of gender-sensitive data, including data
disaggregated by sex.24 A number of gender-specific indicators were proposed by UN Women and other
stakeholders via peer review, including indicators currently available from the SDG indicator framework that
could be used to monitor progress towards key elements of a proposed gender-specific target.25 As
suggested by several stakeholders, a practical way to mainstream gender across the framework would be
to disaggregate relevant indicators across the monitoring framework by sex when feasible.26
2.8 Indigenous and local knowledge considerations
In Decision XIII/28, the CBD COP adopted four indicators to measure progress towards Aichi Target
18.27There has been little progress towards their operationalization.28 As suggested in submissions from
peer review, a technical process may assist with further developing these indicators so that they are
operational by COP16. This is in line with Decision14/1729 to consider the development of a fully integrated
programme of work on Article 8(j) and related provisions within the post-2020 biodiversity framework.
Submissions from Parties and observers have suggested that the post-2020 framework should integrate
biological and cultural diversity in a way that avoids a dichotomy between nature and culture, in line with
the recommendations of the global dialogue for IPLCs on the post-2020 framework.30 This can be done by
including cross-cutting indicators that acknowledge sub-national and local community levels under various
goals and targets, and disaggregating data by IPLCs (population group). For example, indicators of
resilience developed in the context of Socio-ecological Production Landscapes31 and the Arctic Social
Indicators32 follow this approach.
22 CBD/WG2020/1/INF/1 23 Decision 14/34 24 Decision 14/18 25 CBD/SBSTTA/23/INF/17 26 UN Women (Notification 2019-075), CBD/WG2020/1/INF/1 and submissions in response to Notification 2020-045 from UN Women, CBD Women Caucus, Society of Ecological Restoration, Avaaz, Global Youth Biodiversity Network, CGIAR, CIAT, IUCN, Alianza Mexicana para la Biodiversidad, IIED, ICCA Consortium, Africa Civil Society Organizations and Biodiversity Alliance. 27 Decision XIII/28, Target 18 - By 2020, the traditional knowledge, innovations and practices of indigenous and local communities
relevant for the conservation and sustainable use of biodiversity, and their customary use of biological resources, are respected, subject to national legislation and relevant international obligations, and fully integrated and reflected in the implementation of the Convention with the full and effective participation of indigenous and local communities, at all relevant levels 28 CBD/SBI/3/2/Add.4 29 Decision 14/17 30 CBD/POST2020/WS/2019/12/2 31 UNU-IAS (2013) Indicators of Resilience in Socio-ecological Production Landscapes, Policy Report. Available at: www.bioversityinternational.org/fileadmin/user_upload/online_library/publications/pdfs/Indicators_of_Resilience_in_Socio-ecological_Production_Landscapes__SEPLs__1676.pdf 32 Nordic Council of Ministers (2015) Arctic Social Indicators: ASI II: Implementation. Available at: http://norden.diva-portal.org/smash/record.jsf?pid=diva2%3A789051&dswid=4203

CBD/SBSTTA/24/INF/16
Page 9
2.9 Emerging indicators using remote sensing and novel technology
There are ongoing efforts that involve the use of emerging technologies and remote sensed data flows to
generate indicators of various attributes of relevance to the monitoring framework. A number of these
technology driven indicators should become available during 2021, and offer the potential of regular
updates (e.g. annual), global fine scale coverage (down to 10 metre resolution), addressing various
ecosystems and threat elements of the monitoring framework.
3. AVAILABLE INDICATORS FOR THE POST-2020 FRAMEWORK
3.1 Methodology used for identifying available indicators
The CBD Secretariat issued an open invitation (notification 2020-045) for Parties and observers to
participate in the peer review of three draft documents related to Agenda Item 3 (Post-2020 global
biodiversity framework) in preparation for SBSTTA 24.33 UNEP-WCMC reviewed all submissions relating
to the ‘Draft monitoring framework for the post-2020 global biodiversity framework’ and the ‘Information
Document on indicators for the post-2020 global biodiversity framework’.34
All indicator-specific comments from submissions were recorded with the objective of identifying available
indicators and assessing their suitability for monitoring progress towards specific components of the draft
goals and targets. If conflicting information was provided in different submissions regarding a specific
indicator, data was confirmed by contacting the indicator provider, or in the case of SDG indicators by
checking the indicator metadata and database.35 Indicator proposals from Parties and observers were
mapped to goal and target components based on the details provided within their original submissions.
Indicator proposals were organised under four categories:
Gap filling – indicator suggestions for a monitoring element where indicators were missing in the
draft monitoring framework
New indicators – alternative indicator suggestions that were not included in the draft monitoring
framework or information document
Modification of an indicator – suggestions for updating the wording or data of specific indicators
Deletion of indicator – where a comment suggested removing an indicator that was proposed in
the monitoring framework or the information document
Indicators were then further organised following a decision tree process (see Annex 4), and for those
indicators suitable for assessment the following data was compiled through internet searches:
The responsible institution
Whether indicators are currently available, or are under development
Tentative year of availability for indicators under development
Year of last update of available indicators
Time series and frequency of updates
Whether the methodology was available for national use
33 Notification 2020-045. For Agenda Item 3 draft documents, review guidelines and submission templates see
www.cbd.int/sbstta24/review.shtml 34 www.cbd.int/conferences/post2020/submissions/2020-045 35 https://unstats.un.org/sdgs/metadata, https://unstats.un.org/sdgs/indicators/database/

CBD/SBSTTA/24/INF/16
Page 10
Whether data collection occurs at the global scale, and data can be disaggregated for national use
Whether data are collected at the national level (e.g. by national statistic offices) and can be
aggregated to form a global indicator
Whether the indicator is an official SDG indicator
Whether the indicator is used in other conventions or intergovernmental processes (e.g. IPBES)
On completion, available indicators identified were assessed for their suitability for monitoring progress
toward the specific goals and targets for which they were proposed.
3.2 Methodology used to assess the suitability of available indicators
A total of 399 unique indicators were identified and assessed. The methodology used to assess indicator
suitability is a published methodology developed by Tittensor et al. (2014),36 which was also used by
Chenery et al. (2015)37 and Mcowen et al. (2016)38 to assess indicators for the Aichi Biodiversity Targets.
This methodology provides a clear and transparent means to directly compare indicators in a consistent
manner. The methodology enabled indicator assessment under the following three criteria:
Alignment: how well the indicator aligns to the text of the relevant monitoring element
Temporal relevance: Number of data points available for the period 2010-2020
Spatial coverage: Number of countries and continents for which data is available
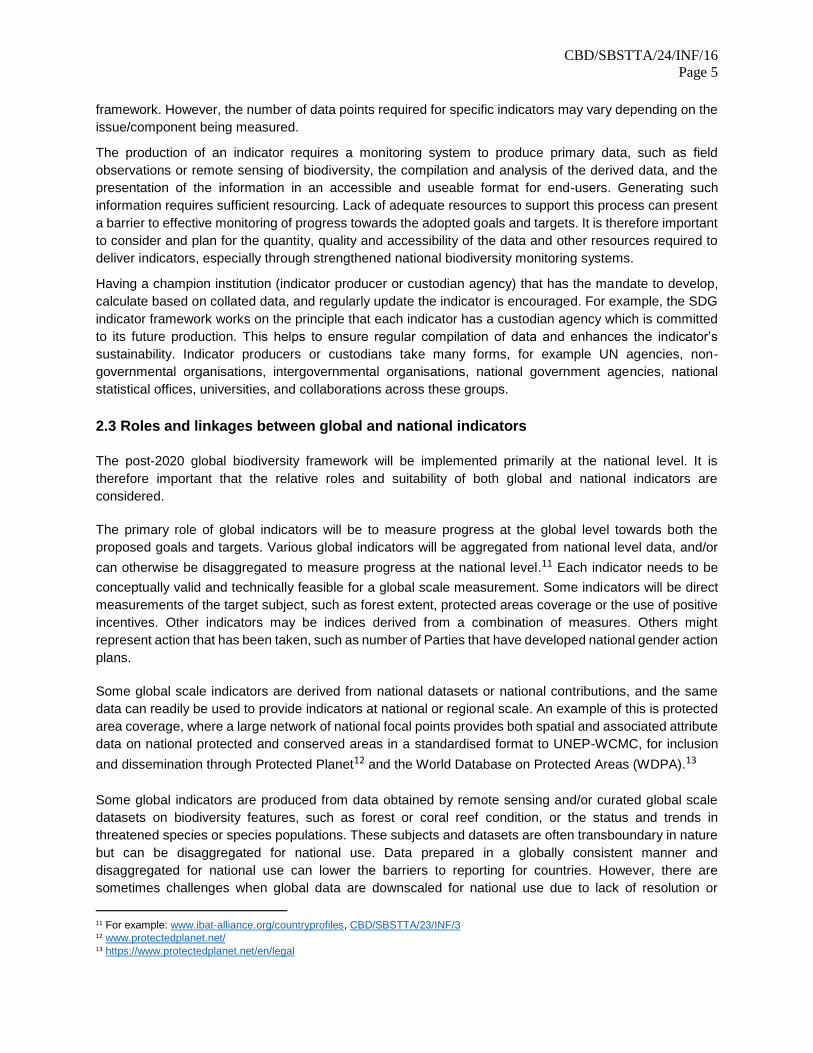
Each indicator assessed was given a score from 1-3 for each criterion, 3 being high/good, 2 being
medium/moderate, and 1 being low/poor. The scoring thresholds applied to each of the three criteria are
presented in Table 1 below. The combined score for each indicator assessed was calculated by bringing
together the individual scores for the three criteria, giving a maximum score of 9.
Table 1. Scoring thresholds applied for each criteria of the assessment of suitability
Score Alignment to
monitoring element Temporal relevance Spatial coverage
High/Good
(3 points)
As defined by Tittensor et al. (2014)
Total of ≥5 data points available for 2010-2020
‘Good’, as defined by Tittensor et al. (2014):
5 + continents (>20
countries total)
Medium/ Moderate
(2 points)
As defined by Tittensor et al. (2014)
3-4 data points are available between 2010-2020
‘Moderate’, as defined by Tittensor et al. (2014):
3-4 continents (>10
countries total);
5 + continents (<20
countries total)
36 Tittensor, D P et al. (2014) A mid-term analysis of progress toward international biodiversity targets. Science, 346:6208, pp 241-
244. Available at: https://science.sciencemag.org/content/346/6206/241 37 UNEP/CBD/ID/AHTEG/2015/1/INF/1/REV1 38 Mcowen, C J et al. (2016) Sufficiency and Suitability of Global Biodiversity Indicators for Monitoring Progress to 2020 Targets. Conservation Letters, 9:6, pp 489-494. Available at: https://conbio.onlinelibrary.wiley.com/doi/full/10.1111/conl.12329
CBD/SBSTTA/24/INF/16
Page 11
Low/Poor
(1 point)
As defined by Tittensor et al. (2014)
≤2 data points are available between 2010-2020
‘Poor’, as defined by Tittensor et al. (2014):
1-2 continents (no matter
how many countries);
3-4 continents (<10
countries total)
Unknown
N/A - all “available” indicators were assessed for alignment
Number of data points could not be validated e.g., data could not be accessed/was not publicly available, nor provided by institution responsible for indicator
Spatial coverage could not be accessed/validated e.g., data could not be accessed/ were not publicly available and no further information was provided by institution responsible for indicator
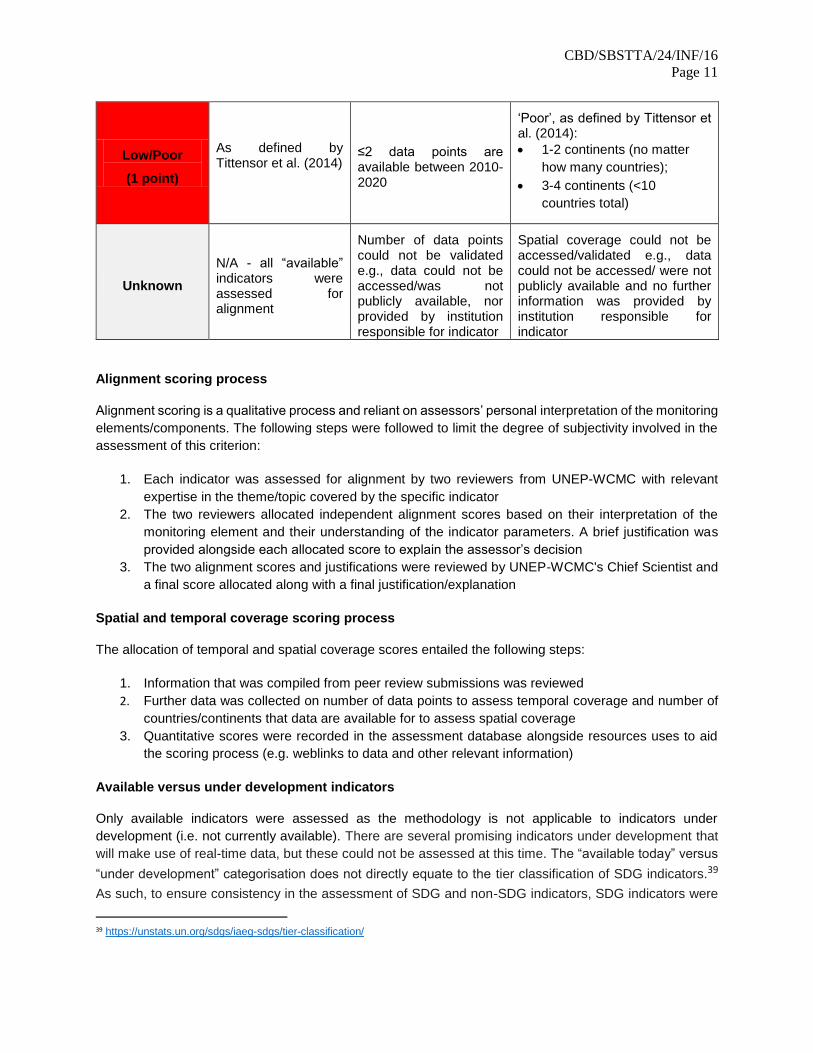
Alignment scoring process
Alignment scoring is a qualitative process and reliant on assessors’ personal interpretation of the monitoring
elements/components. The following steps were followed to limit the degree of subjectivity involved in the
assessment of this criterion:
1. Each indicator was assessed for alignment by two reviewers from UNEP-WCMC with relevant
expertise in the theme/topic covered by the specific indicator
2. The two reviewers allocated independent alignment scores based on their interpretation of the
monitoring element and their understanding of the indicator parameters. A brief justification was
provided alongside each allocated score to explain the assessor’s decision
3. The two alignment scores and justifications were reviewed by UNEP-WCMC's Chief Scientist and
a final score allocated along with a final justification/explanation
Spatial and temporal coverage scoring process
The allocation of temporal and spatial coverage scores entailed the following steps:
1. Information that was compiled from peer review submissions was reviewed
2. Further data was collected on number of data points to assess temporal coverage and number of
countries/continents that data are available for to assess spatial coverage
3. Quantitative scores were recorded in the assessment database alongside resources uses to aid
the scoring process (e.g. weblinks to data and other relevant information)
Available versus under development indicators
Only available indicators were assessed as the methodology is not applicable to indicators under
development (i.e. not currently available). There are several promising indicators under development that
will make use of real-time data, but these could not be assessed at this time. The “available today” versus
“under development” categorisation does not directly equate to the tier classification of SDG indicators.39
As such, to ensure consistency in the assessment of SDG and non-SDG indicators, SDG indicators were
39 https://unstats.un.org/sdgs/iaeg-sdgs/tier-classification/

CBD/SBSTTA/24/INF/16
Page 12
only marked as available and therefore assessed, if data could be accessed via the SDG indicator
website.40 A low/poor temporal score with an "unknown" justification was recorded in cases where the data
seemed to exist but could not be accessed/verified on the SDG indicator website. An SDG indicator was
marked as “under development” (and therefore excluded from analysis) in cases where a recently published
meta-datasheet (e.g. published in 2020) stated that data collection was anticipated to take place soon.
3.3 Suitable indicators for the draft goals and targets
The output from the suitability assessment is a list of high scoring and medium scoring indicators that are
suitable for monitoring progress towards goals and targets (Annex 1). All of these indicators currently exist
(available now), are “championed” by a responsible institution, and have a high likelihood of continued
production in the period after 2020.
For each component of the draft goals and targets, indicators that scored between 7 and 9 (maximum
score) in the assessment were considered “high scoring” and included in the final table (Annex 1).
Indicators that scored between 5 and 6 were also included as these indicators were well-aligned, relevant
and in some cases could potentially fill indicator gaps. An indicator gap was recorded where no indicators
scored between 5-9. Due to the methodology used, there are a number of duplicates within Annex 1 as the
same indicator may provide a means of monitoring progress towards multiple monitoring components and
may score high in one area but medium in another. Furthermore, there are a few “multipurpose” indicators
that can be disaggregated (e.g. by habitat, taxonomy), to report against various specific components of
goals and/or targets.
In total, 155 indicators41 were identified that are suitable for use to monitor progress towards the draft goals
and targets (Annex 2). Furthermore, many of them also feature in the list of proposed headline indicators
for the post-2020 global biodiversity framework42 or can be useful sources of data to feed into specific
proposed headline indicators (Annex 3).
3.4 Gaps in the current suite of indicators available for the post-2020 framework
The assessment of available indicators for the draft monitoring framework, with its 4 goals and their 14 components, and 20 targets and their 68 components, resulted in five target components having a gap of no high or medium suitability score indicators:
2.7. Integration into landscape and seascape context
3.2. Reduced human-wildlife conflicts
5.5. Eradication, control or management of IAS in priority sites
6.2. Reduction of pollution from biocides
19.4. Availability of research and knowledge, including traditional knowledge, innovations and practices of indigenous peoples and local communities with their free, prior and informed consent
Three goal components and twelve target components had an indicator gap of no high scoring indicators, but they do have one or more medium scoring indicators (Annex 1).
40 https://unstats.un.org/sdgs/metadata/ and https://unstats.un.org/sdgs/indicators/database/ 41 155 indicators discounting RLI and LPI sub-indicators/disaggregations. Otherwise, 174 if counting all RLI and LPI sub-indicators 42 CBD/SBSTTA/24/3 (Annex 1)
CBD/SBSTTA/24/INF/16
Page 13
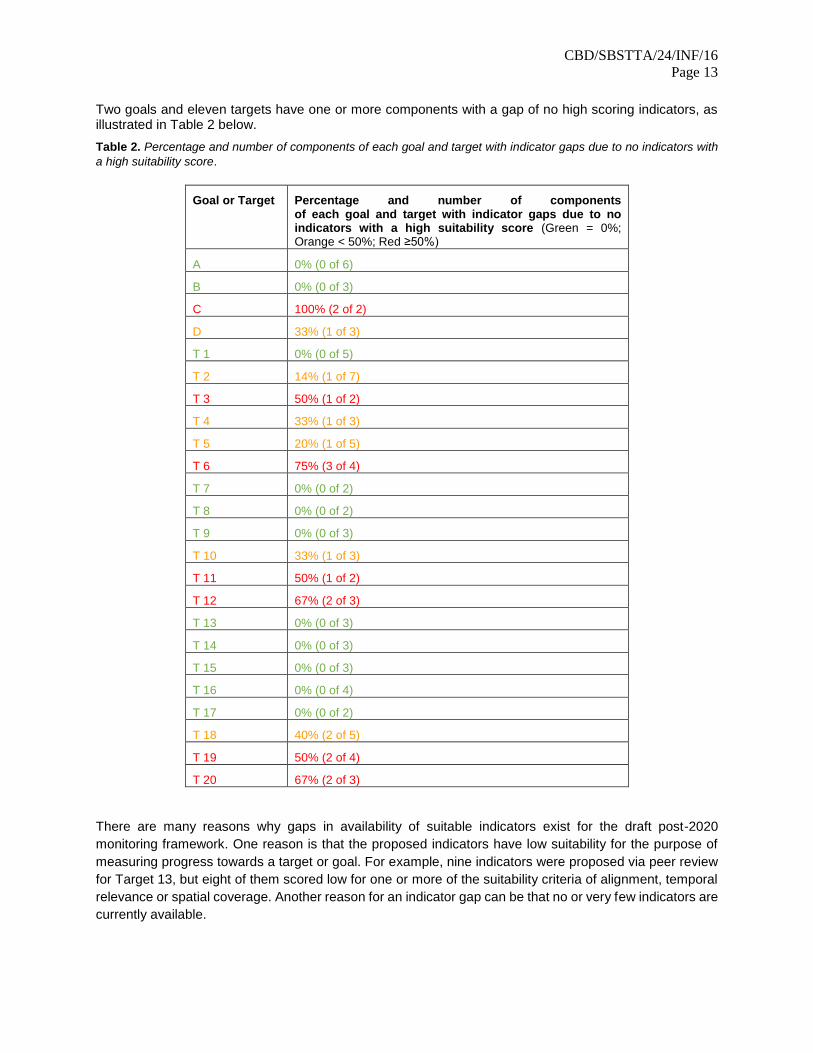
Two goals and eleven targets have one or more components with a gap of no high scoring indicators, as illustrated in Table 2 below.
Table 2. Percentage and number of components of each goal and target with indicator gaps due to no indicators with
a high suitability score.
Goal or Target Percentage and number of components of each goal and target with indicator gaps due to no indicators with a high suitability score (Green = 0%; Orange < 50%; Red ≥50%)
A 0% (0 of 6)
B 0% (0 of 3)
C 100% (2 of 2)
D 33% (1 of 3)
T 1 0% (0 of 5)
T 2 14% (1 of 7)
T 3 50% (1 of 2)
T 4 33% (1 of 3)
T 5 20% (1 of 5)
T 6 75% (3 of 4)
T 7 0% (0 of 2)
T 8 0% (0 of 2)
T 9 0% (0 of 3)
T 10 33% (1 of 3)
T 11 50% (1 of 2)
T 12 67% (2 of 3)
T 13 0% (0 of 3)
T 14 0% (0 of 3)
T 15 0% (0 of 3)
T 16 0% (0 of 4)
T 17 0% (0 of 2)
T 18 40% (2 of 5)
T 19 50% (2 of 4)
T 20 67% (2 of 3)
There are many reasons why gaps in availability of suitable indicators exist for the draft post-2020
monitoring framework. One reason is that the proposed indicators have low suitability for the purpose of
measuring progress towards a target or goal. For example, nine indicators were proposed via peer review
for Target 13, but eight of them scored low for one or more of the suitability criteria of alignment, temporal
relevance or spatial coverage. Another reason for an indicator gap can be that no or very few indicators are
currently available.
CBD/SBSTTA/24/INF/16
Page 14
For some topics in the post-2020 global biodiversity framework there may be indicator gaps because they
are new issues or dimensions not yet fully reflected in international processes, and so indicators and data
sets with custodian agencies have not yet been developed at a global scale. Examples of such topics
include Target 6.3 (Reduction of pollution from plastic), and Target 11.1 (Access to green/blue spaces). In
a few cases the lack of suitable indicators may be because the subject of a Target is difficult to define in a
measurable form, and particularly for measurement at the global scale.
The peer review of the draft monitoring framework has generated many proposals for available (existing)
indicators and indicators under development that could be used to measure progress. Many of the
indicators that did not score high in the suitability assessment (e.g. low scores in temporal and spatial
coverage) could potentially be further developed to fill gaps in the draft monitoring framework. The
assessment process also recorded the proposed indicators that are under development and which have
not yet been published, or do not yet have sufficient data for use. This information will be a valuable
resource for future work to fill indicator gaps.
4. BASELINES TO INFORM PROGRESS TOWARDS GOALS AND TARGETS IN THE POST-2020 GLOBAL BIODIVERSITY FRAMEWORK
Baselines set the context within which indicator trends can be evaluated and should be measurable
and relevant to the desired goal or target outcome. Baselines can be set with reference to a directly
observable record/state or can be inferred using models or proxies if direct observations are not possible.43
While the issue of baselines has not yet been substantively discussed in the context of the development of
the post-2020 global biodiversity framework, various options and considerations have been expressed
through submissions or interventions, including:
Pre-human disturbance: Such a baseline might be relevant for some measures of the status of
biodiversity, for instance using a baseline of potential natural vegetation.44 This baseline relies on
the use of proxies or inference from models. Proxies might include the state of more intact
ecosystems in the present, whilst models could be used to infer the potential state prior to human
(direct or indirect) disturbance. Such models and layers of intactness are currently available at a
global scale but include a high degree of uncertainty. Setting up a pre-human disturbance baseline
would allow for the consideration of the history and context of a given region, although the
uncertainties inherent in modelling potential states of natural vegetation at national level are high
and such a baseline would only be relevant for a relatively small number of the draft goals and
targets.
Pre-industrial (e.g. around 1750): Most global impacts on biodiversity have occurred since
industrialisation. A pre-industrial baseline could be difficult to measure as such historical data are
not available for most indicators and those that do contain a greater level of uncertainty than more
recent data-points. Such baselines could be inferred as above, and although levels of uncertainty
remain significant, available global datasets could be supplemented with national data on habitats
or land use. As above, such a baseline would only be relevant for a relatively small number of the
draft goals and targets.
43 UNEP/CBD/SBSTTA/9/10 44 Ministry of Foreign Affairs of Brazil (2013) Submission of views on possible targets, indicators and baselines for the post-2020
biodiversity framework. See: www.cbd.int/api/v2013/documents/2478769B-D32A-CBFE-1936-4D2895EF9F61/attachments/Brazil-3.pdf

CBD/SBSTTA/24/INF/16
Page 15
1970: A 1970 baseline has been used in the IPBES Global Assessment Report on Biodiversity and
Ecosystem Services and other recent assessments. The last 50 years has seen a global
intensification of agricultural practices, harvesting and trade of resources and urbanisation, caused
by technological changes and expanding global population and consumption. Although most
indicators based on remote sensing are not able to provide data back to 1970, sufficient data exists
to measure some indicators from a 1970 baseline.
Recent: More recent baselines may also be considered. For example, these could be linked to
events such as the adoption of the CBD, or the year 2000 (representing a new millennium and two
decades to 2020), or the year 2010 relating to progress towards the 2010 target and the year of
the adoption of the Strategic Plan for Biodiversity 2011-2020. In relation to trends, the most data-
rich baselines are the periods between 2000, 2010, and 2020. This includes data that is more
widely available across regions and taxonomic groups, and data-points with lower levels of
uncertainty. However, a recent baseline would de-emphasise the significant changes to biodiversity
that have occurred prior to the current century.
2020: A current-day baseline (or recent trends during the most recent decade) would allow efforts
to be focused on the improvement of the recent and existing state of indicators. It emphasizes
recovery and removes the requirement to estimate historical states. However, a 2020 baseline, as
with the 2000 baseline, de-emphasises the trends in biodiversity and responses prior to this date,
and due to the lag-time in reporting and compilation, many data are not yet available for the
assessment of 2020 baselines.
5. TRACKING PROGRESS TOWARDS THE GOALS AND TARGETS OF THE POST-2020 FRAMEWORK
As part of the overall monitoring framework for the post-2020 global biodiversity framework, a robust and
comprehensive means of tracking progress in as near real time as possible will be crucial to help Parties
understand where additional efforts, resources and capacity may be required. Ongoing tracking of progress
will enable Parties to proactively prioritize action and promote adaptive management to accelerate
implementation towards the adopted goals and targets of the post-2020 global biodiversity framework.
At present much information on progress towards global goals and targets is scattered across multiple
sources and irregularly updated. No single platform currently exists that brings together the information
needed to provide an ongoing assessment of progress towards global biodiversity targets in an accessible
and visually compelling way. Efforts are therefore underway to explore a target tracking tool that could take
the form of an online data platform, displaying progress towards the post-2020 goals and targets at global,
regional and national levels. Such a tool would also assist those who wish to explore national level data
and its availability.
To provide a regularly updated status of progress towards the targets, such a tool will need to draw upon
updates of global, regional, and national indicators from a range of indicator data sources from many
institutions including those within the Biodiversity Indicators Partnership and where possible also benefit
from national reporting data showcasing national contributions to the global targets. Capacity building
efforts and significant additional resources will be needed to further enhance data collection and data
management at the national level.
6. FINAL REMARKS AND CONCLUSIONS
The development of a post-2020 monitoring framework presents an opportunity for enhanced approaches
towards monitoring, reporting and review, which are essential elements for the successful implementation
CBD/SBSTTA/24/INF/16
Page 16
of the future global biodiversity framework. The development of the monitoring framework for the post-2020
global biodiversity framework is able to benefit from the lessons derived from monitoring progress under
the Strategic Plan for Biodiversity 2011-2020, the 2030 Agenda, and other processes.
An analysis of suitable indicators for use in the monitoring framework for the post-2020 global biodiversity
framework has identified 155 available indicators that are well-aligned with the proposed goals and targets.
However, key indicator gaps in some goals and targets remain. Additional work is required to identify and/or
develop suitable indicators to fill these gaps.
When considering the future use of indicators to track progress in the implementation of the post-2020
global biodiversity framework, Parties may wish to reflect on the following:
Wording of goals and targets: Measurability (quantitative or qualitative) of goals and targets
remains key to the identification of suitable indicators for the monitoring framework, and the specific
wording of goals and targets is important in this regard.
Criteria for indicator selection: Indicator selection requires careful consideration of criteria
around data availability (spatial and temporal), robust and transparent methodology, global and
national suitability, and alignment with goals and targets. Annex 1 of this document may serve as
a useful resource, as all indicators have been assessed on this basis.
Alignment with other processes: Identifying indicators which can align with other relevant
reporting processes including the 2030 Agenda and its Sustainable Development Goals,
biodiversity-related conventions and other intergovernmental processes remains a priority, both for
consistency and cost-effectiveness.
Headline indicators: Establishment of a set of headline indicators can support consistent national
reporting on the implementation of the post-2020 global biodiversity framework and enhance
transparency and measurability between global and national targets. The analyses presented in
this document show that there are many suitable indicators that can be disaggregated to national
level or are otherwise aggregated from national data and could therefore be considered as
proposed headline indicators or replace those that are not yet operational (CBD/SBSTTA/24/3).
Component and complementary indicators: Any future selection of indicators for the two further
proposed groups of ‘component’ and ‘complementary’ indicators to support the suite of headline
indicators (CBD/SBSTTA/24/3Add.1) can be underpinned by the scientifically rigorous
methodology applied in the analysis presented in this document.
Indicators under development: While the analysis presented in this document has focused on
the current availability of indicators, the peer review process has also highlighted several promising
indicators under development especially those relying on remotely sensed near-real time data
which, once available for use, would complement those already available. In this respect, flexibility
of the evolving monitoring framework to accommodate new and more suitable indicators will be
important.
Development and support of institutional capacity at national level to provide up-to-date and
timely information is necessary for ensuring sustainable delivery of the necessary indicators.
Data disaggregation: Opportunities for deriving disaggregated data from indicators (e.g.
geospatial, sex, population group and age) for the framework need further investigation.
Indicator baselines: The availability of data from suitable indicators may be useful in supporting
the selection of baselines across the indicator suite.
Tracking progress: Bringing together indicator information into a single tool to help track progress
in an accessible and visually compelling way will assist Parties to proactively prioritise action and
promote adaptive management to accelerate implementation towards the adopted goals and

CBD/SBSTTA/24/INF/16
Page 17
targets of the post-2020 global biodiversity framework. Such an approach would also allow for
ongoing global “stocktaking” of progress.
As the draft monitoring framework further develops during 2021, updated versions of the analyses
presented in this document and its annexes will be made available as a resource for Parties and observers.

CBD/SBSTTA/24/INF/16
Page 18
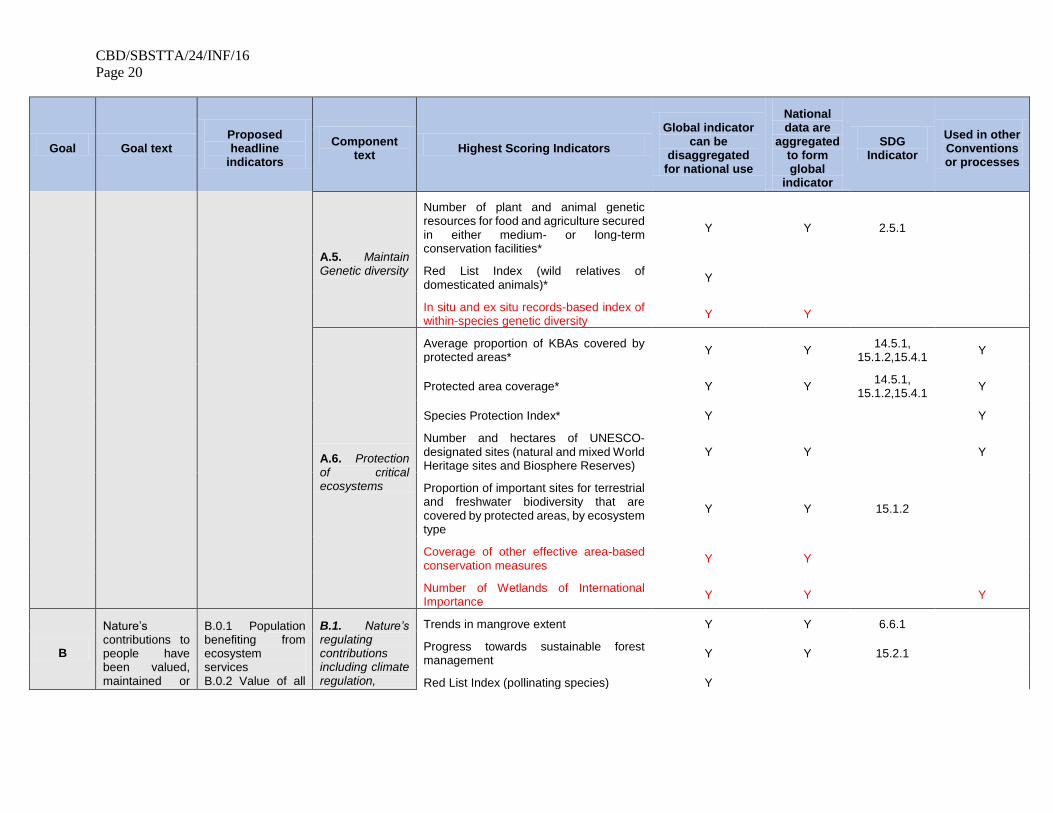
Annex 1
Available and suitable indicators for the draft post-2020 monitoring framework
High scoring indicators (9-7 score) in black text - *denotes maximum score (9 out of 9), Medium scoring indicators (6-5 score) in red text (well-aligned and
relevant to the goal component)
Goal Goal text Proposed headline
indicators
Component text
Highest Scoring Indicators
Global indicator can be
disaggregated for national use
National data are
aggregated to form global
indicator
SDG Indicator
Used in other Conventions or processes
A
The area, connectivity and integrity of natural ecosystems increased by at least [X%] supporting healthy and resilient populations of all species while reducing the number of species that are threatened by [X%] and maintaining genetic diversity 2030 Milestones i) The area, connectivity and integrity of natural ecosystems increased by at least [5%] ii)
A.0.1 Extent of selected natural ecosystems (forest, savannahs and grasslands, wetlands, mangroves, saltmarshes, coral reef, seagrass, macroalgae and intertidal habitats) A.0.2 Living Planet Index A.0.3 Red list index A.0.4 Species habitat index A.0.5 The proportion of populations maintained within species
A.1. Increased extent of natural ecosystems (terrestrial, freshwater and marine ecosystems)
Change in the extent of water-related ecosystems over time*
Y Y 6.6.1 Y
Forest area as a percentage of total land area
Y Y 15.1.1
Live Cover via Vegetation Continuous Fields
Y
Tree cover loss Y
Trends in mangrove extent Y Y 6.6.1 Y
Biodiversity Habitat Index Y Y
Continuous Global Mangrove Forest Cover
Y
Live coral cover Y
Water Turbidity and an estimate of Trophic State Index
Y Y
A.2. Ecosystem integrity and connectivity (terrestrial, freshwater and marine ecosystems)
Global trends in mangrove forest fragmentation*
Y
Relative Magnitude of Fragmentation* Y
Species Habitat Index* Y Y
Forest area as a percentage of total land area
Y Y 15.1.1

CBD/SBSTTA/24/INF/16
Page 19
Goal Goal text Proposed headline
indicators
Component text
Highest Scoring Indicators
Global indicator can be
disaggregated for national use
National data are
aggregated to form global
indicator
SDG Indicator
Used in other Conventions or processes
The number of species that are threatened is reduced by [X%] and the abundance of species has increased on average by [X%]
Forest Landscape Integrity Index Y
Global Vegetation Health Products - Vegetation Health Index
Y
Living Planet Index - Forest Specialists Y
Ocean Health Index Y Y
Red List Index (forest-dependent species) Y
Red List Index (marine species) Y
Red List Index (wetland species) Y
Tree cover loss Y
Water Turbidity and an estimate of Trophic State Index
Y 6.6.1
Change in the extent of water-related ecosystems over time
Y Y 6.6.1
Progress towards sustainable forest management
Y Y 15.2.1
A.3. Prevent extinction and improve the conservation status of species
Percentage of threatened species that are improving in status according to the Red List*
Y
Red List Index* Y 15.1.1 Y
EDGE Index Y
Species Protection Index Y Y
A.4. Increase the population and health of species
Changes in plankton biomass and abundance*
Y Y
Living Planet Index* Y Y
Species Habitat Index Y Y
CBD/SBSTTA/24/INF/16
Page 20
Goal Goal text Proposed headline
indicators
Component text
Highest Scoring Indicators
Global indicator can be
disaggregated for national use
National data are
aggregated to form global
indicator
SDG Indicator
Used in other Conventions or processes
A.5. Maintain Genetic diversity
Number of plant and animal genetic resources for food and agriculture secured in either medium- or long-term conservation facilities*
Y Y 2.5.1
Red List Index (wild relatives of domesticated animals)*
Y
In situ and ex situ records-based index of within-species genetic diversity
Y Y
A.6. Protection of critical ecosystems
Average proportion of KBAs covered by protected areas*
Y Y 14.5.1,
15.1.2,15.4.1 Y
Protected area coverage* Y Y 14.5.1,
15.1.2,15.4.1 Y
Species Protection Index* Y Y
Number and hectares of UNESCO-designated sites (natural and mixed World Heritage sites and Biosphere Reserves)
Y Y Y
Proportion of important sites for terrestrial and freshwater biodiversity that are covered by protected areas, by ecosystem type
Y Y 15.1.2
Coverage of other effective area-based conservation measures
Y Y
Number of Wetlands of International Importance
Y Y Y
B
Nature’s contributions to people have been valued, maintained or
B.0.1 Population benefiting from ecosystem services B.0.2 Value of all
B.1. Nature’s regulating contributions including climate regulation,
Trends in mangrove extent Y Y 6.6.1
Progress towards sustainable forest management
Y Y 15.2.1
Red List Index (pollinating species) Y

CBD/SBSTTA/24/INF/16
Page 21
Goal Goal text Proposed headline
indicators
Component text
Highest Scoring Indicators
Global indicator can be
disaggregated for national use
National data are
aggregated to form global
indicator
SDG Indicator
Used in other Conventions or processes
enhanced through conservation and sustainable use, supporting the global development agenda for the benefit of all people 2030 Milestones i) Nature contribute to the sustainable nutrition and food security, access to safe drinking water and resilience to natural disasters for at least [X] million people ii) Nature is valued through green investments, ecosystem service valuation in national accounts, and public and private sector financial disclosure
final ecosystem services (Gross Ecosystem Product)
disaster prevention and others
Level of water stress: freshwater withdrawal as a proportion of available freshwater resources
Y Y 6.4.2
Species Habitat Index Y Y
B.2. Nature’s material contributions including food, water and others
Forestry Production & Trade (Wood Fuel) Y Y
Level of water stress: freshwater withdrawal as a proportion of available freshwater resources
Y Y 6.4.2
Proportion of fish stocks within biologically sustainable levels
Y Y 14.4.1 Y
B.3. Nature’s non-material contributions including cultural
Average share of the built-up area of cities that is open space for public use for all, by sex, age and persons with disabilities
Y Y 11.7.1
Number of formal and non-formal education programmes transmitting spiritual and cultural values in the UNESCO World Network of Biosphere Reserves
Y

CBD/SBSTTA/24/INF/16
Page 22
Goal Goal text Proposed headline
indicators
Component text
Highest Scoring Indicators
Global indicator can be
disaggregated for national use
National data are
aggregated to form global
indicator
SDG Indicator
Used in other Conventions or processes
C
The benefits, from utilization of genetic resources are shared fairly and equitably 2030 Milestones i) Access and benefit sharing mechanisms are established in all countries ii) Benefits shared increased by [x%]
C.0.1 Amount of monetary benefits (in United States dollars) received by countries from utilization of genetic resources as a result of an ABS agreement, including traditional knowledge C.0.2 Number of research and development results or publications shared as a result of an ABS agreement
C.1 Access to Genetic resources
Total number of internationally recognized certificates of compliance published in the ABS Clearing-House
Y
C.2. Sharing of the benefits
Number of countries that have adopted legislative, administrative and policy frameworks to ensure fair and equitable sharing of benefits
Y Y 15.6.1 Y
D
Means of implementation is available to achieve all goals and targets the Framework 2030 Milestones i) By 2022, means to implement the Framework for the period 2020 to 2030 are identified or
D.0.1 Index of coverage of national biodiversity strategies and action plans with formal processes for ensuring that women, indigenous and local communities and youth are engaged and which capture
D.1. Availability of sufficient financial resources
Official development assistance on conservation and sustainable use of biodiversity; and (b) revenue generated and finance mobilized from biodiversity-relevant economic instruments
Y Y 15.a.1
Amount of biodiversity-related philanthropic funding
Y
Finance mobilised from domestic public expenditure for biodiversity-positive actions
Y
Total public expenditure per capita on the preservation, protection and conservation of natural heritage
Y Y 11.4.1 Y

CBD/SBSTTA/24/INF/16
Page 23
Goal Goal text Proposed headline
indicators
Component text
Highest Scoring Indicators
Global indicator can be
disaggregated for national use
National data are
aggregated to form global
indicator
SDG Indicator
Used in other Conventions or processes
committed By 2030, means to implement the Framework for the period 2030 to 2040 are identified or committed
means of implementation D.0.2 National funding for implementation of the Global Biodiversity Framework
Proportion of total research budget allocated to research in the field of marine technology
Y Y 14.A.1
Volume of official development assistance flows for scholarships by sector and type of study
Y Y 4.b.1
Total amount of funding for developing countries to promote the development, transfer, dissemination and diffusion of environmentally sound technologies
Y Y 17.7.1
D.2. Sufficient capacity building, technology transfer and scientific cooperation
Proportion of total research budget allocated to research in the field of marine technology
Y Y 14.a.1
Number of international, regional and bilateral programmes and initiatives for disaster risk reduction-related capacity-building in developing countries
Y Y Y
Volume of official development assistance flows for scholarships by sector and type of study
Y Y 4.b.1
D.3. Access to technology
Global imports of ICT goods as presented by bilateral trade flows by ICT goods categories
Y

CBD/SBSTTA/24/INF/16
Page 24
High scoring indicators (9-7 score) in black text - *denotes maximum score (9 out of 9), Medium scoring indicators (6-5 score) in red text (well-aligned and
relevant to the target component)
Target Target text Proposed headline
indicators
Component text
Highest Scoring Indicators
Global indicator can
be disaggregated
for national use
National data are
aggregated to form global
indicator
SDG Indicator
Used in other Conventions or processes
1
By 2030, [50%] of land and sea areas globally are under spatial planning addressing land/sea use change, retaining most of the existing intact and wilderness areas, and allow to restore [X%] of degraded freshwater, marine and terrestrial natural ecosystems and connectivity among them
1.0.1 Percentage of land covered by landscape scale land-use plans for terrestrial, freshwater and marine ecosystems
1.1. Increase in area of terrestrial, freshwater and marine ecosystems under spatial planning
Coverage of protected areas in relation to marine areas
Y Y 14.5.1
Forest area with long-term forest management plans
Y Y 15.2.1
Agricultural land area (% of total land area) Y Y
Degree of integrated water resources management
Y 6.5.1
1.2. Prevention of reduction and fragmentation of natural habitats due to land/sea use change
Agricultural land area (% of total land area)* Y Y
Change in the extent of water-related ecosystems over time*
Y Y 6.6.1 Y
Forest area as a percentage of total land area*
Y Y 15.1.1 Y
Species Habitat Index* Y Y
Proportion of land that is degraded over total land area*
Y Y 15.3.1
Annual Tropical Primary Tree Cover Loss Y
Forest Landscape Integrity Index Y
Living Planet Index - Forest Specialists Y
Mountain Green Cover Index Y Y 15.4.2
Percentage of cropped landscapes with at least 10% natural or semi-natural vegetation within 1km
Y
Red List Index (forest-dependent species) Y
Tree Cover Loss Y
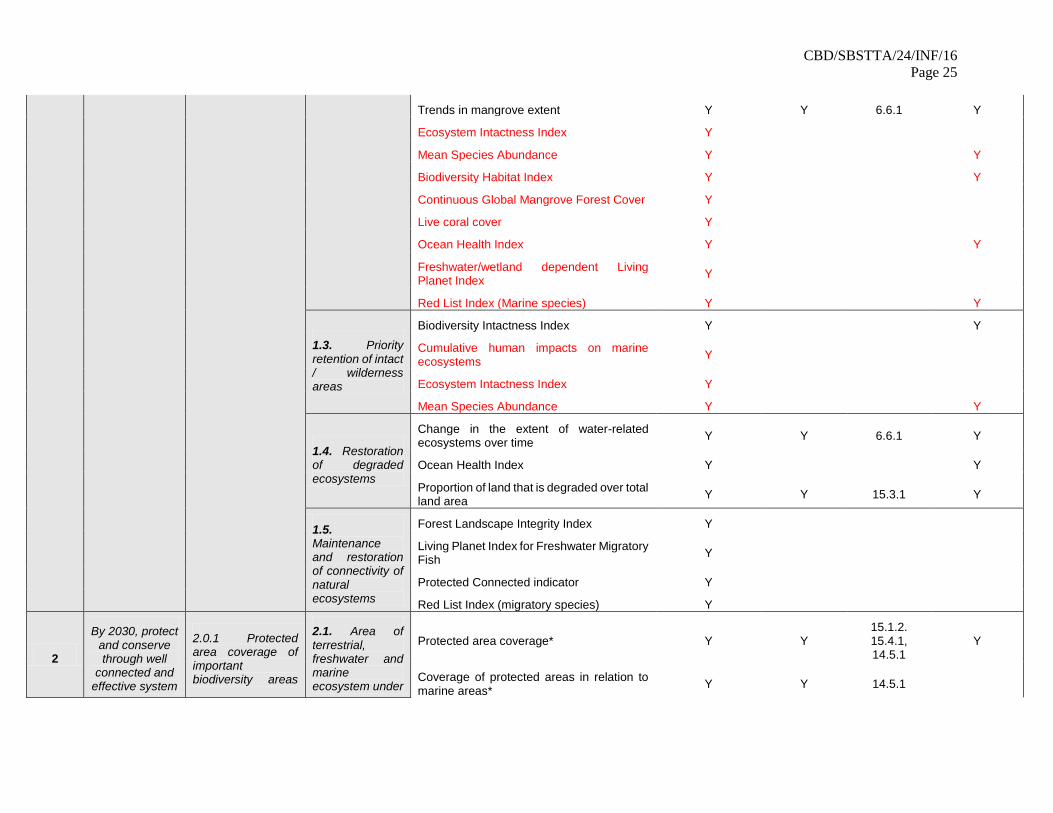
CBD/SBSTTA/24/INF/16
Page 25
Trends in mangrove extent Y Y 6.6.1 Y
Ecosystem Intactness Index Y
Mean Species Abundance Y Y
Biodiversity Habitat Index Y Y
Continuous Global Mangrove Forest Cover Y
Live coral cover Y
Ocean Health Index Y Y
Freshwater/wetland dependent Living Planet Index
Y
Red List Index (Marine species) Y Y
1.3. Priority retention of intact / wilderness areas
Biodiversity Intactness Index Y Y
Cumulative human impacts on marine ecosystems
Y
Ecosystem Intactness Index Y
Mean Species Abundance Y Y
1.4. Restoration of degraded ecosystems
Change in the extent of water-related ecosystems over time
Y Y 6.6.1 Y
Ocean Health Index Y Y
Proportion of land that is degraded over total land area
Y Y 15.3.1 Y
1.5. Maintenance and restoration of connectivity of natural ecosystems
Forest Landscape Integrity Index Y
Living Planet Index for Freshwater Migratory Fish
Y
Protected Connected indicator Y
Red List Index (migratory species) Y
2
By 2030, protect and conserve through well
connected and effective system
2.0.1 Protected area coverage of important biodiversity areas
2.1. Area of terrestrial, freshwater and marine ecosystem under
Protected area coverage* Y Y 15.1.2. 15.4.1, 14.5.1
Y
Coverage of protected areas in relation to marine areas*
Y Y 14.5.1

CBD/SBSTTA/24/INF/16
Page 26
of protected areas and other effective area-
based conservation measures at
least 30% of the planet with the focus on areas
particularly important for biodiversity
2.0.2 Species Protection Index
protection and conservation Coverage by protected areas of important
sites for mountain biodiversity Y Y 15.4.1
Progress towards sustainable forest management
Y Y 15.2.1
Coverage of other effective area-based conservation measures
Y Y
2.2. Areas of particular importance for biodiversity are protected and conserved as priority
Average proportion of KBAs covered by protected areas*
Y Y 14.5.1, 15.1.2, 15.4.1
Y
Coverage of protected areas in relation to marine key biodiversity areas*
Y Y 14.5.1 Y
Proportion of important sites for terrestrial and freshwater biodiversity that are covered by protected areas, by ecosystem type*
Y Y 15.1.2
Species Protection Index* Y Y
Coverage by protected areas of important sites for mountain biodiversity
Y Y 15.4.1
Number and hectares of UNESCO-designated sites (natural and mixed World Heritage sites and Biosphere Reserves)
Y Y Y
2.3. Representative system of protected areas and other effective area-based conservation measures
Proportion of terrestrial, freshwater and marine ecological regions which are conserved by PAs or OECMs*
Y Y 15.1.2
Species Protection Index* Y Y
Protected Area Representativeness Index Y
2.4. Effective and equitable management of the system of protected areas and other effective area-based
Protected Areas Management Effectiveness
Y Y
Trends in protected area downgrading, downsizing and degazettement
Y

CBD/SBSTTA/24/INF/16
Page 27
conservation measures
2.5. Connectivity within the system of protected areas and other effective area-based conservation measures
Protected Connected indicator Y
Protected Area Connectedness Index (PARC-Connectedness)
Y Y
Number of hectares of transnational and transboundary UNESCO-designated sites (natural and mixed World Heritage sites and Biosphere Reserves) (7)
Y Y
2.6. Increased protection and conservation effectiveness
Protected Areas Management Effectiveness
Y Y
2.7. Integration into landscape and seascape context
3
By 2030, ensure active
management actions to
enable wild species of fauna
and flora recovery and conservation, and reduce
human-wildlife conflict by [X%]
3.0.1 Protected areas management effectiveness 3.0.2 Species recovery programmes
3.1. Active recovery and conservation management actions
Number of plant and animal genetic resources for food and agriculture secured in either medium- or long-term conservation facilities*
Y Y 2.5.1
Proportion and number of threatened plant species held in ex situ conservation collections and available for reintroduction/restoration*
Y Y
Comprehensiveness of conservation of socioeconomically as well as culturally valuable species
Y
Percentage of threatened species that are improving in status according to the Red List
Y
Protected Areas Management Effectiveness
Y Y
Red List Index Y 15.5.1 Y

CBD/SBSTTA/24/INF/16
Page 28
3.2. Reduced human-wildlife conflicts
4
By 2030, ensure that the
harvesting, trade and use of wild species of fauna and flora,
is legal, at sustainable
levels and safe.
4.0.1 Proportion of traded wildlife that is legal and safe (not poached, illicitly trafficked or unsustainable) 4.0.2 Proportion of fish stocks within biologically sustainable level
4.1. Harvest is legal, sustainable and safe for human health and biodiversity
MSC certified catch* Y Y
Proportion of fish stocks within biologically sustainable levels*
Y Y 14.4.1 Y
Living Planet Index for utilised species Y
Red List of Species (Commercially Exploited Aquatic Species)
Y
Total catch of cetaceans under IWC Y Y
Proportion of traded wildlife that was poached or illicitly trafficked
Y Y 15.7.1, 15.c.1
Y
4.2. Trade is legal, sustainable and safe for human health and biodiversity
Change in the [number/proportion] of CITES Parties with legislation in Category 1 under the National Legislation Project
Y Y
MSC certified Catch Y Y
Proportion of traded wildlife that was poached or illicitly trafficked
Y Y 15.7.1,15.c.1 Y
Red List Index (internationally traded species)
Y
4.3. Use is legal, sustainable and safe for human health and biodiversity
Living Planet Index for utilised species Y
MSC certified catch* Y Y
Red List Index (trends driven by fisheries) Y
Red List Index (trends driven by utilisation) Y
5
By 2030, manage, and
where possible control,
pathways for the introduction
of IAS, achieving [50%]
5.0.1 Rate of invasive alien species spread 5.0.2 Rate of invasive alien species impact
5.1. Identification, control and management of pathways for introduction of invasive alien species
Trends in the numbers of invasive alien species introduction events
Y
Proportion of countries adopting relevant national legislation and adequately resourcing the prevention or control of invasive alien species
Y Y 15.8.1

CBD/SBSTTA/24/INF/16
Page 29
reduction in the rate of new
introductions, and eradicate,
control and manage IAS to
eliminate or reduce their
impacts, including in at least [50%] of priority sites
5.2. Effective detection, identification, prioritisation and monitoring of invasive alien species
Number of invasive alien species in national lists as per Global Register of Introduced and Invasive Species*
Y Y Y
5.3. Establishment of measures for eradication, control and management of invasive alien species
Proportion of countries adopting relevant national legislation and adequately resourcing the prevention or control of invasive alien species
Y Y 15.8.1
Trends in invasive alien species vertebrate eradications
Y
5.4. Eliminated or reduced impacts of IAS
Red List Index (impacts of invasive alien species)*
Y
5.5. Eradication, control or management of IAS in priority sites
6
By 2030, reduce pollution from all
sources, including
reducing excess nutrients [by x%], biocides
[by x%], plastic waste [by x%] to levels that are not harmful to
biodiversity and ecosystem
functions and human health
6.0.1 Proportion of water with good ambient water quality (freshwater and marine) 6.0.2 Plastic debris density 6.0.3 Pesticide use per area of cropland 6.0.4 Proportion of municipal solid waste collected and managed in controlled facilities out of total municipal solid
6.1. Reduction of pollution from excess nutrients
Trends in Nitrogen Deposition* Y Y
Amount of pesticide use per hectare Y
Nutrient balance Y Y
Trends in Loss of Reactive Nitrogen to the Environment
Y
Water Turbidity and an estimate of Trophic State Index
Y Y
6.2. Reduction of pollution from biocides
6.3. Reduction of pollution from plastic
Floating plastic debris density Y 14.1.1b

CBD/SBSTTA/24/INF/16
Page 30
waste generated by cities
6.4. Reduction of pollution from other sources
Red List Index (impacts of pollution) Y
Hazardous waste generated per capita; and (b) proportion of hazardous waste treated, by type of treatment
Y 12.4.2
7
By 2030, increase
contributions to climate change
mitigation adaption and disaster risk
reduction from nature-based solutions and ecosystems
based approached,
ensuring resilience and minimising any
negative impacts on biodiversity
7.0.1 Total climate regulation services provided by ecosystems
7.1. Increased biodiversity contribution to climate change mitigation, adaptation and disaster risk reduction
Above-ground biomass stock in forest (tonnes/ha)
Y 15.2.1 Y
Gross primary productivity Y
Net primary productivity Y Y 15.3.1
Proportion of local governments that adopt and implement local disaster risk reduction strategies in line with national disaster risk reduction strategies
Y Y 11.b.2,
13.1.3, 1.5.4 Y
Number of countries that adopt and implement national disaster risk reduction strategies in line with the Sendai Framework for Disaster Risk Reduction 2015–2030
Y Y 1.5.3, 11.b.1, 13.1.2
Forest Landscape Integrity Index Y
7.2. Minimised negative impacts on biodiversity from any mitigation, adaptation and disaster risk reduction measures
Number of international, regional and bilateral programmes and initiatives for the transfer and exchange of science, technology and innovation in disaster risk reduction for developing countries
Y Y Y
8
By 2030, ensure benefits, including
nutrition, food security,
livelihoods, health and
wellbeing, for people,
especially for
8.0.1 Number of people using wild resources for energy, food or culture (including firewood collection, hunting and fishing, gathering, medicinal use, craft making, etc.)
8.1. Sustainable management of aquatic wild species of fauna and flora, including fisheries
Proportion of fish stocks within biologically sustainable levels*
Y Y 14.4.1 Y
Living Planet Index (LPI) for Migratory Freshwater Fish to cover diadromous fish
Y
MSC Certified Catch Y Y
Red List Index (albatrosses and large petrels)
Y
Red List Index (impacts of fisheries) Y

CBD/SBSTTA/24/INF/16
Page 31
the most vulnerable
through sustainable
management of wild species of fauna and flora.
8.0.2 Percentage of the population in traditional employment
Red List Index (species used for food and medicine)
Y
Spawning stock Biomass (related to commercially exploited species)
Y
Degree of implementation of international instruments aiming to combat illegal, unreported and unregulated fishing
Y 14.6.1
Marine Trophic Index Y Y
8.2. Sustainable management of terrestrial wild species of fauna and flora
Red List Index (species used for food and medicine)
Y
Living Planet Index for utilised species Y
Number of plant genetic resources for food and agriculture secured in medium or long term conservation facilities
Y Y 2.5.1.a
Species Habitat Index Y Y
Volume of production per labour unit by classes of farming/pastoral/ forestry enterprise size
Y Y 2.3.1
9
By 2030, support the productivity, sustainability
and resilience of biodiversity in
agricultural and other managed
ecosystems through
conservation and sustainable
use of such ecosystems,
reducing productivity
9.0.1 Proportion of agricultural area under productive and sustainable agriculture
9.1. Sustainable management of agricultural biodiversity, including soil biodiversity, cultivated plants and farmed and domesticated animals and of wild relatives
Changes in land productivity Y Y 15.3.1
Changes in SOC stocks Y Y 15.3.1 Y
Number of plant and animal genetic resources for food and agriculture secured in either medium or long-term conservation facilities
Y Y 2.5.1
Red List Index (pollinating species) Y
Red List Index (wild relatives of domesticated animals)
Y
Comprehensiveness of conservation of socioeconomically as well as culturally valuable species
Y
Proportion of agricultural area under productive and sustainable agriculture
Y Y 2.4.1
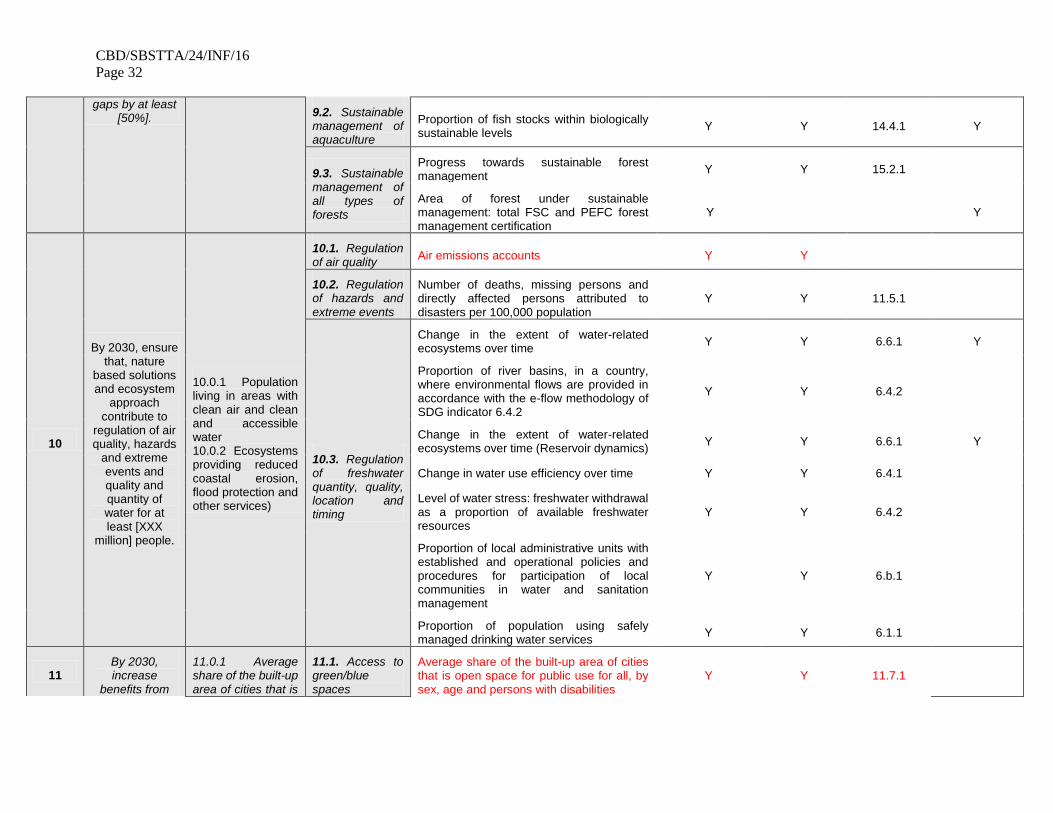
CBD/SBSTTA/24/INF/16
Page 32
gaps by at least [50%].
9.2. Sustainable management of aquaculture
Proportion of fish stocks within biologically sustainable levels
Y Y 14.4.1 Y
9.3. Sustainable management of all types of forests
Progress towards sustainable forest management
Y Y 15.2.1
Area of forest under sustainable management: total FSC and PEFC forest management certification
Y Y
10
By 2030, ensure that, nature
based solutions and ecosystem
approach contribute to
regulation of air quality, hazards
and extreme events and quality and quantity of water for at least [XXX
million] people.
10.0.1 Population living in areas with clean air and clean and accessible water 10.0.2 Ecosystems providing reduced coastal erosion, flood protection and other services)
10.1. Regulation of air quality
Air emissions accounts Y Y
10.2. Regulation of hazards and extreme events
Number of deaths, missing persons and directly affected persons attributed to disasters per 100,000 population
Y Y 11.5.1
10.3. Regulation of freshwater quantity, quality, location and timing
Change in the extent of water-related ecosystems over time
Y Y 6.6.1 Y
Proportion of river basins, in a country, where environmental flows are provided in accordance with the e-flow methodology of SDG indicator 6.4.2
Y Y 6.4.2
Change in the extent of water-related ecosystems over time (Reservoir dynamics)
Y Y 6.6.1 Y
Change in water use efficiency over time Y Y 6.4.1
Level of water stress: freshwater withdrawal as a proportion of available freshwater resources
Y Y 6.4.2
Proportion of local administrative units with established and operational policies and procedures for participation of local communities in water and sanitation management
Y Y 6.b.1
Proportion of population using safely managed drinking water services
Y Y 6.1.1
11 By 2030, increase
benefits from
11.0.1 Average share of the built-up area of cities that is
11.1. Access to green/blue spaces
Average share of the built-up area of cities that is open space for public use for all, by sex, age and persons with disabilities
Y Y 11.7.1
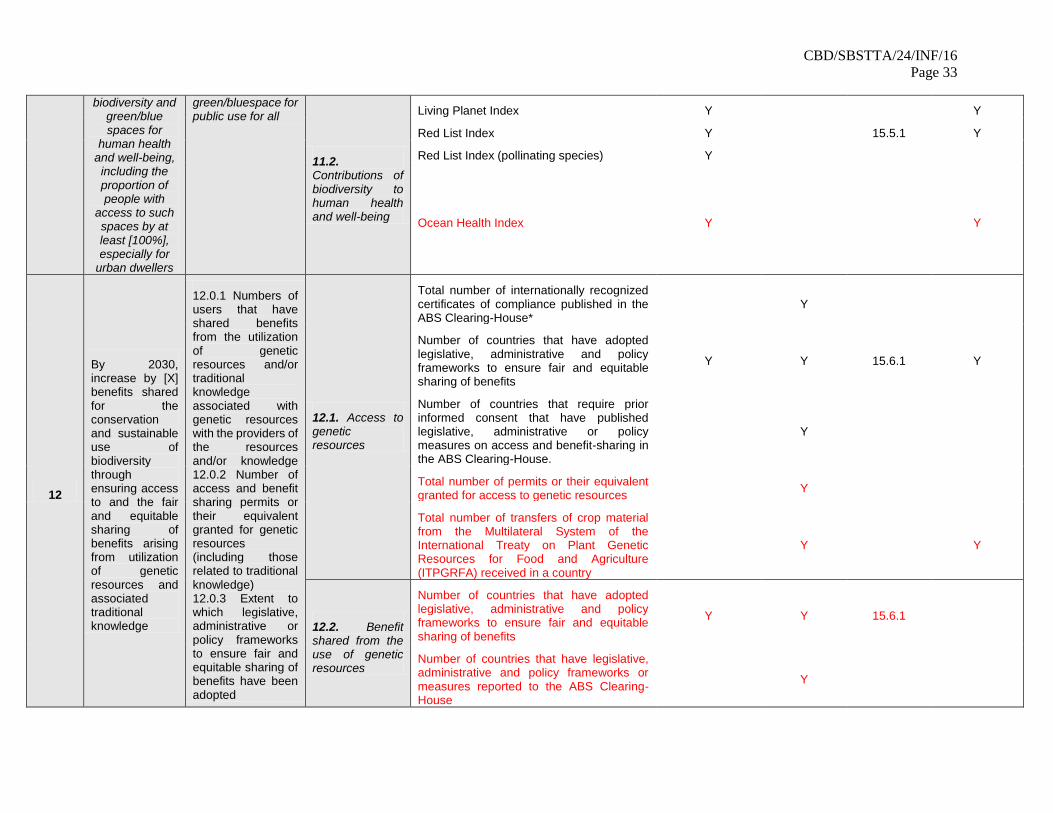
CBD/SBSTTA/24/INF/16
Page 33
biodiversity and green/blue spaces for
human health and well-being, including the proportion of people with
access to such spaces by at least [100%], especially for
urban dwellers
green/bluespace for public use for all
11.2. Contributions of biodiversity to human health and well-being
Living Planet Index Y Y
Red List Index Y 15.5.1 Y
Red List Index (pollinating species) Y
Ocean Health Index Y Y
12
By 2030, increase by [X] benefits shared for the conservation and sustainable use of biodiversity through ensuring access to and the fair and equitable sharing of benefits arising from utilization of genetic resources and associated traditional knowledge
12.0.1 Numbers of users that have shared benefits from the utilization of genetic resources and/or traditional knowledge associated with genetic resources with the providers of the resources and/or knowledge 12.0.2 Number of access and benefit sharing permits or their equivalent granted for genetic resources (including those related to traditional knowledge) 12.0.3 Extent to which legislative, administrative or policy frameworks to ensure fair and equitable sharing of benefits have been adopted
12.1. Access to genetic resources
Total number of internationally recognized certificates of compliance published in the ABS Clearing-House*
Y
Number of countries that have adopted legislative, administrative and policy frameworks to ensure fair and equitable sharing of benefits
Y Y 15.6.1 Y
Number of countries that require prior informed consent that have published legislative, administrative or policy measures on access and benefit-sharing in the ABS Clearing-House.
Y
Total number of permits or their equivalent granted for access to genetic resources
Y
Total number of transfers of crop material from the Multilateral System of the International Treaty on Plant Genetic Resources for Food and Agriculture (ITPGRFA) received in a country
Y Y
12.2. Benefit shared from the use of genetic resources
Number of countries that have adopted legislative, administrative and policy frameworks to ensure fair and equitable sharing of benefits
Y Y 15.6.1
Number of countries that have legislative, administrative and policy frameworks or measures reported to the ABS Clearing-House
Y

CBD/SBSTTA/24/INF/16
Page 34
12.3. Benefits resulting from use of traditional knowledge associated with genetic resources
Number of countries that have adopted legislative, administrative and policy frameworks to ensure fair and equitable sharing of benefits
Y Y 15.6.1 Y
13
By 2030, integrate
biodiversity values into
policies, regulations,
planning, development processes,
poverty reduction
strategies and accounts at all
levels, ensuring that biodiversity
values are mainstreamed
across all sectors and
integrated into assessments of environmental
impacts
13.0.1 Extent to which national targets for integrating biodiversity values into policies, regulations, planning, development processes, poverty reduction strategies and accounts at all levels, ensuring that biodiversity values are mainstreamed across all sectors and integrated into assessments of environmental impacts 13.0.2 Integration of biodiversity into national accounting and reporting systems, defined as implementation of the System of Environmental Economic Accounting
13.1. Biodiversity reflected in policies and planning at all levels
Number of countries that have established national targets in accordance with or similar to Aichi Biodiversity Target 2 of the Strategic Plan for Biodiversity 2011–2020 in their national biodiversity strategy and action plans and the progress reported towards these targets; and (b) integration of biodiversity into national accounting and reporting systems, defined as implementation of the System of Environmental-Economic Accounting
Y Y 15.9.1
Proportion of local governments that adopt and implement local disaster risk reduction strategies in line with national disaster risk reduction strategies
Y Y 11.b.2,
13.1.3, 1.5.4 Y
13.2. Biodiversity reflected in national and other accounts
Number of countries that have established national targets in accordance with or similar to Aichi Biodiversity Target 2 of the Strategic Plan for Biodiversity 2011–2020 in their national biodiversity strategy and action plans and the progress reported towards these targets; and (b) integration of biodiversity into national accounting and reporting systems, defined as implementation of the System of Environmental-Economic Accounting
Y Y 15.9.1
13.3. Biodiversity values are reflected in policies and regulations, including on biodiversity inclusive
The number of countries that have incorporated the BioTrade Principles & Criteria
Y
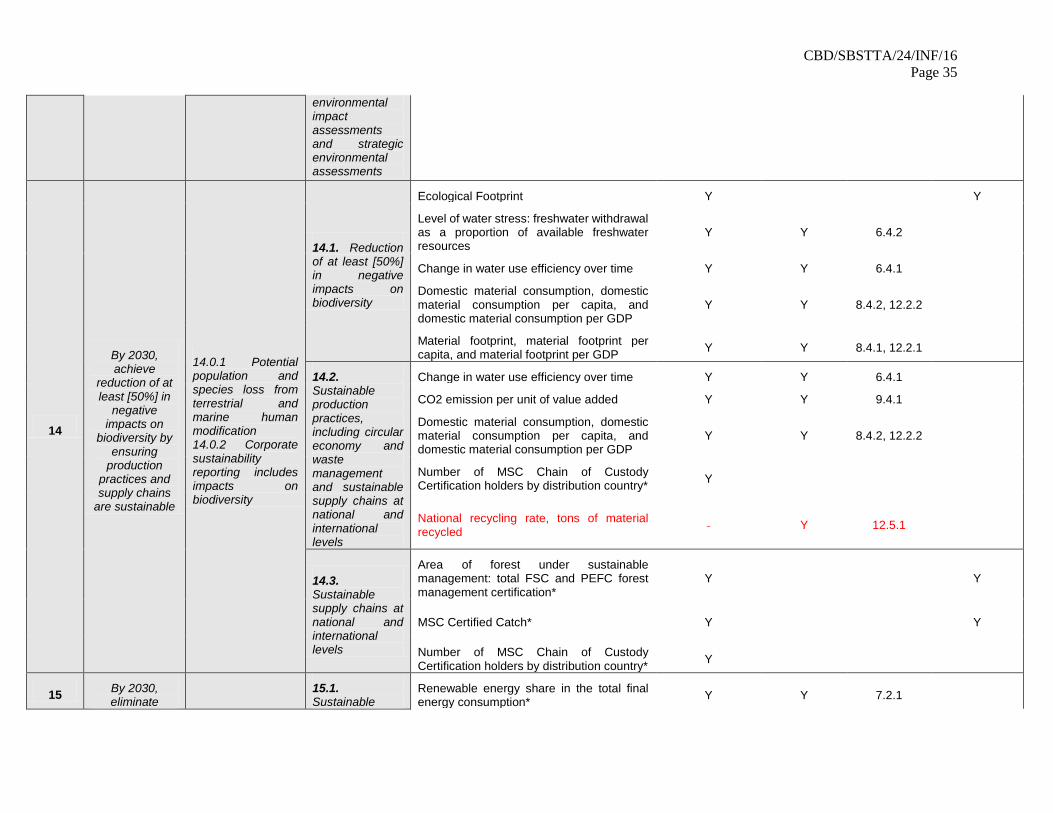
CBD/SBSTTA/24/INF/16
Page 35
environmental impact assessments and strategic environmental assessments
14
By 2030, achieve
reduction of at least [50%] in
negative impacts on
biodiversity by ensuring
production practices and supply chains
are sustainable
14.0.1 Potential population and species loss from terrestrial and marine human modification 14.0.2 Corporate sustainability reporting includes impacts on biodiversity
14.1. Reduction of at least [50%] in negative impacts on biodiversity
Ecological Footprint Y Y
Level of water stress: freshwater withdrawal as a proportion of available freshwater resources
Y Y 6.4.2
Change in water use efficiency over time Y Y 6.4.1
Domestic material consumption, domestic material consumption per capita, and domestic material consumption per GDP
Y Y 8.4.2, 12.2.2
Material footprint, material footprint per capita, and material footprint per GDP
Y Y 8.4.1, 12.2.1
14.2. Sustainable production practices, including circular economy and waste management and sustainable supply chains at national and international levels
Change in water use efficiency over time Y Y 6.4.1
CO2 emission per unit of value added Y Y 9.4.1
Domestic material consumption, domestic material consumption per capita, and domestic material consumption per GDP
Y Y 8.4.2, 12.2.2
Number of MSC Chain of Custody Certification holders by distribution country*
Y
National recycling rate, tons of material recycled
Y 12.5.1
14.3. Sustainable supply chains at national and international levels
Area of forest under sustainable management: total FSC and PEFC forest management certification*
Y Y
MSC Certified Catch* Y Y
Number of MSC Chain of Custody Certification holders by distribution country*
Y
15 By 2030, eliminate
15.1. Sustainable
Renewable energy share in the total final energy consumption*
Y Y 7.2.1

CBD/SBSTTA/24/INF/16
Page 36
unsustainable consumption
patterns, ensuring people
everywhere understand and appreciate the
value of biodiversity,
make responsible
choices commensurate
with 2050 biodiversity
vision, taking into account
individual and national cultural
and socioeconomic
condition
15.0.1 Biomass material footprint per capita
consumption patterns Domestic material consumption, domestic
material consumption per capita, and domestic material consumption per GDP
Y Y 8.4.2, 12.2.2
Ecological Footprint Y Y
Forest area as a percentage of total land area
Y Y 15.1.1 Y
Level of water stress: freshwater withdrawal as a proportion of available freshwater resources
Y Y 6.4.2
Living Planet Index (LPI) for utilised species Y
Progress towards sustainable forest management
Y Y 15.2.1
Material footprint, material footprint per capita, and material footprint per GDP
Y Y 8.4.1, 12.2.1
15.2. New vision of good quality of life based on sustainability and new social norms for sustainability
Biodiversity Engagement Indicator* Y
UEBT Biodiversity Barometer Y
15.3. Peoples’ responsibility for their choices
Number of MSC Chain of Custody Certification holders by distribution country
Y
UEBT Biodiversity Barometer Y
Number and volume of MSC certified, consumer facing products
Y
16
By 2030, establish and
implement measures to
prevent, manage or
control potential adverse impacts of biotechnology on biodiversity
and human
16.0.1 Extent to which necessary legal, administrative, technical and other biosafety measures are in place to prevent, manage and control potential adverse impacts of
16.1. Measures to prevent potential adverse impacts of biotechnology on biodiversity and human health
Percentage of Parties that have the necessary measures and means for detection and identification of products of biotechnology
Y
Percentage of Parties to the Cartagena Protocol on Biosafety implementing the relevant provisions of the Protocol
Y
Percentage of Parties that carry out scientifically sound risk assessments to support biosafety decision-making
Y

CBD/SBSTTA/24/INF/16
Page 37
health reducing these impacts
by [X]
biotechnology on biodiversity Percentage of Parties that have the
necessary biosafety legal and administrative measures in place
Y
Percentage of Parties that implement their biosafety measures
Y
16.2. Measures to manage adverse impacts of biotechnology on biodiversity and human health
Percentage of Parties to the Cartagena Protocol on Biosafety implementing the relevant provisions of the Protocol
Y
Percentage of Parties that establish and implement risk management measures
Y
Percentage of Parties that carry out scientifically sound risk assessments to support biosafety decision-making
Y
16.3. Measures to control adverse impacts of biotechnology on biodiversity and human health
Percentage of Parties to the Cartagena Protocol on Biosafety implementing the relevant provisions of the Protocol
Y
Percentage of Parties with mechanisms to facilitate the sharing of and access to information on biosafety
Y
16.4. Restoration and compensation for damage to biodiversity caused by LMOs
Percentage of Parties to the Nagoya – Kuala Lumpur Supplementary Protocol implementing the relevant provisions of the Supplementary Protocol*
Y
Percentage of Parties with legal and technical measures for restoration and compensation
Y
17
By 2030, redirect,
repurpose, reform or eliminate incentives harmful for biodiversity, including [X]
17.0.1 Biodiversity relevant taxes, charges and fees on payments for ecosystem services and on biodiversity relevant tradable permit schemes as a percentage of
17.1. Increase in positive public and private economic and regulatory incentives
Number of countries with biodiversity-relevant charges and fees (and # of instruments)
Y Y 15.a.1
Number of countries with biodiversity-relevant taxes (and # of instruments)
Y Y 15.a.1
Number of countries with biodiversity-relevant tradable permit schemes (and # of instruments)
Y Y

CBD/SBSTTA/24/INF/16
Page 38
reduction in the most harmful
subsidies, ensuring that incentives,
including public and private
economic and regulatory
incentives, are either positive or neutral for biodiversity
GDP 17.0.2 Potentially harmful elements of government support to agriculture, fisheries and other sectors (environmentally harmful subsidies) as a percentage of GDP
17.2. Elimination, phasing out or reform of incentives the most harmful to biodiversity
Trends in potentially environmentally harmful elements of government support to agriculture (producer support estimate)*
Y Y
Trends in the number and value of government fossil fuel support measures
Y
18
By 2030, increase by
[X%] financial resources from all international and domestic
sources, through new, additional and
effective financial
resources commensurate
with the ambition of the
goals and targets of the
Framework and implement the
strategy for capacity-
building and technology transfer and
scientific cooperation to
meet the needs for
implementing
18.0.1 Official development assistance, public expenditure and private expenditure on conservation and sustainable use of biodiversity and ecosystems
18.1. Identification of funding needs to meet ambition of the goals and targets of the Framework
Number of countries that have (a) Assessed values of biodiversity, in accordance with the Convention, (b) Identified and reported funding needs, gaps and priorities (c)Developed national financial plans for biodiversity; (d) Been provided with the necessary funding and capacity building to undertake the above activities
Y
18.2. Increase in financial resources from international sources
Amount of funding provided through the Global Environment Facility and allocated to biodiversity focal area (decision X/3)
Y
Dollar value of financial and technical assistance (including through North-South, South-South and triangular cooperation) committed to developing countries
Y Y 17.9.1
Rio markers Y Y
Amount of biodiversity-related philanthropic funding
Y
Amount and composition of biodiversity-related finance reported to the OECD creditor reporting system
Y
18.3. Increase in financial resources from domestic sources
Official development assistance on conservation and sustainable use of biodiversity; and (b) revenue generated and finance mobilized from biodiversity-relevant economic instruments*
Y Y 15.a.1, 15.b.1
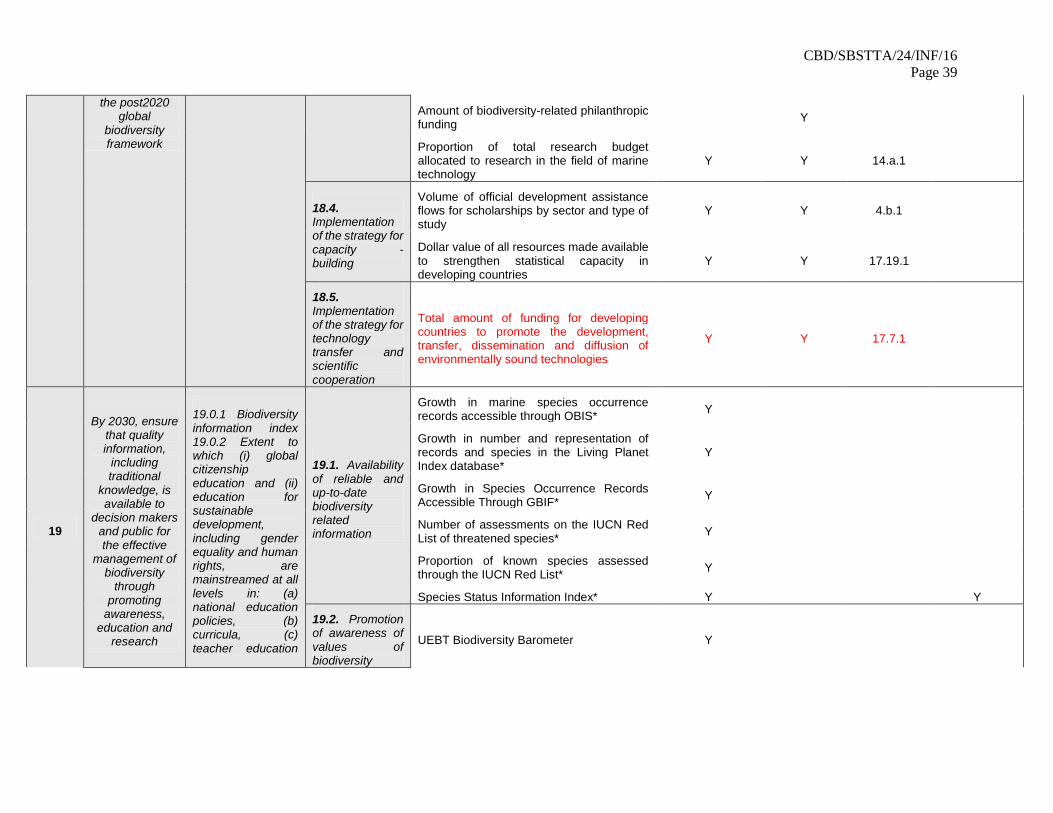
CBD/SBSTTA/24/INF/16
Page 39
the post2020 global
biodiversity framework
Amount of biodiversity-related philanthropic funding
Y
Proportion of total research budget allocated to research in the field of marine technology
Y Y 14.a.1
18.4. Implementation of the strategy for capacity -building
Volume of official development assistance flows for scholarships by sector and type of study
Y Y 4.b.1
Dollar value of all resources made available to strengthen statistical capacity in developing countries
Y Y 17.19.1
18.5. Implementation of the strategy for technology transfer and scientific cooperation
Total amount of funding for developing countries to promote the development, transfer, dissemination and diffusion of environmentally sound technologies
Y Y 17.7.1
19
By 2030, ensure that quality information,
including traditional
knowledge, is available to
decision makers and public for the effective
management of biodiversity
through promoting
awareness, education and
research
19.0.1 Biodiversity information index 19.0.2 Extent to which (i) global citizenship education and (ii) education for sustainable development, including gender equality and human rights, are mainstreamed at all levels in: (a) national education policies, (b) curricula, (c) teacher education
19.1. Availability of reliable and up-to-date biodiversity related information
Growth in marine species occurrence records accessible through OBIS*
Y
Growth in number and representation of records and species in the Living Planet Index database*
Y
Growth in Species Occurrence Records Accessible Through GBIF*
Y
Number of assessments on the IUCN Red List of threatened species*
Y
Proportion of known species assessed through the IUCN Red List*
Y
Species Status Information Index* Y Y
19.2. Promotion of awareness of values of biodiversity
UEBT Biodiversity Barometer Y
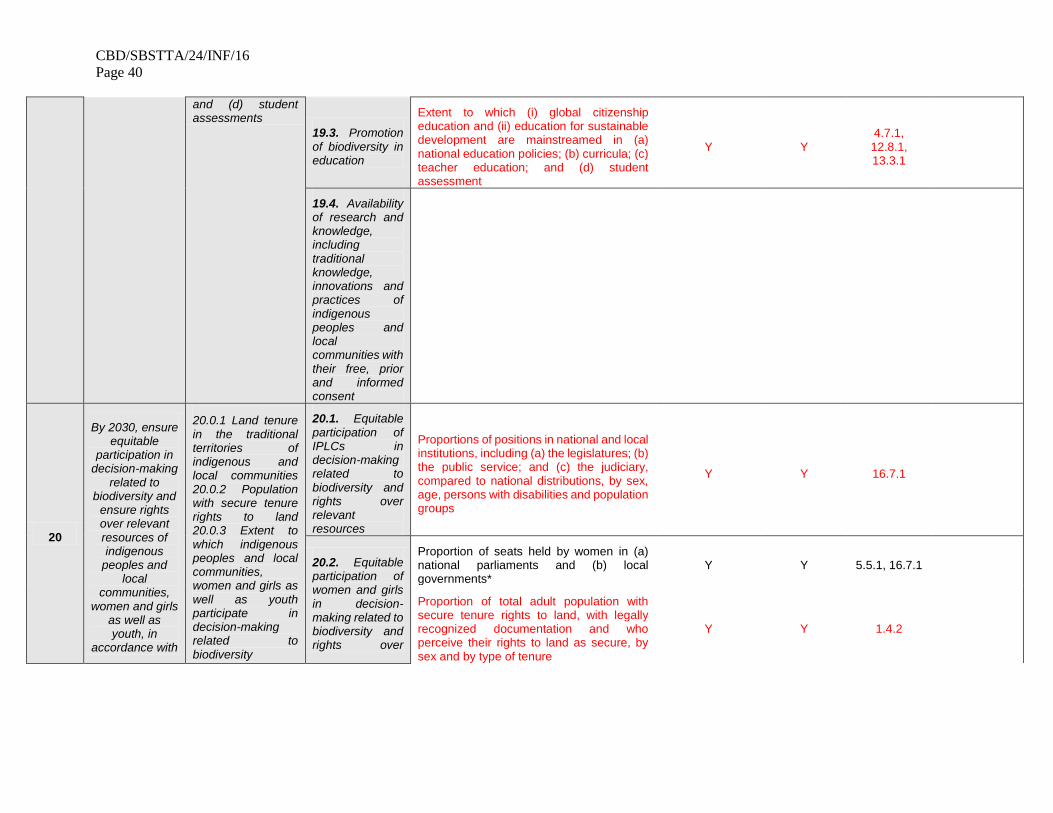
CBD/SBSTTA/24/INF/16
Page 40
and (d) student assessments
19.3. Promotion of biodiversity in education
Extent to which (i) global citizenship education and (ii) education for sustainable development are mainstreamed in (a) national education policies; (b) curricula; (c) teacher education; and (d) student assessment
Y Y 4.7.1, 12.8.1, 13.3.1
19.4. Availability of research and knowledge, including traditional knowledge, innovations and practices of indigenous peoples and local communities with their free, prior and informed consent
20
By 2030, ensure equitable
participation in decision-making
related to biodiversity and
ensure rights over relevant resources of indigenous
peoples and local
communities, women and girls
as well as youth, in
accordance with
20.0.1 Land tenure in the traditional territories of indigenous and local communities 20.0.2 Population with secure tenure rights to land 20.0.3 Extent to which indigenous peoples and local communities, women and girls as well as youth participate in decision-making related to biodiversity
20.1. Equitable participation of IPLCs in decision-making related to biodiversity and rights over relevant resources
Proportions of positions in national and local institutions, including (a) the legislatures; (b) the public service; and (c) the judiciary, compared to national distributions, by sex, age, persons with disabilities and population groups
Y Y 16.7.1
20.2. Equitable participation of women and girls in decision-making related to biodiversity and rights over
Proportion of seats held by women in (a) national parliaments and (b) local governments*
Y Y 5.5.1, 16.7.1
Proportion of total adult population with secure tenure rights to land, with legally recognized documentation and who perceive their rights to land as secure, by sex and by type of tenure
Y Y 1.4.2
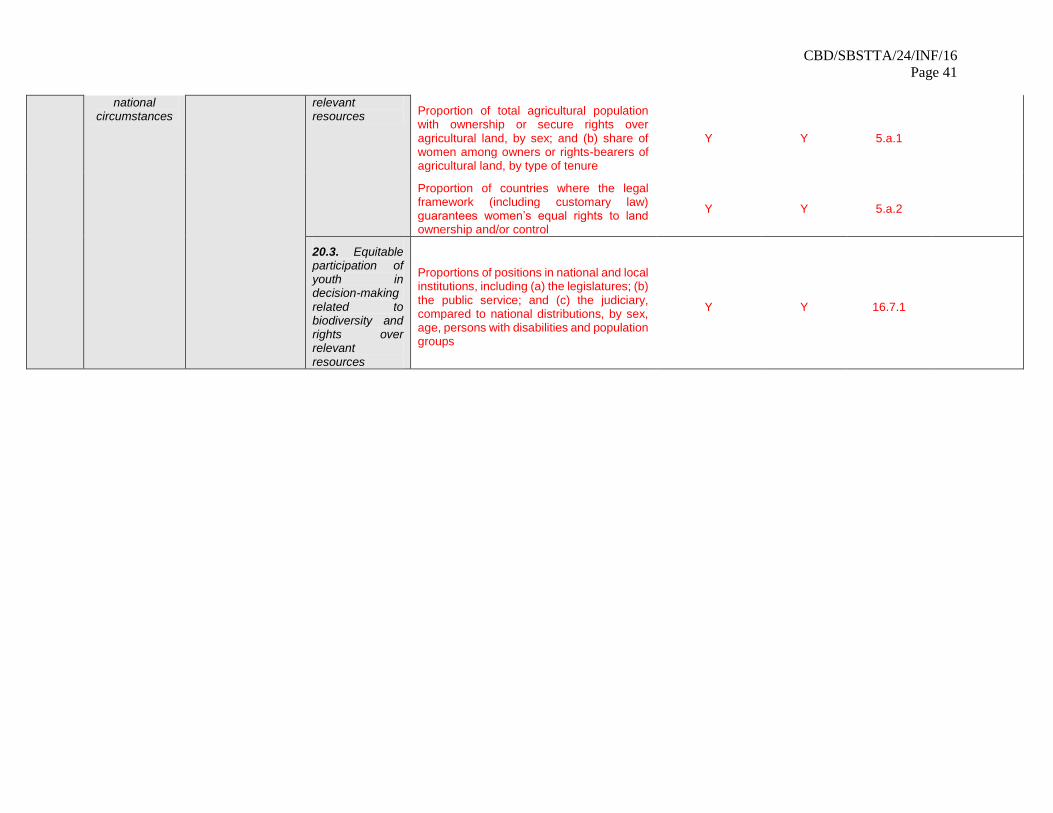
CBD/SBSTTA/24/INF/16
Page 41
national circumstances
relevant resources Proportion of total agricultural population
with ownership or secure rights over agricultural land, by sex; and (b) share of women among owners or rights-bearers of agricultural land, by type of tenure
Y Y 5.a.1
Proportion of countries where the legal framework (including customary law) guarantees women’s equal rights to land ownership and/or control
Y Y 5.a.2
20.3. Equitable participation of youth in decision-making related to biodiversity and rights over relevant resources
Proportions of positions in national and local institutions, including (a) the legislatures; (b) the public service; and (c) the judiciary, compared to national distributions, by sex, age, persons with disabilities and population groups
Y Y 16.7.1

CBD/SBSTTA/24/INF/16
Page 42
Annex 2
Summary list of available indicators
# Indicator Relevant for goals and targets
1 Above-ground biomass stock in forest (tonnes/ha) T7.1
2 Air emissions accounts T10.1
3 Agricultural land area (% of total land area) T1.1, T1.2
4 Amount and composition of biodiversity-related finance reported to the OECD creditor reporting system T18.2
5 Amount of biodiversity-related philanthropic funding T18.2, T18.3, GD1
6 Amount of funding provided through the Global Environment Facility and allocated to biodiversity focal area (decision X/3) T18.2
7 Amount of pesticide use per hectare T6.1
8 Annual Tropical Primary Tree Cover Loss T1.2
9 Area of forest under sustainable management: total FSC and PEFC forest management certification T9.3, T14.3
10 Average proportion of KBAs covered by protected areas T2.2, GA6
11 Average share of the built-up area of cities that is open space for public use for all, by sex, age and persons with disabilities T11.1, GB3
12 Biodiversity Engagement Indicator T15.2
13 Biodiversity Habitat Index T1.2, GA1
14 Biodiversity Intactness Index T1.3
15 Change in the [number/proportion] of CITES Parties with legislation in Category 1 under the National Legislation Project T4.2
16 Change in the extent of water-related ecosystems over time T1.2, T1.4, T10.3, GA1, GA2
17 Change in the extent of water-related ecosystems over time (Reservoir dynamics) T10.3
18 Change in water use efficiency over time T10.3, T14.1, T14.2
19 Changes in land productivity T9.1
20 Changes in plankton biomass and abundance GA4
21 Changes in soil organic carbon stocks T9.1
22 CO2 emission per unit of value added T14.2

CBD/SBSTTA/24/INF/16
Page 43
# Indicator Relevant for goals and targets
23 Comprehensiveness of conservation of socioeconomically as well as culturally valuable species T3.1, T9.1
24 Continuous Global Mangrove Forest Cover T1.2, GA1
25 Coverage by protected areas of important sites for mountain biodiversity T2.1, T2.2
26 Coverage of other effective area-based conservation measures T2.1, GA6
27 Coverage of protected areas in relation to marine areas T1.1, T2.1
28 Coverage of protected areas in relation to marine key biodiversity areas T2.2
29 Cumulative human impacts on marine ecosystems T1.3
30 Degree of implementation of international instruments aiming to combat illegal, unreported and unregulated fishing T8.1
31 Degree of integrated water resources management T1.1
32 Dollar value of all resources made available to strengthen statistical capacity in developing countries T18.4
33 Dollar value of financial and technical assistance (including through North-South, South-South and triangular cooperation) committed to developing countries
T18.2
34 Domestic material consumption, domestic material consumption per capita, and domestic material consumption per GDP T14.1, T14.2, T15.1
35 Ecological Footprint T14.1, T15.1
36 Ecosystem Intactness Index T1.2, T1.3
37 EDGE Index GA3
38 Extent to which (i) global citizenship education and (ii) education for sustainable development are mainstreamed in (a) national education policies; (b) curricula; (c) teacher education; and (d) student assessment
T19.3
39 Finance mobilised from domestic public expenditure for biodiversity-positive actions GD1
40 Floating plastic debris density T6.3
41 Forest area as a percentage of total land area T1.2, T15.1, GA1, GA2
42 Forest area with long-term forest management plans T1.1
43 Forest Landscape Integrity Index T1.2, T1.5, T7.1, GA2
44 Forestry Production & Trade (Wood Fuel) GB2
45 Freshwater/wetland dependent Living Planet Index T1.2

CBD/SBSTTA/24/INF/16
Page 44
# Indicator Relevant for goals and targets
46 Global imports of ICT goods as presented by bilateral trade flows by ICT goods categories GD3
47 Global trends in mangrove forest fragmentation GA2
48 Global Vegetation Health Products - Vegetation Health Index GA2
49 Gross primary productivity T7.1
50 Growth in marine species occurrence records accessible through OBIS T19.1
51 Growth in number and representation of records and species in the Living Planet Index database T19.1
52 Growth in Species Occurrence Records Accessible Through GBIF T19.1
53 Hazardous waste generated per capita; and (b) proportion of hazardous waste treated, by type of treatment T6.4
54 In situ and ex situ records-based index of within-species genetic diversity GA5
55 Level of water stress: freshwater withdrawal as a proportion of available freshwater resources T10.3, T14.1, T15.1, GB1, GB2
56 Live coral cover T1.2, GA1
57 Live Cover via Vegetation Continuous Fields GA1
58 Living Planet Index (LPI) T11.2, GA4, GB1
58a Living Planet Index (forest specialists) T1.2, GA2
58b Living Planet Index (migratory freshwater fish to cover diadromous fish) T8.1
58c Living Planet Index (freshwater migratory fish) T1.5
58d Living Planet Index (utilised species) T4.1, T4.3, T8.2, T15.1
59 Marine Trophic Index T8.1
60 Material footprint, material footprint per capita, and material footprint per GDP T14.1, T15.1
61 Mean Species Abundance T1.2, T1.3
62 Mountain Green Cover Index T1.2
63 MSC certified Catch T4.2, T4.3, T8.1, T4.1, T14.3
64 National recycling rate, tons of material recycled T14.2

CBD/SBSTTA/24/INF/16
Page 45
# Indicator Relevant for goals and targets
65 Net primary productivity T7.1
66 Number and hectares of UNESCO-designated sites (natural and mixed World Heritage sites and Biosphere Reserves) T2.2, GA6
67 Number and volume of MSC certified, consumer facing products T15.3
68 Number of assessments on the IUCN Red List of threatened species T19.1
69 Number of countries developing, adopting or implementing policy instruments aimed at supporting the shift to sustainable consumption and production
GB2
70 Number of countries that have (a) Assessed values of biodiversity, in accordance with the Convention, (b) Identified and reported funding needs, gaps and priorities (c)Developed national financial plans for biodiversity; (d) Been provided with the necessary funding and capacity building to undertake the above activities
T18.1
71 Number of countries that adopt and implement national disaster risk reduction strategies in line with the Sendai Framework for Disaster Risk Reduction 2015–2030
T7.1
72 Number of countries that have adopted legislative, administrative and policy frameworks to ensure fair and equitable sharing of benefits T12.1, T12.2, T12.3, GC2
73
Number of countries that have established national targets in accordance with or similar to Aichi Biodiversity Target 2 of the Strategic Plan for Biodiversity 2011–2020 in their national biodiversity strategy and action plans and the progress reported towards these targets; and (b) integration of biodiversity into national accounting and reporting systems, defined as implementation of the System of Environmental-Economic Accounting
T13.1, T13.2
74 Number of countries that have legislative, administrative and policy frameworks or measures reported to the ABS Clearing-House T12.2
75 Number of countries that require prior informed consent that have published legislative, administrative or policy measures on access and benefit-sharing in the ABS Clearing-House.
T12.1
76 Number of countries with biodiversity-relevant charges and fees (and # of instruments) T17.1
77 Number of countries with biodiversity-relevant taxes (and # of instruments) T17.1
78 Number of countries with biodiversity-relevant tradable permit schemes (and # of instruments) T17.1
79 Number of deaths, missing persons and directly affected persons attributed to disasters per 100,000 population T10.2
80 Number of formal and non-formal education programmes transmitting spiritual and cultural values in the UNESCO World Network of Biosphere Reserves
GB3
81 Number of hectares of transnational and transboundary UNESCO-designated sites (natural and mixed World Heritage sites and Biosphere Reserves)
T2.5

CBD/SBSTTA/24/INF/16
Page 46
# Indicator Relevant for goals and targets
82 Number of international, regional and bilateral programmes and initiatives for disaster risk reduction-related capacity-building in developing countries
GD2
83 Number of international, regional and bilateral programmes and initiatives for the transfer and exchange of science, technology and innovation in disaster risk reduction for developing countries
T7.2
84 Number of invasive alien species in national lists as per Global Register of Introduced and Invasive Species T5.2
85 Number of MSC Chain of Custody Certification holders by distribution country T15.3, T14.2, T14.3
86 Number of plant and animal genetic resources for food and agriculture secured in either medium or long-term conservation facilities T3.1, T9.1, GA5
87 Number of plant genetic resources for food and agriculture secured in medium or long term conservation facilities T8.2
88 Number of Wetlands of International Importance GA6
89 Nutrient balance T6.1
90 Ocean Health Index T1.2, T1.4, T11.2, GA2, GB1
91 Official development assistance on conservation and sustainable use of biodiversity; and (b) revenue generated and finance mobilized from biodiversity-relevant economic instruments
T18.3, GD1
92 Percentage of cropped landscapes with at least 10% natural or semi-natural vegetation within 1km T1.2
93 Percentage of Parties that carry out scientifically sound risk assessments to support biosafety decision-making T16.1, T16.2
94 Percentage of Parties that establish and implement risk management measures T16.2
95 Percentage of Parties that have the necessary biosafety legal and administrative measures in place T16.1
96 Percentage of Parties that have the necessary measures and means for detection and identification of products of biotechnology T16.1
97 Percentage of Parties that implement their biosafety measures T16.1
98 Percentage of Parties to the Cartagena Protocol on Biosafety implementing the relevant provisions of the Protocol T16.1, T16.2, T16.3
99 Percentage of Parties to the Nagoya – Kuala Lumpur Supplementary Protocol implementing the relevant provisions of the Supplementary Protocol
T16.4
100 Percentage of Parties with legal and technical measures for restoration and compensation T16.4
101 Percentage of Parties with mechanisms to facilitate the sharing of and access to information on biosafety T16.3
102 Percentage of threatened species that are improving in status according to the Red List T3.1, GA3
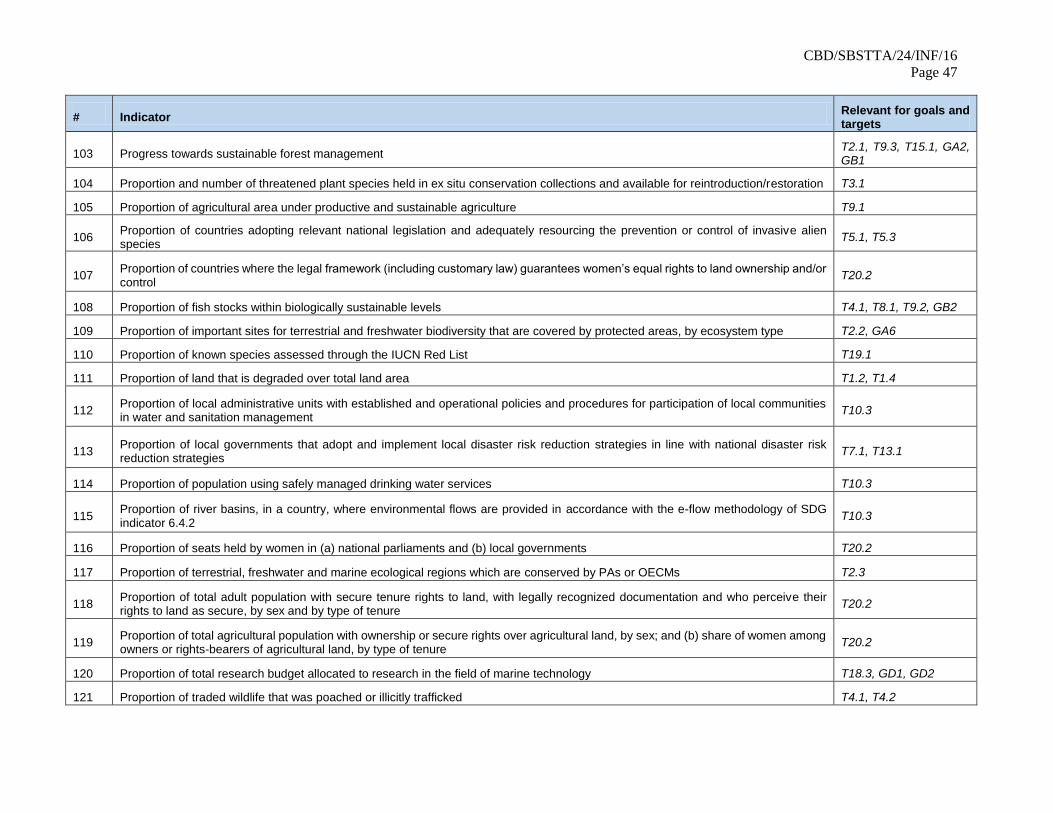
CBD/SBSTTA/24/INF/16
Page 47
# Indicator Relevant for goals and targets
103 Progress towards sustainable forest management T2.1, T9.3, T15.1, GA2, GB1
104 Proportion and number of threatened plant species held in ex situ conservation collections and available for reintroduction/restoration T3.1
105 Proportion of agricultural area under productive and sustainable agriculture T9.1
106 Proportion of countries adopting relevant national legislation and adequately resourcing the prevention or control of invasive alien species
T5.1, T5.3
107 Proportion of countries where the legal framework (including customary law) guarantees women’s equal rights to land ownership and/or control
T20.2
108 Proportion of fish stocks within biologically sustainable levels T4.1, T8.1, T9.2, GB2
109 Proportion of important sites for terrestrial and freshwater biodiversity that are covered by protected areas, by ecosystem type T2.2, GA6
110 Proportion of known species assessed through the IUCN Red List T19.1
111 Proportion of land that is degraded over total land area T1.2, T1.4
112 Proportion of local administrative units with established and operational policies and procedures for participation of local communities in water and sanitation management
T10.3
113 Proportion of local governments that adopt and implement local disaster risk reduction strategies in line with national disaster risk reduction strategies
T7.1, T13.1
114 Proportion of population using safely managed drinking water services T10.3
115 Proportion of river basins, in a country, where environmental flows are provided in accordance with the e-flow methodology of SDG indicator 6.4.2
T10.3
116 Proportion of seats held by women in (a) national parliaments and (b) local governments T20.2
117 Proportion of terrestrial, freshwater and marine ecological regions which are conserved by PAs or OECMs T2.3
118 Proportion of total adult population with secure tenure rights to land, with legally recognized documentation and who perceive their rights to land as secure, by sex and by type of tenure
T20.2
119 Proportion of total agricultural population with ownership or secure rights over agricultural land, by sex; and (b) share of women among owners or rights-bearers of agricultural land, by type of tenure
T20.2
120 Proportion of total research budget allocated to research in the field of marine technology T18.3, GD1, GD2
121 Proportion of traded wildlife that was poached or illicitly trafficked T4.1, T4.2

CBD/SBSTTA/24/INF/16
Page 48
# Indicator Relevant for goals and targets
122 Proportions of positions in national and local institutions, including (a) the legislatures; (b) the public service; and (c) the judiciary, compared to national distributions, by sex, age, persons with disabilities and population groups
T20.1, T20.3
123 Protected Area Connectedness Index (PARC-Connectedness) T2.5
124 Protected area coverage T2.1, GA6
125 Protected Area Representativeness Index T2.3
126 Protected Areas Management Effectiveness T2.4, T2.6
127 Protected Connected indicator T1.5, T2.5
128 Red List Index (RLI) T3.1, T11.2, GA3
128a Red List Index (albatrosses and large petrels) T8.1
128b Red List Index (forest-dependent species) T1.2, GA2
128c Red List Index (impacts of fisheries) T8.1
128d Red List Index (impacts of invasive alien species) T5.4
128e Red List Index (impacts of pollution) T6.4
128f Red List Index (internationally traded species) T4.2
128g Red List Index (marine species) T1.2, GA2
128h Red List Index (migratory species) T1.5
128i Red List Index (pollinating species) T9.1, T11.2, GB1
128j Red List Index (species used for food and medicine) T8.1, T8.2
128k Red List Index (trends driven by fisheries) T4.3
128l Red List Index (trends driven by utilisation) T4.3
128m Red List Index (wetland species) GA2
128n Red List Index (wild relatives of domesticated animals) T9.1, GA5
128o Red List of Species (commercially exploited aquatic species) T4.1
129 Relative Magnitude of Fragmentation GA2
130 Renewable energy share in the total final energy consumption T15.1

CBD/SBSTTA/24/INF/16
Page 49
# Indicator Relevant for goals and targets
131 Rio markers T18.2
132 Spawning stock Biomass (related to commercially exploited species) T8.1
133 Species Habitat Index T1.2, T8.2, GA2, GA4, GB1
134 Species Protection Index T2.2, T2.3, GA3, GA6
135 Species Status Information Index T19.1
136 The number of countries that have incorporated the BioTrade Principles & Criteria T13.3
137 Total amount of funding for developing countries to promote the development, transfer, dissemination and diffusion of environmentally sound technologies
T18.5, GD1
138 Total catch of cetaceans under the International Convention for the Regulation of Whaling T4.1
139 Total number of internationally recognized certificates of compliance published in the ABS Clearing-House T12.1, GC1
140 Total number of permits or their equivalent granted for access to genetic resources T12.1
141 Total number of transfers of crop material from the Multilateral System of the International Treaty on Plant Genetic Resources for Food and Agriculture (ITPGRFA) received in a country
T12.1
142 Total public expenditure per capita on the preservation, protection and conservation of natural heritage GD1
143 Tree Cover Loss T1.2, GA1, GA2
144 Trends in invasive alien species vertebrate eradications T5.3
145 Trends in Loss of Reactive Nitrogen to the Environment T6.1
146 Trends in mangrove extent T1.2, GA1, GB1
147 Trends in Nitrogen Deposition T6.1
148 Trends in potentially environmentally harmful elements of government support to agriculture (producer support estimate) T17.2
149 Trends in protected area downgrading, downsizing and degazettement T2.4
150 Trends in the number and value of government fossil fuel support measures T17.2
151 Trends in the numbers of invasive alien species introduction events T5.1
152 UEBT Biodiversity Barometer T15.2, T15.3, T19.2
153 Volume of official development assistance flows for scholarships by sector and type of study T18.4, GD1, GD2

CBD/SBSTTA/24/INF/16
Page 50
# Indicator Relevant for goals and targets
154 Volume of production per labour unit by classes of farming/pastoral/ forestry enterprise size T8.2
155 Water Turbidity and an estimate of Trophic State Index T6.1, GA1, GA2

CBD/SBSTTA/24/INF/16
Page 51
Annex 3
Headline indicators and available indicators mapping
Proposed headline indicators for goals
CBD/SBSTTA/24/3 Comments Available indicators
A.0.1 Extent of selected natural ecosystems (forest, savannas and grasslands, wetlands, mangroves, saltmarshes, coral reef, seagrass, macroalgae and intertidal habitats)
Available indicators could provide data for this headline indicator
Change in the extent of water-related ecosystems over time (SDG 6.6.1), Forest area as a percentage of total land area (SDG 15.1.1), Live Cover via Vegetation Continuous Fields, Tree cover loss, Trends in mangrove extent
A.0.2. Living Planet Index Indicator assessed and available Living Planet Index
A.0.3 Red list index Indicator assessed and available Red List Index (SDG 15.5.1)
A.0.4 Species habitat index Indicator assessed and available Species habitat index
A.0.5 The proportion of populations maintained within species
Under development
B.0.1 Population benefiting from ecosystem services Under development
B.0.2 Value of all final ecosystem services (Gross Ecosystem Product)
Under development
C.0.1 Amount of monetary benefits (in United States dollars) received by countries from utilization of genetic resources as a result of an ABS agreement including traditional knowledge
Available indicators could provide data for this headline indicator
Total number of internationally recognized certificates of compliance published in the ABS Clearing-House
C.0.2 Number of research and development results or publications shared as a result of an ABS agreement
Not assessed. Data may be available from ABS Clearing House
D.0.1 Index of coverage of national biodiversity strategies and action plans with formal processes for ensuring that women, indigenous and local communities and youth are engaged and which capture means of implementation
Under development
D.0.2 National funding for implementation of the Global Biodiversity Framework
Under development

CBD/SBSTTA/24/INF/16
Page 52
Proposed headline indicators for targets
CBD/SBSTTA/24/3 Comments Available indicators
1.0.1 Percentage of land covered by landscape scale land-use plans for terrestrial, freshwater and marine ecosystems
Available indicators could provide data for this headline indicator
Coverage of protected areas in relation to marine areas (SDG 14.5.1), Forest area with long-term forest management plans (SDG 15.2.1), Degree of integrated water resources management (SDG 6.5.1)
2.0.1 Protected Area Coverage of important biodiversity areas
Available indicators could provide data for this headline indicator
Average proportion of KBAs covered by protected areas, Coverage of protected areas in relation to marine key biodiversity areas, Proportion of important sites for terrestrial and freshwater biodiversity that are covered by protected areas, by ecosystem type(SDG 15.1.2), Coverage by protected areas of important sites for mountain biodiversity (SDG 15.4.1)
2.0.2 Species Protection Index Indicator assessed and available Species Protection Index
3.0.1 Protected Areas Management Effectiveness Indicator assessed and available Protected Areas Management Effectiveness
3.0.2 Species recovery programmes Under development
4.0.1 Proportion of traded wildlife that is legal and safe (not poached, illicitly trafficked or unsustainable)
Available indicators could provide data for this headline indicator
Proportion of traded wildlife that was poached or illicitly trafficked (SDG 15.7.1/15.C.1), Change in the [number/proportion] of CITES Parties with legislation in Category 1 under the National Legislation Project
4.0.2 Proportion of fish stocks within biologically sustainable levels
Indicator assessed and available Proportion of fish stocks within biologically sustainable levels (SDG 14.4.1)
5.0.1 Rate of invasive alien species spread Available indicators could provide data for this headline indicator
Trends in the numbers of invasive alien species introduction events; Number of invasive alien species in national lists as per Global Register of Introduced and Invasive Species
5.0.2 Rate of invasive alien species impact Available indicator could provide data for this headline indicator
Red List Index (impacts of invasive alien species)
6.0.3 Proportion of water with good ambient water quality (freshwater and marine)
Not assessed. Data may be available from SDG 14.1.1a and SDG 6.3.2
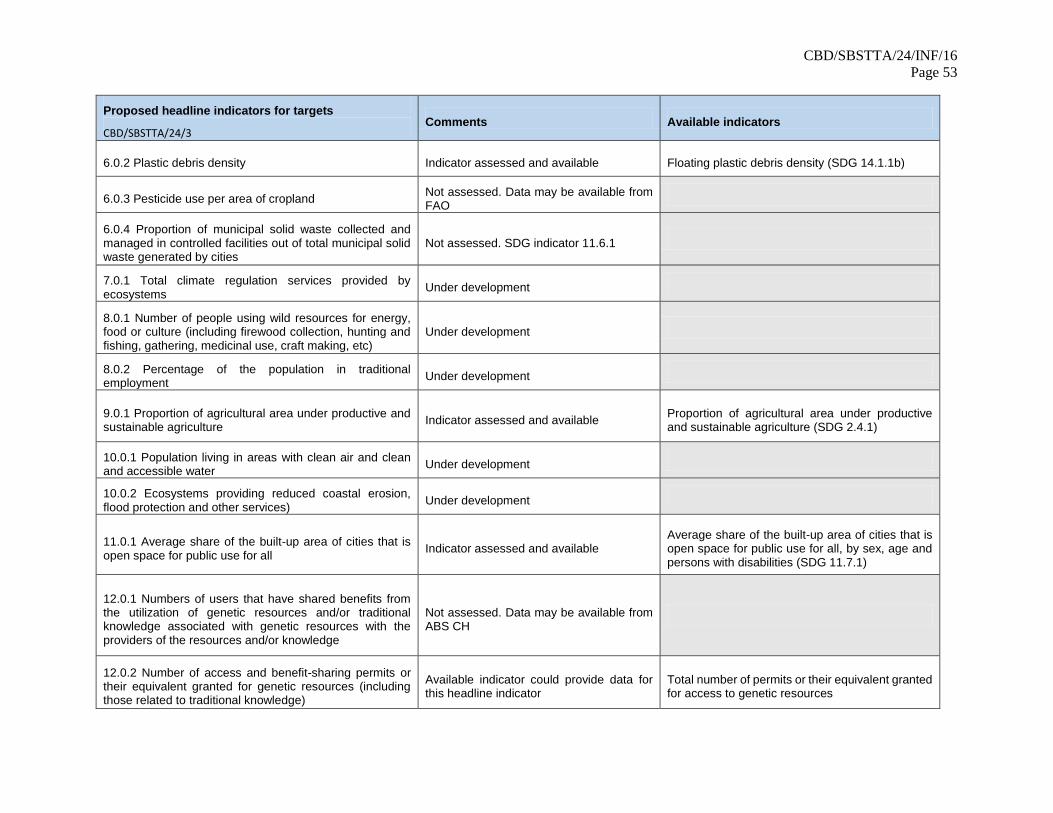
CBD/SBSTTA/24/INF/16
Page 53
Proposed headline indicators for targets
CBD/SBSTTA/24/3 Comments Available indicators
6.0.2 Plastic debris density Indicator assessed and available Floating plastic debris density (SDG 14.1.1b)
6.0.3 Pesticide use per area of cropland Not assessed. Data may be available from FAO
6.0.4 Proportion of municipal solid waste collected and managed in controlled facilities out of total municipal solid waste generated by cities
Not assessed. SDG indicator 11.6.1
7.0.1 Total climate regulation services provided by ecosystems
Under development
8.0.1 Number of people using wild resources for energy, food or culture (including firewood collection, hunting and fishing, gathering, medicinal use, craft making, etc)
Under development
8.0.2 Percentage of the population in traditional employment
Under development
9.0.1 Proportion of agricultural area under productive and sustainable agriculture
Indicator assessed and available Proportion of agricultural area under productive and sustainable agriculture (SDG 2.4.1)
10.0.1 Population living in areas with clean air and clean and accessible water
Under development
10.0.2 Ecosystems providing reduced coastal erosion, flood protection and other services)
Under development
11.0.1 Average share of the built-up area of cities that is open space for public use for all
Indicator assessed and available Average share of the built-up area of cities that is open space for public use for all, by sex, age and persons with disabilities (SDG 11.7.1)
12.0.1 Numbers of users that have shared benefits from the utilization of genetic resources and/or traditional knowledge associated with genetic resources with the providers of the resources and/or knowledge
Not assessed. Data may be available from ABS CH
12.0.2 Number of access and benefit-sharing permits or their equivalent granted for genetic resources (including those related to traditional knowledge)
Available indicator could provide data for this headline indicator
Total number of permits or their equivalent granted for access to genetic resources

CBD/SBSTTA/24/INF/16
Page 54
Proposed headline indicators for targets
CBD/SBSTTA/24/3 Comments Available indicators
12.0.3 Extent to which legislative, administrative or policy frameworks to ensure fair and equitable sharing of benefits have been adopted
Indicator assessed and available Number of countries that have adopted legislative, administrative and policy frameworks to ensure fair and equitable sharing of benefits (SDG 15.6.1)
13.0.1 Extent to which national targets for integrating biodiversity values into policies, regulations, planning, development processes, poverty reduction strategies and accounts at all levels, ensuring that biodiversity values are mainstreamed across all sectors and integrated into assessments of environmental impacts
Available indicator could provide data for this headline indicator
Number of countries that have established national targets in accordance with or similar to Aichi Biodiversity Target 2 of the Strategic Plan for Biodiversity 2011–2020 in their national biodiversity strategy and action plans and the progress reported towards these targets (SDG 15.9.1)
13.0.2 Integration of biodiversity into national accounting and reporting systems, defined as implementation of the System of Environmental Economic Accounting (SEEA)
Indicator assessed and available
Integration of biodiversity into national accounting and reporting systems, defined as implementation of the System of Environmental-Economic Accounting (SDG 15.9.1)
14.0.1 Potential population and species loss from terrestrial and marine human modification
Under development
14.0.2 Corporate sustainability reporting includes impacts on biodiversity
Under development
15.0.1 Biomass material footprint per capita Available indicators could provide data for this headline indicator
Material footprint, material footprint per capita, and material footprint per GDP, Domestic material consumption (SDG 8.4.1/12.2.1), Domestic material consumption per capita, and domestic material consumption per GDP (SDG 8.4.2, 12.2.2), Ecological Footprint
16.0.1 Extent to which necessary legal, administrative, technical and other biosafety measures are in place to prevent, manage and control potential adverse impacts of biotechnology on biodiversity
Under development
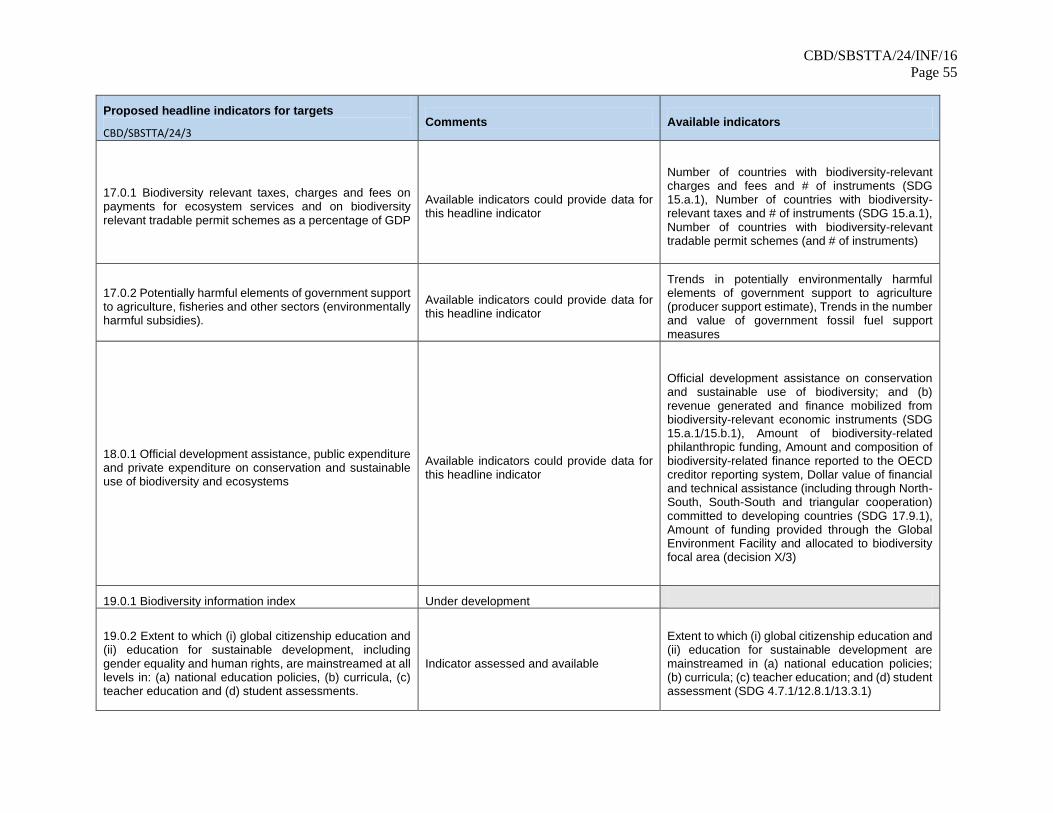
CBD/SBSTTA/24/INF/16
Page 55
Proposed headline indicators for targets
CBD/SBSTTA/24/3 Comments Available indicators
17.0.1 Biodiversity relevant taxes, charges and fees on payments for ecosystem services and on biodiversity relevant tradable permit schemes as a percentage of GDP
Available indicators could provide data for this headline indicator
Number of countries with biodiversity-relevant charges and fees and # of instruments (SDG 15.a.1), Number of countries with biodiversity-relevant taxes and # of instruments (SDG 15.a.1), Number of countries with biodiversity-relevant tradable permit schemes (and # of instruments)
17.0.2 Potentially harmful elements of government support to agriculture, fisheries and other sectors (environmentally harmful subsidies).
Available indicators could provide data for this headline indicator
Trends in potentially environmentally harmful elements of government support to agriculture (producer support estimate), Trends in the number and value of government fossil fuel support measures
18.0.1 Official development assistance, public expenditure and private expenditure on conservation and sustainable use of biodiversity and ecosystems
Available indicators could provide data for this headline indicator
Official development assistance on conservation and sustainable use of biodiversity; and (b) revenue generated and finance mobilized from biodiversity-relevant economic instruments (SDG 15.a.1/15.b.1), Amount of biodiversity-related philanthropic funding, Amount and composition of biodiversity-related finance reported to the OECD creditor reporting system, Dollar value of financial and technical assistance (including through North-South, South-South and triangular cooperation) committed to developing countries (SDG 17.9.1), Amount of funding provided through the Global Environment Facility and allocated to biodiversity focal area (decision X/3)
19.0.1 Biodiversity information index Under development
19.0.2 Extent to which (i) global citizenship education and (ii) education for sustainable development, including gender equality and human rights, are mainstreamed at all levels in: (a) national education policies, (b) curricula, (c) teacher education and (d) student assessments.
Indicator assessed and available
Extent to which (i) global citizenship education and (ii) education for sustainable development are mainstreamed in (a) national education policies; (b) curricula; (c) teacher education; and (d) student assessment (SDG 4.7.1/12.8.1/13.3.1)

CBD/SBSTTA/24/INF/16
Page 56
Proposed headline indicators for targets
CBD/SBSTTA/24/3 Comments Available indicators
20.0.1 Land tenure in the traditional territories of indigenous and local communities
Under development
20.0.2 Population with secure tenure rights to land Available indicators could provide data for this headline indicator
Proportion of total adult population with secure tenure rights to land, with legally recognized documentation and who perceive their rights to land as secure, by sex and by type of tenure (SDG 1.4.2), Proportion of total agricultural population with ownership or secure rights over agricultural land, by sex; and (b) share of women among owners or rights-bearers of agricultural land, by type (SDG 5.a.1)
20.0.3 Extent to which indigenous peoples and local communities, women and girls as well as youth participate in decision-making related to biodiversity
Available indicators could provide data for this headline indicator
Proportions of positions in national and local institutions, including (a) the legislatures; (b) the public service; and (c) the judiciary, compared to national distributions, by sex, age, persons with disabilities and population groups (SDG 16.7.1), Proportion of seats held by women in (a) national parliaments and (b) local governments (SDG 5.5.1)
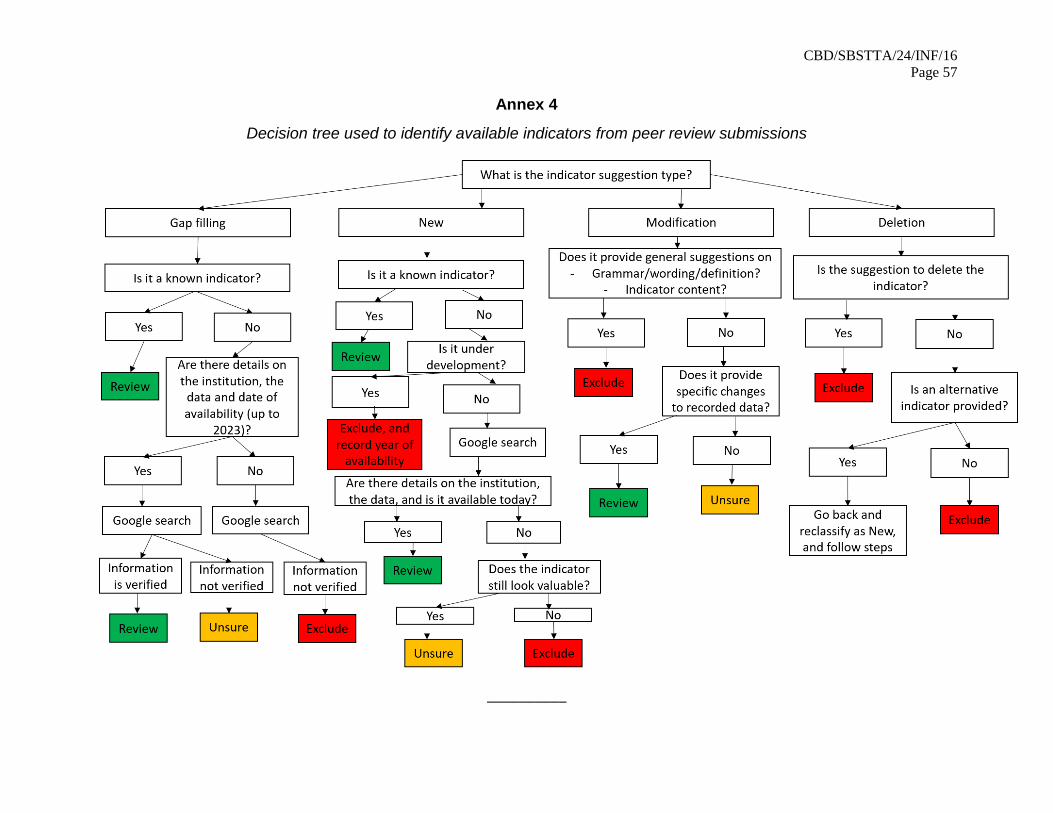
CBD/SBSTTA/24/INF/16
Page 57
Annex 4
Decision tree used to identify available indicators from peer review submissions
__________


![In search towards suitable biodiversity indicators€¦ · In search towards . suitable biodiversity indicators. original species of ecosystem. Species abundance. ... • N dep •[N+P]](https://static.fdocuments.in/doc/165x107/5fbf89df34674f292137979e/in-search-towards-suitable-biodiversity-indicators-in-search-towards-suitable.jpg)