Indicators for the dynamics of research organizations: a ...
23
Indicators for the dynamics of research organizations: a biomedical case study Robert Braam • Peter van den Besselaar Received: 18 August 2013 / Published online: 9 February 2014 Ó Akade ´miai Kiado ´, Budapest, Hungary 2014 Abstract This paper reports results on a bibliometric case study of the long-term development of research organizations, using an internationally leading biomedical insti- tute as example. Using scientometric concepts, small group theory, organizational ecology, and process-based organizational theory, we developed a life cycle based theoretical model for analyzing long-term development of research groups and institutes. Three bibliometric indicators are proposed for growth, activity profile stability, and focus. With these, the research dynamics of the case institute are described. First, overall output growth matches developments internationally in developmental biology and stem cell research, and, in line with this, journal article output increasingly dominates the institute’s activity profile. Second, superposed on the overall growth curve, a stepwise development is observed, consisting of long phases of growth and stabilisation. These steps reflect local conditions and events. Historical sources from the Institutes’ archive and interviews with the current staff of the institute suggest that the pattern of life cycles reflects a strong influence of pioneering individuals. But once settled, pioneering directors who remain in function for many years delay adaptation of the institutes’ mission to field developments. Furthermore, national science policies on PhD training, and on priority areas have influenced the life cycles, as did merging with other institutes. As in a social science case, also in this case study stabilized local conditions lead to adaptation to research field dynamics in a delayed fashion. In the present case stable output periods lasted at most 15 years, when local impulses led to new growth of research output and thus prevented onset of a lifecycle decline. The continued growth in the larger field both promoted and legitimized these local impulses. R. Braam Independent Researcher, Utrecht, The Netherlands e-mail: [email protected] P. van den Besselaar (&) Department of Organization Sciences and Network Institute, VU University Amsterdam, Amsterdam, The Netherlands e-mail: [email protected] 123 Scientometrics (2014) 99:949–971 DOI 10.1007/s11192-014-1235-5
Transcript of Indicators for the dynamics of research organizations: a ...

Indicators for the dynamics of research organizations:a biomedical case study
Robert Braam • Peter van den Besselaar
Received: 18 August 2013 / Published online: 9 February 2014� Akademiai Kiado, Budapest, Hungary 2014
Abstract This paper reports results on a bibliometric case study of the long-term
development of research organizations, using an internationally leading biomedical insti-
tute as example. Using scientometric concepts, small group theory, organizational ecology,
and process-based organizational theory, we developed a life cycle based theoretical model
for analyzing long-term development of research groups and institutes. Three bibliometric
indicators are proposed for growth, activity profile stability, and focus. With these, the
research dynamics of the case institute are described. First, overall output growth matches
developments internationally in developmental biology and stem cell research, and, in line
with this, journal article output increasingly dominates the institute’s activity profile.
Second, superposed on the overall growth curve, a stepwise development is observed,
consisting of long phases of growth and stabilisation. These steps reflect local conditions
and events. Historical sources from the Institutes’ archive and interviews with the current
staff of the institute suggest that the pattern of life cycles reflects a strong influence of
pioneering individuals. But once settled, pioneering directors who remain in function for
many years delay adaptation of the institutes’ mission to field developments. Furthermore,
national science policies on PhD training, and on priority areas have influenced the life
cycles, as did merging with other institutes. As in a social science case, also in this case
study stabilized local conditions lead to adaptation to research field dynamics in a delayed
fashion. In the present case stable output periods lasted at most 15 years, when local
impulses led to new growth of research output and thus prevented onset of a lifecycle
decline. The continued growth in the larger field both promoted and legitimized these local
impulses.
R. BraamIndependent Researcher, Utrecht, The Netherlandse-mail: [email protected]
P. van den Besselaar (&)Department of Organization Sciences and Network Institute, VU University Amsterdam, Amsterdam,The Netherlandse-mail: [email protected]
123
Scientometrics (2014) 99:949–971DOI 10.1007/s11192-014-1235-5

Keywords Life cycle � Development of research groups � Organizational
ecology � Indicators � Growth � Research focus � Audiences
Introduction
We explore the dynamics of research organizations in an historical approach, based on an
analysis of the long-term output. Through this, we identify the various domains of activity,
and try to explain the development from the perspective of process-based organization
theory. Our hypothesis is that research groups and institutes optimize and stabilize
activities in order to realize its mission. This leads to a typical ‘life-cycle’, which can be
disturbed by changes in the environment. We introduce life cycle indicators to analyze
positioning and dynamics of research organizations.
Earlier, we used the approach to analyze a small institute within the social sciences
(Braam and Van den Besselaar 2010). Are our life cycle indicators also useful in large
research institutes, in other domains, and for long-term historical periods? To test this, we
apply our life cycle model on an institute active in a very dynamic research area in the life
sciences: stem cell research.1 After testing the usefulness of the model, we discuss the
practical implications.
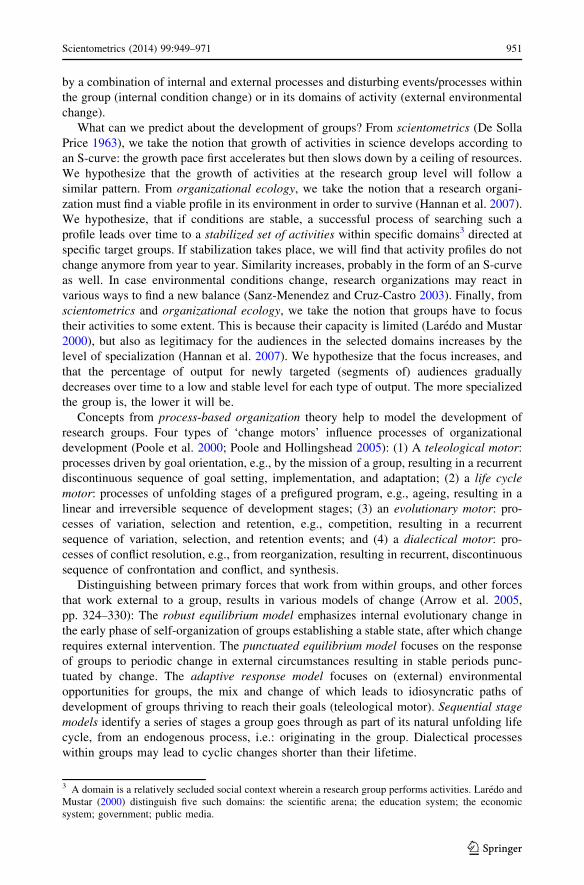
Theoretical framework
Using process-based theorizing in organization studies, we analyze research groups2 as
units of change that follow a particular sequence of events, steered by an internal mech-
anism, in conjunction with external events and conditions (Scott Poole et al. 2000,
pp. 36–37). Following this theoretical framework, one may describe research groups as
follows. The internal mechanism that drives the activities of a research group is its mission:
the shared (implicit or explicit) ambitions of the group members to realize specific results
outside the group. Depending on its mission, a group will strategically position itself in a
number of domains of activity, which can be summarized in an activity profile (Laredo and
Mustar 2000). Therefore we expect that each group will optimize its ‘primary activities’
that directly contribute to its mission, and undertake ‘secondary’ activities to gain
resources necessary for its survival. The latter contribute indirectly to the mission. Opti-
mization of activities leads to (logistic) growth of output in primary domains up to a ceiling
level that is given by the amount of available group resources (De Solla Price 1963).
Within each domain of activity, the group has to be accepted (by its intended audience) as a
legitimate player. Furthermore, it has to compete with other groups that produce the same
or similar types of products for the same audiences. The success of a group in a specific
domain of activity depends on the level of acceptance and specialization (‘grade of
membership’) of the group as a producer of products in each domain (Hannan et al. 2007).
Characteristics of the domains of activity influence the activities undertaken by a research
groups, e.g. the dominant search processes in the scientific field the group is active in
(Bonaccorsi 2008). The historical development of research groups can then be explained
1 Hubrecht Institute for Developmental Biology and Stem Cell Research, Utrecht, The Netherlands.2 We use the concept of ‘group’ here interchangeable with ‘laboratory’, and ‘institute’.
950 Scientometrics (2014) 99:949–971
123
by a combination of internal and external processes and disturbing events/processes within
the group (internal condition change) or in its domains of activity (external environmental
change).
What can we predict about the development of groups? From scientometrics (De Solla
Price 1963), we take the notion that growth of activities in science develops according to
an S-curve: the growth pace first accelerates but then slows down by a ceiling of resources.
We hypothesize that the growth of activities at the research group level will follow a
similar pattern. From organizational ecology, we take the notion that a research organi-
zation must find a viable profile in its environment in order to survive (Hannan et al. 2007).
We hypothesize, that if conditions are stable, a successful process of searching such a
profile leads over time to a stabilized set of activities within specific domains3 directed at
specific target groups. If stabilization takes place, we will find that activity profiles do not
change anymore from year to year. Similarity increases, probably in the form of an S-curve
as well. In case environmental conditions change, research organizations may react in
various ways to find a new balance (Sanz-Menendez and Cruz-Castro 2003). Finally, from
scientometrics and organizational ecology, we take the notion that groups have to focus
their activities to some extent. This is because their capacity is limited (Laredo and Mustar
2000), but also as legitimacy for the audiences in the selected domains increases by the
level of specialization (Hannan et al. 2007). We hypothesize that the focus increases, and
that the percentage of output for newly targeted (segments of) audiences gradually
decreases over time to a low and stable level for each type of output. The more specialized
the group is, the lower it will be.
Concepts from process-based organization theory help to model the development of
research groups. Four types of ‘change motors’ influence processes of organizational
development (Poole et al. 2000; Poole and Hollingshead 2005): (1) A teleological motor:
processes driven by goal orientation, e.g., by the mission of a group, resulting in a recurrent
discontinuous sequence of goal setting, implementation, and adaptation; (2) a life cycle
motor: processes of unfolding stages of a prefigured program, e.g., ageing, resulting in a
linear and irreversible sequence of development stages; (3) an evolutionary motor: pro-
cesses of variation, selection and retention, e.g., competition, resulting in a recurrent
sequence of variation, selection, and retention events; and (4) a dialectical motor: pro-
cesses of conflict resolution, e.g., from reorganization, resulting in recurrent, discontinuous
sequence of confrontation and conflict, and synthesis.
Distinguishing between primary forces that work from within groups, and other forces
that work external to a group, results in various models of change (Arrow et al. 2005,
pp. 324–330): The robust equilibrium model emphasizes internal evolutionary change in
the early phase of self-organization of groups establishing a stable state, after which change
requires external intervention. The punctuated equilibrium model focuses on the response
of groups to periodic change in external circumstances resulting in stable periods punc-
tuated by change. The adaptive response model focuses on (external) environmental
opportunities for groups, the mix and change of which leads to idiosyncratic paths of
development of groups thriving to reach their goals (teleological motor). Sequential stage
models identify a series of stages a group goes through as part of its natural unfolding life
cycle, from an endogenous process, i.e.: originating in the group. Dialectical processes
within groups may lead to cyclic changes shorter than their lifetime.
3 A domain is a relatively secluded social context wherein a research group performs activities. Laredo andMustar (2000) distinguish five such domains: the scientific arena; the education system; the economicsystem; government; public media.
Scientometrics (2014) 99:949–971 951
123

Based on the above notions, we hypothesize a basic life cycle model of development for
research groups under stable conditions. Groups then go through three stages. In the first
stage, the group formulates and/or internalizes its mission, and finds a strategic pattern of
activities in domains that are suitable for realizing its mission. If a group succeeds in this, it
will reach the next phase of robust equilibrium, and will remain functioning in a stable way
until its mission is fulfilled and/or its members retire while key-members are not (ade-
quately) replaced—thus reaching the third phase: (relative) decline. In the (second) stable
phase, change only comes if forced upon the group from outside. This might lead to
conflicts within or around a group, resulting, for instance, in change of the groups’ mission
or strategy, or in its organizational embedding. Further, in each domain of activity a group
competes with other groups for scarce resources. Changes within domains may require a
response of a group, e.g., more specialization. Changes in one domain may influence
activities in other domains: if resources become scarcer in one domain, a group may have
to intensify or diversify activities. All such changes will result in ‘deviations’ from the
‘standard’ life cycle. We use three output indicators to empirically describe the history of
research groups:
(1) Growth of activities. The first indicator we use, the aggregated number of
publications, is used to analyze the growth of activities, in all types and all domains
of activity. It reflects to what extent the output of a group changes over time.
(2) Stability of the activity profile. The second indicator we use, activity profile stability,
is meant to assess the stability of the activity profile over time: it reflects to what
extent a research group produces a similar mix of output over the years.4
(3) Focus of activities. The third indicator, the percentage of output in a domain to new
target groups, is meant to assess the focus of activities. It reflects to what extent a
group is serving from year to year the same audience(s) within it activity domains.
Above we argued that each of the indicators5 develops towards a stable high level
(indicator 1 and 2) or stable low level (indicator 3). These patterns model the ‘life cycle’ of
any research group (Fig. 1).
Under stable conditions, one expects (i) that the groups’ output level will grow to a
maximum level; (ii) the activity profile will stabilize after an initial period of searching the
right output categories and target groups; and (iii) after initial fluctuations due to search
processes, the level of focus will stabilize at a level that depends on the groups special-
ization. Patterns found in the indicators may help to determine the groups’ life cycle phase.
4 Sim APyrt; APyrt�1ð Þ ¼
Pn
i¼1
Aiyrtð Þ� Aiyrt�1ð ÞpPn
i¼1
Aiyrtð Þ2�pPn
i¼1
Aiyrt�1ð Þ2¼ 0; 1ð Þ
where APyrt is the Activity Profile: items on activities of category i to n, in year t;Aiyrt is the output items in Activity category i (e.g. journal publication) in Year t.This ‘Cosine’ formula: Salton and McGill (1983), and Jones and Furnas (1987); the approach is similar toone earlier introduced to compare term profiles of document clusters (Braam, 1991).5 We use integer counts of items per year as for all output categories. At the item level, differences mayexist in time and efforts to produce them, both between and within categories, but data to correct for this arelacking. In our analysis of long term patterns in output production this is not a large problem: each outputcategory can be followed, and local fluctuations, due to the production of ‘rare’ items consuming much timeand effort, are captured if other output decreases as a result. For performance comparison, it can be moresensitive (Moed 2005).
952 Scientometrics (2014) 99:949–971
123

Data and methods
Data on the output of a group or institute can be used to calculate the values of the three
indicators over time. Comparing the actual patterns with the hypothesized life cycle, helps
to interpret the trajectory of the group. This comparison is based on visual inspection and
statistical (time series) analysis. In this way, transitions between life cycle phases, and
gradual and sudden deviations from the ‘normal’ pattern are identified.
Change-Point Analysis (Taylor 2008) is deployed to locate significant changes in the
time series. It identifies significant changes of the mean-levels in the time series of indi-
cator values, given the expected life cycle patterns one would expect at least one level
change for each indicator: the first and second indicator upwards, the third downwards. Of
course, visual inspection of the curves is needed to secure interpretation.
Qualitative data on the history of the group help to identify critical events and processes
that explain the observed dynamics. We use annual reports and other archived material of
the Institute, as well as scholarly studies about the Hubrecht Institutes’ history.
The case
The Hubrecht Institute6 conducts fundamental research in the field of developmental
biology and stem cells, and currently has a staff of somewhat over 150 FTE, organized in
17 units, each with a research leader. The Hubrecht Institute is part of the Royal Neth-
erlands Academy of Arts and Sciences (KNAW), an umbrella organization with six
research institutes in the life sciences, and eleven institutes in the social sciences and
humanities.7
Sum of all output categories
Profile stability
Focus in domain
Time
Group development in stable internal and external conditions
#
0
% New
1
Similarity
Life cycle decline
Fig. 1 Life cycle patterns of the indicators
6 Sources: www.hubrecht.eu/information/history.html; www.developmental-biology.org/about/about.html,Gerhart (1997).7 The KNAW has as its other main tasks science policy advice, promoting scientific cooperation, andquality assessment. In this latter task, the KNAW closely cooperates with the research council (NWO) andthe association of Netherlands universities (VSNU).
Scientometrics (2014) 99:949–971 953
123

The Hubrecht Institute started as Hubrecht Laboratory in 1916, when it was established
as an Embryology Laboratory in the former residence of Ambrosius Hubrecht
(1853–1915), professor of zoology in the medical faculty of Utrecht University. The
laboratory was to contain the vast scientific collection of mammalian embryos of species
from Europe and the East Indies, collected by professor Hubrecht. Based on a private fund,
the laboratory maintained this collection to serve scientists in relation to the International
Institute of Embryology, under the directorship of professor De Lange. In 1967, an
additional collection of similar size was donated to the laboratory. In 2004 both collections
were transferred to the Museum fur Naturkunde in Berlin. Activities in experimental
embryological research started with the pioneering work of Pieter Nieuwkoop, a student at
Utrecht University zoology department who graduated in developmental biology in 1946,
supervised by professor of zoology C. Raven, who also succeeded De Lange as director of
the Laboratory in 1947. By 1953 Pieter Nieuwkoop had succeeded professor Raven as
director of the laboratory. The Laboratory moved in 1964 from its original location in
Utrecht to a new modern building at the university campus arising outside the Utrecht city
area. After his retirement in 1980 professor Nieuwkoop in his turn was succeeded by
professor De Laat as director. In 2000 the Laboratory moved to its present larger building,
and was renamed Hubrecht Institute in 2007. Recently, the Institute affiliated with the
University Medical Center Utrecht, intensifying the connections with Utrecht University.
Funding comes from the KNAW, the Ministry of Science, from project grants, and recently
from the Utrecht University Medical Center. The Institute obtained excellent scores by an
international peer committee.
Data
Bibliographic data on the Hubrecht Institute’s output for the period 1943–2008 come from
publication lists on its website,8 and data for the earlier years can be found in other
documents of the institute. Data indicating the growth of the research field the institute is
in, were obtained from the Web of Science.
In the period 1943–2009 the Hubrecht Institute produced a total amount of 1895 pub-
lications. Bibliographic data were organized in a database, that was used to categorize the
items into seven categories: (1) articles in scientific journals: to international scientific
environment; (2) conference papers: scientific environment; (3) book chapters/editorships:
international scientific environment; (4) PhD theses: local university environment/educa-
tional setting; (5) lectures/teaching books: educational setting; (6) local language articles:
to local/national scientific and public/lay audiences; (7) reports: to local organization/third
parties, i.e. not-peers. These categories we then used in our analysis.
In the KNAW Yearbook 1942 we found an additional list of publications for the period
1917–1942. Director professor De Lange listed these publications at the occasion of the
laboratory’s 25th anniversary. The list contains 35 headings with 38 items (1.5 items a
year, on average). The distribution over the mentioned categories and the development
over time of Hubrecht Institute’s output for the period 1916–2009 are represented in
Fig. 2a, b.
From the archives of the Hubrecht Institute we were able to inspect Year Books, Annual
Reports and Progress Reports, for the period 1937–2007. We also use a historical study
about the Royal Academy’s Life Sciences Institutes by Faasse (1999), and documents
8 http://www.hubrecht.eu/information/publications.html.
954 Scientometrics (2014) 99:949–971
123

written on the occasion of specific events (Piekaar 1964; De Laat 1986, 1996; Clevers
2008). These sources are used to identify the main events in the history of the institute. The
main events will be related to the output patterns.
As frame of reference for assessing the output development of the institute, we esti-
mated the growth of the institutes’ research field, by conducting a search in the Web of
Science for the two main research topics of the institute: developmental biology and stem
cell research.9
Hubrecht output by category, 1916-2009a
b
0 300 600 900 1200 1500
article
conference paper
book chapter
thesis
lecture
local language article
report
output items #
0
20
40
60
80
100
120
1916
1921
1926
1931
1936
1941
1946
1951
1956
1961
1966
1971
1976
1981
1986
1991
1996
2001
2006
ou
tpu
t (a
ll ty
pes
) #
article conference paper book chapter thesis lecture
local language article report
0
2
4
6
8
10
12
1916
1918
1920
1922
1924
1926
1928
1930
1932
1934
1936
1938
1940
1942
1944
1946
1948
1950
1952
1954
1956
1958
1960
1962
1964
1966
1968
Fig. 2 a Hubrecht Institute publications, by category, 1916–2009. b Hubrecht Institute publications(stapled graph)
9 Web of Science, 16 September 2009; Topic = (development * biology); Timespan = All Years. Dat-abases = SCI-EXPANDED, SSCI, A&HCI, CPCI-S, CPCI-SSH. 28,218 records. The documents areclassified in subject areas as biochemistry & molecular biology (3.192), cell biology (2.406), oncology(1.681), biotechnology and applied microbiology (1.397), genetics & heredity (1.386), plant sciences(1.383), biology (1.215), entomology (1.184), developmental biology (1174), and others. Of the 28.218found documents, 15.177 were articles; 7.590 reviews and 3.909 proceedings papers. Of the found docu-ments, 26.970 were in the English language. Most were from the USA (12.594), whereas the Netherlandscame 11th with 646 records counted.
Web of Science, 16 September 2009; TI = (stem AND cell*); Timespan = All Years. DATABASES = SCI-EXPANDED, SSCI, A&HCI, CPCI-S, CPCI-SSH. 67.043 records. Note: As Topic search was larger than
Scientometrics (2014) 99:949–971 955
123
Analysis
Comparison of the output growth of the Hubrecht Institute with Web of science data on its
two main subjects, shows that the Institute follows the international growth path (Fig. 3).
The continuous growth of Hubrecht institutes’ output both contributes to an exponential
growth of the field worldwide, and is dependent on the abundance of resources that enabled
that growth.
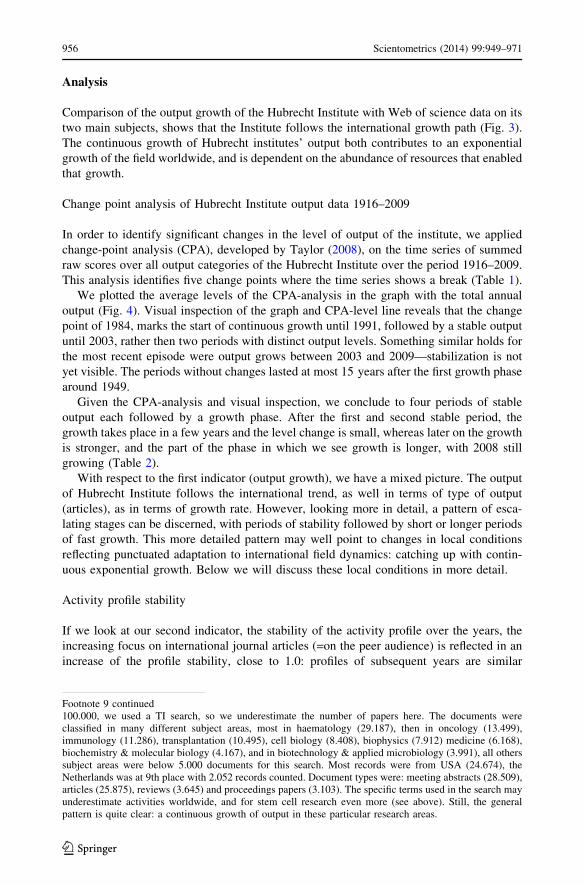
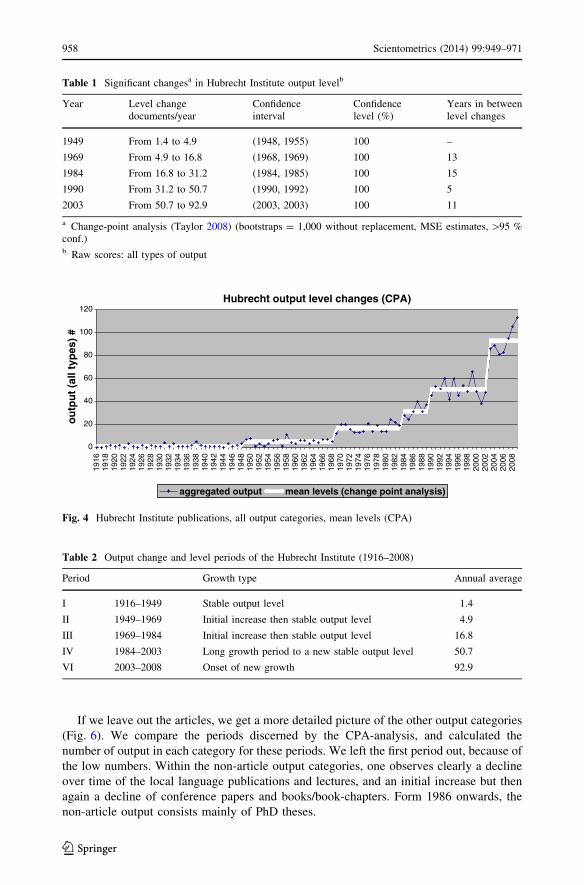
Change point analysis of Hubrecht Institute output data 1916–2009
In order to identify significant changes in the level of output of the institute, we applied
change-point analysis (CPA), developed by Taylor (2008), on the time series of summed
raw scores over all output categories of the Hubrecht Institute over the period 1916–2009.
This analysis identifies five change points where the time series shows a break (Table 1).
We plotted the average levels of the CPA-analysis in the graph with the total annual
output (Fig. 4). Visual inspection of the graph and CPA-level line reveals that the change
point of 1984, marks the start of continuous growth until 1991, followed by a stable output
until 2003, rather then two periods with distinct output levels. Something similar holds for
the most recent episode were output grows between 2003 and 2009—stabilization is not
yet visible. The periods without changes lasted at most 15 years after the first growth phase
around 1949.
Given the CPA-analysis and visual inspection, we conclude to four periods of stable
output each followed by a growth phase. After the first and second stable period, the
growth takes place in a few years and the level change is small, whereas later on the growth
is stronger, and the part of the phase in which we see growth is longer, with 2008 still
growing (Table 2).
With respect to the first indicator (output growth), we have a mixed picture. The output
of Hubrecht Institute follows the international trend, as well in terms of type of output
(articles), as in terms of growth rate. However, looking more in detail, a pattern of esca-
lating stages can be discerned, with periods of stability followed by short or longer periods
of fast growth. This more detailed pattern may well point to changes in local conditions
reflecting punctuated adaptation to international field dynamics: catching up with contin-
uous exponential growth. Below we will discuss these local conditions in more detail.
Activity profile stability
If we look at our second indicator, the stability of the activity profile over the years, the
increasing focus on international journal articles (=on the peer audience) is reflected in an
increase of the profile stability, close to 1.0: profiles of subsequent years are similar
Footnote 9 continued100.000, we used a TI search, so we underestimate the number of papers here. The documents wereclassified in many different subject areas, most in haematology (29.187), then in oncology (13.499),immunology (11.286), transplantation (10.495), cell biology (8.408), biophysics (7.912) medicine (6.168),biochemistry & molecular biology (4.167), and in biotechnology & applied microbiology (3.991), all otherssubject areas were below 5.000 documents for this search. Most records were from USA (24.674), theNetherlands was at 9th place with 2.052 records counted. Document types were: meeting abstracts (28.509),articles (25.875), reviews (3.645) and proceedings papers (3.103). The specific terms used in the search mayunderestimate activities worldwide, and for stem cell research even more (see above). Still, the generalpattern is quite clear: a continuous growth of output in these particular research areas.
956 Scientometrics (2014) 99:949–971
123

(Fig. 5). In the early period from 1916 to about 1943, the value raised to about 0.8,
indicating a stabilizing pattern of activities. This was interrupted by the Second World War
when output diminished. The activity profile similarity then rises again after 1947,
reflecting the continued increase of scientific article output. The outliers in 1957–1958 and
1965–1967 are due to incidental lower production (a single thesis in 1957) and differences
in non-articles (book, thesis versus lectures, local language article).
In the long run, we observe an increased orientation to the international science audi-
ences, as reflected in the growing share of articles, from 43 % in the early period
(1916–1949), towards some 75 % in the middle periods, and 86 % in the most recent
period (2003–2009). So, we find a doubling of the article share, leading to an activity
profile dominated by the peer audience.
Developmental Biology and Stem Cell publications in WoS
0
2000
4000
6000
8000
10000
1200019
4619
48
1950
1952
1954
1956
1958
1960
1962
1964
1966
1968
1970
1972
1974
1976
1978
1980
1982
1984
1986
1988
1990
1992
1994
1996
1998
2000
2002
2004
2006
2008
years
hit
s
stem cell dev biol
0
50
100
150
200
250
300
350
1946
1948
1950
1952
1954
1956
1958
1960
1962
1964
1966
1968
1970
1972
1974
1976
1978
1980
1982
1984
1986
1988
Hubrecht publications
0
20
40
60
80
100
1943
1947
1950
1953
1956
1959
1962
1965
1968
1971
1974
1977
1980
1983
1986
1989
1992
1995
1998
2001
2004
2007
Fig. 3 Records in developmental biology and stem cell research, in WoS, 16-09-2009
Scientometrics (2014) 99:949–971 957
123
If we leave out the articles, we get a more detailed picture of the other output categories
(Fig. 6). We compare the periods discerned by the CPA-analysis, and calculated the
number of output in each category for these periods. We left the first period out, because of
the low numbers. Within the non-article output categories, one observes clearly a decline
over time of the local language publications and lectures, and an initial increase but then
again a decline of conference papers and books/book-chapters. Form 1986 onwards, the
non-article output consists mainly of PhD theses.
Table 1 Significant changesa in Hubrecht Institute output levelb
Year Level changedocuments/year
Confidenceinterval
Confidencelevel (%)
Years in betweenlevel changes
1949 From 1.4 to 4.9 (1948, 1955) 100 –
1969 From 4.9 to 16.8 (1968, 1969) 100 13
1984 From 16.8 to 31.2 (1984, 1985) 100 15
1990 From 31.2 to 50.7 (1990, 1992) 100 5
2003 From 50.7 to 92.9 (2003, 2003) 100 11
a Change-point analysis (Taylor 2008) (bootstraps = 1,000 without replacement, MSE estimates, [95 %conf.)b Raw scores: all types of output
Hubrecht output level changes (CPA)
0
20
40
60
80
100
120
1916
1918
1920
1922
1924
1926
1928
1930
1932
1934
1936
1938
1940
1942
1944
1946
1948
1950
1952
1954
1956
1958
1960
1962
1964
1966
1968
1970
1972
1974
1976
1978
1980
1982
1984
1986
1988
1990
1992
1994
1996
1998
2000
2002
2004
2006
2008
ou
tpu
t (a
ll ty
pes
) #
aggregated output mean levels (change point analysis)
Fig. 4 Hubrecht Institute publications, all output categories, mean levels (CPA)
Table 2 Output change and level periods of the Hubrecht Institute (1916–2008)
Period Growth type Annual average
I 1916–1949 Stable output level 1.4
II 1949–1969 Initial increase then stable output level 4.9
III 1969–1984 Initial increase then stable output level 16.8
IV 1984–2003 Long growth period to a new stable output level 50.7
VI 2003–2008 Onset of new growth 92.9
958 Scientometrics (2014) 99:949–971
123

The increased role of peers as the intended audience of the Hubrecht Institute is also
reflected in the language of its publications. Whereas in the early period contributions in
the Dutch, French and German language do occur rather frequently, in later years almost
everything is published in English.
Focus of activities
The third indicator relates to the changes in research topics of the institute. We extracted
the title words from all publications, and identified for all title words the first year of
appearance. We then inspected when new (crucial) keywords occur for the first time in the
titles of the publications of the institute. First time use of these terms indicates changes in
the research program. Several studies about the history of the institute (De Laat 1996;
Faasse 1999) suggest that it has been following international research trends: from com-
parative to experimental to genetics and functional genomics.10 This is indeed reflected in
the selection of title words in Table 3. Interestingly, these new concepts start to appear in
the Hubrecht publications around the transitions between the periods. In the fourth period
(1984–2002) the new words are introduced during the longer output growth phase between
1984 and 1994.
This results in our third indicator. Figure 7a shows the annual percentage of new title
words. The percentage of new title words of course shows a downward trend, as the
number of ‘old’ title words becomes quickly larger over time. In the early period, the
number of papers remains small, making the large fluctuations easy to occur. Figure 7b is
the same figure, but now split over two y-axes, showing the fluctuations around downward
trend more clearly. Around 1943, 1953, 1965, 1987, 2000 and 2003, we observe the share
of new title words slightly increasing. This roughly corresponds to the changes in output
level. More precisely, director changes co-occur with changing trends in new title words,
suggesting change in scientific focus. The only moment where this is not the case is around
1960 when change in focus happens without a change of directorship. But there, the
Hubrecht Activity Profile Stability
0
0,1
0,2
0,3
0,4
0,5
0,6
0,7
0,8
0,9
119
1719
1919
2119
2319
2519
2719
2919
3119
3319
3519
3719
3919
4119
4319
4519
4719
4919
5119
5319
5519
5719
5919
6119
6319
6519
6719
6919
7119
7319
7519
7719
7919
8119
8319
8519
8719
8919
9119
9319
9519
9719
9920
0120
0320
0520
0720
09
Sim
ilari
tiy
(co
sin
e)
Profile similarity Hubrecht 4 year average trendline of Similarity
Fig. 5 Hubrecht Institute ‘Activity profile similarity’
10 And of course contributed to these trends. Several directors were internationally leading pioneers in thefield, and e.g., Nieuwkoop founded the International Society of Developmental Biologists.
Scientometrics (2014) 99:949–971 959
123

Institute moves to the Utrecht University campus, and shows a large increase of own
research. Overall, Fig. 7 suggests that the changes in output levels go parallel with the
exploration by the Hubrecht Institute of new developments within the field.
Summarizing, the development of the Hubrecht Institute shows the following charac-
teristics, in terms of the three indictors introduced here. Firstly, a continuous growth of
activities can be observed, leading to a stepwise growth of output. This growth has the
form of a sequence of life cycles of varied duration. Secondly, The Hubrecht Institute’s
research profile shows an increasing emphasis on scholarly articles (for peers) and PhD
theses (new graduates). Thirdly, the research focus of the institute increases in every
growth phase and then slightly decreases when a new phase starts—followed again by
gradually increase.
Explanation of found patterns
Above we first inspected the growth of output of the Hubrecht Institute over its entire life
history, and compared this to the growth of international literature in its two core areas:
Developmental Biology and Stem Cell Research. We did this by inspecting the Web of
Science using keywords that indicate the international dynamics of developmental biology
and stem cell research. Quantitatively the Institute appears in line with trend in these areas,
but does so in a stepwise fashion. In order to link the patterns with the history of the
institute, we inspected a number of historic sources to track events around the found
change points. In that way we can find out whether events and/or processes can be iden-
tified explaining the periods of growth and stability that we discerned above. In Table 4 we
Fig. 6 Activity profiles, 5 periods
960 Scientometrics (2014) 99:949–971
123

list ‘noteworthy events’ and processes we took from the available sources mentioned in the
data section.
1917–1943: collection as service to international science in comparative embryology
This period starts with a private fund and the establishment of an Institute for Embryology
by members of the Royal Academy of Sciences in 1916, after the death of Prof. A.A.W.
Hubrecht in 1915. The embryonic collection was to be maintained by a director, D. De
Lange, who was appointed in 1917, to serve international scientists interested to perform
research in comparative embryology at the laboratory. After retirement of Prof. De Lange
in 1947, who had done sparse research himself, novel experimental research was intro-
duced by the young and enthusiastic zoology student and PhD candidate from Utrecht
University, P.D. Nieuwkoop. The start of experimental work at the laboratory was a
delayed one, compared to the field of developmental biology internationally (Faasse 1999).
1949–1969: serving international science in experimental embryology
The post-war period is marked by activities of P.D. Nieuwkoop and Prof. Raven—the new
director, and professor of zoology at Utrecht University—to make the Hubrecht Laboratory
a ‘truly international center for embryological science’ providing working places and
Table 3 Introduction of newtitle-words in Hubrecht Institutepublications—examples
Keywords in title ([10 times used 1918–2008) First usage
Development 1918
Ontogenesis 1919
Developmental stages 1921
Placenta(tion) 1919
Urodeles 1943
Germ cells 1945
Experimental 1946
Egg 1953
Influence 1953
Cellular 1965
Cell 1968
Genetic 1970
Cancer 1982
Stem cell 1987
Gene 1987
Genomic 1992
Heart 1995
Caenorhabditis 2000
Elegans 2000
Cardiomyopathie 2003
Intestinal 2003
MicroRNA (-producing enzyme) 2004
(Neuro) Progenitor (compartment) 2006
Mismatch (repair deficiency in germ line) 2008
Scientometrics (2014) 99:949–971 961
123

facilities for experimental research by visiting scientists.11 Nieuwkoop and Raven
increased the services to science in relation to the International Institute for Embryology
(IEE).
• Maintain the Central Embryological Library and Collection;
• General Embryological Information Service (GEIS), a yearly publication (1949–1980);
• International Research Teams (IRT’s) providing opportunity to groups of young
students from all around the world to visit the laboratory for half a year of thematic
work (1954–1968).
Fig. 7 a and b. New title words: periods of increasing focus and of focal change. % new word-stems,frequency[5 per year, 5 years moving average; grey dot: start new phase; black dot: new director; grey dotwith black border: both
11 KNAW Yearbook 1948, pp. 92–96; 1949, pp. 115–116; 1950, pp. 209–210.
962 Scientometrics (2014) 99:949–971
123

Table 4 Noteworthy events in the history of the Hubrecht Institute
Year Noteworthy events
–1915 Professor AAW Hubrecht, professor of zoology at Utrecht University, collects embryonicmaterial from various species, for comparative studies
1910 Prof Hubrecht permitted to devote to study the embryological collection
1911 Institute International d’Embryologie IEE, founded by prof Hubrecht
1915 Death of prof Hubrecht (1853–1915)
1916 Foundation of Hubrecht Fund to the establishment of a laboratory for embryological researchin the residence of the late prof Hubrecht
1916–1947 First director, appointed by KNAW, Prof. D De Lange (1878–1948�)
1941 25 years Hubrecht Laboratory; De Lange lists publications for 1917–1941
1943 First research publication by PD Nieuwkoop (1917–1996�)
1944 Prof. Raven, acting director, replacing De Lange because of illness
1946 PhD-thesis, Nieuwkoop (supervisor: prof. Raven UU)
1947 From June: Nieuwkoop acting director (replacing De Lange, who retired)
Reorganization of the laboratory: more working tables for visiting scientists and facilities(aquarium unit) for experimental studies on living animals
1948–1953 Second director: Raven; Nieuwkoop to function as deputy director
Several national and international subsidies for collection and library function
1950 Nieuwkoop full time at Hubrecht (before halftime at zoological lab. UU)
1951 Nieuwkoop to USA for a scholarly-visit of a year
1953–1980 Third director: Prof. Nieuwkoop, Prof. Raven member of steering committee
1964 Move to building at the university campus; research staff funding increased
1966 Hubrecht Laboratory 50th anniversary;
Embryological collection of Professor Hill donated to Hubrecht Laboratory
1968 IEE reorganized as International Society of Developmental Biologists, ISDB, initiated fromthe Hubrecht Laboratory by Nieuwkoop
1970 J Faber deputy director of Hubrecht Laboratory
1974 Retirement Raven from University Utrecht, as professor of zoology
1978 Retirement of Nieuwkoop announced (formal retirement 1979)
1982–1983 Scientific Reorganization Committee (Faber secretary and acting director): renewed scientificprogram: ‘Regulation of early embryo development’
1983–2000 Fourth director: De Laat (retires early because of illness, in 2000)
1985 Formation of Netherlands Centre for Developmental Biology NIOB, with UU New formationplan, including NIOB activities, accepted by the Ministry
1986 70th anniversary Hubrecht Laboratory. Internal reconstruction of building and expansion oflaboratory research potential realized to carry out research plan
1987 First Hubrecht PhD-student thesis defended at University of Utrecht
1988 PhD graduate courses given at NIOB
1990 Developmental Biology appointed as focal theme at Utrecht University
1992 PhD Research School for Developmental Biology established at NIOB
ESF fellowship program approved, with secretariat at NIOB, for 5 years
1993 Reorganization research program 1994–1998, approved by the KNAW board
ISDB-Prize for Nieuwkoop for achievements in development biology
Director De Laat absent for a year, recovering from a serious car accident
1996 Death of Nieuwkoop (1917–1996); 80th Anniversary of Hubecht Lab.
Decision to make building of a new larger laboratory possible, planned: 1999
Scientometrics (2014) 99:949–971 963
123

To realize all this, several subsidies were acquired successfully. By 1950 the staff had
grown to 10 people, and the building provided 20 workplaces for international visiting
scientist.
1969–1984: increased research activities in a new modern building
By the midst of the sixties, the laboratory moved to a modern building on the new Utrecht
University campus, providing more space and modern facilities to work with. In the period
1965–1970, after the removal, staff numbers vastly increased, mounting up to 57 staff
members by the end of 1970: 3 management, 10 scientific and 44 support staff.12 The
collection of prepared embryos was enlarged by the addition of the collection from the late
Prof. Hill. The Laboratory was developing as an ‘international center for embryology’
directed at fulfilling the goals of the International Institute for Embryology (IIE), that was
reorganized in 1968 as the International Society for Developmental Biologists (ISDB), a
section of the International Union of Biological Scientists (IUBS), with its administrative
seat at the Hubrecht Laboratory. The 1971 Yearbook states: ‘‘The Laboratory is in a phase
of stability. The Maximum number of eight research units is reached.’’ Governmental
subsidy had risen to €700.000 by then. The Laboratory was equipped for experimental
work by its own staff as well as by visiting scientist, and still provided information services
to international scientists in the field. At the end of the seventies, Nieuwkoop stepped back
as director, after retirement, staying at the laboratory as a researcher until his death in 1996.
1984–2003: molecular genetics studies on multiple model animals
In 1982 an external scientific committee was installed by the Royal Academy (KNAW) to
renew the research program. Main issues were the establishment of a new research unit on
gene-regulation and discontinuation of the international service functions that the
Table 4 continued
Year Noteworthy events
1998 De Laat to retire ultimately 2000 (because of illness), search for new director
2000–2007 Fifth director: Prof. R Plasterk (until 2007, when he was appointed as minister)
New larger building opened in 2000; addition of four new research groups
2001 Collaboration with Interuniversity Cardiology Institute ICIN, KNAW-funded
2002–present
Sixth director: Prof. H Clevers (from 2002 to 2007 co-director with Plasterk)
Addition of new groups, based on funds from third parties (external funding)
Restructuring of building to accommodate new additional research groups
2004 Collection to the Museum fur Naturkunde, Humboldt University, Berlin
2007 Hubrecht Laboratory renamed as Hubrecht Institute
Plasterk leaves to become minister of Education, Culture and Science
2008 Evaluation assessment, with committee site visit, results in excellent scores
Growth by affiliation with Utrecht University Medical Center (adds 4 m€/yr)
New building facilities started to facilitate new growth of staff
Sources Hubrecht Institute website, Progress Reports, documents; KNAW annual reports, yearbooks
12 KNAW Yearbook 1971, p. 157.
964 Scientometrics (2014) 99:949–971
123

Laboratory fulfilled. In 1983 the scientific committee proposed the new research program
for the Hubrecht Laboratory (1983–1988), specifying needed resources and a new direc-
torship. After acceptance of the program by the staff, De Laat was appointed as new
director. In addition, the Ministry initiated a National Centre for Developmental Biology/
Embryology (NIOB) at Utrecht, wherein the Hubrecht Laboratory would collaborate with
Utrecht University.13 By 1985 the new plans were formally accepted, the research staff had
doubled since 1983, and the formal establishment of the Netherlands Centre for Devel-
opmental Biology (NIOB) took place, including collaboration with Utrecht University.
After the reconstruction of the building and renewal of the institute, and with additional
research capacity, ‘conditions are now fulfilled to carry out the planned research program
in the coming years’.14
In 1990, Developmental Biology was appointed as a focal theme, which intensified
collaboration between the Hubrecht Laboratory and Utrecht University. The NIOB was
appointed by the Ministry to organize a graduate school for developmental biology. By
1990, some 40 PhD students attended the school, 30 of which preparing a PhD thesis at the
NIOB. Two years later the school acquired the status of National Graduate School for
Developmental Biology, approved by the Royal Academy of Science.15 In the same period,
the Hubrecht Institute took the initiative to establish a European Science Foundation
Network on developmental biology, with administrative seat at NIOB. An ESF-fellowship
program in Developmental Biology followed in 1992, stimulating exchange of researchers.
The growth of activities was largely realized by externally funded projects, and it lead to a
pressing shortage of working space in the building. Governmental block funding did not
follow the strong growth, and new reorganization seemed inevitable.16 The process was
delayed by the absence of the director for a year (because of a car accident). On return, he
wrote: ‘‘The—drastic—reorganization has provided ample opportunities for a further
strengthening of the research program of the Institute, and, most importantly, we may now
look forward to the realization of a new, larger, laboratory building in 1998.’’17
2003–2009: further increase of activities and collaborations
After early retirement of De Laat, a new boost of activities started with the successive
appointment of two new directors, both bringing in their own and other new groups to the
Hubrecht Institute. The shifting focus from collection and service to research is now
finalized with the shipping in 2004 of the collection to the Museum fur Naturkunde of the
Von Humboldt Museum at Berlin. Besides bringing in new groups, the new directors
acquired additional resources, from collaboration within the Interuniversity Cardiology
Institute of the Netherlands (ICIN) in developmental research of the heart, from partici-
pation in novel (competitive) national research programs, and from affiliation with the
Utrecht Medical Centre. Output again grows to an even higher level, and continuous
enlargement of building and research facilities is needed to accommodate new starting
groups and research activities.18
13 KNAW Yearbook 1983, 1984.14 KNAW Yearbook 1985, 1986.15 KNAW Yearbook 1989, 1990, 1991; Annual Report KNAW 1992.16 Hubrecht Laboratory, Progress Report 1993.17 Hubrecht Laboratory, Progress Report 1994.18 Hubrecht Institute/Laboratory Progress Report 2007, 2006, 2005, 2004.
Scientometrics (2014) 99:949–971 965
123

Discussion
The analysis of the various phases reveals the role of a few factors that are summarized in
the above Table 5. These factors are (i) the development of the research field; (ii) the
institutional and organizational environment—especially the relations with the Utrecht
University and with the Royal Academy of Science, and (iii) the role of individuals,
especially the various directors of the institute.
The Hubrecht Institute and the field of developmental biology
The development of the Hubrecht Institute mirrors the development of the changes in
developmental biology over a century (1916–2009). This is illustrated by accounts of the
history of the Institute: ‘‘The Hubrecht Laboratory developed from a small collection
maintaining institute, with a few staff members, to a multidisciplinary research institute
with fifty FTE research staff in the 80s.’’ (Faasse 1999). As the institute’s director stated in
2003: ‘‘The Hubrecht Laboratory, established at the beginning of the twentieth century, has
evolved through subsequent phases of the field of developmental biology: from compar-
ative embryology (Hubrecht), to experimental manipulation of embryonic development
(Nieuwkoop), to molecular studies of signal transduction, to genomics and functional
genomics.’’19 Besides the shift in content, the institute changed from a service center for
international developmental biology research(ers), to an ‘international center in this field of
research’ [developmental biology], attracting the best researchers from within the country
as well as from abroad.20 Where in the early period, under De Lange, Nieuwkoop and
Raven, this regarded visiting scientists from other countries; research is now done by
members of the institute staff itself, with a focus on young researchers. Other changes to be
mentioned are the shift from maintaining a collection of gathered embryonic material to
experimental work on living animals, which also had to be taken cared of, and the
development of information technology and bibliographic databases that made the inter-
national library service obsolete.
The major changes in the scientific development of the institute, in sum, are thus
threefold:
(1) A shift from serving international science/visiting scholars to research output by own
staff.
(2) A shift from collection of prepared embryonic material for comparative studies to
experimental research on—a growing number of—living model animals
(3) A shift from visual inspection and cell-related research to molecular analysis
techniques.
These qualitative changes are reflected in the changes in output. Here we find an
increase reflecting the (exponential) growth of the developmental biology field. The
institute follows this growth in a stepwise delayed21 fashion, as internal conditions had to
be adapted to the external changes in the field, as discussed in the next sections.
19 Hubrecht Laboratory Progress Report 2003.20 Hubrecht Laboratory Progress Report 2005, 2006.21 Stepwise, as we observe periods without output growth of the HI, whereas global output steadilyincreases.
966 Scientometrics (2014) 99:949–971
123

Table 5 Development phases of the Hubrecht Laboratory/Institute
Phase Time period Local characteristics (leading people and events)
I 1916–1949Collection comparative embryology
serving guests
Establishment of Hubrecht laboratory with its collection,housed in Utrecht
Director: Prof. D De Lange (until 1947; delayedretirement)
Focus on collection of embryonic material as servicematerial, and on contact with international scholars incomparative embryology. Some 38 publications by thedirector and a few others from the Lab
II 1949–1969Empirical studies on living animals
service to international scholars
Prof. C Raven, supervisor of P Nieuwkoop, director from1947
Nieuwkoop, director from 1953 to 1980, Raven in steeringcom
Enlargement of facilities for empirical studies by visitingscholars
GEIS international oriented information service (until1980)
International Research Teams (1954, ‘56, ‘58, ‘60, ‘65,‘68)
Move to building at University campus ? extra researchstaff (1964)
III 1969–1984Intensification of activities
Nieuwkoop director until 1980 (retirement)
Added collection prof. Hill (1967) ? foundation of ISDB(1968)
Move to new larger modern building at University Campus
Hubrecht Institutes’ staff’s own research output to higherlevel
IV 1984–2003Long growth period leading to higher
stable level of output
Prof. De Laat, director (1980–2000), until retirement
New program with gene regulation and multiple modelanimals
Focus on multidisciplinary studies, new animal models,and novel molecular genetics techniques
Growth period due to PhD Graduate School, ESFfellowship Program, and UU focal theme DevelopmentalBiology
Stabilization of output level: illness of director; lack ofworkspaces
V 2003–2009Renewed output growth
Prof. R Plasterk (2000–2007) and prof H. Clevers (2002–present), directors
Vast increase in the number of groups, affiliation withUMC
To larger building (2000), for growing number of researchgroups
Collection transferred to the Museum fur Naturkunde,Berlin (2004)
Affiliation with UMC, including additional budget (2008)
Scientometrics (2014) 99:949–971 967
123

Organizational and institutional environment: Utrecht University and the Royal Academy
The Hubrecht Institute always had strong relations with Utrecht University, through per-
sonal affiliations, through collaboration, and through shared facilities. First of all, most of
the core people were or became professor at Utrecht University (Hubrecht, Raven, Nie-
uwkoop, de Laat, Plasterk, Clevers). The PhD courses and later the graduate school were
organized in collaboration with Utrecht University, as was the Netherlands Institute for
Developmental Biology (NIOB). Furthermore, changes in mission, object, and method of
study implied changes in need for lab space and for research facilities. Especially the size
of the housing of the institute regularly formed a serious constraint. Large housing was
realized at several occasions at the campus of Utrecht University. These relationships
certainly facilitated growth of Hubrecht Laboratory.
More recently, the Hubrecht Institute has strongly integrated with the Utrecht University
Hospital, while remaining an institute of the Royal Academy of Science. The development
of the Hubrecht Laboratory is also closely connected to the Royal Academy, which at
crucial moments repositioned the institute towards fundamental research (Faasse 1999),
and stimulated multidisciplinary research themes in national collaborative settings—in line
with national science policies.
The role of individuals
The subsequent directors played a crucial role in the development of the institute. It started
with the assembling of a vast collection of embryonic material from mammalian species by
Hubrecht. The pioneering research on germ cells by Nieuwkoop started experimental work
at the Hubrecht Laboratory, while the initiatives of Raven and Nieuwkoop intensified the
international service function of the institute. In fact, the stepwise growth of the research
output coincides neatly with changes in leadership in the institute. This suggests that every
new director was able to give the institute a new impulse, resulting a higher level of
activities and output than before. However, this strong role of individuals also brings a risk.
Most of the directors stayed very long in service, which may hinder the institute to keep up
with new international developments. The skills and interests of the consecutive directors
may get less central as the field develops. In the long run, this may have had a conservative
effect and may have hindered sustained growth—as the sometimes rather long phases of
stability suggest.
Preventing life cycle decline
We found long periods of stable output up to 15 years, which due to local impulses were
followed by new periods of growth. So, absolute life cycle decline has not been observed,
but in a continuously fast growing research field, long periods of non-growing output of the
institute can be considered stagnation. As new growth phases correlate with changes in the
institute’s leadership, one may conclude that changes of leadership could have been
implemented earlier.
Conclusions
In this paper we applied a theory based life cycle model with indicators on the long-term
history of a leading research institute. The indicators suggested that the institute developed
968 Scientometrics (2014) 99:949–971
123

over five life cycles, in which the audiences, activities and focus changed. The indicators
show that the increase of the institute’s output follows the international growth within the
relevant fields. The indicators also show an increased focus on the international peers, and
a decline of service activities and local audiences. Finally, the indicators capture major and
smaller shifts in the research focus, related to the international development of the field, to
pioneering individuals, and to local science policy circumstances.
When comparing the bibliometrically identified life cycles with historical information
about the field of developmental biology and about local changes and conditions, the
relevance of the indicators could be validated. The stepwise growth path resembles a
pattern of escalation of logistic growth (De Solla Price 1963). It can be interpreted as a
sequence of life cycles, new ones starting at the ending of the former. In terms of orga-
nizational development models, we see a ‘sequential stage’ development with periodic
adaptation to (increased) environmental opportunities, thus: ‘punctuated adaptation’.
Interestingly, the life cycles are related to local conditions and events, in particular the
succession of directorships following each other after retirement.
In an earlier study, we focused on social science institutes (Braam and Van den Bes-
selaar 2010). There we found a similar stepwise development was observed, and also there
the long growth and stabilization phases (first stages of the life cycle) coincided with
enduring directorship. Escalation (De Solla Price 1963) may result from attempts to avoid
reaching a ceiling of growth, e.g. by searching extra resources. In that study, we found a
strong growing market for applied research, leading to a boost of activities but here for
societal and policy audiences. Overall this suggests that the indicators are useful for
analyzing the developments of research institutes of different nature.
Further work
Moed (2000) found development phases in output of research groups of a biotechnology
and molecular biology department in Flanders. In particular, he suggested that emerging
groups (in the first phase of a life cycle) aim at quantity of publications, whereas more
established groups aim more at quality of publications, e.g. by focusing on high impact
journals. This should be visible by increase of high impact journals in a groups’ research
profile (Van Raan 2000), as indeed was found for the Hubrecht case (Van Leeuwen,
personal communication). This observation suggests a fourth life cycle indicator.
How can we explain that the lifecycles of institutes coincide with the life cycle of the
directors? First part of the explanation could be the following. When hiring a new director,
one would expect the selection of an excellent and high reputation scholar who is in the
center of the relevant research front(s). If that is the case, the new director will be able to
successfully attract large research grants, organize other resources and facilities, and attract
talented young researchers. This will lead to strong growth of output and to focusing of the
research. However, if a director is long in office, the field may move on, and the directors’
interests, skills and resulting research agenda may become less connected to the interna-
tional developments of the field. This will result in stagnation of the further development of
the institute and a stable situation (or decline) may be the result. This could be studied
empirically by mapping the topical structure of an institutes’ output over time, and com-
paring this with the topical structure of the field as a whole. This may also lead to a
refinement of the third indicator (research focus), which is still rather rude. A second part
of the explanation may refer to local conditions. Local organizational, institutional and
financial factors may lead to reorientations of institutes, which may lead to a new life
cycle. As these local dynamics often lead to changes in leadership, the two factors
Scientometrics (2014) 99:949–971 969
123

(leadership; local factors) may correlate strongly. The comparison of local and field
dynamics may further better insights in this.
Implications
The results of our cases suggest that development phases of groups and institutes should be
taken into account in science policy and research management and evaluation (see also
Nederhof 1985; Moed 2000; Laredo and Mustar 2000). Furthermore, our analysis points to
the conditions and events that influence the development of groups. The influence of
individual initiatives, ageing and succession of directorships, seem to be superposed on the
overall influence of the dynamics of the international field wherein groups are active. The
case study results, so far, show that the combination of the life cycle model with the use of
time series analysis of bibliometric output indicators is helpful to understand the devel-
opment of research groups and institutes. In particular, the model and time series analysis
helps to locate points and periods in time to look for crucial events and conditions. The
developmental patterns and the crucial events help understanding the position(ing) of
groups. Further case studies are needed to gain better insight in the implications of life
cycles for research evaluation. If systematic relations can be found between research field
dynamics, output growth and leadership changes, the proposed life cycle model can be
used as a diagnostic tool for determining the appropriate moment for crucial changes in
research institutes.
References
Arrow, H., Henry, K. B., Poole, M. S., Wheelan, S., & Moreland, R. (2005). Traces, trajectories, and timing:The temporal perspective on groups. In M. S. Poole & A. B. Hollingshead (Eds.), Theories of smallgroups: Interdisciplinary perspectives (pp. 313–367). Thousand Oaks, CA: Sage.
Bonaccorsi, A. (2008). Search regimes and the industrial dynamics of science. Minerva, 46, 285–315.Braam, R. R. (1991). Mapping of science: foci of intellectual interest in scientific literature. Thesis. Leiden,
The Netherlands: DSWO Press.Braam, R., & Van den Besselaar, P. (2010). Life cycles research groups: The case of CWTS. Research
Evaluation, 19, 173–184.De Solla Price, D. (1963). Little science big science. Paperback edition 1965. New York: Columbia Uni-
versity Press.Faasse, P. (1999). Zuiver om de Wetenschap, De Akademie en haar levenswetenschappe-lijke instituten
(Fundamentally for science: the life science institutes of the Academy of Science, KNAW,Amsterdam).
Hannan, M. T., Polos, L., & Carroll, G. R. (2007). Logics of organization theory: Audiences, codes, andecologies. Princeton, NJ: Princeton University Press.
Jones, W. P., & Furnas, G. W. (1987). Pictures of relevance: A geometric analysis of similarity measures.Journal of the American Society for Information Science, 36, 420–442.
Laredo, P., & Mustar, P. (2000). Laboratory activity profiles: An exploratory approach. Scientometrics, 47,515–539.
Moed, H. F. (2000). Bibliometric indicators reflect publication and management strategies. Scientometrics,47, 323–346.
Moed, H. F. (2005). Citation analysis in research evaluation. Dordrecht: Springer.Nederhof, A. J. (1985). Evaluating research output through life work citation counts. Scientometrics, 7(1–2),
23–28.Poole, M. S., & Hollingshead, A. B. (Eds.). (2005). Theories of small groups, interdisciplinary perspectives.
Thousand Oaks: Sage.Poole, M. S., Van de Ven, A. H., Dooley, K., & Holmes, M. (2000). Organizational change and innovation
processes: Theory and methods for research. New York: Oxford University Press.
970 Scientometrics (2014) 99:949–971
123

Sanz-Menendez, L., & Cruz-Castro, L. (2003). Coping with environmental pressures: Public research or-ganisations responses to funding crises. Research Policy, 32, 1293–1308.
Salton, G., & McGill, M. J. (1983). Introduction to modern information retrieval. New York, NY: McGraw-Hill.
Taylor, W. (2008). Change-point analyzer software. Libertyville: Taylor Enterprises, Inc. http://www.variation.com
Van Raan, A. F. J. (2000). R&D evaluation at the beginning of the new century. Research Evaluation, 8(2),81–86.
Sources on history of Hubrecht Laboratory/Institute
Clevers, H. (2008). Report by the Director, Site visit Hubrecht Institute, October 2008.De Laat, S., Faber, J., & Bluemink, J. G. (Eds.). (1986). Hubrecht Laboratory, Netherlands Institute for
Developmental Biology (NIOB), 70th anniversary brochure. Royal Netherlands Academy of Arts andSciences, Amsterdam.
De Laat, S. W. (1996). History and development of the Hubrecht Laboratory, notation at the 80th anni-versary of the Hubrecht Laboratory, KNAW-Hubrecht Laboratory, Utrecht.
Faasse P., et al. (1999). A brief history of the Hubrecht Laboratory. The International Journal of Devel-opmental Biology, Special Issue Hubrecht Laboratory, 43(7), 583–590.
Gerhart, J. (1997). In memoriam: Pieter Nieuwkoop. Developmental Biology, 182, 1–4.KNAW Annual Report (in Dutch), 2009, 2002, 1999, 1998, 1992.KNAW Yearbook (in Dutch), issues for the years 1991–1983; 1970–1966; 1952–1942; 1941 (with publi-
cation list 1917–1941), 1940–1937.Piekaar, A. J. Openingswoord bij de opening van het Hubrecht Laboratorium te Utrecht, directeur-generaal
voor de wetenschappen, uitgesproken op 16 juli 1964, te Utrecht. Document from Hubrecht Library.Progress Reports Hubrecht Laboratory, 2007–2003, 2001, 2000, 1997–1993, 1987.Website of the Hubrecht Institute: http://www.hubrecht.eu/information/history.html
Scientometrics (2014) 99:949–971 971
123