
Indicators-based Environmental Performance Assessment...
54
Indicators-based Environmental Performance Assessment for China’s Total Emission Reduction Policy during the 11 th FYP (2006-2010) Prepared by: Mr. Yang Weishan, Dr. Zhao Xuetao and Mr. Cao Dong, CEDAA/Center for Environmental Data Application & Analysis CAEP/Chinese Academy for Environmental Planning CAEP For: United Nations Environment Programme Division of Technology, Industry and Economics/Chemicals Branch Beijing and Geneva, December 2011
Transcript of Indicators-based Environmental Performance Assessment...

Indicators-based Environmental Performance Assessment
for China’s Total Emission Reduction Policy during the
11th FYP (2006-2010)
Prepared by:
Mr. Yang Weishan, Dr. Zhao Xuetao and Mr. Cao Dong,
CEDAA/Center for Environmental Data Application & Analysis
CAEP/Chinese Academy for Environmental Planning CAEP
For:
United Nations Environment Programme
Division of Technology, Industry and Economics/Chemicals Branch
Beijing and Geneva, December 2011


China EPA for 11th Five Year Plan
Contents
Contents....................................................................................................................................... i
List of Tables .............................................................................................................................. ii
List of Figures ............................................................................................................................ ii
List of Acronyms and Abbreviations......................................................................................... iii
1 Introduction......................................................................................................................... 5 1.1 Background of issuing the emission reduction policies............................................ 6 1.2 Main contents of the Eleventh FYP emission reduction policies ........................... 10
1.2.1 Emission reduction goal........................................................................................... 10 1.2.2 Emission reduction measures.................................................................................. 11
1.3 Significance for performance assessment............................................................... 13
2 Methodology for assessing the performance of emission reduction policies ................... 15 2.1 Driving force-Pressure-State-Impact-Response (DPSIR) framework .................... 15 2.2 DPSIR-based performance descriptive indicators .................................................. 17
2.2.1 EEA and DPSIR formation...................................................................................... 17 2.2.2 Global well-recognized environmental indicators.............................................. 18
2.3 Establish emission reduction performance indicators system ................................ 22 2.3.1 Build the indicators system ..................................................................................... 22 2.3.2 Indicators definition and calculation method ...................................................... 28 2.3.3 Determination of indicators’ target value ............................................................. 31 2.3.4 Data standardization method................................................................................... 33 2.3.5 Determination of indicators weight ....................................................................... 33 2.3.6 Calculation of performance indicators .................................................................. 34
3 Analysis of assessment results .......................................................................................... 35 3.1 Overall review at national level .............................................................................. 35 3.2 Sensitivity analysis ................................................................................................. 38 3.3 Summary of Pilot Study.......................................................................................... 39
3.3.1 Shanghai ...................................................................................................................... 40 3.3.2 Xi’an............................................................................................................................. 45 3.3.3 Linyi ............................................................................................................................. 46
4 Conclusion and Policy Recommendations ....................................................................... 49
5 Reference .......................................................................................................................... 52
i

China EPA for 11th Five Year Plan
List of Tables
Table 1: Pollutants Emission and Reduction Goal (10,000 t) in 10th FYP Period ......... 7
Table 2: Major Pollution Emission Reduction Indices in 11th FYP Period................. 11
Table 3: Terminology and typology of EEA ................................................................ 18
Table 4: Summary of indicators from OECD and EEA ............................................... 18
Table 5: Core environmental indicators in EEA and OECD....................................... 19
Table 6: DPSIR-Based Performance Analysis Indicators System ............................... 19
Table 7: Policy Performance Assessment Method ....................................................... 22
Table 8: DPSIR Index Framework Provided by UNEP ............................................... 23
Table 9: Emission Reduction Performance Assessment Index System Tallying with China’s National Conditions.......................................................................... 27
Table 10: Indicators’ Target Values and Weight............................................................ 32
Table 11: Pilot Application Results of Pollution Emission Reduction Performance Evaluation Indicator System in Shanghai...................................................... 42
Table 12: EPPI Calculation Results of All Indicators in 11th FYP Period in Xi’an....... 45
Table 13: Pollution Emission Reduction Performance Evaluation Results in Linyi...... 47
List of Figures
Figure 1: Emission Reduction of Atmospheric Pollutants in Tenth Five Year Plan Period.................................................................................................................... 7
Figure 2: Discharge Reduction of Water Environmental Pollutants in Tenth Five Year Plan Period............................................................................................................ 8
Figure 3: Environmental Protection Investment in Tenth Five Year Plan Period................ 9
Figure 4: Pollution Emission Reduction in Eleventh Five Year Plan Period..................... 13
Figure 5: DPSIR Framework.............................................................................................. 17
Figure 6: Calculation Result of Pollution Emission Reduction Performance Indicators ... 35
Figure 7: Composition of Pollution Emission Reduction Performance Indicators ............ 35
Figure 8: Performance indicators of different equal weight methods ................................ 38
Figure 9: Indicator compositions after change of equal weight distribution method......... 39
ii

China EPA for 11th Five Year Plan
List of Acronyms and Abbreviations
COD Chemical Oxygen Demand
DPSIR Driving forces Pressure States Impacts Responses
EEA European Environment Agency
EI Environmental Indicator
EPA Environmental Performance Assessment
FYP Five Years Plan
IIASA International Institute for Applied Systems Analysis
IMAGE Integrated Model to Assess the Global Environment
MEP Ministry of Environmental Protection
OECD Organization for Economic Co-operation and Development
RAINS Regional Air Pollution Information and Simulation
RIVM Dutch National Institute for Public Health and the Environment
SO2 Sulfur Dioxide
UNEP United Nations Environment Programme
iii

China EPA for 11th Five Year Plan
iv

China EPA for 11th Five Year Plan
1 INTRODUCTION
The “Planning of the Eleventh Five Year Plan for National Economic and Social Develop-ment of the People’s Republic of China” proposed the restrictive index of 10% total emission reduction of major pollutants in the 11th Five Year Plan period: in 2010, discharge of chemical oxygen demand (COD) and sulfur dioxide (SO2) in the country will drop 10% respectively compared with 2005, i.e. discharge of chemical oxygen demand will be reduced from 14.142 million tons in 2005 to 12.728 million tons and emission of sulfur dioxide reduced from 25.494 million tons in 2005 to 22.944 million tons. To fully achieve the emission reduction goal set in the Eleventh Five Year Plan, the State Council formulated the “Comprehensive Work Plan of Saving Energy and Diminishing Pollution”, in accordance with which the Min-istry of Environmental Protection (MEP) gradually established and developed the emission reduction system including emission reduction evaluation, monitoring, statistics, examination, dispatching, direct reporting, filing, early warning and information disclosure and, jointly with the departments concerned, promulgated and implemented a series of policy documents in-cluding “Energy Saving Environmental Protection Power Generation Dispatching Method (Trial Implementation)”, “Method for Managing the Operation of Desulphurization Facilities for Coal Fired Power Generating Units and Electricity Price” and “Interim Measures on State Revenue Special Fund Management for Emission Reduction of Major Pollutants”. Govern-ments at all levels further changed their concepts, improved emission reduction mechanism and system and developed a top down emission reduction implementation mechanism. With joint efforts made by all parties, pollution emission reduction made significant progress. In 2010, total discharge of chemical oxygen demand in China was 12.381 million tons and total emission of sulfur dioxide was 21.851 million tons, reduced 12.45% and 14.29% respectively compared with 2005, both over fulfilling the 10% emission reduction goal.
The “Planning of the Twelfth Five Years Plan for National Economic and Social Develop-ment” further proposed the total emission control target in the Twelfth Five Year Plan period: in 2015, energy consumption and carbon dioxide emission per unit GDP will drop 16% and 17% respectively, COD and SO2 drop 8% respectively and ammonia nitrogen and nitric ox-ides drop 10% respectively. Minister Zhou Shengxian pointed out, in the signed article “Deeply advance the reform and innovation of environmental protection system and actively explore China’s new environmental protection road”, that in meeting the requirements of the Outline, the overall consideration for China’s environmental protection work in the Twelfth Five Years Plan period is: focus on the theme of scientific development, the main line of changing economic development pattern and the new requirements for improving ecological civilization level to actively explore a low cost, high benefit, low emission and sustainable new environmental protection road; lay stress on solving the prominent environmental prob-lems that affect scientific development and impair the masses’ health to plan as a whole the relations between total emission reduction and environmental quality improvement, environ-mental risk prevention and balanced urban and rural development, further optimize economic development and guarantee the improvement of people's livelihood. Improving environmental quality has become the basic destination and important goal for the environmental protection work in the Twelfth Five Year Plan period.
Hence the Twelfth Five Years Plan has proposed new requirements for pollution emission reduction work: firstly, in emission reduction contents, ammonia nitrogen and nitric oxides are added to the pollutants for total emission reduction and the range of total emission reduc-
5

China EPA for 11th Five Year Plan
tion is enlarged. Secondly, in emission reduction goals, it is required that not only the total emission control goal should be accomplished but also the total emission reduction work should be linked with environmental quality improvement, environmental risk prevention and balanced urban and rural development. Thirdly, in emission reduction approaches, total emis-sion reduction shall embody the requirements for building a low cost, high benefit, low emis-sion and sustainable new environmental protection road. To further increase the pertinence of pollution emission reduction policies and enhance the performance of pollution emission re-duction policies, it is urgently needed to analyze the emission reduction work effect in the Eleventh Five Year Plan period in a comprehensive and objective way, recognize and summa-rize the actual experience and weak link of total emission reduction work to set the stage for designing the emission reduction policies and schemes for the Twelfth Five Years Plan period and exploring the low cost, high benefit, low emission and sustainable new environmental protection road.
Based on the above goals, the Department of International Cooperation and the Department of Total Pollutants Control of the Ministry of Environmental Protection and the Chemicals Branch of United Nations Environment Programme have jointly initiated China Pollution Emission Reduction Performance Assessment Program.
This report is one of the main outputs of this program and it mainly introduces the learning results of international experience and the performance assessment methods of the Eleventh Five Year Plan emission reduction policy established in accordance with China’s actual con-ditions. Finally, it provides a comprehensive analysis of pollution emission reduction condi-tions and effects in the Eleventh Five Year Plan period based on the available data and puts forward suggestions on the formulation and implementation of the total emission reduction policies in the Twelfth Five Year Plan.
1.1 Background of issuing the emission reduction policies
Total emission control is an environmental management measure used commonly in the world in recent years and total emission control is also an important system in China’s environ-mental protection. China started to implement the total pollutants emission reduction system in the Ninth Five Year Plan period but in implementation effect, the total pollution reduction goal has never been accomplished and especially in the Tenth Five Year Plan period, total emission reduction did not fall but rose. In the Tenth Five Year Plan period, China proposed a 10% reduction goal of SO2, dust (smoke dust and industrial dust), COD, ammonia nitrogen and industrial solid waste compared with 2000 but except industrial dust, emission of all pol-lutants showed an increase trend (Table 1) and environmental quality deterioration trend was rising.
6

China EPA for 11th Five Year Plan
Table 1: Pollutants Emission and Reduction Goal (10,000 t) in 10th FYP Period
Pollution type
Pollutant 2000 2001 2002 2003 2004 2005 Reduction goal
SO2 1995.1 1947.2 1926.6 2158.5 2254.9 2549.4 1800 Smoke
dust 1165.4 1069.8 1012.7 1048.5 1095 1182.5 1048
Atmos-pheric
pollution Dust 1092 990.6 941 1021.3 904.8 911.2 983 COD 1445 1404.8 1366.9 1333.9 1339.2 1414.2 1300 Water
pollution Ammonia nitrogen
125.2 125.2 128.8 129.6 133 149.8 113
In the atmospheric pollution control field, except industrial dust, no pollutants for total emis-sion control achieved the 10% reduction goal in the Tenth Five Year Plan period. SO2 emis-sion increased from 19.478 million tons in 2001 to 25.494 million tons in 2005, up 27.8% compared with 2000; in the two control areas, SO2 emission increased from 13.16 million tons in 2000 to 13.54 million tons in 2005, up 2.9% in the Tenth Five Year Plan period. Smoke dust emission increased from 11.65 million tons in 2000 to 11.83 million tons in 2005, up 1.5% (Figure 1). Pollutant removal rate of major atmospheric pollution industries was rela-tively low. In 2005, SO2 removal rate of the three major industries of electric power industry, nonmetallic mineral product manufacturing industry and ferrous metal smelting & processing industry where SO2 emission is high was lower than the national average level. In 46% cities with district establishment, air quality could not reach Grade II standard and in some big and medium cities, hazy days increased slightly and acid rain pollution was not mitigated
SO2 Emission Reduction Smoke dust Emission Reduction Dust Emission Reduction
Emission Reduction Goal
Figure 1: Emission Reduction of Atmospheric Pollutants in Tenth Five Year Plan Period
7

China EPA for 11th Five Year Plan
COD Discharge Reduction Ammonia Nitrogen Discharge Reduction
Discharge Reduction Goal
Figure 2: Discharge Reduction of Water Environmental Pollutants in Tenth Five Year Plan Period
Total control goal of water environmental pollutants was not achieved, wastewater discharge was in an increase trend and environmental quality improvement effect was not high. Waste water in China increased from 41.52 billion tons in 2000 to 52.45 billion tons in 2005, up 26.3%. COD discharge increased from 14.45 million tons in 2000 to 14.142 million tons, down 2.1% while ammonia nitrogen discharge increased from 1.252 million tons in 2001 to 1.498 million tons in 2005, up 19.6%, both failing to achieve the pollution emission reduction goal in the Tenth Five Year Plan period (Figure 2). Municipal domestic wastewater treatment rate increased from 14.5% in 2000 to 37.4% in 2005, growing speed being relatively low. COD removal rate was low in major water pollution industries including paper making indus-try, agricultural and sideline food processing industry and chemical feedstock and chemical product industry and had a very large room for emission reduction. The major watershed management task of “Three Rivers and Three Lakes” including Huaihe, Haihe and Liaohe Rivers and Taihu, Chaohu and Dianchi Lakes only accomplished 60% scheduled goal and discharge of major pollutants exceeded environmental capacity, water environment pollution being very serious. 26% surface water monitoring sections had water quality worse than Grade V and 62% sections could not reach Grade III standard. 90% river reaches flowing through cities were polluted to different extents and 75% lakes showed eutrophication. Water quality of drinking water source areas of 30% major cities could not reach Grade III standard and water pollution further aggravated the scarcity of water sources in China. As a result, “water quality-induced” water shortage occurred to different extents in the southern water-rich regions in China.
Ecologic environment is not optimistic. Water erosion area in China is 1.61 million km² and sandy land is 1.74 million km². Over 90% natural grassland is deteriorated, aquatic ecological functions of many rivers are badly unbalanced and biodiversity is reduced sharply. Rural envi-ronmental problem is serious, agricultural non-point source pollution is becoming heavier and heavier and soil pollution becoming increasingly severe. Pollution by hazardous waste, auto-mobile emission and persistent organic pollutants keeps increasing and China has entered a
8

China EPA for 11th Five Year Plan
high frequency period of pollution accidents and an economic and environmental contradic-tion protruding period.
Environmental
protection invest-ment
Proportion of envi-ronmental protec-tion investment in
GPD
Growth rate of environmental
protection investment
GDP growth rate
100,000,000 Yuan
Growth rate and proportion
Environmental protection in-
vestment
Figure 3: Environmental Protection Investment in Tenth Five Year Plan Period
In general, the situation that environmental protection in China lags behind economic devel-opment did not change in the Tenth Five Year Plan Period and the overall trend of ecological environmental deterioration was not effectively brought under control. Of the most seriously polluted 20 cities in the world, 16 are in China and about 300 Chinese cities are facing a seri-ous water shortage problem. The proportion of the industries with irrational industrial struc-ture, high energy consumption, high pollution, low efficiency and low output is still very high in national economy. The extensive economic growth mode did not fundamentally change and investment in economic protection still lagged behind economic development. According to the monetized calculation of losses from environmental pollution in China performed by Chi-nese Academy for Environmental Planning of the Ministry of Environmental Protection, in 2005 environmental degradation cost in China was 578.79 billion Yuan, accounting for 2.93% GDP while investment in environmental protection in China was only 1.3% GDP (Figure 3). Compared with the losses from environmental degradation, investment in environmental pro-tection was very insufficient and historically accumulated problems arising from economic development kept increasing.
In the Eleventh Five Year Plan period, if no stricter pollution treatment is carried out for envi-ronmental pollution; environmental pollution crisis in China will become further serious.
Firstly, in terms of the pressure brought about to environmental pollution by economic growth, GDP in China in the Eleventh Five Year Plan period was still kept at 9% and indus-trial value added kept growing at 12%. With production of pollutants per unit GDP not changed considerably, production of pollutants for various environmental pollutions in China
9

China EPA for 11th Five Year Plan
will show a rapid growth trend and environmental pressure arising from economic growth keeps increasing.
Secondly, urbanization will further aggravate environmental pollution. In the Eleventh Five Year Plan period, urbanization rate in China will increase from 43% in 2005 to 50% in 2010 and urban population will increase by 90 million. Rural per capita water consumption is only 71 L while urban per capita water consumption is 210L. Small and medium sized cities are the main regions where urban population increases but wastewater treatment facilities in these cities are not complete and many small and medium sized cities do not have municipal wastewater treatment facilities and thus have a low municipal wastewater treatment rate. Therefore, further increase of urbanization rate not only aggravates the deficiency of water resources in China but also increases the production of domestic wastewater pollutants and causes water environmental quality to deteriorate.
Thirdly, with the improvement of the people’s living standard and increase of livestock and poultry consumption, agricultural non-point source pollution resulting from large scaled live-stock and poultry breeding will be more serious. In the Eleventh Five Year Plan period, pig, milk cow, layer and chicken for large scaled breading all grew at >35%. With discharge coef-ficient of various livestock and poultry pollutants basically not changed, water environmental pollution pressure from large scaled livestock and poultry breeding will further increase. Ac-cording to the research findings of the “Special Water Project” topic by Chinese Academy for Environmental Planning of the Ministry of Environmental Protection, COD discharge from large scaled livestock and poultry breeding is 35% total discharge in China. The characteris-tics of agricultural non-point source pollution such as randomness, dispersivity, mechanism process complexity, and temporal and spatial variability of pollution load decide its difficulty of pollution treatment. Therefore, great importance must be attached to the environmental quality degradation of water bodies such as rivers and lakes induced by agricultural non-point source pollution.
Fourthly, following 30 years of high speed economic development in China, a series of cumu-lative and sudden environmental risks will gradually emerge and the trend of high incidence for environmental pollution accidents may continue to exist in the Eleventh Five Year Plan period. Therefore, in the Eleventh Five Year Plan period, the contradiction between economic and social development and resource environmental restriction will further increase and envi-ronmental protection in China will face a severer and severer challenges.
1.2 Main contents of the Eleventh FYP emission reduction policies
1.2.1 Emission reduction goal
In order to improve China’s environmental quality, reduce environmental pollution emission, adjust industrial structure, change development pattern, solve regional environmental prob-lems and mitigate the contradictions between environmental pollution and economic devel-opment, the Party Central Committee and the State Council promptly proposed the restrictive index of 10% total emission reduction of major pollutants in the 11th Five Year Plan period: in 2010, emission of chemical oxygen demand and sulfur dioxide in the country will drop 10% respectively compared with 2005, i.e. discharge of chemical oxygen demand will be re-duced from 14.14 million tons in 2005 to 12.7 million tons and emission of sulfur dioxide
10
China EPA for 11th Five Year Plan
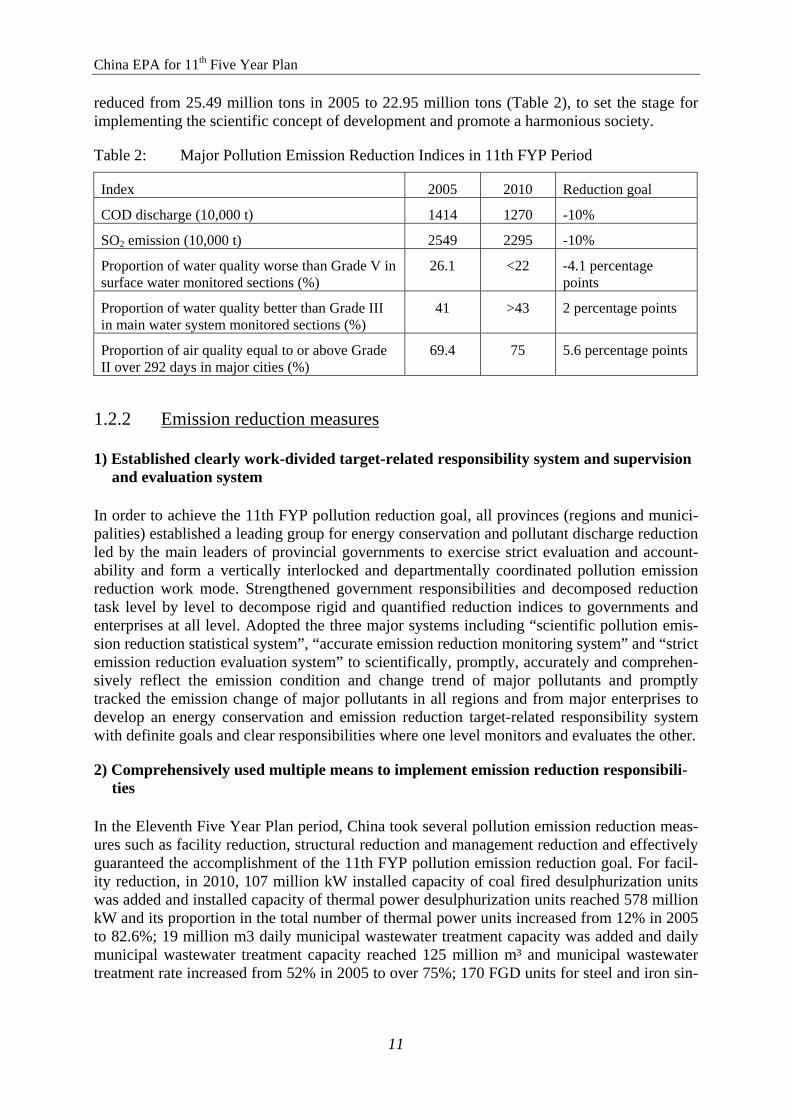
reduced from 25.49 million tons in 2005 to 22.95 million tons (Table 2), to set the stage for implementing the scientific concept of development and promote a harmonious society.
Table 2: Major Pollution Emission Reduction Indices in 11th FYP Period
Index 2005 2010 Reduction goal
COD discharge (10,000 t) 1414 1270 -10%
SO2 emission (10,000 t) 2549 2295 -10%
Proportion of water quality worse than Grade V in surface water monitored sections (%)
26.1 <22 -4.1 percentage points
Proportion of water quality better than Grade III in main water system monitored sections (%)
41 >43 2 percentage points
Proportion of air quality equal to or above Grade II over 292 days in major cities (%)
69.4 75 5.6 percentage points
1.2.2 Emission reduction measures
1) Established clearly work-divided target-related responsibility system and supervision and evaluation system
In order to achieve the 11th FYP pollution reduction goal, all provinces (regions and munici-palities) established a leading group for energy conservation and pollutant discharge reduction led by the main leaders of provincial governments to exercise strict evaluation and account-ability and form a vertically interlocked and departmentally coordinated pollution emission reduction work mode. Strengthened government responsibilities and decomposed reduction task level by level to decompose rigid and quantified reduction indices to governments and enterprises at all level. Adopted the three major systems including “scientific pollution emis-sion reduction statistical system”, “accurate emission reduction monitoring system” and “strict emission reduction evaluation system” to scientifically, promptly, accurately and comprehen-sively reflect the emission condition and change trend of major pollutants and promptly tracked the emission change of major pollutants in all regions and from major enterprises to develop an energy conservation and emission reduction target-related responsibility system with definite goals and clear responsibilities where one level monitors and evaluates the other.
2) Comprehensively used multiple means to implement emission reduction responsibili-ties
In the Eleventh Five Year Plan period, China took several pollution emission reduction meas-ures such as facility reduction, structural reduction and management reduction and effectively guaranteed the accomplishment of the 11th FYP pollution emission reduction goal. For facil-ity reduction, in 2010, 107 million kW installed capacity of coal fired desulphurization units was added and installed capacity of thermal power desulphurization units reached 578 million kW and its proportion in the total number of thermal power units increased from 12% in 2005 to 82.6%; 19 million m3 daily municipal wastewater treatment capacity was added and daily municipal wastewater treatment capacity reached 125 million m³ and municipal wastewater treatment rate increased from 52% in 2005 to over 75%; 170 FGD units for steel and iron sin-
11

China EPA for 11th Five Year Plan
tering machines were built and operated and its proportion in the total of sintering machines increased from 0% in 2005 to 15.6% in 2010.
For structural reduction, totally 72.1 million kW small thermal power units were decommis-sioned and the task of decommissioning 50 million kW was accomplished 1.5 years ahead of schedule. Elimination of backward production capacity was carried out for high energy con-suming and high emission industries such as iron & steel, cement, coking and paper making, alcohol and monosodium glutamate, including 110 million tons of iron making capacity, 68.6 million tons of steelmaking, 330 million tons of cement, 93 million tons of coke, 7.2 million tons of paper making, 1.8 million tons of alcohol, 0.3 million tons of monosodium glutamate and 38 million weight cases. In 2010, the proportion of installed capacity of >300 MW ther-mal power units in the national electrical power industry increased from 47% in 2005 to over 70% and coal consumption for thermal power supply dropped 9.5% and COD pollution dis-charge load per unit product in the paper making industry dropped 45%.
For management reduction, the state revenue provided more than 10 billion Yuan in the Elev-enth Five Year Plan period to support the construction of the “Three Major Systems” for pol-lution emission reduction and the environmental protection supervision and management ca-pacity in the country. 343 pollution source monitoring and control centers were built to auto-matically monitor and control 15,000 enterprises and more than 100,000 sets of monitoring and law enforcement equipment were arranged; thus environmental supervision and manage-ment ability was markedly enhanced. China Southern Power Grid Co. Ltd and many prov-inces carried out energy conservation, emission reduction, power generation and dispatching to evaluate the operation rate of coal fired desulphurization units and deduct desulphurization electricity price and operation rate increased from less than 60% in 2005 to more than 95% in 2010. Compliance rate of SO2 and COD from key pollution sources under national monitoring program was 92% and 94% respectively, up 22% and 34% compared with 2005.
3) Strengthened the systems and capacity guarantee for determining and implementing the goal set in the plan
In order to accomplish the pollution emission reduction goal set in the Eleventh Five Year Plan, the “Guidelines for Preparing the Total Emission Reduction Plan for Major Pollutants (Trial Implementation)” and the “Detailed Rules for Calculating Total Emission Reduction of Major Pollutants (Trial Implementation)” were printed and issued and the environmental management systems such as emission reduction evaluation, statistics, monitoring, examina-tion, dispatching, direct reporting, filing, information disclosure and early warning were adopted to ensure continuous advance of emission reduction. To ensure that emission reduc-tion data was true and creditable, the Ministry of Environmental Protection organized forces biannually to examine emission reduction on the spot in all regions and it stipulated that local emission reduction results could not be openly released until approved by the Ministry of En-vironmental Protection. Through “Regional Restricted Approval” and by enhancing project admittance conditions, controlled new pollution from the development source. Carried out special environmental protection activities and severely investigated and prosecuted environ-mentally unlawful act. Organized several national training sessions for pollution emission reduction work and technical training sessions for examination methods and detailed account-ing rules and trained more than 2,000 persons (times) of leaders and administrative and tech-nical personnel at all levels responsible for emission reduction in the national environmental protection system. Governments at all levels strengthened pollution emission reduction man-agement and law enforcement capacity building and focused on the need of pollution emission
12

China EPA for 11th Five Year Plan
reduction work to enhance pollution emission reduction management and law enforcement force.
4) Completion condition of emission reduction
Guaranteed by a series of emission reduction policy measures, China over-fulfilled the pollu-tion emission reduction goal set in the Eleventh Five Year Plan. In 2010, China’s COD dis-charge was 12.381 million tons, down 12.5% compared with 2005. SO2 emission was 21.851 million tons, down 14.3% compared with 2005 (Figure 4). Installed capacity of desulphuriza-tion units in the country reached 461 million kW and annual desulphurization capacity was 12 million tons. The proportion of installed capacity of desulphurization units in total installed capacity of thermal power rose from 12% to 71% and municipal wastewater treatment rate rose to 75%. The proportion of water quality better than Grade III in main water system moni-tored sections increased from 41% in 2005 to 59.9% in 2010, proportion of water quality worse than Grade V in surface water monitored section dropped to 16.4% and proportion of air quality equal to or above Grade II over 292 days in major cities exceeded 95%, all achiev-ing the goal set in the Eleventh Five Year Plan. Average concentration of permanganate index in surface water monitored sections dropped 24% compared with 2005 and the proportion of main environmental protection cities with air quality equal to Grade II increased from 40.7% to 67.3%.
COD Discharge Reduction SO2 Emission Reduction
Emission Reduction Goal
Figure 4: Pollution Emission Reduction in Eleventh Five Year Plan Period
1.3 Significance for performance assessment
Performance assessment is an open and effective environmental management tool and an im-portant link in environmental policy execution process. Appropriate indices are used to meas-
13

China EPA for 11th Five Year Plan
ure and assess the environmental effects gained after environmental policies are implemented so as to measure the advantages and disadvantages of regional environmental policies, reveal the change situation of environmental policies, enhance public environmental consciousness and guide environmental policies to sound development. Environmental performance not only refers to the environmental effect generated from environmental management activities but also contains cost factor input to improve environmental conditions, thus being a concept that embodies environmental protection efficiency.
Under the economic development circumstance that China’s average GDP growth rate ex-ceeds 10%, Chinese Government has implemented the 11th FYP pollution emission reduction policies and over fulfilled the pollution emission reduction tasks for COD and SO2 pollutants etc. However, except the emission reduction indices of pollutants like COD and SO2 have made this achievement, what improvements have been made by the implementation of emis-sion reduction policies in pollution control ability, environmental quality, enterprise produc-tion and pollution control technological advance and industrial and national economic struc-tural optimization? Scientific and rational indices need to be chosen to measure the effects gained from the implementation of pollution emission reduction performance.
At the same time, implementation and completion of any polices need costs. In order to achieve the 11th FYP pollution emission reduction task, Chinese Government took measures like facility reduction, structural reduction and management reduction to increase investments in treatment of pollution industries, eliminate backward production capacities of a series of industries including thermal power, coking, cement, paper making, alcohol, monosodium glu-tamate and citric acid and set up special funds for pollutants emission reduction to support the “Three Major Systems” for countrywide pollution emission reduction and environmental pro-tection supervision and management capacity building. In order to scientifically reflect the efficiency of pollution emission reduction policies, it is necessary to calculate various costs and fees for pollution emission reduction so as to compare the effects and costs of pollution emission reduction, analyze the “efficiency” of pollution emission reduction in depth and sys-tematically and provide a better scientific basis for China to choose various policies to carry out pollution emission reduction in the Twelfth Five Year Plan period.
Thirdly, as resource environment and global climate change crisis is increasing gradually, international communities and domestic public pay higher and higher attention to environ-mental problems and environmental protection departments and especially informatization and networkization development gradually reduces information transmission. Sudden and regional pollution problems can very easily trigger the extensive attention of social public to pose huge pressure to government sectors. Although China has accomplished the 11th FYP pollution emission reduction task, the people hold different views on the improvement of en-vironmental quality brought about by pollution emission reduction. For this reason, public satisfaction with environmental quality needs to be surveyed to truly reflect the efforts made by environmental protection departments to improve environmental quality on the one hand, and assess the real effects of environmental quality improvement by a series of environmental policies including total pollutants control on the other hand. By disclosing the assessment results to the public to increase public right to learn the truth, it is possible to effectively re-lease the pressure from the international community and domestic public and eventually pro-mote the smooth progress of environmental protection work.
14

China EPA for 11th Five Year Plan
2 METHODOLOGY FOR ASSESSING THE PERFORMANCE OF EMISSION REDUCTION POLICIES
2.1 Driving force-Pressure-State-Impact-Response (DPSIR) framework
DPSIR indicator framework originally known as the Stress-Response framework developed by two scientists working at Statistics Canada, Anthony Friend and David Rapport (Rapport and Friend, 1979). In 1991 in OECD this model has evolutes to PSR (Pressure-Stress-Response) framework within added new features of Pressure indicators. With the develop-ment of the large environmental models such as RAINS (Regional Air Pollution Information and Simulation) and IMAGE (Integrated Model to Assess the Global Environment) by IIASA (International Institute for Applied Systems Analysis) and RIVM (Dutch National Institute for Public Health and the Environment) respectively, the DPSIR model became further formal-ized. The new features including a more precise differentiation between driving forces, pres-sures, the resulting state of systems, the impacts (among others on the economy) and policy responses. Later the EEA helped to make this final DPSIR framework more widely known in Europe since 1995. From 2001 EEA started published its indicators on web.
In a systematic and analytic view, DPSIR framework helps understanding environmental changes caused by societal activities. First social and economic developments as Driving-forces exert Pressure on the environment and, therefore, the State of the environment changes, such as the provision of adequate conditions for health, resources availability and biodiversity. Consequently, the changes leads to Impacts on human health, ecosystems and natural system that may trigger a societal Response that affect back on the Driving forces or on the state or impacts directly. DPSIR is not only a more complicated framework but also a more compre-hensive and sophisticate framework
Driving forces describe the social, demographic and economic developments in societies and the corresponding changes in lifestyles, overall levels of consumption and production patterns. Primary driving forces are population growth and developments in the needs and activities of individuals. These primary driving forces provoke changes in the overall levels of production and consumption. Through these changes in production and consumption, the driving forces exert pressure on the environment.
Pressure indicators describe developments in release of substances (emissions), physical and biological agents, the use of resources and the use of land by human activities. The pressures exerted by society are transport and transform through variety of natural processes to manifest themselves in changes of environmental conditions.
State indicators give a description of the quantity and quality of physical phenomena (such as temperature), biological phenomena (such as fish stocks) and chemical phenomena (such as atmospheric CO2 concentrations) in a certain area. State indicators, for instance, may describe the forest and wildlife resources present, the concentration of phosphorus and sulfur intakes, or the level of noise in the neighborhood of airports.
Pressure on the environment cause the state of the environment changes. These changes then have impacts on the functions of the environment, such as human and ecosystem health, re-
15

China EPA for 11th Five Year Plan
sources availability, losses of manufactured capital, and biodiversity. Impact indicators are used to describe changes in these conditions.
Response indicators refer to responses by groups (and individuals) in society, as well as gov-ernment attempts to prevent, compensate, ameliorate or adapt to changes in the state of the environment.
DPSIR system can macroscopically help the mankind understand the relation between social activities and environmental change. Firstly, social and economic development is defined as driving force, the source of environmental pressure, and it forces environmental condition to change. For example, the appropriate conditions provided for health, resource availability and biodiversity all cause changes. These changes bring impact to human health, ecosystem and natural system that may trigger social response which in turn directly affects driving force or state or impact. DPSIR is not only a complicated cycle framework but also a comprehensive and complete logic framework.
As the most direct response of the government to environmental problems, it is seen from Figure 5 that the change of environmental policies can change environmental pressure, state and impact and further cause the driving force to change, which eventually leads to the ad-justment of human production and consumption behaviors. To measure the effect of energy conservation and emission reduction policies, in addition to analyzing whether the energy conservation and emission reduction goal set by our country is achieved, It is necessary to judge whether environmental supervision ability is strengthened, environmental quality is improved, economic development mode is changed and mechanism including environmental protection in comprehensive decision making is established. Emission reduction goal and pol-lutants emission reduction amount reflect environmental pressure change, environmental qual-ity reflects state change, environmental supervision ability reflects direct effect of response, economic development mode change reflects the impact of emission reduction policies on the driving force that causes environmental change, and including environmental protection in comprehensive decision making reflects the comprehensive effect of various policies. There-fore, performance analysis of emission reduction policies can be interpreted by a complete DPSIR framework.
16

China EPA for 11th Five Year Plan
Driving force (social and economic activities) Response (management and policy tool)
Pressure (emissions inventory) Impact (direct loss and indirect loss)State (environmental quality and resource inventory)
Figure 5: DPSIR Framework
2.2 DPSIR-based performance descriptive indicators
2.2.1 EEA and DPSIR formation
The European Environment Agency (EEA) is an agency of the European Union. The Euro-pean Union adopted the regulation establishing the EEA in 1990. It came into force in late 1993 immediately after the decision taken to locate the EEA in Copenhagen. Work started in earnest in 1994.
In EEA’s classification system, all DPSIR indicators belong to Descriptive Indicators cate-gory which named Type A by EEA. Other categories are including Type B. Performance In-dicators Type C. Efficiency Indicators Type D. Policy-effectiveness indicator Type E. Wel-fare Indicators Therefore, DPSIR framework should not cross confusing with ABCDE classi-fication system.
However, in some case, DPSIR indicators not represent the characteristics of descriptive indi-cators only, but also contain some features of other type of indicators. For instance, an Impact indicator could on behalf of either descriptive indicators (A) or policy-effectiveness indicators (B) at the same time (more details will discuss later).
17

China EPA for 11th Five Year Plan
Table 3: Terminology and typology of EEA
Name Type in
EEA system
Contents
Feasible in Environ-
mental Per-formance
Assessment?
Implication
Driving-force Indicators Pressure Indicators Stress Indicators Impact Indicators
Descriptive Indicators A
Response Indicators
Yes
Describe envi-ronmental
status and logi-cal chain be-
hind it
Performance Indicators B
They measure the distance between cur-rent environmental situation and the desired situation (target)
No
Make predic-tion on envi-
ronmental progress
Efficiency Indicators C
They provide insight in the efficiency of products and processes. Efficiency in terms of the resources used the emissions and waste generated per unit of desired output.
No
Identify the efficiency of
environmental services
Policy-Effective-
ness Indica-tor
D
Policy effectiveness indicators relate the actual change of environmental variables to policy efforts. As such, they are a link between response indicators on one hand and state, driving force, pressure or im-pact indicators on the other.
Yes
Check the ef-fectiveness of environmental improvements
Total Wel-fare Indica-
tors E N/A No
Evaluate eco-nomic contri-bution envi-
ronment
2.2.2 Global well-recognized environmental indicators
Many international organizations e.g. OECD (Organization for Economic Cooperation and Development) UNEP (United Nations Environment Programme) and EEA (European Envi-ronment Agency) publish their own environmental indicators respect for various environ-mental issues annually or biannually. Sometimes the expression and/or unit of the indicators may slightly change in order to adapt the new situations and trends.
EEA and OECD have selected for taking a closer look of their environmental indicators. Table 4 below is showing statistics of indicators development from both organizations. Be-ware that OECD is not an environment-oriented organization so the number of OECD’s indi-cators in the Table 4 only represent environmental indicators in OECD indicator stock.
Table 4: Summary of indicators from OECD and EEA Organization Number of core
set of Indicators Number of Specific Indicators
First year publish
Scale
OECD 10 Around 30 2001 30 countries globally EEA 10 37 2004 27 EU countries
Indicators development of OECD and EEA Source from: OECD 2008 and EEA 2005
18

China EPA for 11th Five Year Plan
Table 5 below details the core environmental indicators extracted from both EEA (2004) and OECD (2008) publications. Many overlapped issues can observed from Table 5.
Table 5: Core environmental indicators in EEA and OECD Core Environmental Indicator EEA OECD
1 Air pollution and ozone depletion Air Quality 2 Biodiversity Biodiversity 3 Climate Change Climate Change 4 Terrestrial Ozone layer 5 Waste Waste Generation 6 Water Freshwater Resources 7 Agriculture Forest Resources 8 Energy Energy Resources 9 Fisheries Fish Resources
10 Transport Freshwater Quality
Core environmental indicators in EEA Source from: EEA 2005 and OECD 2008
One of the core indicators leading many different specific indictors in which specifically tar-get environmental issue. Additionally, EEA puts more effort on indicators identification and classification than OECD.
Based on DPSIR framework, UNEP has designed a set of relatively complete assessment in-dicator system for pollution emission reduction performance assessment (Refer to Table 3), pointed out the application method of the indicator system (Table 4) and emphasized that per-formance assessment of pollution emission reduction policies can be accomplished by de-scription of a single index and additionally the impact of emission reduction policies can be quantitatively assessed by combinatory analysis among different indices.
Table 6: DPSIR-Based Performance Analysis Indicators System Index classification Characteristic index Specific index
Added value of heavy pollution industries Industrial Industrial development Proportion of coal consumption Motor vehicle quantity Per capita energy con-sumption
Domestic Urbanization, e.g. car consump-tion and urban runoff increase
Urbanization rate
Social and economic activities
Agricultural Use of fertilizer and pesticide and their discharge to rivers
Consumption of chemical fertilizer and pesticide
Volcanic eruption Volcanic eruption
Volcanic eruption frequency and inten-sity
Driving force
Natural interference
Eutrophication Natural eutrophication Water body eutrophi-cation frequency and extent
19

China EPA for 11th Five Year Plan
Index classification Characteristic index Specific index
Effluent release and/or total emission total
Emission of SO2, NOx, COD and am-monia nitrogen SO2 emission from industrial sector
Emissions inventory Effluent release/emission from departments and/or cities NOx emission from
industrial sector
Effluent concentration in air (average, short term, long term)
Proportion of SO2 that forms sulfuric acid in air in total SO2
Effluent reaction and deposi-tion Effluent concentration in water
body (average, short term, long term)
Proportion of com-pounds that incur chemical reaction in wastewater in total compounds
Air
Effluent concentration and emission amount in air com-pared with other types of efflu-ents
Annual average pre-cipitation of acid rain containing sulfate radical
Water
Effluent concentration and dis-charge amount in water com-pared with other types of efflu-ents
Proportion of water with COD beyond standard that flows to underground drinking water source, in total wastewater discharge
Pressure
Effluent destination
Soil Effluent concentration and dis-charge amount in soil compared with other types of effluents
Increased proportion of various pollutants in soil due to discharge of pollutants
Emission concentration (annual base, air quality)
Annual average con-centration of SO2, PM10 and NOx
Chemical composition of air Proportion of SO2 and NO2 in air
Meteorological conditions
Annual average mon-soon intensity (atmos-pheric pollutant trans-fer speed)
Basic account
Hydrologic regime COD-contaminated water body transfer speed
Water area biodiversity index Number of biologic species per unit water area
Toxic substance accumulation Concentration of toxic substance Urban air quality grade
Habitat conditions Number of acid rain affected cities
State
Ecosystem potential
Vulnerability stress and natural interference
Energy consumption per unit GDP
Impact Direct loss Human health Contaminated water and pol-luted air are related to diseases for treatment in hospital
Number of related disease outpatients
20

China EPA for 11th Five Year Plan
Index classification Characteristic index Specific index
Treatment in emergency de-partment
Number of outpatients in emergency depart-ment
Pollutant concentration in soil and aquatic system pH change rate
Ecosystem Quantity of affected aquatic animals, plants, phytoplankton and zooplankton
Quantity of affected aquatic animals, plants, phytoplankton and zooplankton
Resource Reduce water availability Number of water defi-cient cities or waste-water irrigation area
Human health Diseases and bad health cause loss of working time
Economic loss from loss of working time due to health reason
Acid rain changes soil pH and leads to death of soil-dependent microorganisms and other or-ganisms
Economic loss from land deterioration Ecosystem
Endangered species are extinct or lost
Economic loss due to biodiversity reduction
Reduce air visibility (smog) Losses from traffic accidents
Acid rain causes damage to building materials, sculptures and monuments
Economic loss due to damage of building materials, sculptures and monuments
Acid rain causes damage to metal (copper, bronze) statues and other irreplaceable materi-als
Economic loss due to material damage
Impact on tourism Economic loss due to attraction reduction of tourism
Real estate Economic loss due to reduction of invest-ment in real estate
Fishing capacity decrease Economic loss due to reduction of fishery production
Indirect loss
Resource
Contaminated water and pol-luted air are related to diseases for treatment in hospital
Economic loss from loss of working time due to health reason
Response
Economic response
Increase pollution control infra-structure construction
Number of desulphuri-zation facilities and wastewater treatment plants
21

China EPA for 11th Five Year Plan
Index classification Characteristic index Specific index
Facility investment Total investment in pollution treatment facilities
Government subsidy for indus-try
Subsidy amount re-lated to emission re-duction
Increase pollution treatment capacity
New wastewater treatment capacity and new desulphurization facility desulphurizing capacity
Ecological efficiency substitute conventional product
Proportion of energy saving and environ-mental protection products
Industrial technological im-provement
Proportion of enter-prises that carry out cleaner production
Management response
Emission standard and limit Newly issued pollut-ants emission stan-dard/limit
Table 7: Policy Performance Assessment Method Class Policy effect index Function
Response Measure government work effort State Check environmental quality improvement Independent descrip-
tive index Pressure Measure environmental pressure change
Response-pressure Measure emission reduction goal accom-plishment
Response-state Measure whether environmental quality is improved
Combined descrip-tive index
Pressure-driving force Measure whether economic structure is opti-mized
2.3 Establish emission reduction performance indicators system
2.3.1 Build the indicators system
The DPSIR indicators system provided by UNEP is relatively comprehensive but in terms of China’s actual conditions, the data need for building this framework can not be fully met. Firstly, some indices have not started statistics in the present statistical system in China and the data needed can not be obtained. Secondly, some indices with data available are not closely related to the 11th FYP emission reduction performance and not suitable for being included as performance assessment indices. See Table 5.
22

China EPA for 11th Five Year Plan
Table 8: DPSIR Index Framework Provided by UNEP
Index classification Characteristic index Specific index suggestions
Added value of heavy pollution industries
Included; COD and SO2 emission intensity of indus-trial added value of first 5 heavy pollution indus-tries are adopted
Industrial Industrial devel-opment
Proportion of coal consumption
Not included; rec-ommended as analysis index
Motor vehicle quantity
Not included; key point of emission reduction in 12th FYP period, can be used as analysis index
Per capita energy consumption
Not included; rec-ommended as analysis index
Domestic
Urbanization, e.g., car con-sumption and urban runoff increase
Urbanization rate Not included; rec-ommended as analysis index
Social and economic activities
Agricultural
Use of fertilizer and pesticide and their dis-charge to rivers
Consumption of chemical fertil-izer and pesticide
Not included; key point of emission reduction in 12th FYP period, can be used as analysis index
Volcanic eruption
Volcanic erup-tion
Volcanic eruption frequency and intensity
Not included
Natural in-terference Eutrophica-
tion Natural eutro-phication
Water body eu-trophication fre-quency and ex-tent
Not included; dif-ficult to distin-guish from natural and artificial eu-trophication
Effluent release and/or total emission total
Emission of , NOx, COD and ammonia nitro-gen
SO2 and COD included
SO2 emission from industrial sector
Included as analy-sis index
Driving force
Emissions inventory Effluent re-lease/emission from depart-ments and/or cities
NOx emission from industrial sector
Included as analy-sis index
23

China EPA for 11th Five Year Plan
Index classification Characteristic index Specific index suggestions
Effluent concen-tration in air (average, short term, long term)
Proportion of SO2 that forms sulfuric acid in air in total SO2
Not included; lack of data support
Effluent reaction and deposi-tion Effluent concen-
tration in water body (average, short term, long term)
Proportion of compounds that incur chemical reaction in wastewater in total compounds
Not included; lack of data support
Air
Effluent concen-tration and emis-sion amount in air compared with other types of effluents
Annual average precipitation of acid rain contain-ing sulfate radical
Not included; lack of data support
Water
Effluent concen-tration and dis-charge amount in water com-pared with other types of efflu-ents
Proportion of water with COD beyond standard that flows to underground drinking water source in total wastewater dis-charge
Not included; lack of data support
Effluent destination
Soil
Effluent concen-tration and dis-charge amount in soil compared with other types of effluents
Increased propor-tion of various pollutants in soil due to discharge of pollutants
Not included; lack of data support
Emission con-centration (an-nual base, air quality)
Annual average concentration of SO2, PM10 and NOx
Not included as urban air quality grade includes the above factors
Chemical com-position of air
Proportion of SO2 and NO2 in air
Not included; lack of data support
Meteorological conditions
Annual average monsoon inten-sity (atmospheric pollutant transfer speed)
Not included; lack of data support Basic account
Hydrologic re-gime
COD-contaminated water body trans-fer speed
Not included; lack of data support
Water area bio-diversity index
Number of bio-logic species per unit water area
Not included; lack of data support
Toxic substance accumulation
Concentration of toxic substance
Not included; lack of data support
State
Ecosystem potential
Habitat condi- Urban air quality Included; the pro-
24

China EPA for 11th Five Year Plan
Index classification Characteristic index Specific index suggestions
grade portion of air qual-ity equal to or above Grade II over 292 days in major cities is used for comprehensive reflection tions
Number of acid rain affected cities
Included; the number of cities with acid rain occurrence among the monitored cities is adopted
Vulnerability stress and natu-ral interference
Desertification area
Not included; not closely related to this assessment
Contaminated water and pol-luted air are related to dis-eases for treat-ment in hospital
Number of re-lated disease outpatients
Included; eco-nomic loss due to air pollution is adopted for com-prehensive reflec-tion Human
health
Treatment in emergency de-partment
Number of outpa-tients in emer-gency department
Included; eco-nomic loss due to air pollution is adopted for com-prehensive reflec-tion
Pollutant con-centration in soil and aquatic system
pH change rate
Not included; lack of data support
Ecosystem Quantity of affected aquatic animals, plants, phytoplankton and zooplankton
Quantity of af-fected aquatic animals, plants, phytoplankton and zooplankton
Not included; lack of data support
Direct loss
Resource Reduce water availability
Number of water deficient cities or wastewater irri-gation area
Not included
Impact
Indirect loss Human health
Diseases and bad health cause loss of working time
Economic loss from loss of working time due to health reason
Included; eco-nomic loss due to air pollution is adopted for com-prehensive reflec-tion
25

China EPA for 11th Five Year Plan
Index classification Characteristic index Specific index suggestions
Acid rain changes soil pH and leads to death of soil-dependent mi-croorganisms and other organ-isms
Economic loss from land dete-rioration
Not included; lack of data support
Ecosystem
endangered species are ex-tinct or lost
Economic loss due to biodiver-sity reduction
Not included; lack of data support
Reduce air visi-bility (smog)
Losses from traf-fic accidents
Not included; lack of data support
Acid rain causes damage to build-ing materials, sculptures and monuments
Economic loss due to damage of building materi-als, sculptures and monuments
Included; eco-nomic loss due to air pollution is adopted for com-prehensive reflec-tion
Acid rain causes damage to metal (copper, bronze) statues and other irreplaceable materials
Economic loss due to material damage
Not included; lack of data support
Impact on tour-ism
Economic loss due to attraction reduction of tour-ism
Not included; lack of data support
Real estate Economic loss due to reduction of investment in real estate
Not included; lack of data support
Fishing capacity decrease
Economic loss due to reduction of fishery pro-duction
Not included; lack of data support
Resource
Contaminated water and pol-luted air are related to dis-eases for treat-ment in hospital
Economic loss from loss of working time due to health reason
Included; eco-nomic loss due to air pollution is adopted for com-prehensive reflec-tion
Response Economic response Increase pollu-tion control infrastructure construction
Number of desul-phurization facili-ties and wastewa-ter treatment plants
Reflected by desulphurizing capacity and wastewater treat-ment capacity
26

China EPA for 11th Five Year Plan
Index classification Characteristic index Specific index suggestions
Facility invest-ment
Total investment in pollution treatment facili-ties
Included
Government subsidy for in-dustry
Subsidy amount related to emis-sion reduction
Not included; lack of data support
Increase pollu-tion treatment capacity
New wastewater treatment capac-ity and new desulphurization facility desul-phurizing capac-ity
Included
Ecological effi-ciency substitute conventional product
Proportion of energy saving and environ-mental protection products
Not included; lack of data support
Industrial tech-nological im-provement
Proportion of enterprises that carry out cleaner production
Not included; lack of data support Management response
Emission stan-dard and limit
Newly issued pollutants emis-sion stan-dard/limit
No new standards or limitations are issued
After the indices that are unrelated and lack data support are removed, the obtained index sys-tem is regarded as the DPSIR index system that tallies with China’s national conditions. In addition, considering that China’s pollution response measures not only include environ-mental protection treatment investment but also include increase of pollution treatment facility operation efficiency brought about by personnel training and supervision strengthening, , the indices of annual average load rate of treatment facilities in wastewater treatment plants and the comprehensive desulphurization efficiency of desulphurization facilities in the electric power industry are added to the indices of the response part. For the adjusted indices, refer to Table 6.
Table 9: Emission Reduction Performance Assessment Index System Tallying with China’s National Conditions
Comprehensive index Specific index Index No. Proportion of total investment in pollution treatment in GDP (100,000,000 Yuan) (1)
Removal rate of industrial sulfur dioxide (%) (2) Municipal domestic wastewater treatment rate (%) (3) Annual average operation rate of industrial wastewater treatment facilities (%) (4)
Annual average operation rate of treatment facilities in wastewater treatment plants (%) (5)
Policy response
Comprehensive desulphurization efficiency of electric power industry (%) (6)
27

China EPA for 11th Five Year Plan
Comprehensive index Specific index Index No. Eliminated quantity of backward production capacities (100,000,000 Yuan) (7)
Stable network connection proportion of on-line monitor-ing facilities in key national monitored enterprises (%) (8)
COD discharge (10,000 t) (9) Environmental pres-sure SO2 emission (10,000 t) (10)
Proportion of air quality equal to or above Grade II over 292 days in major cities (%) (11)
Proportion of cities with acid rain occurrence among monitored cities (%) (12)
Proportion of water quality worse than Grade V in surface water monitored section (%) (13)
Environmental state
Proportion of water quality better than Grade III in main water system monitored sections (%) (14)
Public satisfaction with urban environmental protection (%) (15)
Economic loss due to atmospheric pollution (100,000,000 Yuan) (16)
SO2 emission intensity per 10,000 Yuan industrial added value in heavy pollution industries (kg/10,000 Yuan) (17)
Comprehensive impact
COD discharge intensity per 10,000Yuan industrial added value in heavy pollution industries (kg/10,000 Yuan) (18)
Global environment CO2 emission reduction due to close-down of backward production capacities (100,000,000 t) (19)
2.3.2 Indicators definition and calculation method
(1) Proportion of total investment in pollution treatment in GDP: refers to the proportion of investment in environmental pollution treatment in the current year gross domestic product.
(2) Removal rate of industrial sulfur dioxide: refers to the proportion of removal amount of industrial sulfur dioxide in production amount of industrial sulfur dioxide. Production amount of industrial sulfur dioxide =emission amount of industrial sulfur dioxide + removal amount of industrial sulfur dioxide.
(3) Annual average operation rate of industrial wastewater treatment facilities: refers to the proportion of wastewater amount actually treated by industrial wastewater treatment facilities in designed treatment capacity. Calculation equation:
Industrial wastewater treatment amount÷365÷treatment capacity of industrial wastewater treatment facilities×100%
(4) Annual average operation rate of municipal wastewater treatment plants: refers to the pro-portion of wastewater amount actually treated by municipal wastewater treatment plants and centralized wastewater treatment equipment in industrial zone in the current year in the design treatment capacity. Calculation equation:
28

China EPA for 11th Five Year Plan
Annual average operation rate of municipal wastewater treatment plants
= (wastewater treatment amount÷365)
÷ [(design treatment capacity of wastewater treatment plants + treatment capacity of cen-tralized treatment equipment
÷10000)] ×100%
(5) Comprehensive desulphurization efficiency of electric power industry: refers to the ratio of removal amount of sulfur dioxide from production and supply of electric power and ther-mal power to production amount of sulfur dioxide in the current year in Annual Report of Environmental Statistics.
Comprehensive desulphurization efficiency =removal rate of sulfur dioxide÷(removal amount of sulfur dioxide +emission amount of sulfur dioxide)×100%
(6) Eliminated quantity of backward production capacities: calculated on the basis of product value produced by eliminated production capacity. The target value of eliminated backward production capacity is calculated in accordance with the directory of eliminations listed in the Comprehensive Work Plan on Energy Conservation and Emission Reduction during 11th Five-Year Plan Period issued by the State Council.
(7) Stable network connection proportion of on-line monitoring facilities in key national monitored enterprises: refers to proportion of COD monitoring equipment and SO2 monitoring equipment (sets) quantity in the key national monitored enterprises that already carry out automatic monitoring, in stable network connection with environmental protection depart-ments. Calculation equation:
Stable network connection proportion of on-line monitoring facilities in key national moni-tored enterprises
= (COD monitoring equipment (sets) quantity in stable network connection with environmental protection departments)
+ SO2 monitoring equipment (sets) quantity in stable network connection with environ-mental protection departments number of key national monitored enterprises that already carry out automatic monitoring
*Since Annual Report of Environmental Statistics 2010 no longer involves the related index of SO2/COD monitoring equipment (sets) quantity in stable network connection with envi-ronmental protection departments, the calculation equation of this index for 2010 data is: the number of key national monitored enterprises that already carry out automatic monitoring ÷ number of key national monitored enterprises that already have network connection for auto-matic monitoring
(8) COD discharge: refers to the actual COD discharge amount at the end of the current year
(9) SO2 emission: refers to the actual SO2 emission amount at the end of the current year
29

China EPA for 11th Five Year Plan
(10) Proportion of air quality equal to or above Grade II over 292 days in major cities: refers to the proportion of major cities with annual air quality equal to or above Grade II over 292 days in the total number of major cities.
(11) Proportion of cities with acid rain occurrence among monitored cities: refers to the pro-portion of monitored cities with acid rain occurrence in the total number of monitored cities in the current year.
(12) Proportion of water quality worse than Grade V in surface water monitored section: re-fers to the proportion of surface water monitored sections with water quality worse than Grade V in the total number of surface water monitored sections
(13) Proportion of water quality better than Grade III in main water system monitored sec-tions: refers to the proportion of monitored sections of the seven major water systems with water quality better than Grade III in the total monitored sections of the seven major water systems.
(14) Public satisfaction with urban environmental protection: refers to the overall evaluation of the public for urban environmental protection conditions. It is calculated from the satisfac-tion average of all evaluated cities on the basis of results of the annual “Urban Investigation” public satisfaction survey conducted by the Department of Pollution Prevention and Control of the Ministry of Environmental Protection. As this index was included in Urban Investiga-tion for the first time in 2007, there are no 2005 and 2006 data.
(15) Economic loss due to atmospheric pollution: the loss due to atmospheric pollution is cal-culated for value mainly by the losses to human health, agriculture, buildings and cleaning caused by atmospheric pollution. Loss of human health due to atmospheric pollution mainly includes three aspects: loss of early death due to pollutant PM10, loss of excessive inpatients related to respiratory system and circulatory system, and disability loss; agricultural loss mainly includes loss of agricultural production reduction and quality reduction due to SO2 and acid rain; loss of building corrosion mainly includes loss of service life reduction of various building materials due to acid rain. Cleaning cost mainly includes outdoor cleaning cost and indoor cleaning cost due to pollutants like dust. As SO2 is the emission reduction index in the Eleventh Five Year Plan period, this report only calculates the loss of agricultural pollution and loss of building corrosion related to SO2. Atmospheric pollution loss index data is from the environmental and economic accounting program organized by Chinese Academy for En-vironmental Planning.
(16) SO2 emission intensity per 10,000Yuan industrial added value in heavy pollution indus-tries: refers to the SO2 emission intensity of 10,000Yuan industrial added value of the first 5 heavy pollution industries in SO2 emission in the current year. The first five industries in SO2 emission include: electric power, steam and hot water production and supply industry, nonme-tallic mineral product manufacturing industry, chemical feedstock and chemical product manufacturing industry, ferrous metal smelting & processing industry and nonferrous metal smelting & processing industry.
(17) COD discharge intensity per 10,000Yuan industrial added value in heavy pollution indus-tries: refers to the COD discharge intensity of 10,000Yuan industrial added value of the first 5 heavy pollution industries in COD emission in the current year. The first five industries in COD discharge include: papermaking and paper product industry, food processing industry,
30

China EPA for 11th Five Year Plan
chemical feedstock and chemical product manufacturing industry, beverages manufacturing industry and textile industry.
(18) CO2 emission reduction due to close-down of backward production capacities: refers to synergistic CO2 emission reduction produced by closing down enterprises with backward pro-duction capacity. Calculation method is to convert the eliminated production capacity into energy consumption according to the list of eliminated backward production capacities in the Comprehensive Work Plan of Saving Energy and Diminishing Pollution issued by the State Council and then make an estimation by using the carbon emission factor per unit product. Calculation result indicates that by the end of 2010, if the related measures in the “Compre-hensive Work Plan of Saving Energy and Diminishing Pollution” can be accomplished as scheduled, emission of 2.4 million tons of SO2 and 0.4 million tons of COD can be reduced through structural reduction and additionally, emission of 240 million tons of CO2 can be re-duced. If facility measures are considered, 149 million tons of CO2 is added and 26 million tons of CO2 reduced by management reduction is subtracted and then net reduction of CO2 by the emission reduction measures is 117 million tons.
2.3.3 Determination of indicators’ target value
For environmental performance assessment, determination of the policy target for all indices is particularly important. Rational and effective policy target is the bridge to link the actual environmental performance reflected by all indices with the expectation of policy regulation and control and also is the important parameter for standardized data processing, which has important impact on faithfully and fairly measuring the environmental performance level. For determination of all index target values, there are many trains of thoughts. Some can have the final target determined, some can only have phased target determined and others can only have the target of proper change determined. In this study, different methods are applied for different indices:
Plan target value method: the target value determined in the 11th FYP for Environmental Pro-tection is the main goal of pollution emission reduction work and the basis for assessing the effect of pollution emission reduction work. The target values of such indices as COD and SO2 emission amount, the proportion of air quality equal to or above Grade II over 292 days in major cities, proportion of water quality worse than Grade V in surface water monitored section (%), proportion of water quality better than Grade III in main water system monitored section (%), proportion of total investment in pollution treatment in GDP, quantity of elimi-nated water-related backward production capacity and quantity of eliminated air-related backward production capacity are determined in accordance with the “National Eleventh Five Year Plan for Environmental Protection”.
Standard target value method: target value is determined in accordance with related national standards or requirements. For example, public satisfaction with urban environmental protec-tion, COD discharge intensity of heavy pollution industries and SO2 emission intensity of heavy pollution industries adopt the target values required in the “Construction Index of Eco-logical County, Municipality and Province (Revision)”. Public satisfaction with urban envi-ronmental protection adopts the evaluation target value for ecological cities and the other two indices adopt the evaluation target value for ecological provinces.
31

China EPA for 11th Five Year Plan
Theoretical (ideal) target value method: the theoretically or empirically attainable level is used as the target, e.g. annual average operation rate of industrial wastewater treatment facilities, comprehensive desulphurization efficiency of electric power industry and stable network con-nection proportion of on-line monitoring facilities in key national monitored enterprises (%).
Table 10: Indicators’ Target Values and Weight
32
Comprehensive indicator Specific index Indicator
No. Weight Target value Remarks
Proportion of total invest-ment in pollution treatment in GDP (100,000,000 Yuan)
(1) 1.35% 11th FYP
Removal rate of industrial sulfur dioxide (%) (2) 100% Theoretical
value Municipal domestic waste-water treatment rate (%) (3) 100% Theoretical
value Annual average operation rate of industrial wastewater treatment facilities (%)
(4) 100% Theoretical value
Annual average operation rate of treatment facilities in wastewater treatment plants (%)
(5) 100% Theoretical value
Comprehensive desulphuri-zation efficiency of electric power industry (%)
(6) 100% Theoretical value
Eliminated quantity of backward production capaci-ties (100,000,000Yuan)
(7) 14355
Policy response
Stable network connection proportion of on-line moni-toring facilities in key na-tional monitored enterprises (%)
(8) 100% Theoretical value
COD discharge (10,000t) (9) 1270 11th FYP Environmental pressure SO2 emission (10,000t) (10) 2295 11th FYP
Proportion of air quality equal to or above Grade II over 292 days in major cities (%)
(11) 75% 11th FYP
Proportion of cities with acid rain occurrence among monitored cities (%)
(12) 100% Theoretical value
Proportion of water quality worse than Grade V in sur-face water monitored section (%)
(13) <22% 11th FYP
Environmental state
Proportion of water quality better than Grade III in main water system monitored sections (%)
(14) >43% 11th FYP
Comprehensive impact
Public satisfaction with ur-ban environmental protection (%) (15) 90% Evaluation
indicator for ecological

China EPA for 11th Five Year Plan
Comprehensive indicator Specific index Indicator
No. Weight Target value Remarks
municipalities (revised)
Economic loss due to atmos-pheric pollution (100,000,000 Yuan)
(16) 424.85 Green GDP accounting result
SO2 emission intensity per 10,000Yuan industrial added value in heavy pollution industries (kg/10,000 Yuan)
(17) <6.0
Evaluation indicator for ecological provinces (revised)
COD discharge intensity per 10,000Yuan industrial added value in heavy pollution industries (kg/10,000 Yuan)
(18) <5.0
Evaluation indicator for ecological provinces (revised)
Global environ-ment
CO2 emission reduction due to close-down of backward production capacities (100,000,000t)
(19) 1.17 11th FYP
2.3.4 Data standardization method
Target value standardization method is used to convert indicator value into a standardized value between 0 and 100 by comparing the indicator value with target value.
i i i i
i ii
X / A X A,
X A
P 2 1⎧= ⎨⎩
−<
当数据越大越好时≥
1
( 公式 )
When data is the greater the better, (Equation 2-1)
i i i ii
i i
A / X X A,P
X A2 2⎧
= ⎨⎩
− >
当数据越小越好时 1 ≤
( 公式 )
When data is the smaller the better, (Equation 2-2)
Where, Pi is standardized value of the indicator, Xi is original value of an indicator and Ai is the standard value of the indicator.
2.3.5 Determination of indicators weight
For any link of the DPSIR, it is obviously impossible to emphasize which one is more impor-tant. As part of a complete logic framework, each type of indicator is indispensable. Emission amount is both the result of driving force and the direct cause for environmental quality change. This applies to the other indices. Therefore, in determining the assessment weight, the general Analytical Hierarchy Process or Expert Investigation Method is not used. In stead, all factors or various emission reduction effects are considered to be equally important, i.e. equal
33

China EPA for 11th Five Year Plan
weight method is used as the indicator weighing basis and this is simpler and more direct. Of course, for policy response indicator and policy effect indicator, the sum of respective weights meets the conditions of equaling 1.
2.3.6 Calculation of performance indicators
After data standardization is finished, emission reduction performance indicator (EPPI) can be calculated by target values and weights of all indices. This indicator is a value between 0 and 100 and higher indicator value means overall emission reduction effect is closer to the ex-pected target. The specific calculation equation is as follows:
34

China EPA for 11th Five Year Plan
3 ANALYSIS OF ASSESSMENT RESULTS
3.1 Overall review at national level
According to the calculation results of emission reduction performance indices, in 2006-2010, environmental governance level and effect in China was improved significantly with the im-plementation of total emission reduction policies and emission performance indicator in-creased from 57.24 in 2005 to 82.29 in 2010, up 43.76%.
Figure 6: Calculation Result of Pollution Emission Reduction Performance Indicators
Policy response Environmental pressure Environmental state Impact
Figure 7: Composition of Pollution Emission Reduction Performance Indicators
35

China EPA for 11th Five Year Plan
In terms of compositions of the indices, policy response indicator has the largest contribution to emission reduction performance indicator. It increased from 34% in 2005 to 42%, indicat-ing that the most significant effect of emission reduction policy is that it promoted the pollu-tion treatment facility construction and management operation efficiency.
To further judge the performance of different policies, all the 19 indices are grouped by indi-cator attribute, including 17 positive indices (larger value performs better) and 2 inverse indi-ces (smaller value performs better).
By using the emission reduction target 10% in the 11th FYP period and the comprehensive growth rate 17.41% in 2006-2010 as parameters, the 16 indices are divided into the following five groups:
Group 1 (growth rate>100%) Indicators 2006 2010 Growth rate Stable network connection proportion of on-line monitoring facilities in key national monitored enterprises (%)
1.69 4.6 170%
Comprehensive desulphurization efficiency of elec-tric power industry (%) 1.39 3.62 160%
Group 2 (growth rate 17.41%-100%) Indicators 2006 2010 Growth rate Proportion of air quality equal to or above Grade II over 292 days in major cities (%) 3.12 5.2 66%
Removal rate of industrial sulfur dioxide (%) 2.07 3.39 64% Municipal domestic wastewater treatment rate (%) 3.32 5.3 60% Proportion of water quality worse than Grade V in surface water monitored sections (%) 4.16 5 -20%
Group 3 (growth rate 10%-17.41%) Indicators 2006 2010 Growth rate SO2 emission intensity per 10,000Yuan industrial added value in heavy pollution industries (kg/10,000Yuan)
4.61 5.3 15%
SO2 emission (10,000t) 4.7 5.3 13% COD discharge (10,000t) 4.71 5.3 12% Proportion of investment in environmental pollution treatment in GDP (%) 4.79 5.3 10%
36

China EPA for 11th Five Year Plan
Group 4 (growth rate<10%) Indicators 2006 2010 Growth rate Proportion of water quality better than Grade III in main water system monitored sections (%) 4.93 5.3 8%
Proportion of cities with acid rain occurrence among monitored cities (%) 2.86 2.67 -7%
Public satisfaction with urban environmental pro-tection (%) 4.25 4.55 7%
Annual average operation rate of treatment facili-ties in wastewater treatment plants (%) 3.63 3.83 6%
Annual average operation rate of industrial waste-water treatment facilities (%) 3.29 3.45 5%
Group 5 (negative growth rate) Indicators 2006 2010 Growth rate Economic loss due to atmospheric pollution (100,000,000 Yuan) 2.96 2.4 -23.33%
The two indices whose growth rate is higher than 100% in 11th FYP period are response indi-ces. Comprehensive desulphurization efficiency (SO2 removal rate) of electric power industry (%) increased from 27% to 69% and stable network connection proportion of on-line monitor-ing facilities in key national monitored enterprises (%) increased from 32% to 87%. Increase of comprehensive desulphurization efficiency of electric power industry is directly related to the preferential policy for desulphurization electricity price and enterprises’ pollution treat-ment costs can be compensated by the national preference of desulphurization electricity price. Therefore, the implementation of desulphurization electricity price policy has greatly enhanced enterprises’ enthusiasm for pollution control.
The four indices (two response indices and two state indices) in Group 2 also performed well in the 11th FYP period and growth rate of individual indices exceeded the average level of the comprehensive performance of 11th FYP indices. With management reduction measures taken, SO2 removal rate rose from 39% to 64%, slightly lower than SO2 removal rate of elec-tric power industry. Proportion of air quality equal to/or above Grade II over 292 days in ma-jor cities rose from 44% in 2006 to 73%, indicating that air quality of major cities in China takes a turn for the better. At the same time, municipal domestic wastewater treatment rate increased from 44% to 73%, which is a long term progress and reached and exceeded the tar-get value in the 11th Five Year Plan. Proportion of water quality worse than Grade V in sur-face water monitored sections dropped from 28% to 16%, indicating the effect of COD dis-charge reduction.
Group 3 is a group of indices whose growth rate is between 10% (pollutant emission reduction target value) and 17% (11th FYP period average growth rate). Compared with the previous two groups, this group did not perform very well and was lower than average growth rate. But a common feature of this group is that they all reached the planned target value or ideal target value in 2010. SO2 emission intensity per 10,000Yuan industrial added value in heavy pollu-tion industries began to be lower than the 11th FYP target since 2007 and thus its actual growth rate was much higher than relative growth rate. The two major indices of SO2 emis-sion and COD discharge were much higher than 11th FYP targets whether in static reduction or actual reduction in 2005. Proportion of investment in environmental pollution treatment in GDP did not perform well and the main cause is that GDP growth speed in the 11th FYP pe-
37

China EPA for 11th Five Year Plan
riod was higher than growth speed of environmental protection investment. In fact, all relative indices linked with GDP have this problem.
Of Group 4, proportion of water quality better than Grade III in main water system monitored sections increased from 40% to 60% and absolute increase rate reached 50%. But in the stan-dardized indicator system, the growth rate of this indicator was only 7%. The main reason for this is that plan target value is on the low side. Proportion of cities with acid rain occurrence among monitored cities was not changed markedly in the 11th FYP period, indicating that merely controlling SO2 can not reduce acid rain frequency.
3.2 Sensitivity analysis
The equal weight in this study is to use equal weight for the three levels of 19 indices, which means that these 19 indices are considered to be equally important for the overall emission reduction performance indicator. Another equal weight method is that the secondary indices, i.e. policy response, emission pressure, environmental state and comprehensive impact, are given equal weight by 25 points and all tertiary indices are given equal weight on this basis. The simulation results are shown below:
After change Before change
Figure 8: Performance indicators of different equal weight methods
38

China EPA for 11th Five Year Plan
Policy response Environmental state Environmental pressure Comprehensive impact
Figure 9: Indicator compositions after change of equal weight distribution method
It is seen that after weight distribution method is adjusted, the annual gradual increase trend of emission reduction performance index is not changed but all post-adjustment index values are higher than the pre-adjustment indicator values, indicating that the second equal weight method relatively weakens the impact of the tertiary index quantity on performance index calculation.
In terms of adjusted index structure, changing the equal weight method actually adjusts indi-cator structure. After adjustment, the four major types of indices are less affected by their re-spective tertiary index quantity and the indices originally in a small quantity such as emission pressure will get a much higher score.
3.3 Summary of Pilot Study
To further verify the rationality of this indicator system, Shanghai, Xi’an and Linyi cities are selected as pilots to evaluate the cities’ pollution emission reduction policy performance in the Eleventh Five Year Plan period in accordance with the established methodological frame-work.
In view of the evaluation results of the three pilot cities, the evaluation method established in this topic basically can reflect the emission reduction effect of all cities and performance evaluation results among differ markedly between different cities. According to 2010 results, Shanghai had a performance index of 94.1, which was the highest, Linyi had 87.05, which was in the middle and Xi’an had 73.1, which was the lowest. With basically the same per-formance assessment indicator system, this evaluation conclusion agrees with our knowledge. This means that pollution treatment capability is closely related to a city’s economic devel-
39

China EPA for 11th Five Year Plan
opment level and the more economically developed the higher investment capacity in pollu-tion treatment and the better pollution treatment policy effect.
In identifying emission reduction policy, it is generally recognized that facility reduction measure, i.e. constructing pollution treatment facilities to reduce total emission of pollutants, has a direct and important influence. However, facility reduction measure is implemented often with the help of powerful administrative and economic means, e.g. emission reduction target responsibility system and desulphurization electricity price subsidy policy. At the same time, the weak links in implementing emission reduction policy are also identified and are still important factors restricting emission reduction performance especially in structural readjust-ment in major industries.
Specific to emission reduction performance evaluation method, the three cities all made a mi-nor adjustment for the indicator system so that it more conforms to respective cities’ charac-teristics. For example, Shanghai thinks that in the evaluation method, expert survey method should be adopted to determine indicator weight and suggests that the indicator in environ-mental health should be added in the future evaluation.
3.3.1 Shanghai
Shanghai is the largest city in eastern coastal area of China and one of economically devel-oped regions in China and our country has a higher requirement for its environmental pollu-tion control. In the Eleventh Five Year Plan, China determined the following major environ-mental protection indicators: energy consumption per unit total output value was reduced by 20% compared with the end of the Tenth Five Year Plan period and total emission of major pollutants was reduced by 10% but proposed higher requirements for the east developed re-gions. According to national requirements and Shanghai’s plan for emission reduction of ma-jor pollutants in the Eleventh Five Year Plan period, Shanghai’s SO2 and COD emission re-duction targets in 2010 were 26% and 15% reduction respectively compared with 2005. By the end of 2010, it was verified by the Ministry of Environmental Protection that Shanghai’s COD discharge in 2010 was reduced by 27.7% compared with 2005, which ranked the first in the country and it completed 187% discharge target in the Eleventh Five Year Plan period. SO2 emission was reduced by 30.2% compared with 2005, which ranked the second in the country and cumulatively 116% task in the Eleventh Five Year Plan period was accomplished. Both over-fulfilled the emission reduction tasks specified by our country.
In the application of emission reduction performance evaluation method, Shanghai reserved the original indicators and target values for 8 items including “industrial SO2 removal rate (%)”, reserved the original indicators but revised target values for 3 items including “COD discharge amount (10,000 t)” and adjusted indicators and revised target values for 7 items including “proportion of environmental protection investment in GDP (%)” while complying with the connotation of original indicators. Totally 18 indicators were reserved and 1 indicator of “CO2 emission reduction (100 million tons) resulting from elimination of backward pro-duction capacity” was cancelled.
Evaluation result shows that of the 18 indicators deigned in the evaluation framework, 10 over-fulfilled the targets and had full marks. The total score was 94.1% for all indicators, which well reflects Shanghai’s overall pollution emission reduction effect in the Eleventh
40

China EPA for 11th Five Year Plan
41
Five Year Plan period. Refer to Table 6 for indicator name, target value, actual value and source.
In evaluation conclusion, Shanghai thinks that “China’s pollution emission reduction per-formance evaluation method established on the basis of UN DPSIR framework as a whole tally with China’s present conditions and is well pilot applied in Shanghai. The application result well reflects Shanghai’s actual emission reduction effect.” In application of specific methods, Shanghai thinks that it is reasonable to use the expert survey method to determine indicator weight and suggests that uncertainty analysis be performed for evaluation results.
In addition, Shanghai thinks that quantified evaluation for synergistic effect of emission re-duction measures is of some importance but is difficult. If conditions permit, other indicators (e.g. health-related loss, biodiversity impact) exclusive of available environmental impact indicators, possibly generated by emission reduction measures and other indicators, (e.g. population change, meteorological conditions) exclusive of emission reduction measures, can be included in the future indicator system and appropriate statistical models can be included to distinguish these complicated synergistic effects.

China EPA for 11th Five Year Plan
Table 11: Pilot Application Results of Pollution Emission Reduction Performance Evaluation Indicator System in Shanghai Ag-grega-tive indi-cator
Specific indicator Indi-cator No.
Tar-get value
Source of target value Actual value
Source of actual value Score
Proportion of environmental protec-tion investment in GDP (%)
(1) 3% Shanghai 11th FYP for En-vironmental Protection
3.01% Shanghai Environmental Bulletin 2010 100
Industrial SO2 removal rate (%) (2) 100% Theoretical value 61.2% Statistical Data of Atmospheric Envi-ronmental Protection in 2010 (Shanghai Environmental Protection Bureau web-site)
61.2
Municipal wastewater treatment rate (%)
(3) 80% Shanghai 11th FYP for En-vironmental Protection
81.9% Shanghai Environmental Bulletin 2010 100
Compliance rate of major enterprises for nationally controlled water envi-ronment
(4) 100% Theoretical value 96% Shanghai Self-Evaluation Report for Implementing National 11th FYP for Environmental Protection” (Shanghai Environmental Protection Bureau)
96.0
Up-to-standard discharge rate of wastewater treatment plant (%)
(5) 100% Theoretical value 92% Shanghai Self-Evaluation Report for Implementing National 11th FYP for Environmental Protection” (Shanghai Environmental Protection Bureau)
92.0
Comprehensive desulfurization effi-ciency of electric power industry (%)
(6) 100% Theoretical value 93.5% Average value of 12 major power plants in the city
93.5
Eliminated quantity of backward production capacity (number of pro-jects)
(7) 3000 Implementing Methods of the Energy-Conservation and Emission-Control in Shanghai (2007)
2873 Shanghai Energy Conservation and Emission Control Report (2006-2010)-Practice
95.8
Policy re-sponse
Stable network connection rate of on-line monitoring facilities for national major monitored enterprises (%)
(8) 100% Theoretical value 92.98% Total Emission Control Department of Shanghai Environmental Protection Bu-reau
93.0
42

China EPA for 11th Five Year Plan
Ag-grega-tive indi-cator
Specific indicator Indi-cator No.
Tar-get value
Source of target value Actual value
Source of actual value Score
COD discharge (10,000t) (9) 25.9 Shanghai 11th FYP for En-vironmental Protection
21.98 Shanghai Environmental Bulletin 2010 100 Envi-ron-mental pres-sure
SO2 emission (10,000t) (10) 38 Shanghai 11th FYP for En-vironmental Protection
35.81 Shanghai Environmental Bulletin 2010 100
Proportion of days with air quality above Grade II in the whole year (%)
(11) 85% Shanghai 11th FYP for En-vironmental Protection
92.1% Shanghai Environmental Bulletin 2010 100
Reduction rate of average SO2 con-centration in air compared with the end of Eleventh FYP period
(12) 26% With reference to reduction rate of SO2 emission target compared with the end of 10th FYP period
52.5% Shanghai Environmental Bulletin 2010 100
Envi-ron-mental condi-tion
Proportion of surface water monitor-ing sections with water quality worse than Grade V (%)
(13) 33% National requirements for Shanghai
33% Shanghai Environmental Monitoring Center
100
Envi-ron-mental condi-tion
Reduction rate of COD concentration in Huangpu River boundary section (Yangpu Bridge section) (%)
(14) 15% With reference to reduction rate of COD emission target compared with the end of 10th FYP period
24.1% Shanghai Environmental Bulletin 2010 100
43

China EPA for 11th Five Year Plan
44
Ag-grega-tive indica-tor
Specific indicator Indi-cator No.
Target value
Source of target value Actual value
Source of actual value Score
Public satisfaction with urban envi-ronmental protection (%)
(15) 85% Quantitative evaluation tar-get value for comprehensive urban environmental treat-ment issued by the Ministry of Environmental Protection
78.8% Shanghai results of quantitative evalua-tion for comprehensive urban environ-mental treatment by the Ministry of En-vironmental Protection
92.7
Economic loss due to atmospheric pollution (100 million Yuan)
(16) 16.65 Green GDP Accounting by Chinese Academy for Envi-ronmental Planning, assum-ing economic loss in Shang-hai when national primary standard is reached (only agricultural and architectural losses due to SO2 and acid rain are included)
24.12 Green GDP Accounting by Chinese Academy for Environmental Planning – Shanghai Results in 2009 (only agricul-tural and architectural losses due to SO2 and acid rain are included)
69.0
SO2 emission intensity per 10,000Yuan value added in the city (kg/10,000Yuan)
(17) 8 Quantitative evaluation tar-get value for comprehensive urban environmental treat-ment issued by the Ministry of Environmental Protection
3.1 Data of value added for the city is from “Shanghai Statistical Bulletin for Na-tional Economic and Social Develop-ment in 2010” and data of industrial SO2 emission is from “Shanghai Statistical Yearbook 2011”
100
Com-prehensive impact
COD discharge intensity per 10,000 Yuan value added in the city (kg/10,000 Yuan)
(18) 1 Quantitative evaluation tar-get value for comprehensive urban environmental treat-ment issued by the Ministry of Environmental Protection
0.3 Data of value added for the city is from “Shanghai Statistical Bulletin for Na-tional Economic and Social Develop-ment in 2010” and data of industrial SO2 emission is from “Shanghai Statistical Yearbook 2011”
100
Total score 94.1

China EPA for 11th Five Year Plan
3.3.2 Xi’an
Xi’an is located in the inland of northwest China. In recent years, owing to rapid development of social economy, increase of human development activities, aggravation of water loss and soil erosion, damage of vegetation and reduction of water conservation forest, regional water sources become scarce, surface water loss and pollution become more serious, groundwater is overdrawn and water level drops. It also leads to loess tableland exposure and sandstorm in-crease. Total suspended particulate matter above the city increases naturally. There is a seri-ous contradiction between economic development and environmental protection.
In order to scientifically evaluate the emission reduction performance in the 11th FYP period, Xi’an has adjusted the evaluation indicators formulated in this topic and changed the “propor-tion of total pollution treatment investment in GDP” to “proportion of environmental protec-tion investment in GDP” for the reason that in Xi’an’s statistical system, “total pollution treatment investment” has not been regarded as independent indicator for statistics; changed the “proportion of cities with acid rain in the monitored cities” to “the proportion of acid rain times in Xi’an’s urban area in the annual total monitoring times” and changed the “proportion of water monitoring sections with water quality better than Grade III in the seven major water systems” to the “proportion of water quality better than Grade III in the seven sections into the Weihe River in Xi’an” for the reason that these two indicators should be national statistical indicators and can not be calculated for one city; and canceled the indicator of “CO2 emission reduction resulting from elimination of backward production capacity” for the reason that the city now does not have a quantification system and data for CO2 emission reduction. Evalua-tion results are shown in Table 12.
Table 12: EPPI Calculation Results of All Indicators in 11th FYP Period in Xi’an Year Aggregative
indicator Specific indicator No. 2006 2007 2008 2009 2010 Proportion of total pollution treat-ment investment in GDP (1) 0.079 0.088 0.116 0.076 0.083
Industrial SO2 removal rate (2) 0.006 0.008 0.012 0.019 0.023Municipal domestic wastewater treatment rate (3) 0.02 0.033 0.034 0.039 0.039
Annual average operation rate of industrial wastewater treatment facilities
(4) 0.034 0.038 0.043 0.052 0.047
Annual average operation rate of treatment facilities in wastewater treatment plants
(5) 0.041 0.048 0.039 0.042 0.044
Comprehensive desulfurization efficiency of electric power indus-try
(6) 0.005 0.01 0.015 0.023 0.027
Eliminated quantity of backward production capacity (7) 0.053 0.053 0.053 0.053 0.053
Policy re-sponse
Stable network connection rate of on-line monitoring facilities for national major monitored enter-prises
(8) 0 0.048 0.045 0.044 0.046
Environmental COD discharge (9) 0.053 0.052 0.053 0.053 0.053
45

China EPA for 11th Five Year Plan
Year Aggregative indicator Specific indicator No. 2006 2007 2008 2009 2010 pressure SO2 emission (10) 0.053 0.053 0.054 0.059 0.053
Proportion of days with air quality above Grade II in the whole year (11) 0.055 0.057 0.058 0.058 0.058
Proportion of acid rain times in Xi'an's urban area in the annual total monitoring times
(12) 0.053 0.053 0.053 0.053 0.053
Proportion of surface water moni-toring sections with water quality worse than Grade V
(13) 0.015 0.015 0.015 0.015 0.023
Environmental condition
Proportion of water quality better than Grade III in the seven sections into the Weihe River in Xi'an
(14) 0.017 0.035 0.035 0.035 0.035
Public satisfaction with urban envi-ronmental protection (15) 0.039 0.044 0.047 0.047 0.037
Economic loss due to atmospheric pollution (16) 0.053 0.053 0.053 0.053 0.053
SO2 emission intensity per 10,000Yuan value added in heavy pollution industries
(17) 0.004 0.004 0.005 0.009 0.015Comprehensive impact
COD discharge intensity per 10,000 Yuan value added in heavy pollution industries
(18) 0.002 0.002 0.003 0.004 0.005
Annual total 0.583 0.691 0.719 0.729 0.731
In view of evaluation results, emission reduction performance as a whole is good but relative to Shanghai, absolute value of performance index is low. This is mainly embodied in three aspects: firstly, emission intensity indicator for heavy pollution industries is still not ideal and emission reduction room is still large; secondly, improvement of surface water environmental quality has a long way to go and implementation of pollution emission reduction in 11th FYP period well improved the pollution of one indicator of chemical oxygen demand in surface water environment but had a limited improvement for other pollution indicators like ammonia nitrogen, resulting in the low surface water environmental quality as a whole. Thirdly, public satisfaction with environmental protection is still low. Public satisfaction with environmental protection work in Xi’an in 2010 was only 62.42% and it is urgently needed to increase in-vestment in urban environmental treatment and solve the environmental problems directly and closely related to the people’s health.
3.3.3 Linyi
Linyi is located in southeast Shandong Province close to the Yellow Sea and borders north Jiangsu with an area of 17,200 km2 and population of 10.72 million. It is a city with the larg-est area and population in Shandong. Owing to large investment in environmental protection and significant achievement, Linyi was awarded the title of “National Environmental Protec-tion Model City” by the Ministry of Environmental Protection in 2010. Shandong Provincial Government issued the following pollution emission reduction target for Linyi in the 11th FYP period: by 2010, Linyi should reduce SO2 emission by 8.7% on the basis of 105.700 t in 2005 and control the emission within 96,300t; and reduce COD discharge by 19.1% on the basis of 40,380 t in 2005 and control the discharge within 32,670 t.
46

China EPA for 11th Five Year Plan
In accordance with its own conditions of social and economic development and environmental pollution prevention and control, Linyi analyzed item by item the evaluation indicators pro-posed in this topic and adjusted the indicator of “proportion of the cities with days of air qual-ity above Grade II in major cities (%)” because this indicator is applicable to evaluating na-tional overall environmental quality. But Linyi is a city and it can not be calculated. Presently, the “proportion of days with urban air quality above Grade II in the whole year (%)” is adopted for city evaluation indicator and the government publishes data and ranking in the country but for SO2 control factor in pollution emission reduction, air quality good rate is not enough to reflect SO2 emission reduction effect because the major factor that affects air qual-ity good rate is suspended particulate matter. Thus it is more appropriate to directly use SO2 concentration to reflect the impact of pollution emission reduction on environmental condi-tions. As automatic air monitoring station was set up only in urban areas in Liyin in the 11th FYP period and automatic monitoring has just started in 9 county towns in the 12th FYP pe-riod, SO2 concentration in urban area is temporarily used as environmental condition evalua-tion factor and the target value is annual emission limit value 0.06 mg/m3 of Grade II atmos-pheric quality standard..
In addition, proportion of cities with acid rain in the monitored cities (%): this indicator can not be evaluated as Linyi is an implementing city. This indicator is replaced with the “propor-tion of acid rain times in urban area in the total annual monitoring times (%)” and the target value is ideal value 0.
Specific indicators and evaluation results are shown in Table 13.
According to the Linyi’s final performance evaluation results, Linyi made significant achievements in 2006~2010 as Linyi Municipal Government advanced the pollution emission reduction work in depth. Of the 19 indicators, 12 had an over 90% score, indicating that Linyi Municipal Government made significant achievements in pollution emission reduction in the 11th FYP period.
However, in view of the impact of a single indicator on emission reduction performance, four indicators including comprehensive desulphurization efficiency in electric power industry, average SO2 concentration in urban air quality, SO2 emission intensity per 10,000 Yuan value added in heavy pollution industries and elimination of backward production capacity had an approximately 50% score. Apparently, these are weak links of pollution emission reduction in Linyi. This verifies that as elimination of backward production capacity has not been finished and desulphurization efficiency is low, SO2 concentration in urban area in 11th FYP period has not dropped significantly, which is further proved by SO2 emission intensity per 10,000 Yuan value added in heavy pollution industries.
Table 13: Pollution Emission Reduction Performance Evaluation Results in Linyi Aggregative
indicator Specific indicator 2006 2007 2008 2009 2010
Proportion of total pollution treatment investment in GDP (10,000 Yuan) 88.15 100.00 93.33 100.00 100.00
Industrial SO2 removal rate (%) 50.40 48.80 52.00 58.40 61.80 Municipal domestic wastewater treat-ment rate (%) 39.14 64.08 76.74 85.57 90.09
Policy re-sponse
Operation rate of industrial wastewater treatment facilities (%) 100.00 100.00 100.00 100.00 100.00
47

China EPA for 11th Five Year Plan
Operation rate of treatment facilities in wastewater treatment plants (%) 100.00 100.00 100.00 100.00 100.00
Comprehensive desulfurization effi-ciency of electric power industry (%) 57.20 48.90 61.20 66.90 70.20
Eliminated quantity of backward pro-duction capacity (100 million Yuan) 8.37 12.33 18.60 14.65 15.12
Stable network connection rate of on-line monitoring facilities for national major monitored enterprises (%)
100.00 100.00 100.00 100.00 100.00
COD discharge (10,000 t) 13.49 33.68 63.24 80.99 100.00 Environ-mental pres-
sure SO2 emission (10,000 t) 47.26 84.38 100.00 100.00 100.00
Average SO2 concentration in urban air (mg/m3) 75.83 76.67 70.00 37.50 53.33
Proportion of acid rain times urban area in the annual total monitoring times (%) 100.00 100.00 100.00 100.00 100.00
Proportion of surface water monitoring sections with water quality worse than Grade V (%)
91.54 91.54 100.00 100.00 100.00
Environ-mental condi-
tion
Proportion of monitoring sections with water quality better than Grade III 66.51 66.51 66.51 99.53 199.30
Public satisfaction with urban environ-mental protection (%) 100.00 100.00 99.19 99.30 92.99
Economic loss due to atmospheric pollu-tion (100 million Yuan) 98.68 98.65 98.74 98.60 98.56
SO2 emission intensity in heavy pollu-tion industries (kg/10,000 Yuan) 50.60 49.73 50.71 52.75 44.75
Comprehen-sive impact
COD discharge intensity in heavy pollu-tion industries (kg/10,000 Yuan) 100.00 100.00 100.00 100.00 100.00
Global envi-ronment
CO2 emission reduction due to elimina-tion of backward production capacity (100 million tons)
12.45 19.29 27.35 19.04 27.91
Total 68.40 73.40 77.77 79.64 87.05
48

China EPA for 11th Five Year Plan
4 CONCLUSION AND POLICY RECOMMENDATIONS
In general, with the implementation of emission reduction policies, China’s pollution emission reduction performance in the Eleventh Five Year Plan period showed a year by year rising trend. Furthermore, according to the statistical results in 2010, all the original emission reduc-tion targets were achieved and at the same time, the emission reduction policies generated significant effects in reducing greenhouse gases emission, reducing economic losses due to acid rain and prompting the improvement of pollution control level in heavy pollution indus-tries. The following emission reduction policies played a positive role in obtaining the above effects:
Firstly, target responsibility system and associated evaluation mechanism for emission reduc-tion target decomposition and implementation, which was the fundamental institutional guar-antee for implementation and eventual accomplishment of emission reduction targets.
Secondly, facility reduction effect was the most significant. Both desulphurization facility capacity and wastewater treatment capacity were increased considerably, which depended on the enhancement of power plant desulphurization facility construction and municipal waste-water treatment plant construction and the increase of pollution treatment facility operation effect. This was the main knob for implementing the 11th FPY emission reduction targets.
Thirdly, the preferential policy for desulphurization electricity price of the electric power in-dustry gained significant effect and it greatly enhanced enterprises’ enthusiasm for pollution treatment. This sufficiently indicates the important role of incentive policies in pollution pre-vention and control and it is worthy of reference in the next formulation and implementation of emission reduction policies.
However, policy implementation effect can be further increased in the following fields.
Firstly, in terms of implementation means, the potential of structural adjustment and manage-ment reduction still has not been fully achieved. Structural adjustment progress of heavy pol-lution industries is slow and structural adjustment effect needs to be verified. Some pollution enterprises relocate pollution and they close down backward production capacities in major monitored areas like urban areas but move this part of production capacities to rural areas where environmental monitoring force is not strong. In fact, the emission reduction effect is not obtained.
Secondly, operation efficiency of pollution treatment facilities needs to be further increased. Presently, average operation rate of wastewater treatment facilities and wastewater treatment plants is around 70% and is even lower in some regions; thus the effect of pollution treatment facilities is difficult to be accomplished.
Thirdly, emission reduction statistical, monitoring and evaluation capacity building lags be-hind and especially statistical and monitoring capacity can not meet the requirements for emission reduction plan target decomposition, task determination, performance evaluation and post-plan assessment, which restricts the implementation effect of emission reduction plan.
In the Twelfth Five Year Plan period, China’s economy will still grow continuously and rap-idly. The automobile and real estate-driven economic growth mode has not been fundamen-
49

China EPA for 11th Five Year Plan
tally changed at present and huge economic increment will bring increasing pollutant emis-sion pressure. At the same time, with upgrade and transformation of residents’ consumption and life style, domestic pollution emission increases, residents’ need for environmental quality keeps increasing, environmental problems draw more and more attention and environmental protection pressure becomes even higher. From the point of pollution control view, pollution treatment in the Twelfth Five Year Plan period is more difficult. With increase of pollutants for total control and expansion of total control and pollution emission reduction range, agri-cultural sources and motor vehicles are also included in emission reduction, which poses a great challenge to the next step of emission reduction work. In combination with the research findings of this project, the following suggestions are made on enhancing emission reduction in the Twelfth Five Year Plan period:
Firstly, it is suggested that emission reduction target be set on the basis of environmental qual-ity and risk prevention and target setting flexibility be increased other than uniformity is im-posed on all enterprises to set the emission control target for a pollutant at national level. For major and important drainage basins, definite requirements can be made at river boundary sections for COD, ammonia nitrogen and total phosphorus and this helps increase the perti-nence of total discharge control to pollution treatment. For major industries, total discharge control can be used, in terms of risk prevention, for the industries and major pollutants that endanger human health. More important is to further define the responsibilities of the central and local governments in pollution discharge reduction and grant decision-making power to local governments in setting total control targets and making plans. The central government shall supervise local governments in implementing discharge reduction plans through dispatch and evaluation.
Secondly, great importance should be attached to the application of economic means in the implementation of emission reduction plans. Experience of the 11th FYP period proves that using economic means to encourage enterprises to take the initiative in preventing and con-trolling pollution has a relatively low economic and social cost and ideal implementation ef-fect. It is suggested that the above polices should be used in desulphurization, denitration, wastewater and refuse treatment charge and agricultural pollution emission reduction fields. At the national level, it is suggested that denitration electricity should be formulated and im-plemented and different denitration subsidy standards be issued for different industries; for wastewater and refuse treatment charge, the central government should issue a guidance document to define basic charging principle, charging level, charging subject and object, and charge management and use and the specific standard is determined by the guidance docu-ment prepared by the central government depending on actual conditions; for agricultural source, the central government should establish special pollution treatment subsidy fund to give fund subsidy to those that have built pollution treatment facilities and passed inspection by environmental protection departments to increase farmers/collectives’ enthusiasm.
Thirdly, operation supervision and management of pollution treatment facilities should be strengthened. Carry out propaganda and education to enhance enterprises’ awareness for envi-ronmental responsibilities social responsibilities, improve public participation and strengthen social supervision and opinion feedback handling mechanism for enterprises’ behaviors; en-hance quality evaluation of on-line monitoring facilities, make clear provisions for equipment quality, operation and management of on-line monitoring facilities and change the present chaotic conditions to enable on-line monitoring to generate actual effect; coordinate and well deal with the relation between urban construction and environmental protection departments, realize butt joint between sewage pipe network reconstruction and construction and wastewa-
50

China EPA for 11th Five Year Plan
ter treatment plants and solve the systematic obstacles existing in the operation of wastewater treatment facilities.
Fourthly, strengthen the emission reduction statistical capacity building. This is the basis for implementing the emission reduction plan and the basic work for carrying out emission reduc-tion performance assessment. It is suggested to improve the existing emission reduction statis-tical system, define the responsibilities of different subjects including enterprises and envi-ronmental protection departments at all levels during statistical data acquisition, reporting, summarization and management and increase statistical data quality. At the same time, rein-force the application of statistical data, promptly analyze and summarize the problems found in the implementation of emission reduction plans and enhance the supportive role of statistics in emission reduction.
Fifthly, increase propaganda and further promote the public environmental consciousness. The focus of propaganda is not only to enhance public consciousness of environmental prob-lems and more important is to let the public know the correlation of their own behaviors to environmental problems. The central government shall formulate special propaganda strate-gies and by preparing books, audiovisual products and propaganda brochures, utilize various media means to drive the transformation of public consumption pattern and structure. This is the radical measure for pollution prevention and control.
51

China EPA for 11th Five Year Plan
52
5 REFERENCE
UNEP, Integrated Assessment and Planning for Sustainable Development Guidelines for pilot projects, Version 1, March 2004 http://www.unep.ch/etb/Topics/inteAsse/IAPGuidelinesPilotProjectsEN.pdf
US EPA, Guidelines for Ecological Risk Assessment, Published on May 1998, Risk Assess-ment Forum, Washington DC http://www.epa.gov/raf/publications/pdfs/ECOTXTBX.PDF
European Environment Agency, Environmental Indicators: Typology and Use in Reporting, Copenhagen, August 2003 http://www.brahmatwinn.uni-jena.de/fileadmin/Geoinformatik/projekte/brahmatwinn/Workshops/FEEM/Indicators/EEA_Working_paper_DPSIR.pdf
European Environment Agency, Environmental Indicators: Typology and Overview, Copen-hagen, Technical Report No 25/1999 http://www.eea.europa.eu/publications/TEC25
OECD, OECD Key environmental indicators 2008, 2008, Paris France, OECD Environnent Directorat http://www.oecd.org/dataoecd/20/40/37551205.pdf
GMS Environment Operations Center, Environmental Performance Assessment, Bangkok Thailand. (Accessed on 2011) http://www.gms-eoc.org/CEP/Comp3/docs/EPA_Synthesis_Report.pdf
OECD, Environmental Performance Review of China: Lessons Learned from Yunnan Prov-ince Experience, Kunming, 10 August, 2005 http://www.oecd.org/dataoecd/62/33/35414971.pdf
European Environment Agency, EEA core set of indicators - Guide, Copenhagen, Technical report No 1/2005 http://www.eea.europa.eu/publications/technical_report_2005_1
J. Andrew Kell, An Overview of the RAINS Model Environmental Research Centre Report, Environmental Protection Agency, Ireland, 2006 http://www.epa.ie/downloads/pubs/research/air/epa_overview_of_rains_model_erc4.pdf
GMS Environment Operations Center, Environmental Performance Assessment, Bangkok Thailand. http://www.gms-eoc.org/CEP/Comp3/docs/EPA_Synthesis_Report.pdf
Ministry of Agriculture Food & Rural Affairs, Does Manure Have a Place in the Sulfur De-bate? Christine Brown (Nutrient Management Field Crop Lead/OMAFRA), Ontario, Jun, 2006 http://www.omafra.gov.on.ca/english/crops/field/news/croptalk/2006/ct_0606a2.htm
International Institute for Applied Systems Analysis (IIASA) GAINS Asia Scenarios For Cost-Effective Control Of Air Pollution and Greenhouses Gases In China. Laxenburg, Austria, November 2008


![DISASTER RISK REDUCTION AND PREVENTION COUNTRY NAME…1].pdf · 2011. 4. 6. · DISASTER RISK REDUCTION AND PREVENTION COUNTRY NAME:NIGERIA (Form to be returned please to: rhea.katsanakis@unep.org](https://static.fdocuments.in/doc/165x107/611e0e08599e4c56c858abb6/disaster-risk-reduction-and-prevention-country-name-1pdf-2011-4-6-disaster.jpg)


![DISASTER RISK REDUCTION IN AFRICA1].pdf · animesh.kumar@unep.org avant le 15 Juin 2013. Figure 1: Les pays couverts par l’ONU/SIPC en Afrique Bureau régional de anglais). États](https://static.fdocuments.in/doc/165x107/5ec6a128d21ad56e283a9e2b/disaster-risk-reduction-in-africa-1pdf-animeshkumaruneporg-avant-le-15-juin.jpg)
