Indicator Technical Specifications - Ministry of Health … Technical Specifications Quality...
27
Let’s Make Healthy Change Happen. Indicator Technical Specifications Quality Improvement Plan 2015/16 Released November 2014
Transcript of Indicator Technical Specifications - Ministry of Health … Technical Specifications Quality...

Let’s Make Healthy Change Happen.
Indicator Technical SpecificationsQuality Improvement Plan 2015/16
Released November 2014

2
This document specifies indicator definitions, reporting periods, and other technical information for hospitals, primary care organizations, Community Care Access Centres (CCACs), and Long-Term Care (LTC) homes to use in their 2014/15 Quality Improvement Plans (QIPs).
Each sector has its own list of priority and additional indicators.
• Priority indicators reflect organizational and sector-specific priorities, as well as system-wide, transformational priorities where improved performance is co-dependent on collaboration with other sectors. Achieving system-wide change in these areas requires every sector and every organization to prioritize quality improvement.
• Organizations are expected to review the priority indicators for their sector and determine which are relevant for their organization. To support this process, your organization should review its current performance against provincial benchmarks/theoretical best for all priority indicators. If your organization elects not to include a priority indicator in the QIP (for example, because performance already meets or exceeds the benchmark/ theoretical best), then this should be documented in the comments section of the QIP Workplan.
• Additional indicators also measure important areas for quality improvement. Organizations can include these additional indicators or any other indicator in their QIP as relevant to their quality improvement goals.
Released November 2014
Note: Indicator results that are based on small numbers (numerators <5; denominators <30) should be interpreted with caution because of potentially unstable rates and/or risk to patient privacy. Because of this, these results may be suppressed when provided by external organizations (e.g., MOHLTC, QIP Navigator). For more information on data suppression, please contact HQO at [email protected].

3
Table of ContentsI. Hospital QIP Indicators ........................................................................................ 4
Priority Hospital Indicators .....................................................................................................4Clostridium Difficile Infection (CDI) ................................................................................4Medication Reconciliation at Admission ............................................................................5Hospital Total Margin ............................................................................................................690th percentile Emergency Department (ED) Length of Stay for Admitted Patients ..6Patient Satisfaction ...............................................................................................................7% Alternate Level of Care (ALC) days .................................................................................830-Day Readmission Rate to Any Facility (Specific Case Mix Groups) .........................8
Additional Hospital Indicators ................................................................................................9Information for hospitals with CCC and Rehab services/ beds ........................................12
II. Primary Care QIP Indicators .............................................................................. 13Priority Primary Care Indicators ..........................................................................................13
Timely Access to Primary Care When Needed .................................................................13Patient Experience ...............................................................................................................14Primary Care Visits Post-Discharge ...................................................................................15
Additional Primary Care Indicators......................................................................................16Primary Care Practice report – additional supports for Quality Improvement .............18
III. Community Care Access Centre QIP Indicators ............................................... 19Priority CCAC Indicators ......................................................................................................19
Falls for Long-Stay Clients ..................................................................................................19Unplanned Emergency Department Visits ........................................................................19Hospital Readmissions ........................................................................................................20Five-Day Wait Time for Home Care ...................................................................................20Client Experience .................................................................................................................21
IV. Long-Term Care Home QIP Indicators ............................................................... 22Priority LTC Home Indicators ...............................................................................................22
Falls ........................................................................................................................................22Pressure ulcers .....................................................................................................................22Restraints ...............................................................................................................................22Incontinence .........................................................................................................................23Resident Experience ............................................................................................................24ED visits .................................................................................................................................26
Abbreviations ............................................................................................................. 27

4
I. Hospital QIP Indicators Priority Hospital IndicatorsIndicator Clostridium Difficile Infection (CDI)
This is a priority indicator for 2015/16Quality dimension: Safety
Definition CDI rate per 1,000 patient days: Number of patients newly diagnosed with hospital-acquired CDI during the reporting period, divided by the number of patient days in the reporting period, multiplied by 1,000
Consistent with HQO’s Patient Safety public reporting website
Additional specifications
For more information about this indicator, visit the MOHLTC Resource for Indicator Standards website
Reporting period January 2014 – December 2014
Data source MOHLTC
How to access data To access your organization’s data for the reporting period, refer to HQO’s QIP Navigator. Data will be available in February 2015.

5
Priority Hospital Indicators (continued)Indicator Medication Reconciliation at Admission
This is a priority indicator for 2015/16Quality dimension: Safety
Definition The total number of patients with medications reconciled as a proportion of the total number of patients admitted to the hospital
Note: Medication reconciliation at care transitions has been recognized as best practice and is increasingly becoming a system-wide standard. All hospitals should be working towards comprehensive implementation of medication reconciliation. As such, organizations that were previously reporting medication reconciliation at admission for a unit/service/program or target population in their QIPs should now aim to report current performance and set targets at the organization-level (i.e., for the entire hospital). For specific improvement initiatives, process measures, and change idea goals, organizations may still wish to scale their focus to a specific unit/service/program or target population.
For more information on implementing and measuring medication reconciliation at admission, refer to the ‘Safer Healthcare Now! Medication Reconciliation in Acute Care Getting Started Kit’, which is available online, and visit the Medication Reconciliation page on the Institute for Safe Medication Practices Canada website.
For assistance with monitoring your ongoing MedRec processes, visit the Measures page on the Safer Healthcare Now! website or contact [email protected].
Additional specifications
–
Reporting period Most recent quarter available
Data source Data are collected at the organizational-level (in-house).
How to access data These data should be accessed from within your own organization.

6
Priority Hospital Indicators (continued)Indicator Hospital Total Margin
This is a priority indicator for 2015/16Quality dimension: Effectiveness
Definition Percent by which total corporate (consolidated) revenues exceed or fall short of total corporate (consolidated) expenses, excluding the impact of facility amortization, in a given year
Additional specifications
For more information about this indicator, visit the MOHLTC Resource for Indicator Standards website
Reporting period Q3 FY 2014/15 (cumulative from Q1-Q3 FY 2014/15) or most recent data period available
Data source OHRS
How to access data Refer to the MOHLTC Health Data Branch Web Portal for your organization’s rates (click on the ‘Healthcare Indicator Tool (HIT)’ section).
Indicator 90th percentile Emergency Department (ED) Length of Stay for Admitted Patients This is a priority indicator for 2015/16Quality dimension: Access
Definition 90th percentile ED length of stay for admitted patients. ED length of stay is defined as the time from triage or registration, whichever comes first, to the time the patient leaves the ED
Additional specifications
For more information about this indicator, visit the MOHLTC Resource for Indicator Standards website
Reporting period Q4 FY 2013/14 – Q3 2014/15
Data Source NACRS, CIHI
How to access data To access your organization’s data for the reporting period, refer to HQO’s QIP Navigator. Data will be available in February 2015.
7
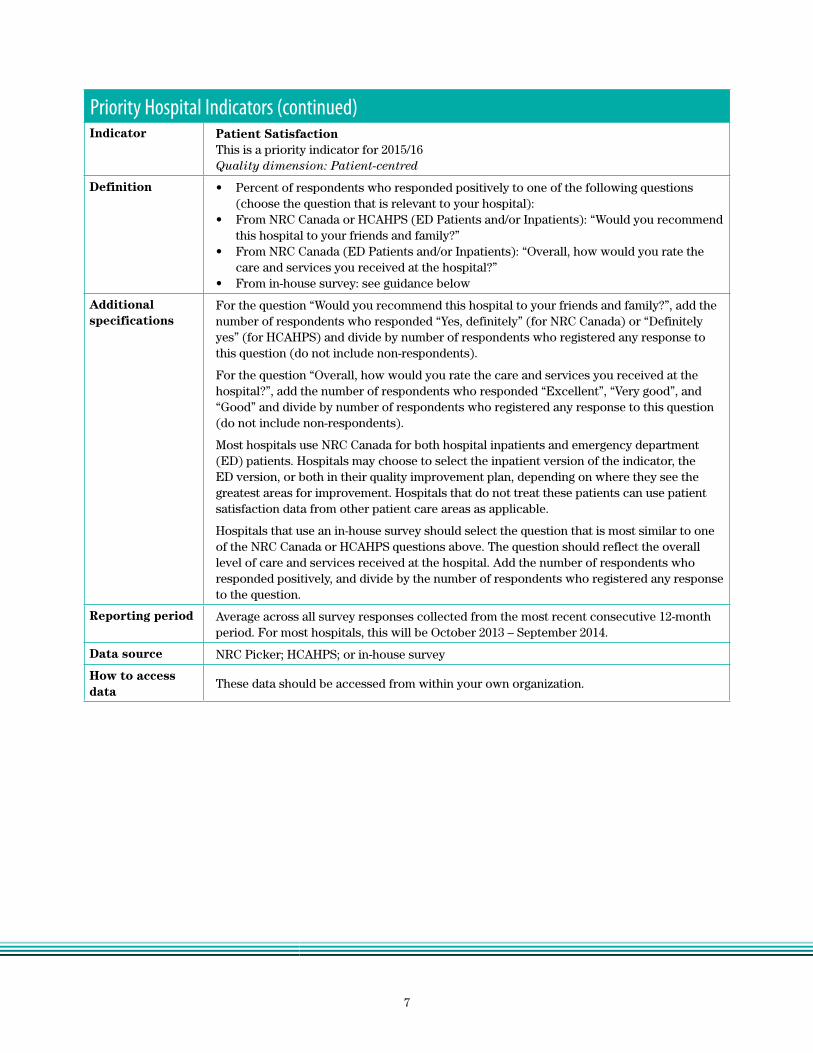
Priority Hospital Indicators (continued)Indicator Patient Satisfaction
This is a priority indicator for 2015/16Quality dimension: Patient-centred
Definition • Percent of respondents who responded positively to one of the following questions (choose the question that is relevant to your hospital):
• From NRC Canada or HCAHPS (ED Patients and/or Inpatients): “Would you recommend this hospital to your friends and family?”
• From NRC Canada (ED Patients and/or Inpatients): “Overall, how would you rate the care and services you received at the hospital?”
• From in-house survey: see guidance below
Additional specifications
For the question “Would you recommend this hospital to your friends and family?”, add the number of respondents who responded “Yes, definitely” (for NRC Canada) or “Definitely yes” (for HCAHPS) and divide by number of respondents who registered any response to this question (do not include non-respondents).
For the question “Overall, how would you rate the care and services you received at the hospital?”, add the number of respondents who responded “Excellent”, “Very good”, and “Good” and divide by number of respondents who registered any response to this question (do not include non-respondents).
Most hospitals use NRC Canada for both hospital inpatients and emergency department (ED) patients. Hospitals may choose to select the inpatient version of the indicator, the ED version, or both in their quality improvement plan, depending on where they see the greatest areas for improvement. Hospitals that do not treat these patients can use patient satisfaction data from other patient care areas as applicable.
Hospitals that use an in-house survey should select the question that is most similar to one of the NRC Canada or HCAHPS questions above. The question should reflect the overall level of care and services received at the hospital. Add the number of respondents who responded positively, and divide by the number of respondents who registered any response to the question.
Reporting period Average across all survey responses collected from the most recent consecutive 12-month period. For most hospitals, this will be October 2013 – September 2014.
Data source NRC Picker; HCAHPS; or in-house survey
How to access data
These data should be accessed from within your own organization.

8
Priority Hospital Indicators (continued)Indicator % Alternate Level of Care (ALC) days
This is a priority indicator for 2015/16Quality dimension: Integrated
Definition Total number of inpatient days designated as ALC, divided by the total number of inpatient days x 100
Additional specifications
For more information about this indicator, visit the MOHLTC Resource for Indicator Standards website.
Cancer Care Ontario (CCO) produces a different % ALC indicator, defined as the total number of ALC days for open, discharged and discontinued cases in a given time period (Wait Time Information System) divided by the total number of patient days for open, discharged, and discontinued cases (Bed Census Summary) in the same time period. For more information about the indicator calculated by CCO, please access CCO’s Wait Time Information System.
Reporting period Q3 FY 2013/14 – Q2 FY 2014/15
Data source DAD, CIHI
How to access data To access your organization’s data for the reporting period, refer to HQO’s QIP Navigator. Data will be available in February 2015.
Alternatively, refer to the MOHLTC Health Data Branch Web Portal for your organization’s rates (click on ‘Hospitals’, then ‘Quality Improvement Plans’).
Indicator Readmission within 30 days for Selected Case Mix GroupsThis is a priority indicator for 2015/16Quality dimension: Integrated
Definition Percentage of acute hospital inpatients discharged with selected Case Mix Groups (CMGs) that are readmitted to any acute inpatient hospital for non-elective patient care within 30 days of the discharge for index admission..
Additional specifications
For a list of included CMGs, and inclusion/exclusion criteria, refer to the MOHLTC Resource for Indicator Standards website.
Note: This indicator and its calculation remain unchanged from previous years. The title and definition have been clarified to more accurately describe the actual calculation of the indicator.
Reporting period Q2 FY 2013/14 – Q1 FY 2014/15
Data source DAD, CIHI
How to access data To access your organization’s data for the reporting period, refer to HQO’s QIP Navigator. Data will be available in February 2015.
Alternatively, refer to the MOHLTC Health Data Branch Web Portal for your organization’s rates (click on ‘Hospitals’, then ‘Quality Improvement Plans’).

9
Additional Hospital IndicatorsIndicator Medication Reconciliation at Discharge
Quality dimension: Safety and Integrated
Definition Total number of discharged patients for whom a Best Possible Medication Discharge Plan was created as a proportion of the total number of patients discharged.
Additional specifications
Indicator excludes hospital discharge that is death, newborn, or stillborn. Any additional exclusions should be documented in the comments section of the QIP.
A Best Possible Medication Discharge Plan (BPMDP) is the result of the medication reconciliation at discharge process and consists of clear and comprehensive information for the patient/family and other care providers regarding the medication(s) the patient should be taking after discharge, including medications that have been initiated, discontinued, or modified.
Note: Medication reconciliation at care transitions has been recognized as best practice and is increasingly becoming a system-wide standard. When done correctly as part of the discharge process, medication reconciliation at discharge can contribute to safer care transitions and improved outcomes such as reduced ED visits and readmissions. All hospitals should be working towards comprehensive implementation of medication reconciliation. As such, organizations should report current performance and set targets for medication reconciliation at discharge at the organization-level (i.e., for the entire hospital). It is recognized, however, that every organization is at a different stage of implementation when it comes to medication reconciliation at discharge, so for specific improvement initiatives, process measures, and change idea goals, organizations may wish to scale their focus to a specific unit/service/program or target population.
Medication reconciliation can occur at varying levels of intensity, starting with medication reconciliation at admission and the creation of a Best Possible Medication History (BPMH) and building from there. For the purposes of the QIP, organizations should strive to at least meet the following basic components of medication reconciliation at discharge:
1) Discharge reconciliation conducted by prescriber (informed by Best Possible Medication History and current medication profile) and
2) Creation of BPMDP for the patient/family and other care providers (can be electronically or non-electronically generated)
Organizations may wish to work towards more comprehensive and extensive medication reconciliation processes.
For more information on implementing and measuring medication reconciliation at discharge, including tools and resources for completing a BPMDP, refer to the ‘Safer Healthcare Now! Medication Reconciliation in Acute Care Getting Started Kit’, which is available online and visit the Medication Reconciliation page on the Institute for Safe Medication Practices Canada website.
For assistance with monitoring your ongoing MedRec processes, visit the Measures page on the Safer Healthcare Now! website or contact [email protected].
Reporting period Most recent quarter available
Data source In-house data collection
How to access data These data should be accessed from within your own organization.

10
Additional Hospital Indicators (continued)Indicator Hand Hygiene Compliance Before Patient Contact
Quality dimension: Safety
Definition Number of times that hand hygiene was performed before initial patient contact during the reporting period, divided by the number of observed hand hygiene opportunities before initial patient contact per reporting period, multiplied by 100.
Consistent with HQO’s Patient Safety public reporting website.
Additional specifications
--
Reporting period January 2014 – December 2014
Data source MOHLTC
How to access data Refer to HQO’s Patient Safety public reporting website for your organization’s rates.
Alternatively, these data can be accessed from within your own organization.
Indicator Ventilator Associated Pneumonia (VAP)Quality dimension: Safety
Definition VAP rate per 1,000 ventilator days: Total number of newly diagnosed VAP cases in the Intensive Care Unit (ICU) after at least 48 hours of mechanical ventilation during the reporting period, divided by the number of ventilator days in that reporting period, multiplied by 1,000
Consistent with publicly reportable patient safety data available on HQO’s Patient Safety public reporting website.
Additional specifications
--
Reporting period January 2014 – December 2014
Data source MOHLTC
How to access data To access your organization’s data for the reporting period, refer to HQO’s QIP Navigator. Data will be available in February 2015.
Indicator Central Line Associated Blood Stream Infection (CLI)Quality dimension: Safety
Definition CLI per 1,000 central line days: Total number of newly diagnosed CLI cases in the Intensive Care Unit (ICU) after at least 48 hours of being placed on a central line during the reporting period, divided by the number of central line days in that reporting period, multiplied by 1,000
Consistent with HQO’s Patient Safety public reporting website
Additional specifications
Reporting period January 2014 – December 2014
Data source MOHLTC
How to access data To access your organization’s data for the reporting period, refer to HQO’s QIP Navigator. Data will be available in February 2015.
11
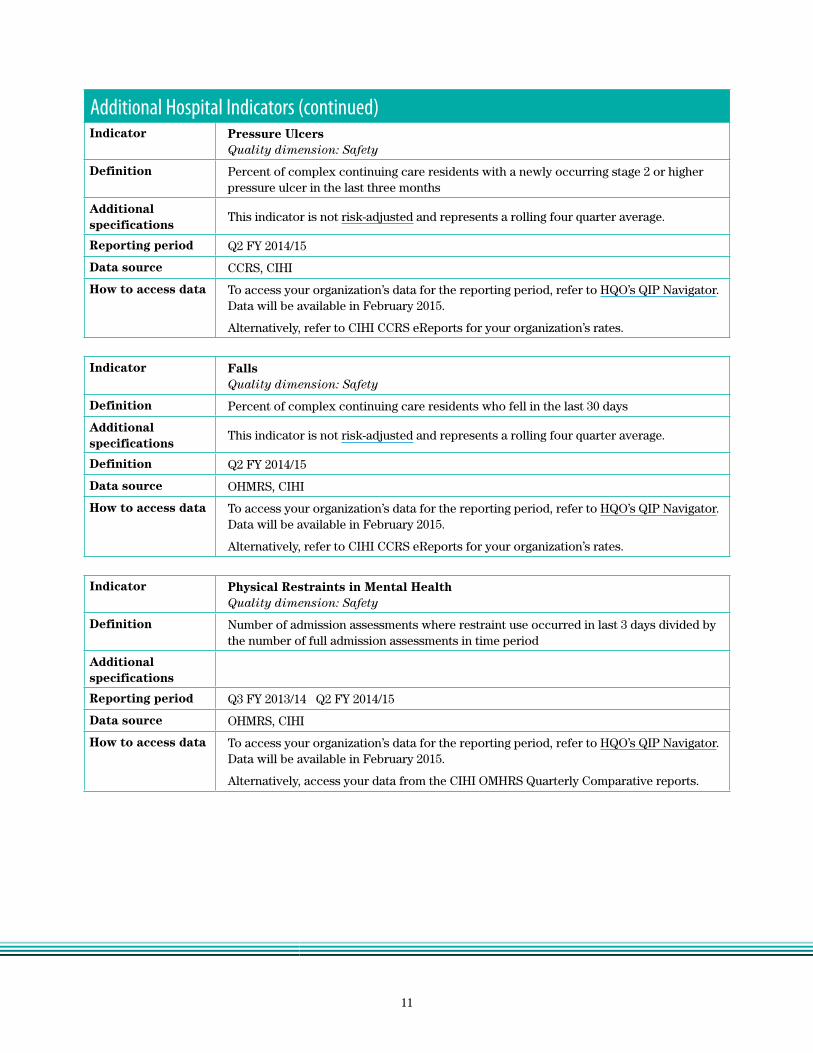
Additional Hospital Indicators (continued)Indicator Pressure Ulcers
Quality dimension: Safety
Definition Percent of complex continuing care residents with a newly occurring stage 2 or higher pressure ulcer in the last three months
Additional specifications
This indicator is not risk-adjusted and represents a rolling four quarter average.
Reporting period Q2 FY 2014/15
Data source CCRS, CIHI
How to access data To access your organization’s data for the reporting period, refer to HQO’s QIP Navigator. Data will be available in February 2015.
Alternatively, refer to CIHI CCRS eReports for your organization’s rates.
Indicator FallsQuality dimension: Safety
Definition Percent of complex continuing care residents who fell in the last 30 days
Additional specifications
This indicator is not risk-adjusted and represents a rolling four quarter average.
Definition Q2 FY 2014/15
Data source OHMRS, CIHI
How to access data To access your organization’s data for the reporting period, refer to HQO’s QIP Navigator. Data will be available in February 2015.
Alternatively, refer to CIHI CCRS eReports for your organization’s rates.
Indicator Physical Restraints in Mental HealthQuality dimension: Safety
Definition Number of admission assessments where restraint use occurred in last 3 days divided by the number of full admission assessments in time period
Additional specifications
Reporting period Q3 FY 2013/14 Q2 FY 2014/15
Data source OHMRS, CIHI
How to access data To access your organization’s data for the reporting period, refer to HQO’s QIP Navigator. Data will be available in February 2015.
Alternatively, access your data from the CIHI OMHRS Quarterly Comparative reports.
12
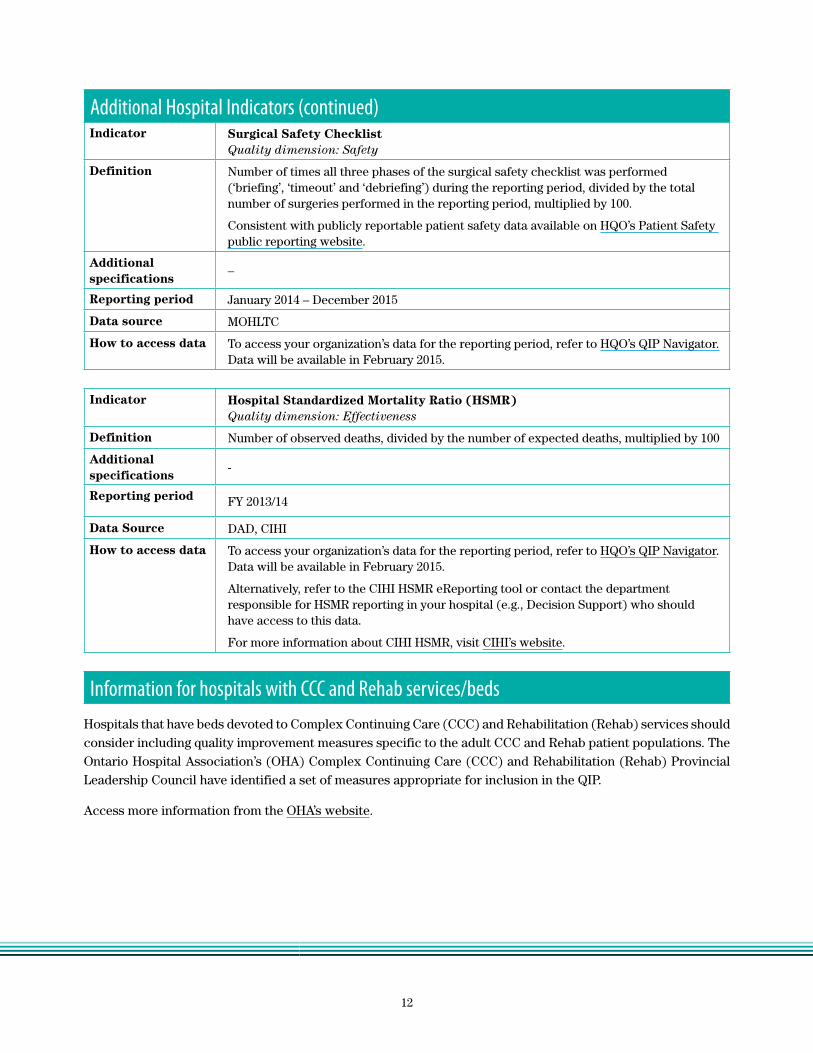
Additional Hospital Indicators (continued)Indicator Surgical Safety Checklist
Quality dimension: Safety
Definition Number of times all three phases of the surgical safety checklist was performed (‘briefing’, ‘timeout’ and ‘debriefing’) during the reporting period, divided by the total number of surgeries performed in the reporting period, multiplied by 100.
Consistent with publicly reportable patient safety data available on HQO’s Patient Safety public reporting website.
Additional specifications
–
Reporting period January 2014 – December 2015
Data source MOHLTC
How to access data To access your organization’s data for the reporting period, refer to HQO’s QIP Navigator. Data will be available in February 2015.
Indicator Hospital Standardized Mortality Ratio (HSMR)Quality dimension: Effectiveness
Definition Number of observed deaths, divided by the number of expected deaths, multiplied by 100
Additional specifications
-
Reporting period FY 2013/14
Data Source DAD, CIHI
How to access data To access your organization’s data for the reporting period, refer to HQO’s QIP Navigator. Data will be available in February 2015.
Alternatively, refer to the CIHI HSMR eReporting tool or contact the department responsible for HSMR reporting in your hospital (e.g., Decision Support) who should have access to this data.
For more information about CIHI HSMR, visit CIHI’s website.
Information for hospitals with CCC and Rehab services/bedsHospitals that have beds devoted to Complex Continuing Care (CCC) and Rehabilitation (Rehab) services should consider including quality improvement measures specific to the adult CCC and Rehab patient populations. The Ontario Hospital Association’s (OHA) Complex Continuing Care (CCC) and Rehabilitation (Rehab) Provincial Leadership Council have identified a set of measures appropriate for inclusion in the QIP.
Access more information from the OHA’s website.

13
______
II. Primary Care QIP Indicators Priority Primary Care IndicatorsIndicator Timely Access to Primary Care When Needed
This is a priority indicator for 2015/16Quality dimension: Access
Definition Percent of patients/clients able to see a doctor or nurse practitioner on the same day or next day, when needed
Additional specifications
Organizations are expected to measure progress on this indicator using the following patient/client survey question*:
The last time you were sick or were concerned you had a health problem, how many days did it take from when you first tried to see your doctor or nurse practitioner to when you actually SAW him/her or someone else in their office?
a) same day b) next day c) 2-19 days (enter number of days: ) d) 20 or more days e) not applicable (Don’t know/ refused)
To calculate the indicator result, add the number of respondents who responded “same day” and “next day”, divide by the number of respondents who registered an answer for this question (do not include non-respondents or respondents who answered “not applicable/Don’t know/refused”).
Third next available visit can be used as a process indicator alongside the Timely Access to Primary Care When Needed indicator described here. Please note that while the third next available indicator is tracked at the provider level, this QIP indicator should be tracked at the organization level.
*Health Quality Ontario is currently field testing a Primary Care Patient Experience Survey tool. Created in partnership by HQO with AFHTO, AOHC, OCFP and OMA, the survey tool is designed to be administered by practices to support their quality improvement efforts. The Primary Care Patient Experience Survey captures patient experiences in two ways: very specific aspects of their most recent primary care visit, and their ongoing experience with the care they receive. The survey also includes questions designed to help practices consistently record and include patient experiences in their annual Quality Improvement Plans. The pilot-test versions of the survey can be found on the Quality Improvement Planning page of HQO’s website. Please note that the survey may undergo further changes after the pilot-test. For more information about the survey, please contact [email protected].
Once the pilot test is complete, this survey and companion ‘implementation guide’ will be made widely available to all primary care practices in Ontario. Implementation of the survey will be the responsibility of practices and/or organizations either on their own or in collaboration with other practices or organizations.
In the future, it is anticipated that this priority theme could be measured through improvements in the use of electronic scheduling.
Reporting period April 2014 – March 2015 (or most recent 12 month period available)
Data source In-house surveys
How to access data This data should be accessed from within your own organization.
14
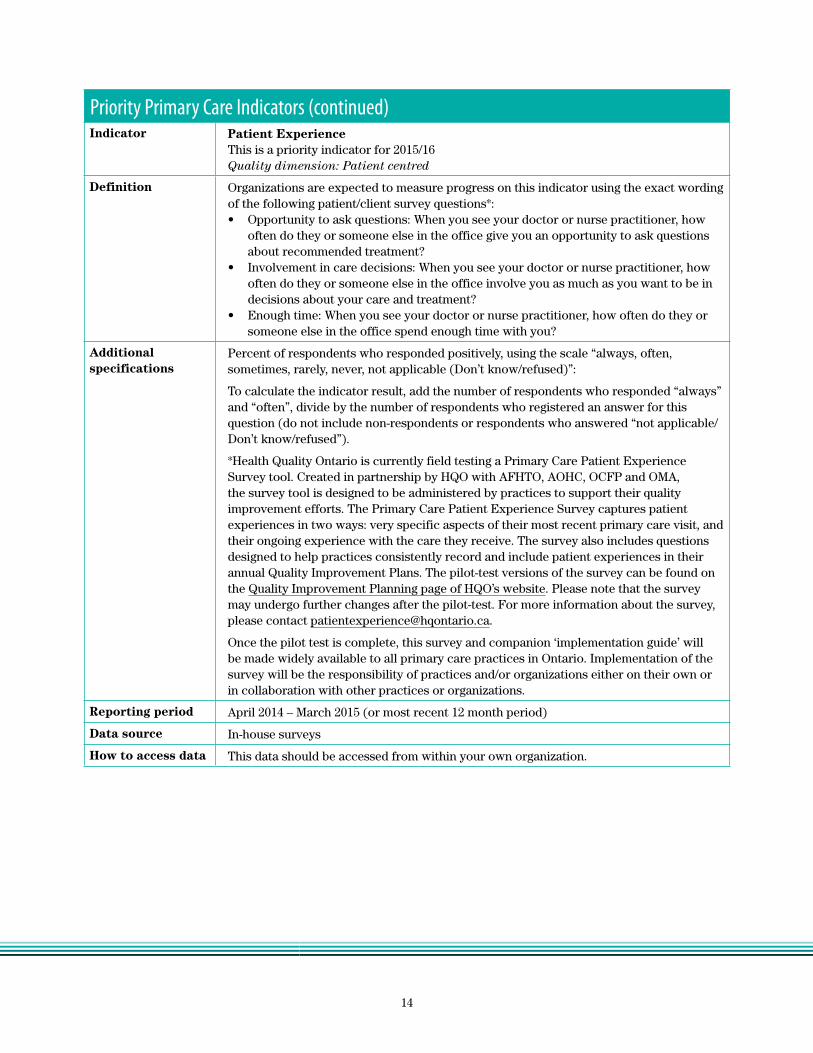
Priority Primary Care Indicators (continued)Indicator Patient Experience
This is a priority indicator for 2015/16Quality dimension: Patient centred
Definition Organizations are expected to measure progress on this indicator using the exact wording of the following patient/client survey questions*:• Opportunity to ask questions: When you see your doctor or nurse practitioner, how
often do they or someone else in the office give you an opportunity to ask questions about recommended treatment?
• Involvement in care decisions: When you see your doctor or nurse practitioner, how often do they or someone else in the office involve you as much as you want to be in decisions about your care and treatment?
• Enough time: When you see your doctor or nurse practitioner, how often do they or someone else in the office spend enough time with you?
Additional specifications
Percent of respondents who responded positively, using the scale “always, often, sometimes, rarely, never, not applicable (Don’t know/refused)”:
To calculate the indicator result, add the number of respondents who responded “always” and “often”, divide by the number of respondents who registered an answer for this question (do not include non-respondents or respondents who answered “not applicable/ Don’t know/refused”).
*Health Quality Ontario is currently field testing a Primary Care Patient Experience Survey tool. Created in partnership by HQO with AFHTO, AOHC, OCFP and OMA, the survey tool is designed to be administered by practices to support their quality improvement efforts. The Primary Care Patient Experience Survey captures patient experiences in two ways: very specific aspects of their most recent primary care visit, and their ongoing experience with the care they receive. The survey also includes questions designed to help practices consistently record and include patient experiences in their annual Quality Improvement Plans. The pilot-test versions of the survey can be found on the Quality Improvement Planning page of HQO’s website. Please note that the survey may undergo further changes after the pilot-test. For more information about the survey, please contact [email protected].
Once the pilot test is complete, this survey and companion ‘implementation guide’ will be made widely available to all primary care practices in Ontario. Implementation of the survey will be the responsibility of practices and/or organizations either on their own or in collaboration with other practices or organizations.
Reporting period April 2014 – March 2015 (or most recent 12 month period)
Data source In-house surveys
How to access data This data should be accessed from within your own organization.

15
Priority Primary Care Indicators (continued)Indicator Primary Care Visits Post-Discharge
This is a priority indicator for 2015/16Quality dimension: Integrated
Definition Percent of patients/clients who see their primary care provider within 7 days after discharge from hospital for selected conditions
Additional specifications
Inclusion Criteria: Includes patients rostered at the time of discharge to an Ontario physician in a primary care practice model. Follow-up is restricted to professional services provided by any general practitioner, family physician, geriatrician or pediatrician in the practice group the patient is rostered to.
For a list of included CMGs and further inclusion/exclusion criteria, refer to the MOHLTC Resource for Indicator Standards website.
Exclusion Criteria: Records with missing valid data on admission/discharge date, health number, age and gender; deaths; transfers, patient sign-outs against medical advice and discharge destinations of acute, ambulatory, day surgery, ER and palliative care settings. Negated Ontario Health Insurance Plan (OHIP) claims, duplicate claims and lab claims are also excluded
Methodological Notes: Data are provided at the organization (e.g., Family Health Team)-level, are not real-time, and are provided for the 2013/14 fiscal year. Information based on administrative data lag in time due to the data submission process. Although there are time lags with the reporting of these data, the information remains valuable for informing quality improvement initiatives.
Data and metrics have been suppressed where numerator (events) are fewer than five (5) and denominator (population admitted with selected conditions) is fewer than 30. This is standard practice regarding confidentiality of data and residual disclosure of individual information. Data should be interpreted with caution if numerator contains 6-19 events OR denominator contains 30-99 individuals.
Includes patients rostered at the time of discharge to an Ontario physician in a primary care practice model. Does not include telephone calls to patients, visits to the family physician in the ED, or visits to other non-physician providers.
This is a developmental indicator and future results may incorporate refinements to the methodology that are not presented here.
Reporting period FY 2013/14
Data source DAD, Claims History Database, data (M7), Client Agency Program Data (CAPE), Corporate Provider Database (CPDB)
How to access data Primary care organizations with rostered patients will be able to access data on the MOHLTC Health Data Branch Web Portal. Click on ‘Primary Care’ then ‘Quality Improvement Plan’. Contact [email protected] to obtain a username and password if you do not already have one.

16
Additional Primary Care IndicatorsOrganizations are expected to include the priority indicators above in their QIPs. Organizations may also include any additional indicators in their QIPs, as relevant to their quality improvement goals. The material below contains a list of additional indicators that can be included in the QIP, but other indicators beyond this list can be included to address unique organizational priorities.
Indicator Emergency department visits for conditions Best Managed Elsewhere (BME)Quality dimension: Access
Definition Percent of patients/clients who visited the Emergency Department (ED) for conditions best managed elsewhere (BME)
Additional specifications
Inclusion Criteria: Conditions designated as “BME” include: conjunctivitis, cystitis, otitis media, and upper respiratory infections (e.g., common cold, acute or chronic sinusitis and tonsillitis, acute pharyngitis, laryngitis or tracheitis, and others.
Denominator: Total number of rostered patients between 1 and 74 years old in a given time period
Exclusion Criteria: Patients less than 1 year of age and patients older than age 74, visits with an inpatient admission, visits with CTAS I, II or III and planned emergency visits.
Methodological Notes: • Data are not real-time, and are provided for the 2013/14 fiscal year. Information based
on administrative data lag in time due to the data submission process. Although there are time lags with the reporting of these data, the information remains valuable for informing quality improvement initiatives.
• Data and metrics have been suppressed where numerator (events) are fewer than five (5) and denominator (population admitted with selected conditions) is fewer than 30. This is standard practice regarding confidentiality of data and residual disclosure of individual information. Data should be interpreted with caution if numerator contains 6-19 events OR denominator contains 30-99 individuals.
Reporting period FY 2013/14
Data source DAD, Claims History Database, data (M7), Client Agency Program Data (CAPE),Corporate Provider Database (CPDB)
How to access data Organizations with rostered patients will be able to access data on the MOHLTC Health Data Branch Web Portal. Click on ‘Primary Care’ then ‘Quality Improvement Plan’. Contact [email protected] to obtain a username and password if you do not already have one.
17
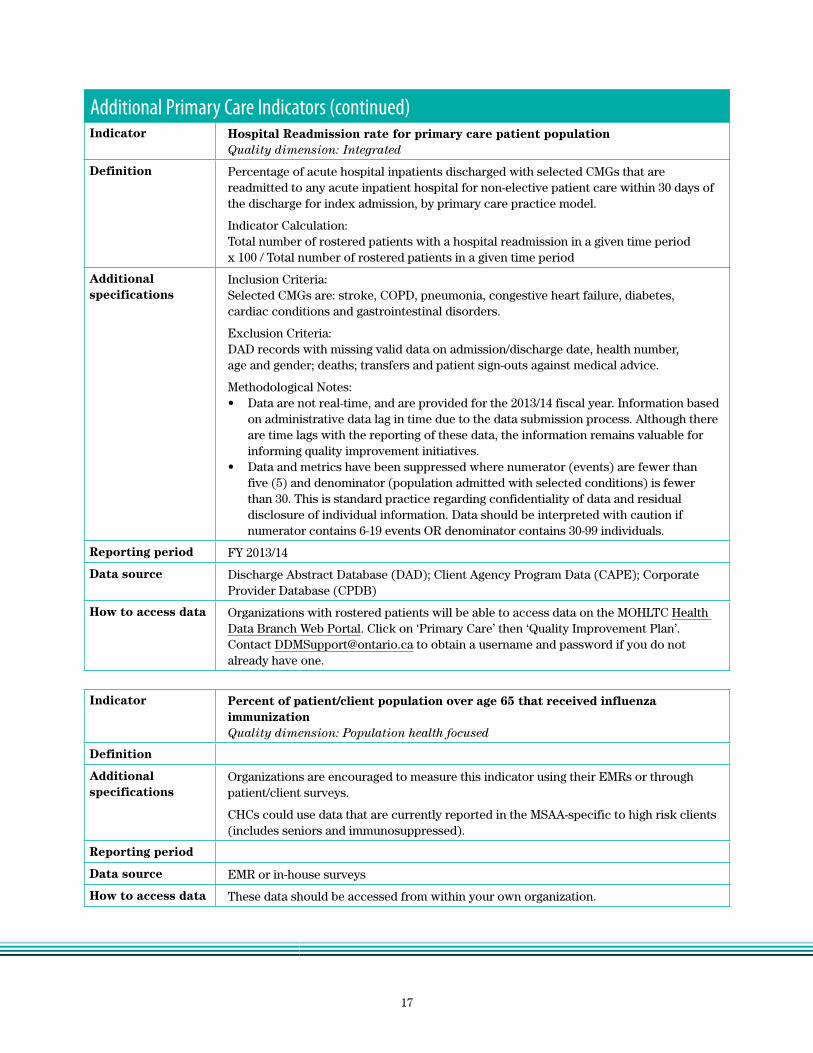
Additional Primary Care Indicators (continued)Indicator Hospital Readmission rate for primary care patient population
Quality dimension: Integrated
Definition Percentage of acute hospital inpatients discharged with selected CMGs that are readmitted to any acute inpatient hospital for non-elective patient care within 30 days of the discharge for index admission, by primary care practice model.
Indicator Calculation:Total number of rostered patients with a hospital readmission in a given time period x 100 / Total number of rostered patients in a given time period
Additional specifications
Inclusion Criteria:Selected CMGs are: stroke, COPD, pneumonia, congestive heart failure, diabetes, cardiac conditions and gastrointestinal disorders.
Exclusion Criteria: DAD records with missing valid data on admission/discharge date, health number, age and gender; deaths; transfers and patient sign-outs against medical advice.
Methodological Notes: • Data are not real-time, and are provided for the 2013/14 fiscal year. Information based
on administrative data lag in time due to the data submission process. Although there are time lags with the reporting of these data, the information remains valuable for informing quality improvement initiatives.
• Data and metrics have been suppressed where numerator (events) are fewer than five (5) and denominator (population admitted with selected conditions) is fewer than 30. This is standard practice regarding confidentiality of data and residual disclosure of individual information. Data should be interpreted with caution if numerator contains 6-19 events OR denominator contains 30-99 individuals.
Reporting period FY 2013/14
Data source Discharge Abstract Database (DAD); Client Agency Program Data (CAPE); Corporate Provider Database (CPDB)
How to access data Organizations with rostered patients will be able to access data on the MOHLTC Health Data Branch Web Portal. Click on ‘Primary Care’ then ‘Quality Improvement Plan’. Contact [email protected] to obtain a username and password if you do not already have one.
Indicator Percent of patient/client population over age 65 that received influenza immunizationQuality dimension: Population health focused
Definition
Additional specifications
Organizations are encouraged to measure this indicator using their EMRs or through patient/client surveys.
CHCs could use data that are currently reported in the MSAA-specific to high risk clients (includes seniors and immunosuppressed).
Reporting period
Data source EMR or in-house surveys
How to access data These data should be accessed from within your own organization.

18
Additional Primary Care Indicators (continued)Indicator Percent of patient/client population who are “up to date” in cancer screening
Quality dimension: Population health focused
Definition
Additional specifications
Organizations are encouraged to measure these indicators using their EMRs.
CHCs could use the data that are currently reported in the MSAA.
In addition, PEM Physicians (primary care physicians who participate in a Primary Care Enrolment Model) who have not yet registered for a ONE® ID are encouraged to contact eHealth Ontario at [email protected] to arrange for registration so that they may access their colorectal cancer Screening Activity Report (SAR) online and easily access information regarding the colorectal screening status of their patients. Registration appointments will be scheduled based on location and/or the date of request. The SAR contains patient-level screening data for all enrolled and eligible patients, the physician’s screening rate, and a comparison to other physician screening rates in the LHIN and province. It also identifies patients who may require follow-up according to CCO’s clinical recommendations.
See Cancer Care Ontario’s Primary Care Quality Improvement Toolkit for resources on this indicator.
Reporting period
Data source EMR
How to access data This data should be accessed from within your own organization.
Primary Care Practice report – additional supports for Quality Improvement
Health Quality Ontario and the Institute for Clinical Evaluative Sciences (ICES), in partnership with the Ontario College of Family Physicians (OCFP), the Association of Family Health Teams of Ontario (AFHTO), and other primary care stakeholders have developed a report for primary care physicians that provides each physician with easy-to-read data derived from administrative databases for a select number of indicators. The reports will include information on each practice’s own patient population, case mix, health care use, cancer screening, and chronic disease management data. The reports will also include regional and provincial comparators (all at the aggregate level). The reports are customized to each individual physician and access is limited to that physician alone.
Physicians who would like to receive their personalized report or learn more about it, can find more information on the Primary Care Practice Report page on HQO’s website.

19
III. Community Care Access Centre QIP IndicatorsPriority CCAC Indicators Indicator Falls for Long-Stay Clients
This is a priority indicator for 2015/16Quality dimension: Safety
Definition Percentage of adult long-stay home care clients who record a fall on their follow-up RAI-HC assessment
Additional specifications
This indicator is not risk adjusted and is consistent with the M-SAA 2011-14.
Reporting period Q3 FY 2013/14 – Q2 FY 2014/15
Data source HCD, RAI-HC via LSAS
How to access data To access your organization’s data for this indicator, visit the CCAC Reporting Portal.
Indicator Unplanned Emergency Department VisitsThis is a priority indicator for 2015/16Quality dimension: Effectiveness
Definition Percentage of home care clients with an unplanned, less-urgent ED visit within the first 30 days of discharge from hospital
Additional specifications
This indicator is not risk adjusted.
Numerator: Number of adult home care clients who had an emergency department visit for CTAS levels 4 or 5 (but who were not admitted to hospital) in the first 30 days after hospital discharge.
Denominator: All adult CCAC home care clients discharged from a hospital.
Exclusion criteria: Excludes service if case management; excludes hospital discharge that is newborn, stillborn, or cadaver donor; excludes planned ED visits.
Reporting period Q2 FY 2013/14 – Q1 FY 2014/15
Data source HCD, CIHI DAD, CIHI NACRS
How to access data MOHLTC will provide CCACs with data for this indicator via the CCAC Reporting Portal.

20
Priority CCAC Indicators (continued) Indicator Hospital Readmissions
This is a priority indicator for 2015/16Quality dimension: Effectiveness
Definition Percentage of home care clients who experienced an unplanned readmission to hospital within 30 days of discharge from hospital
Additional specifications
This indicator is not risk adjusted.
Numerator: Number of adult home care clients with an unplanned readmission to hospital within 30 days of hospital discharge.
Denominator: All adult CCAC home care clients discharged from a hospital.
Exclusion criteria: Excludes service if case management; excludes hospital discharge that is newborn, stillborn, or cadaver donor; excludes planned readmissions.
Reporting period Q2 FY 2013/14 – Q1 FY 2014/15
Data source HCD, CIHI DAD, CIHI NACRS
How to access data MOHLTC will provide CCACs with data for this indicator via the CCAC Reporting Portal.
Indicator Five-Day Wait Time for Home CareThis is a priority indicator for 2015/16Quality dimension: Access
Definition Organizations are expected to measure progress on 5-day wait times for home care using the following measures:
• Personal Support for Complex Patients: Percentage of complex patients who received their first personal support service within 5 days of the service authorization date
• Nursing Visits: Percentage of patients who received their first nursing visit within 5 days of the service authorization date
Additional specifications
Reporting period Q3 FY 2013/14 – Q2 FY 2014/15
Data source CHRIS
How to access data MOHTLC will provide CCACs with data for this indicator via the CCAC Reporting Portal.

21
Priority CCAC Indicators (continued)Indicator Client Experience
This is a priority indicator for 2015/16Quality dimension: Client-centred
Definition Percent of home care clients who responded “Good”, “Very Good”, or “Excellent” on a five-point scale to any of the following client experience survey questions:
• Overall rating of CCAC services
• Overall rating of management/handling of care by Care Coordinator
• Overall rating of service provided by service provider
Additional specifications
This indicator is not risk adjusted and is consistent with HQO’s Home Care Public Reporting website for FY 2012/13 and onwards.
Numerator: The sum of the number of positive responses (“Good”, “Very Good”, or “Excellent”) registered for each of the three client experience questions listed above.
Denominator: The total number of valid responses registered for all of the questions listed above.
Exclusion criteria: Excludes clients who received in-school service only, nursing clinic services, respite, or medical supplies and equipment; excludes end-of-ife-clients, clients not yet categorized, in-home clients classified as out-of-region, convalescent care clients.
Reporting period FY 2013/14
Data source Client and Caregiver Experience Evaluation Survey, OACCAC
How to access data To access your organization’s data for this indicator, refer to the NRC Canada eReports website.

22
IV. Long-Term Care Home QIP IndicatorsPriority LTC Home IndicatorsIndicator Falls
This is a priority indicator for 2015/16Quality dimension: Safety
Definition Percentage of residents who had a recent fall (in the last 30 days)
Additional specifications
This indicator is not risk-adjusted and represents a rolling four quarter average.
This indicator is consistent with HQO‘s LTC Public Reporting website; however, HQO publicly reports adjusted rates. For the purposes of quality improvement planning, unadjusted rates (i.e., not risk-adjusted) should be used.
Reporting period Q2 FY 2014/15
Data source CIHI CCRS
How to access data To access your organization’s unadjusted rates for this indicator, refer to your organization’s CIHI CCRS eReports.
Indicator Pressure ulcersThis is a priority indicator for 2015/16Quality dimension: Safety
Definition Percentage of residents who had a pressure ulcer that recently got worse
Additional specifications
This indicator is not risk-adjusted and represents a rolling four quarter average.
This indicator is consistent with HQO‘s LTC Public Reporting website; however, HQO publicly reports adjusted rates. For the purposes of quality improvement planning, unadjusted rates (i.e., not risk-adjusted) should be used.
Reporting period Q2 FY 2014/15
Data source CIHI CCRS
How to access data To access your organization’s unadjusted rates for this indicator, refer to your organization’s CIHI CCRS eReports.
Indicator RestraintsThis is a priority indicator for 2015/16Quality dimension: Safety
Definition Percentage of residents who were physically restrained (daily)
Additional specifications
This indicator is not risk-adjusted and represents a rolling four quarter average.
This indicator is consistent with HQO‘s LTC Public Reporting website; however, HQO publicly reports adjusted rates. For the purposes of quality improvement planning, unadjusted rates (i.e., not risk-adjusted) should be used.
Reporting period Q2 FY 2014/15
Data source CIHI CCRS
How to access data To access your organization’s unadjusted rates for this indicator, refer to your organization’s CIHI CCRS eReports.

23
Priority LTC Home Indicators (continued)Indicator Incontinence
This is a priority indicator for 2015/16Quality dimension: Effectiveness
Definition Percentage of residents with worsening bladder control during a 90-day period
Additional specifications
This indicator is not risk-adjusted and represents a rolling four quarter average.
This indicator is consistent with HQO‘s LTC Public Reporting website; however, HQO publicly reports adjusted rates. For the purposes of quality improvement planning, unadjusted rates (i.e., not risk-adjusted) should be used.
Reporting period Q2 FY 2014/15
Data source CIHI CCRS
How to access data To access your organization’s unadjusted rates for this indicator, refer to your organization’s CIHI CCRS eReports.
Indicator Appropriate Prescribing – Potentially Inappropriate Antipsychotic Use in Long-Term CareThis is a priority indicator for 2015/16Quality dimension: Patient-centred
Definition Percentage of residents on antipsychotics without a diagnosis of psychosis
Additional specifications
This indicator is not risk-adjusted and represents a rolling four quarter average.
Note: This indicator is calculated on a quarterly basis by CIHI and made available to all LTC homes in Ontario via CIHI CCRS eReports. Homes that are not currently tracking anti-psychotic prescribing are encouraged to use this indicator because data are readily available. However, LTC homes that are already engaged in quality improvement efforts related to appropriate prescribing may choose to use a different indicator in alignment with their ongoing improvement activities.
Reporting period Q2 FY 2014/15
Data source CIHI CCRS
How to access data To access your organization’s unadjusted rates for this indicator, refer to your organization’s CIHI CCRS eReports.
24
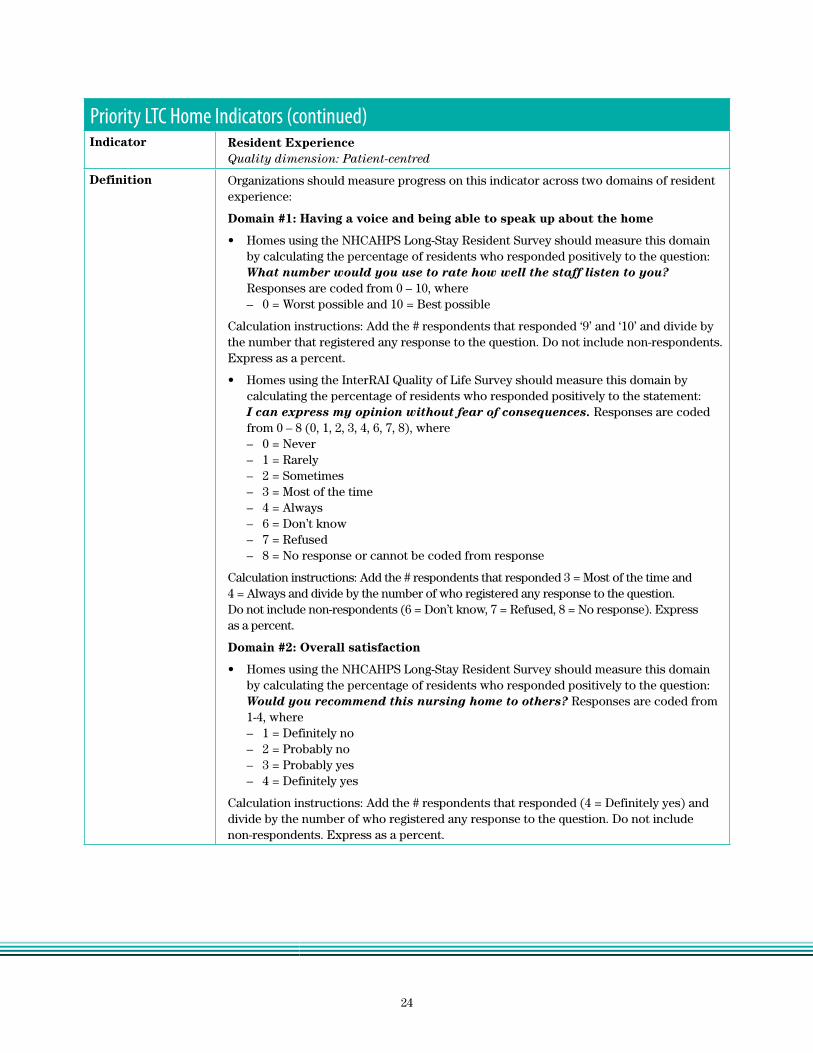
Priority LTC Home Indicators (continued)Indicator Resident Experience
Quality dimension: Patient-centred
Definition Organizations should measure progress on this indicator across two domains of resident experience:
Domain #1: Having a voice and being able to speak up about the home
• Homes using the NHCAHPS Long-Stay Resident Survey should measure this domain by calculating the percentage of residents who responded positively to the question: What number would you use to rate how well the staff listen to you? Responses are coded from 0 – 10, where – 0 = Worst possible and 10 = Best possible
Calculation instructions: Add the # respondents that responded ‘9’ and ‘10’ and divide by the number that registered any response to the question. Do not include non-respondents. Express as a percent.
• Homes using the InterRAI Quality of Life Survey should measure this domain by calculating the percentage of residents who responded positively to the statement: I can express my opinion without fear of consequences. Responses are coded from 0 – 8 (0, 1, 2, 3, 4, 6, 7, 8), where – 0 = Never – 1 = Rarely – 2 = Sometimes – 3 = Most of the time – 4 = Always – 6 = Don’t know – 7 = Refused – 8 = No response or cannot be coded from response
Calculation instructions: Add the # respondents that responded 3 = Most of the time and 4 = Always and divide by the number of who registered any response to the question. Do not include non-respondents (6 = Don’t know, 7 = Refused, 8 = No response). Express as a percent.
Domain #2: Overall satisfaction
• Homes using the NHCAHPS Long-Stay Resident Survey should measure this domain by calculating the percentage of residents who responded positively to the question: Would you recommend this nursing home to others? Responses are coded from 1-4, where – 1 = Definitely no – 2 = Probably no – 3 = Probably yes – 4 = Definitely yes
Calculation instructions: Add the # respondents that responded (4 = Definitely yes) and divide by the number of who registered any response to the question. Do not include non-respondents. Express as a percent.

25
Priority LTC Home Indicators (continued)Definition continued
• Homes using the InterRAI Quality of Life Survey should measure this domain by calculating the percentage of residents who responded positively to the statement: I would recommend this site or organization to others. Responses are coded from 0 – 8 (0, 1, 2, 3, 4, 6, 7, 8), where – 0 = Never – 1 = Rarely – 2 = Sometimes – 3 = Most of the time – 4 = Always – 6 = Don’t know – 7 = Refused – 8 = No response or cannot be coded from response
Calculation instructions: Add the # respondents that responded (3 = Most of the time and 4 = Always) and divide by the number of who registered any response to the question. Do not include non-respondents (6 = Don’t know, 7 = Refused, 8 = No response). Express as a percent.
Note: Homes that use a validated survey tool other than NHCAHPS or InterRAI Quality of Life should select and use the questions from their survey that are most similar to the ones listed (one question per domain). Homes that design and administer their own survey should consider adding questions (one per domain) that align with either the NHCAHPS or InterRAI Quality of Life questions listed above.
Additional specifications
The Long-Term Care Homes Act, 2010 (LTCHA) stipulates that every LTC home shall ensure that, at least once in every year, a survey is taken of the residents and their families to measure their satisfaction with the home and the care, services, programs and goods provided at the home. 2007, c. 8, s. 85 (1). The LTCHA also requires homes to seek the advice of the Councils (Residents and Family) in developing and carrying out the survey, and in acting on its results. c. 8, s. 85 (3).
Where homes are integrating the collection of resident experience information for the QIP process with their existing resident satisfaction processes, they must ensure they are meeting all of the requirements under the LTCHA (i.e., the QIP process is not a substitute for the resident satisfaction survey requirements under the LTCHA).
For more information about the NHCAHPS Long-Stay Resident Survey, refer to the Agency for Healthcare Research and Quality’s Get Nursing Home Surveys and Instructions website.
For more information about the InterRAI Quality of Life Survey tool, refer to InterRAI’s website.
Reporting period April 2014 – March 2015 (or most recent 12 month period). If you have completed this year’s survey you do not have to resurvey
Data source NHCAHPS Long-Stay Resident Survey; InterRAI Quality of Life Survey; other validated resident experience survey; or in-house survey
How to access data These data should be accessed from within your own organization.

26
Priority LTC Home Indicators (continued)Indicator Potentially Avoidable Emergency Department Visits for Long-Term Care Residents
This is a priority indicator for 2015/16Quality dimension: Integrated
Definition Number of emergency department (ED) visits for modified list of ambulatory care sensitive conditions* (ACSC) per 100 long-term care residents
Additional specifications
Inclusion criteria: Includes all active LTC home residents age 65 and older in Ontario LTC homes in a given year. Includes ED visits, transfers between EDs, ED visits resulting in admission, and death in ED. Modified list of ACSCs consists of the following conditions presenting to the ED that are potentially preventable:
• Angina• Asthma• Cellulitis• Chronic Obstructive Pulmonary Disease (COPD)• Congestive Heart Failure (CHF)• Septicemia• Dehydration• Dental conditions• Diabetes• Gastroenteritis• Grand mal & seizure disorders• Hypertension• Hypoglycemia• Injuries from falls• Mental health/behavioural disorders• Pneumonia • Severe ear, nose and throat (ENT) disorders
Exclusion criteria: Excludes planned or scheduled ED visits.
ED visits can be necessary and appropriate. Tracking ED visits due to these conditions can help homes identify ED visits that may have been avoidable if the underlying cause was effectively managed earlier on. For many homes, the target this year will be to understand their baseline.
This indicator has been updated since the 2014/15 LTC QIPs to help LTC homes more accurately track ED visits due to ACSCs at the LTC home-level. The modified list of ACSCs that is used to calculate this indicator has been developed specifically for Ontario’s LTC population and for quality improvement purposes. HQO’s LTC Public Reporting website also reports an indicator related to ED visits at the provincial level, using a different list of ACSCs.
Quality improvement guidance related to this indicator are available on the HQO website and through the INTERACT (Interventions to Reduce Acute Care Transfers) program.
Reporting period Q3 FY 2013/14 – Q2 FY 2014/15
Data source CIHI NACRS, CIHI CCRS
How to access data MOHLTC will provide organizations with this data via LTCHomes.net
27
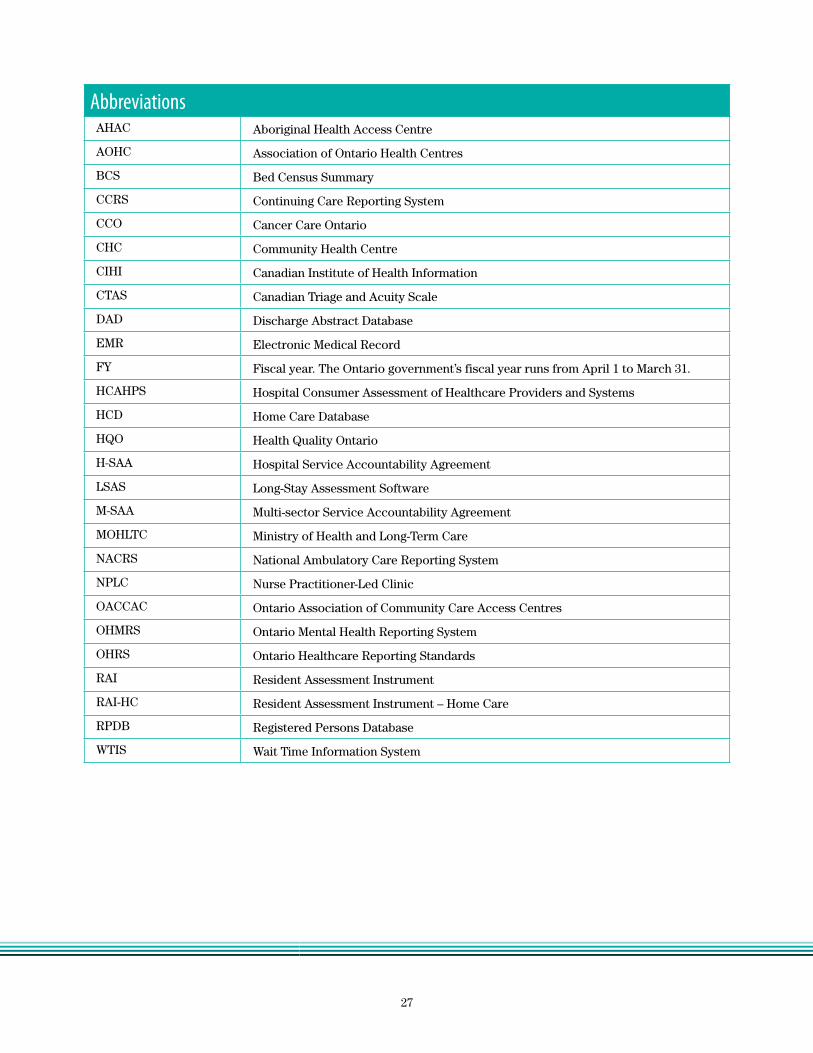
AbbreviationsAHAC Aboriginal Health Access Centre
AOHC Association of Ontario Health Centres
BCS Bed Census Summary
CCRS Continuing Care Reporting System
CCO Cancer Care Ontario
CHC Community Health Centre
CIHI Canadian Institute of Health Information
CTAS Canadian Triage and Acuity Scale
DAD Discharge Abstract Database
EMR Electronic Medical Record
FY Fiscal year. The Ontario government’s fiscal year runs from April 1 to March 31.
HCAHPS Hospital Consumer Assessment of Healthcare Providers and Systems
HCD Home Care Database
HQO Health Quality Ontario
H-SAA Hospital Service Accountability Agreement
LSAS Long-Stay Assessment Software
M-SAA Multi-sector Service Accountability Agreement
MOHLTC Ministry of Health and Long-Term Care
NACRS National Ambulatory Care Reporting System
NPLC Nurse Practitioner-Led Clinic
OACCAC Ontario Association of Community Care Access Centres
OHMRS Ontario Mental Health Reporting System
OHRS Ontario Healthcare Reporting Standards
RAI Resident Assessment Instrument
RAI-HC Resident Assessment Instrument – Home Care
RPDB Registered Persons Database
WTIS Wait Time Information System