
India’s New Growth Story - grasim.com · Idea Cellular No. 1 Caustic Soda producer in India...
33
1 Quarterly Performance Review Q3 FY18, 14 th February 2018 India’s New Growth Story Grasim Industries Limited
Transcript of India’s New Growth Story - grasim.com · Idea Cellular No. 1 Caustic Soda producer in India...

1
Quarterly Performance Review Q3 FY18, 14th February 2018
India’s New Growth Story
Grasim Industries Limited
2
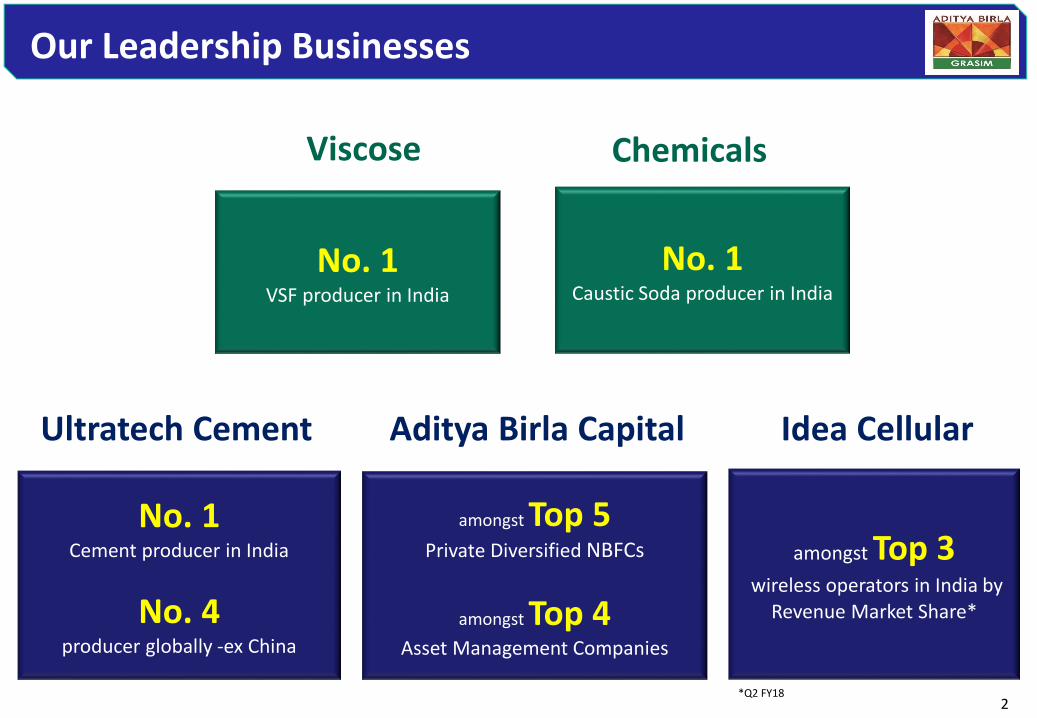
Our Leadership Businesses
No. 1Cement producer in India
No. 4 producer globally -ex China
Ultratech Cement
amongst Top 3wireless operators in India by
Revenue Market Share*
Idea Cellular
No. 1Caustic Soda producer in India
Chemicals
amongst Top 5 Private Diversified NBFCs
amongst Top 4Asset Management Companies
Aditya Birla Capital
No. 1VSF producer in India
Viscose
*Q2 FY18

3
HighlightsFinancial
Performance
Business Performance
Glossary
VSF: Viscose Staple Fiber, VFY: Viscose Filament Yarn, MT : Metric Ton, K: One Thousand, TPA : Tons Per Annum, YoY: Year on YearComparison, CY : Current Year, LY : Last Year, YTD : Year to Date, EBITDA : Earnings Before Interest, Tax ,Depreciation and Amortization, ECU :Electro Chemical Unit, ROAvCE : Return on Avg. Capital Employed (Excluding Capital Work In Progress), EBITDA Margin = EBITDA / (Revenue +Other Income) * 100; Revenue is net of excise duty unless stated otherwise, Financials from FY16 onwards are as per IndAS.
Note: The Results of the Q3 FY18 include the financial results of the businesses of erstwhile ABNL (merged with the Company w.e.f. 1st July,2017) . Hence the same are not strictly comparable with Q3FY17.
Content CONTENTS
4
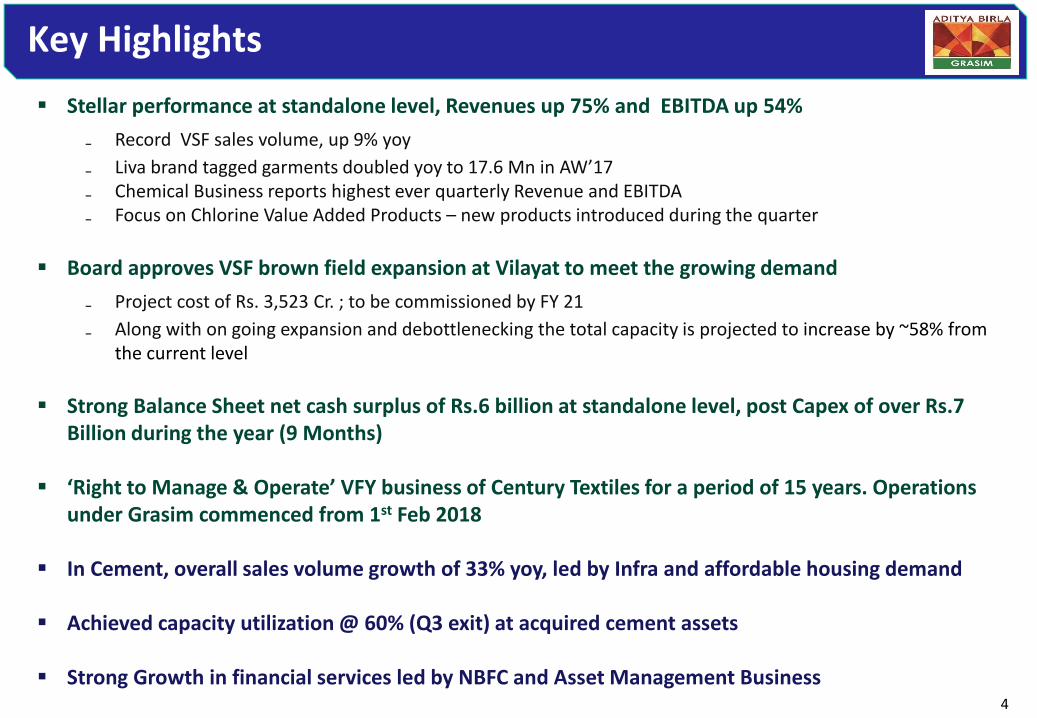
Key Highlights
Stellar performance at standalone level, Revenues up 75% and EBITDA up 54%
₋ Record VSF sales volume, up 9% yoy
₋ Liva brand tagged garments doubled yoy to 17.6 Mn in AW’17₋ Chemical Business reports highest ever quarterly Revenue and EBITDA₋ Focus on Chlorine Value Added Products – new products introduced during the quarter
Board approves VSF brown field expansion at Vilayat to meet the growing demand
₋ Project cost of Rs. 3,523 Cr. ; to be commissioned by FY 21
₋ Along with on going expansion and debottlenecking the total capacity is projected to increase by ~58% from the current level
Strong Balance Sheet net cash surplus of Rs.6 billion at standalone level, post Capex of over Rs.7 Billion during the year (9 Months)
‘Right to Manage & Operate’ VFY business of Century Textiles for a period of 15 years. Operations under Grasim commenced from 1st Feb 2018
In Cement, overall sales volume growth of 33% yoy, led by Infra and affordable housing demand
Achieved capacity utilization @ 60% (Q3 exit) at acquired cement assets
Strong Growth in financial services led by NBFC and Asset Management Business

5
Consolidated Revenue up by 78% YoY
Note: Idea Cellular is Consolidated at PAT level
Viscose20%
Chemicals11%
Cement69%
Q3 FY17
Rs. 8,602 Cr
Viscose14%
Chemicals9%
Cement52%
Financial Services
19%
Others6%
Q3 FY18
Rs. 15,291 Cr
6
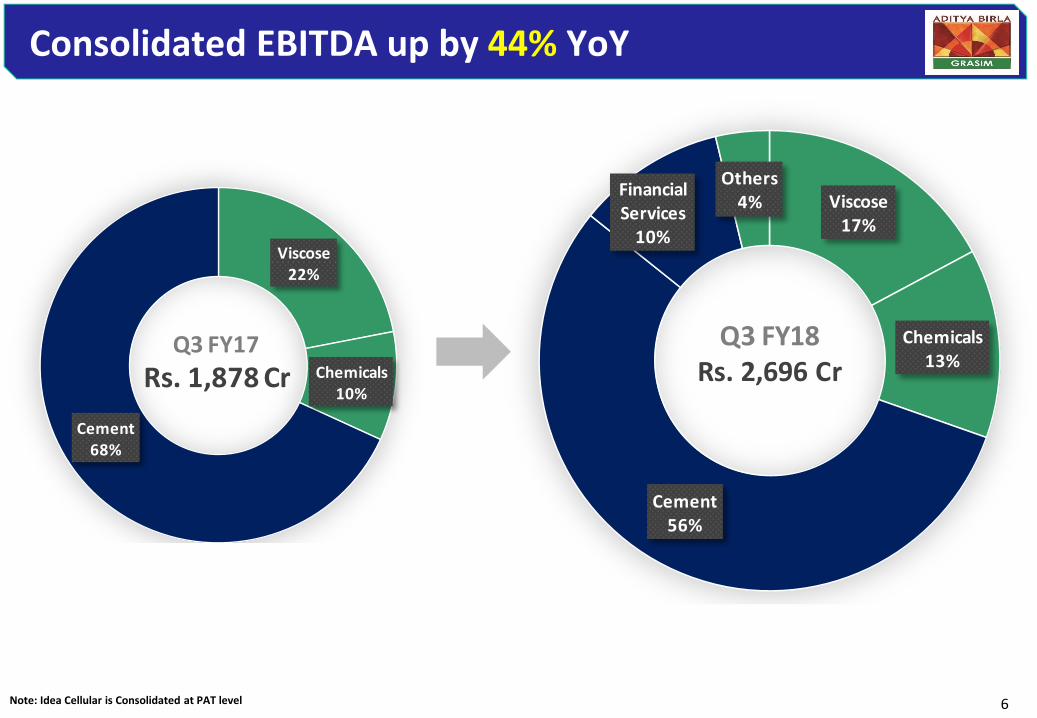
Consolidated EBITDA up by 44% YoY
Viscose22%
Chemicals10%
Cement68%
Q3 FY17
Rs. 1,878 Cr
Viscose17%
Chemicals13%
Cement56%
Financial Services
10%
Others4%
Q3 FY18Rs. 2,696 Cr
Note: Idea Cellular is Consolidated at PAT level
7
HighlightsFinancial
Performance
Business Performance
Content

8
Results Snapshot Q3 FY18
*PAT (Before Minority Share, Share in profit/loss of JVs and Associates and profit attributable to participating policyholders of the life insurance business)Where, Share in profit/(loss) of JVs and Associates: Pulp & Fibre JVs profit Rs.26 Cr (LY: profit Rs.43 Cr) , Idea Cellular loss Rs.359 Cr (LY: loss Rs.18 Cr), Others profit Rs. 16 Cr (LY : profit Rs.2 Cr). Profit attributable to participating policyholders of the life insurance business Rs.21 Cr. Minority Share Rs. 244 Cr (LY: Rs. 236 Cr)
Net Revenue (Rs. Cr.) EBITDA (Rs. Cr.) PAT (Rs. Cr.)
Standalone Financial Performance
Consolidated Financial Performance
75%54% 43%
78% 44% 22%
PAT*
2,526
4,428
Q3 FY17 Q3 FY18
331
474
Q3 FY17 Q3 FY18
598
920
Q3 FY17 Q3 FY18
8,602
15,291
Q3 FY17 Q3 FY18
1,878
2,696
Q3 FY17 Q3 FY18
9251,125
Q3 FY17 Q3 FY18
9
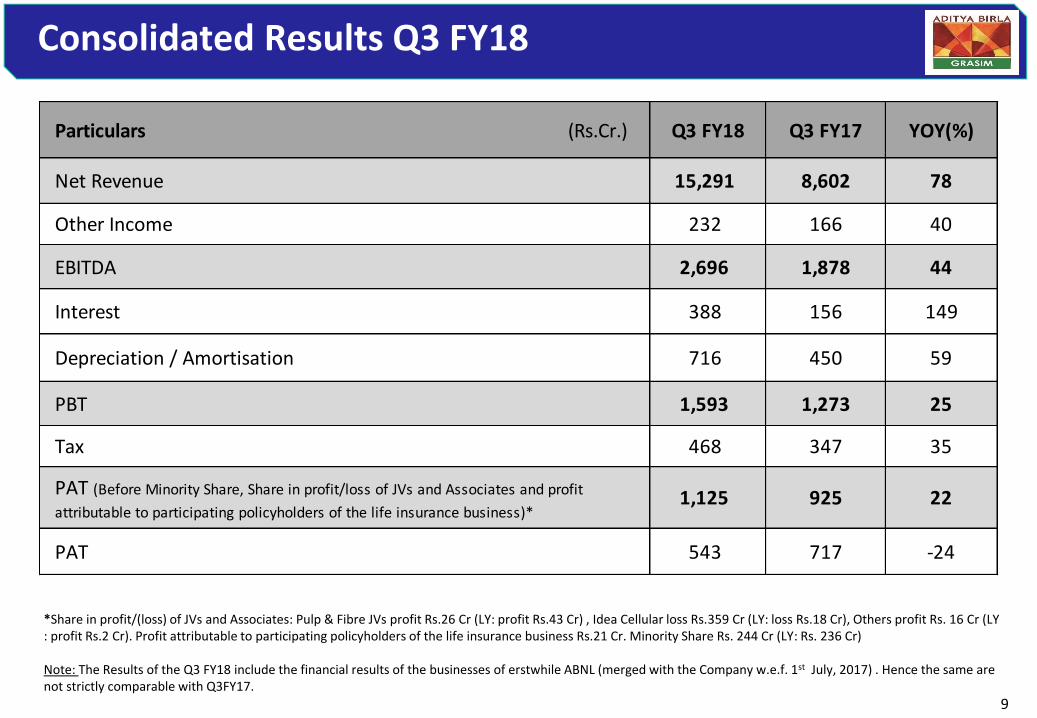
Consolidated Results Q3 FY18
*Share in profit/(loss) of JVs and Associates: Pulp & Fibre JVs profit Rs.26 Cr (LY: profit Rs.43 Cr) , Idea Cellular loss Rs.359 Cr (LY: loss Rs.18 Cr), Others profit Rs. 16 Cr (LY : profit Rs.2 Cr). Profit attributable to participating policyholders of the life insurance business Rs.21 Cr. Minority Share Rs. 244 Cr (LY: Rs. 236 Cr)
Note: The Results of the Q3 FY18 include the financial results of the businesses of erstwhile ABNL (merged with the Company w.e.f. 1st July, 2017) . Hence the same are not strictly comparable with Q3FY17.
Particulars (Rs.Cr.) Q3 FY18 Q3 FY17 YOY(%)
Net Revenue 15,291 8,602 78
Other Income 232 166 40
EBITDA 2,696 1,878 44
Interest 388 156 149
Depreciation / Amortisation 716 450 59
PBT 1,593 1,273 25
Tax 468 347 35
PAT (Before Minority Share, Share in profit/loss of JVs and Associates and profit
attributable to participating policyholders of the life insurance business)*1,125 925 22
PAT 543 717 -24
10
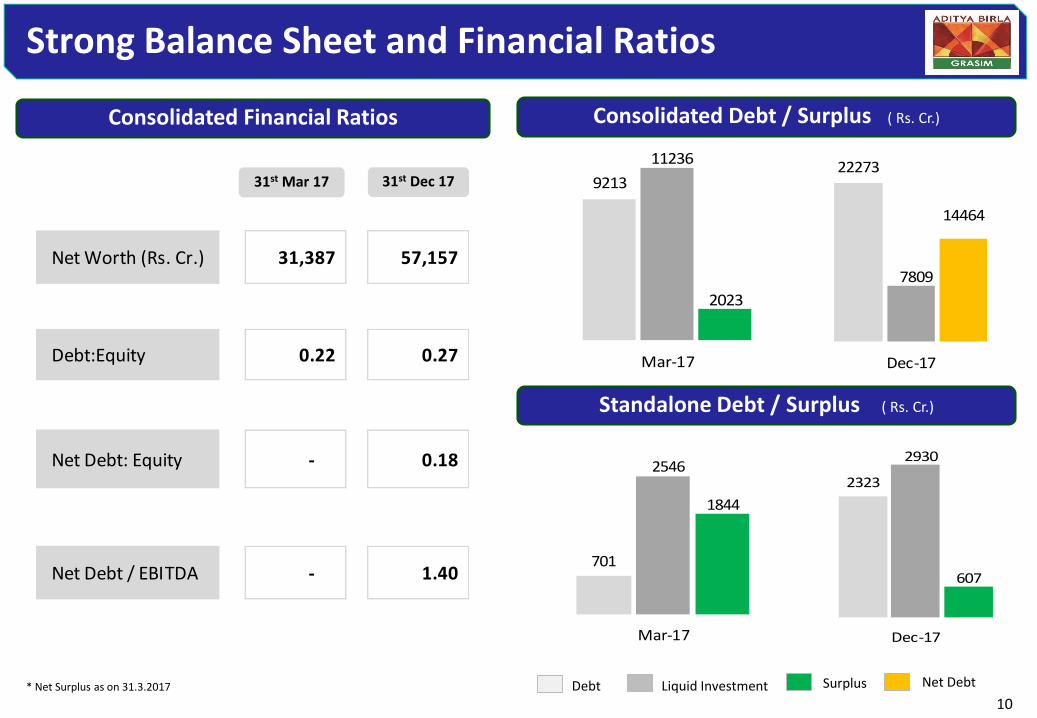
Strong Balance Sheet and Financial Ratios
Consolidated Financial Ratios Consolidated Debt / Surplus ( Rs. Cr.)
Standalone Debt / Surplus ( Rs. Cr.)
701
2546
1844
Mar-17
2323
2930
607
Dec-17
9213
11236
2023
Mar-17
22273
7809
14464
Dec-17
31st Mar 17 31st Dec 17
Debt Liquid Investment Net DebtSurplus* Net Surplus as on 31.3.2017
Net Worth (Rs. Cr.) 31,387 57,157
Debt:Equity 0.22 0.27
Net Debt: Equity - 0.18
Net Debt / EBITDA - 1.40

11
Capex Plan
Capex spent
VSF: Brownfield Expansion (including debottlenecking) 4,325
Normal Capex (Water supply augmentation & usage
reduction, R&D, Environment and Others)881
Chemical: Brownfield Expansion (including debottlenecking) 646
Normal Capex 206
Other Manufacturing Business (including Century Rayon Rs.62 Cr.) 382
STANDALONE CAPEX (A) 6,440 1,334 5,106 758
Cement: Capacity Expansion 4,631
Modernization, Plant Infrastructure, Environment,
Upgradation, logistic infra etc. 3,311
CEMENT CAPEX(B) 7,942 2,315 5,627 1,444
TOTAL CAPEX (A) + (B) 14,382 3,649 10,733 2,202
YTD Dec’17Particulars (Rs. Cr.)
Capex
(Net of CWIP)
Cash Outflow
FY18FY19
Onwards
12
Our Top Priorities
Maintain
Leadership position
Growing Consumer Facing High Growth Businesses
Cost focus and
Asset Sweating
Robust Risk and
Governance Framework

13
HighlightsFinancial
Performance
Business Performance
Content
14
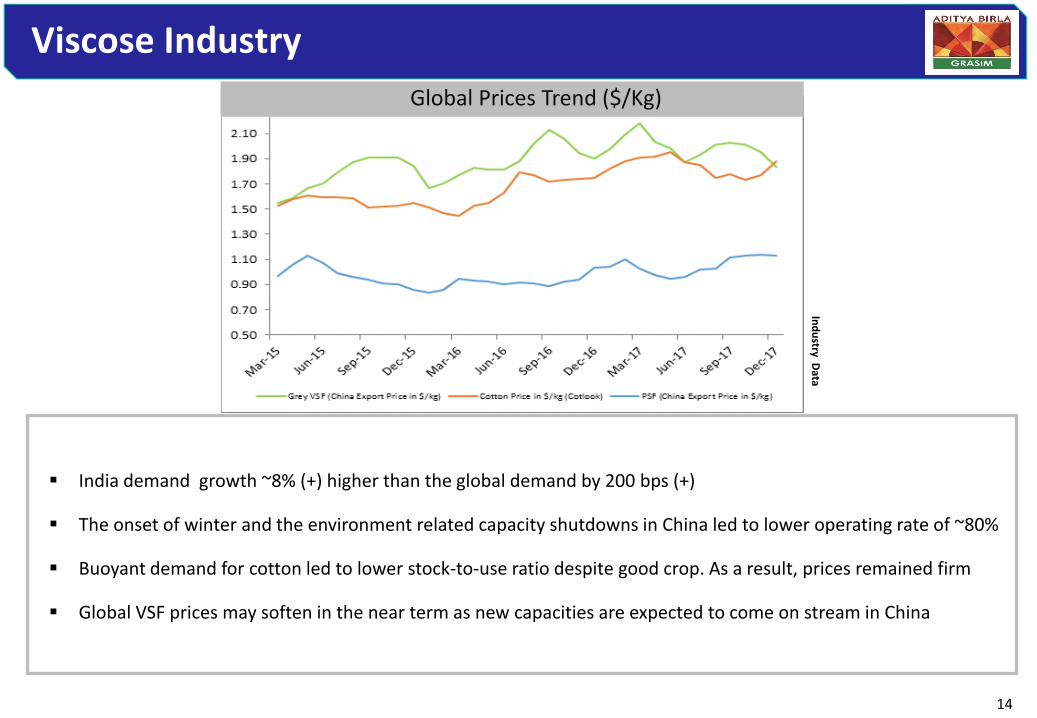
Viscose Industry
Global Prices Trend ($/Kg)
India demand growth ~8% (+) higher than the global demand by 200 bps (+)
The onset of winter and the environment related capacity shutdowns in China led to lower operating rate of ~80%
Buoyant demand for cotton led to lower stock-to-use ratio despite good crop. As a result, prices remained firm
Global VSF prices may soften in the near term as new capacities are expected to come on stream in China
Ind
ustry D
ata

15
Business Performance: Viscose
VSF sales volumes up by 9% yoy led by strong domestic demand (Share of
Domestic Sales in the total sales increased from 63% in Q3 FY 17 to 77%
in Q3 FY18)
Product mix improvement in favour of Specialty (Q3 FY18 34%)
Significant increase in the input cost (over Rs.100 Cr.) primarily led by
Caustic, Sulphur and Energy prices, largely offset by higher realization,
higher volumes and better geographic mix
Sales Volume (KT)
* Q3 FY18 Sales Volumes excludes VFY sale (5KT)
1,762
2,186
Q3FY17 Q3FY18
122133
Q3FY17 Q3FY18*
402 462
Q3FY17 Q3FY18
Revenue (Rs. Cr.) EBITDA (Rs. Cr.)
109
135 141
9MFY16 9MFY17 9MFY18
Speciality Sales Volume (KT)
9% 24% 15%

16
LIVA driving domestic volumes
8.56
12.63
17.62
AW16 SS17 AW17
LIVA Tagging (Mn.)
2035
19444
37420
AW16 SS17 AW17
LIVA Outlets (Nos .)
223,526
251,118 277,110
9MFY16 9MFY17 9MFY18
Domestic Sales Volume (MT)
Continued focus on expanding usage and application of VSF in domestic textile market to bolster the VSF demand in the textile value chain:
• The no. of tagged garments doubled YoY in AW17 to 17.6 Mn
• No. of LIVA Outlets multiply 18x YoY from 2035 in AW16 to 37,420 in AW17
LIVA Tagging (Mn.)
LIVA Outlets (nos.)
Domestic Sales Volume (MT)
17
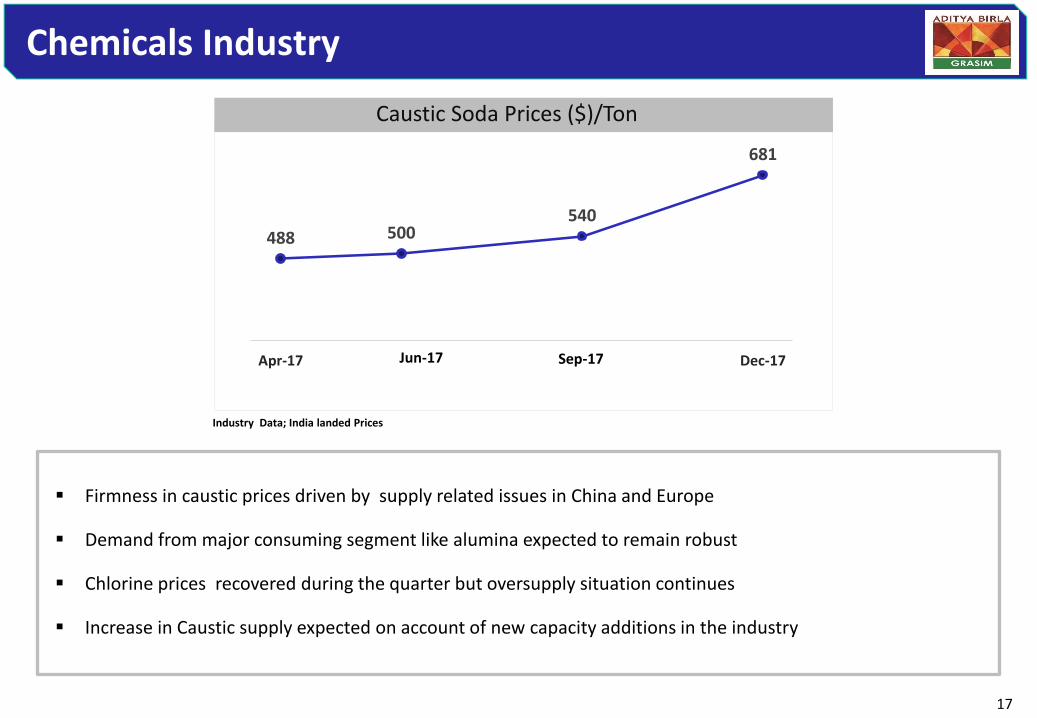
Chemicals Industry
Firmness in caustic prices driven by supply related issues in China and Europe
Demand from major consuming segment like alumina expected to remain robust
Chlorine prices recovered during the quarter but oversupply situation continues
Increase in Caustic supply expected on account of new capacity additions in the industry
Industry Data; India landed Prices
488 500540
681
Apr-17 Dec-17Jun-17 Sep-17
Caustic Soda Prices ($)/Ton
18
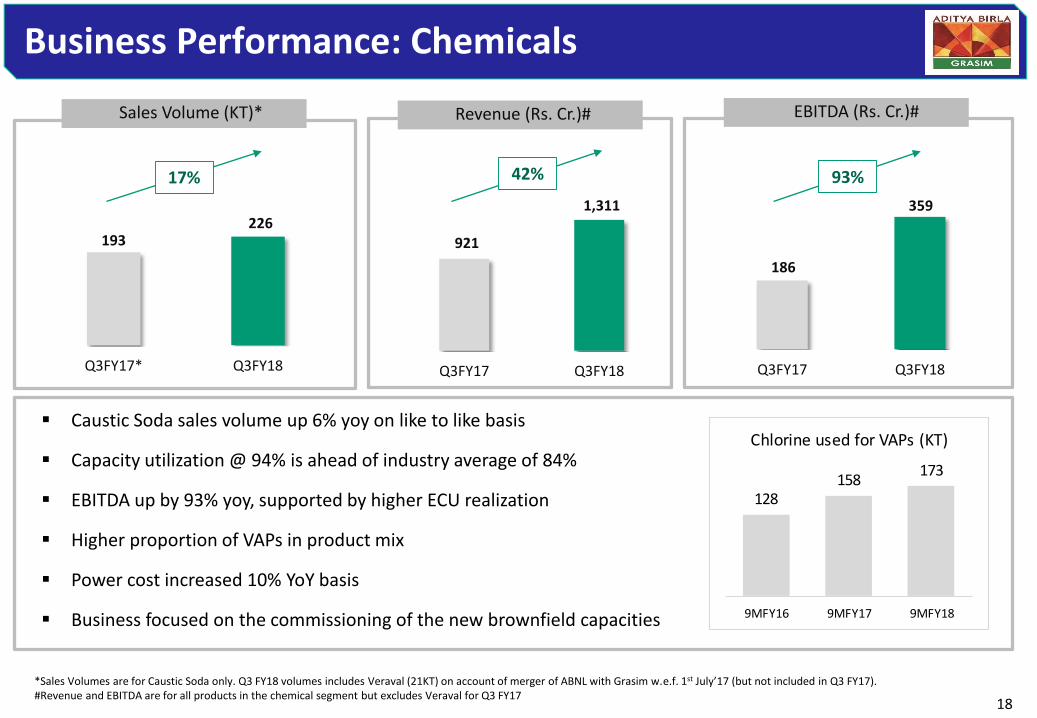
Business Performance: Chemicals
Caustic Soda sales volume up 6% yoy on like to like basis
Capacity utilization @ 94% is ahead of industry average of 84%
EBITDA up by 93% yoy, supported by higher ECU realization
Higher proportion of VAPs in product mix
Power cost increased 10% YoY basis
Business focused on the commissioning of the new brownfield capacities
921
1,311
Q3FY17 Q3FY18
193226
Q3FY17* Q3FY18
186
359
Q3FY17 Q3FY18
Sales Volume (KT)* Revenue (Rs. Cr.)# EBITDA (Rs. Cr.)#
*Sales Volumes are for Caustic Soda only. Q3 FY18 volumes includes Veraval (21KT) on account of merger of ABNL with Grasim w.e.f. 1st July’17 (but not included in Q3 FY17). #Revenue and EBITDA are for all products in the chemical segment but excludes Veraval for Q3 FY17
128158
173
9MFY16 9MFY17 9MFY18
Chlorine used for VAPs (KT)
17% 42% 93%
19
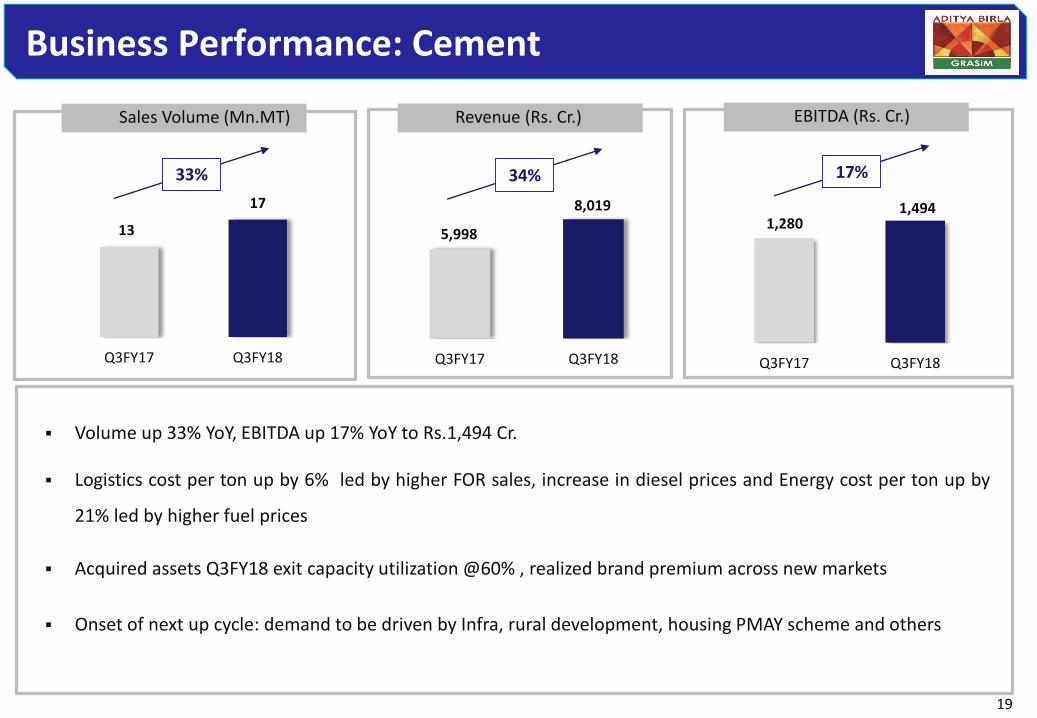
Business Performance: Cement
Volume up 33% YoY, EBITDA up 17% YoY to Rs.1,494 Cr.
Logistics cost per ton up by 6% led by higher FOR sales, increase in diesel prices and Energy cost per ton up by
21% led by higher fuel prices
Acquired assets Q3FY18 exit capacity utilization @60% , realized brand premium across new markets
Onset of next up cycle: demand to be driven by Infra, rural development, housing PMAY scheme and others
13
17
Q3FY17 Q3FY18
5,998
8,019
Q3FY17 Q3FY18
1,280 1,494
Q3FY17 Q3FY18
Sales Volume (Mn.MT) Revenue (Rs. Cr.) EBITDA (Rs. Cr.)
33% 34% 17%

20
Business Performance: Financial Services
Revenue Rs. 3,325 Cr. and EBT Rs. 409 Cr. as per IGAAP (Revenue Rs.2,850 Cr. and EBT Rs.267 Cr. as per IndASincluded in Consolidated Results)
Highest ever lending book in NBFC (Rs.39770 Cr.) and Housing Finance (Rs.6752 Cr.)
Highest ever domestic AAUM market share at 10.8% and highest ever equity market share at 9.2%. 12 funds arenow over a billion dollar each
Life Insurance witnessed an improvement in quality of business and product mix (share of pure protectiondoubled from 2% to 5% yoy)
Health Insurance has created significant scale across all channels in 1 year of its launch (Agents-13,299, Tied upwith 3,500 hospitals across 509 cities)
33,047
46,522
Q3FY17 Q3FY18
229,007
299,893
Q3FY17 Q3FY18
31%
* Includes Housing Finance. ** Includes AUM of Life Insurance, Health Insurance, Private Equity and quarterly AAUM of Asset Management Business
Lending Book (Rs. Cr.)* AUM (Rs. Cr.)**
41%

21
Business Performance- Other Businesses
Fertilizers Improvement in urea sales volume led by better demand conditions
Textile
Insulator Industry witnessed a de-growth led by weak demand for porcelain insulator
Revenue (Rs. Cr.) EBITDA (Rs. Cr.)
Visible improvement in the sales volume of Linen yarn and fabric sequentially
643 72
344 12
121 12
22
THANK YOU

23
Content
ANNEXURES

24
Consolidated Financial Performance
2017-18 2016-17 2017-18 2016-17
Net Sales & Op. Income 15,291 8,602 78 38,783 26,073 49
Other Income 232 166 40 758 678 12
Finance Cost Relating to NBFC/NHFC 746 0 - 1,487 0 -
EBITDA 2,696 1,878 44 7,920 6,190 28
EBITDA Margin (%) 17.4% 21.4% - 20.0% 23.1% -
Finance Cost 388 156 149 967 526 84
Depreciation 716 450 59 1,954 1,336 46
Share in Profit of JVs & Associates (317) 27 - (578) 131 -
Earnings before Tax 1,276 1,300 (2) 4,302 4,460 (4)
Total Tax 468 347 35 1,459 1,278 14
Less:Profit/(Loss) attributable to participating
policyholders of Life Insurance Business21 0 - (9) 0 -
PAT 787 952 (17) 2,834 3,182 (11)
Less: Minority Interest 244 236 3 876 789 11
PAT (After Minority Interest & EI) 543 717 (24) 1,958 2,393 (18)
Other Comprehensive Income (After MI) 354 (27) - 404 542 (25)
Total Comprehensive Income (After MI) 897 689 30 2,363 2,934 (19)
EPS 8.25 15.33 (24) 33.22 51.19 (18)
ParticularsQuarter 3
% Change % ChangeYTD Dec'17

25
Standalone Financial Performance
2017-18 2016-17 2017-18 2016-17
Net Sales & Op. Income 4,428 2,526 75 11,206 7,470 50
Other Income 46 55 (16) 381 443 (14)
EBITDA 920 598 54 2,595 2,073 25
EBITDA Margin (%) 20.6% 23.2% - 22.4% 26.2% -
Finance Cost 30 11 177 80 49 61
Depreciation 166 111 50 442 333 33
Earnings before Tax
(Before exceptional item)725 477 52 2,073 1,691 23
Exceptional item 0 0 - (54) 0 -
Earnings before Tax 725 477 52 2,019 1,691 19
Tax Expense 251 145 72 623 446 40
PAT 474 331 43 1,396 1,245 12
Other Comprehensive Income (after tax) 431 (56) - 396 560 (29)
Total Comprehensive Income (after tax) 905 275 229 1,791 1,804 (1)
EPS 7.20 7.09 43 23.67 26.63 12
Quarter 3Particulars
%
Change
%
Change
YTD Dec'17
26
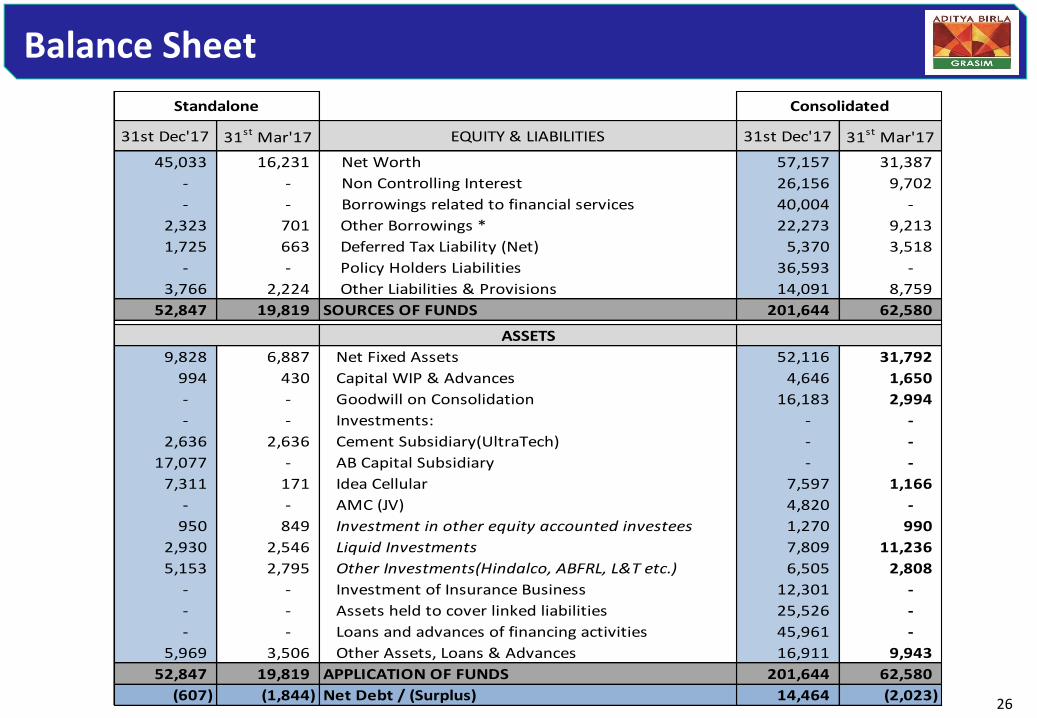
Balance Sheet
31st Dec'17 31st Mar'17 EQUITY & LIABILITIES 31st Dec'17 31st Mar'17
45,033 16,231 Net Worth 57,157 31,387
- - Non Controlling Interest 26,156 9,702
- - Borrowings related to financial services 40,004 -
2,323 701 Other Borrowings * 22,273 9,213
1,725 663 Deferred Tax Liability (Net) 5,370 3,518
- - Policy Holders Liabilities 36,593 -
3,766 2,224 Other Liabilities & Provisions 14,091 8,759
52,847 19,819 SOURCES OF FUNDS 201,644 62,580
ASSETS
9,828 6,887 Net Fixed Assets 52,116 31,792
994 430 Capital WIP & Advances 4,646 1,650
- - Goodwill on Consolidation 16,183 2,994
- - Investments: - -
2,636 2,636 Cement Subsidiary(UltraTech) - -
17,077 - AB Capital Subsidiary - -
7,311 171 Idea Cellular 7,597 1,166
- - AMC (JV) 4,820 -
950 849 Investment in other equity accounted investees 1,270 990
2,930 2,546 Liquid Investments 7,809 11,236
5,153 2,795 Other Investments(Hindalco, ABFRL, L&T etc.) 6,505 2,808
- - Investment of Insurance Business 12,301 -
- - Assets held to cover linked liabilities 25,526 -
- - Loans and advances of financing activities 45,961 -
5,969 3,506 Other Assets, Loans & Advances 16,911 9,943
52,847 19,819 APPLICATION OF FUNDS 201,644 62,580
(607) (1,844) Net Debt / (Surplus) 14,464 (2,023)
Standalone Consolidated
27
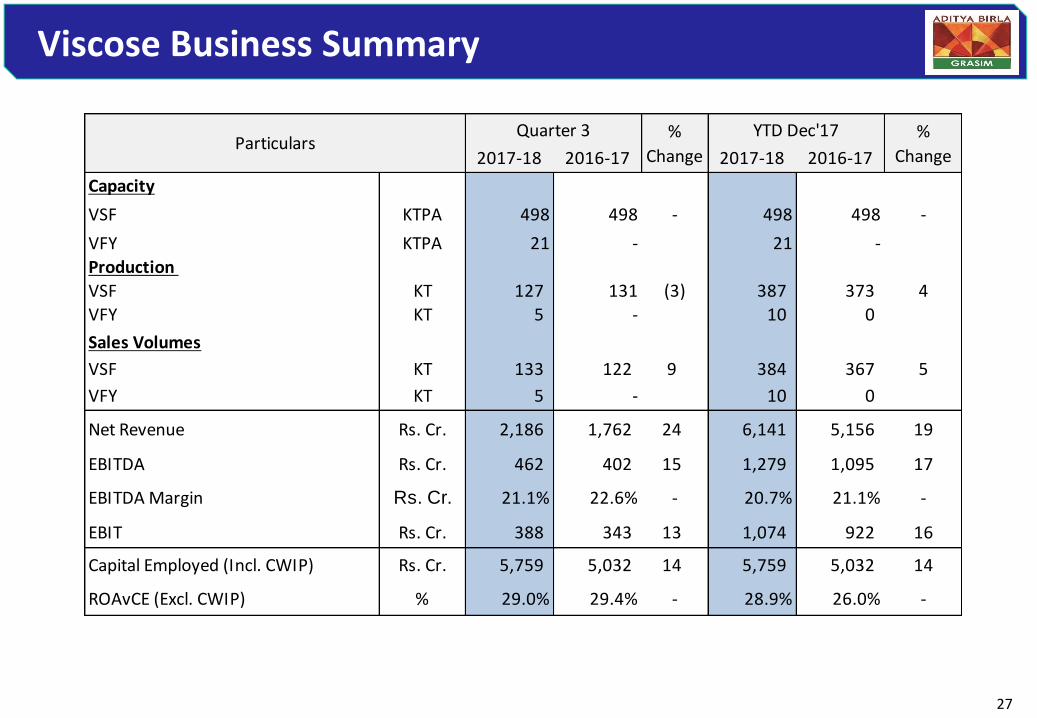
Viscose Business Summary
2017-18 2016-17 2017-18 2016-17
Capacity
VSF KTPA 498 498 - 498 498 -
VFY KTPA 21 - 21 -
Production
VSF KT 127 131 (3) 387 373 4
VFY KT 5 - 10 0
Sales Volumes
VSF KT 133 122 9 384 367 5
VFY KT 5 - 10 0
Net Revenue Rs. Cr. 2,186 1,762 24 6,141 5,156 19
EBITDA Rs. Cr. 462 402 15 1,279 1,095 17
EBITDA Margin Rs. Cr. 21.1% 22.6% - 20.7% 21.1% -
EBIT Rs. Cr. 388 343 13 1,074 922 16
Capital Employed (Incl. CWIP) Rs. Cr. 5,759 5,032 14 5,759 5,032 14
ROAvCE (Excl. CWIP) % 29.0% 29.4% - 28.9% 26.0% -
%
ChangeParticulars
Quarter 3 %
Change
YTD Dec'17

28
Chemical Business Summary
2017-18 2016-17 2017-18 2016-17
Capacity* KTPA 938 840 12 938 840 12
Production* KT 228 191 20 666 583 14
Sales Volumes* KT 226 193 17 664 590 12
Net Revenue Rs. Cr. 1,311 921 42 3,562 2,745 30
EBITDA Rs. Cr. 359 186 93 889 631 41
EBITDA Margin % 27.2% 20.1% - 24.9% 22.9% -
EBIT Rs. Cr. 306 137 124 734 480
Capital Employed (Incl. CWIP) Rs. Cr. 4,141 3,722 11 4,141 3,722 11
ROAvCE (Excl. CWIP) % 34.9% 15.4% - 27.0% 18.0% -
ParticularsQuarter 3 %
Change
YTD Dec'17 %
Change
*Sales Volumes are for Caustic Soda only. Q2 and Q3 FY18 volumes includes Veraval (21KT) on account of merger of ABNL with Grasim w.e.f. 1st July’17 (but not included in Q3 FY17). Revenue and EBITDA are for all products in the chemical segment.
29
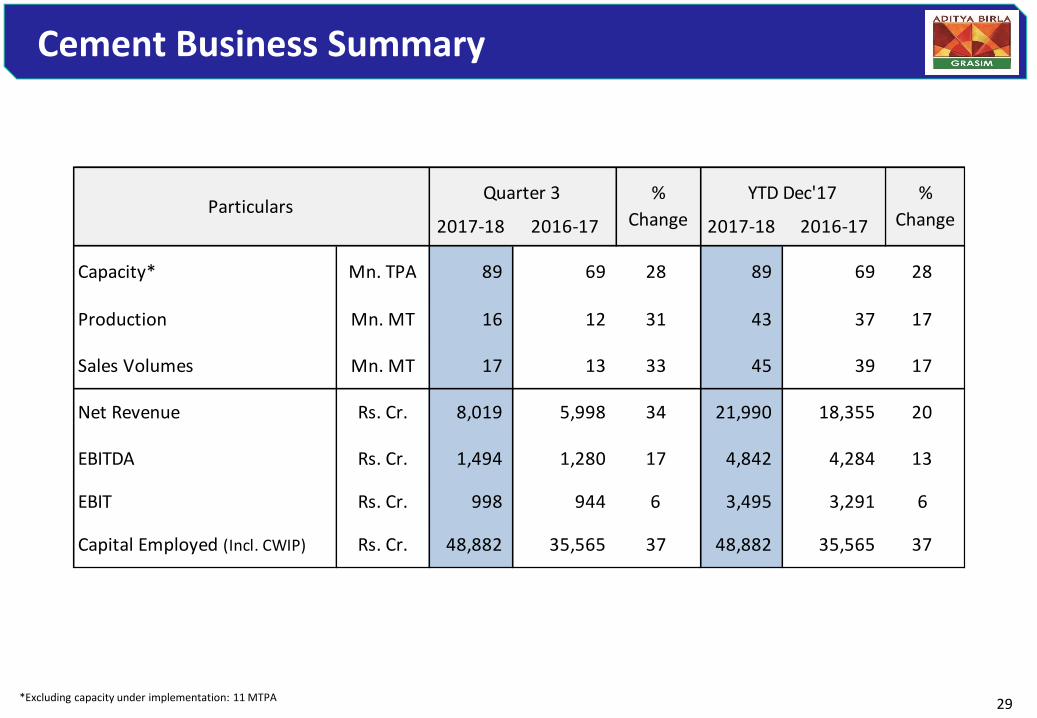
Cement Business Summary
2017-18 2016-17 2017-18 2016-17
Capacity* Mn. TPA 89 69 28 89 69 28
Production Mn. MT 16 12 31 43 37 17
Sales Volumes Mn. MT 17 13 33 45 39 17
Net Revenue Rs. Cr. 8,019 5,998 34 21,990 18,355 20
EBITDA Rs. Cr. 1,494 1,280 17 4,842 4,284 13
EBIT Rs. Cr. 998 944 6 3,495 3,291 6
Capital Employed (Incl. CWIP) Rs. Cr. 48,882 35,565 37 48,882 35,565 37
%
Change
%
Change
Quarter 3 YTD Dec'17Particulars
*Excluding capacity under implementation: 11 MTPA

30
Business and Financial Performance- Telecom
In Q3FY18, company witnessed net customer add of 7.5mn qoq on VLR driven by success in MNP from existing
operator, launch of mass market unlimited voice bundled data plans and sustained broad based investing.
Its data usage per data subscriber has zoomed from 703MB/month (Q3FY17) to 4742MB (Q3FY18)
Idea is in the process of raising up to Rs.67.5 Bn to strengthen combined entity’s balance sheet
- Of which, Rs. 32.5 Bn has already been raised through preferential allotment to promoters
VLR Subscribers (Mn) Data Volume (Mn MB)
108,843
571,301
Q3FY17 Q3FY18
8,663
6,510
Q3FY17 Q3FY18
Revenue (Rs. Cr)
192.10
203.00
Q3FY17 Q3FY18
6% 425%

31
Grasim: Group Structure
VSF - 498K TPA VFY - 21K TPAPulp - 70K TPA
Overseas
Pulp & VSF JVs
AV Terrace Bay (40.0%)*
Domsjo 255K TPA (33.3%)*
AV Group NB Inc. 320K TPA (45.0%)*
UTCL (60.22%)*
Subsidiary
VSF JVBirla Jingwei
73K TPA (26.6%)*
Others
Domestic
Overseas4 Mn. TPA
(UAE, Bangladesh, Sri Lanka)
18 Integrated plants &
1 clinkerisation unit
25 Split Grinding Units
>100 RMC Plants
White Cement & Putty
1.4 Mn. TPA
Nagda162K TPA
Kharach128K TPA
Harihar87K TPA
Vilayat120K TPA
Nagda270K TPA
Vilayat219K TPA
Epoxy51K TPA
Grey Cement
89 Mn. TPA
ChemicalCaustic
938K TPA
Veraval (VFY)21K TPA
Renukoot129K TPA
Rehla110K TPA
Ganjam59K TPA
Karwar59K TPA
Veraval91K TPA
ABCL (56.0)*
Subsidiary
NBFC
(100%)*
Broking
(75%)*
Housing Finance
(100%)*
Insurance Advisory
(50.01%)*
Life Insurance
(51%)*
Private Equity
(100%)*
AMC
(51%)*
Online Money Management
(93.7%)*
Health Insurance
(51%)* ARC
(100%)*
Wellness
(51%)*
Fertilizers
Insulators
Textiles
Idea Cellular
(27.9%)*
ABFRL
( 11.3%)*
* Equity ownership
Solar
(51.0%)*Harihar (Pulp)
70K TPA
32
Certain statements in this report may be “forward looking statements” within the meaning of applicable securities laws andregulations. Actual results could differ materially from those expressed or implied. Important factors that could make adifference to the company’s operations include global and Indian demand supply conditions, finished goods prices, feed stockavailability and prices, cyclical demand and pricing in the company’s principal markets, changes in Government regulations,tax regimes, economic developments within India and the countries within which the company conducts business and otherfactors such as litigation and labour negotiations. The company assume no responsibility to publicly amend, modify or reviseany forward looking statement, on the basis of any subsequent development, information or events, or otherwise.
Forward Looking & Cautionary Statement
Country and Year of Incorporation: India, 1947
Listing: India (BSE/NSE) , GDR (Luxembourg)
Bloomberg Ticker: GRASIM IB EQUITY , GRASIM IS EQUITY, GRAS LX (GDR)
Business Description: Viscose, Chemicals, Cement and Financial Services
Market Cap (12th Feb) : Rs. 74,440 Cr. (USD 11.6 Bn)
33
Grasim Industries Limited
Quarterly Performance Review Q3 FY 18, 14th February 2018


