India’s Merchandise Trade scenario · October 2017 as against 125.6 in September 2017 as against...
24
Transcript of India’s Merchandise Trade scenario · October 2017 as against 125.6 in September 2017 as against...


EEPC India Page 1
India’s Merchandise Trade scenario
� India's merchandise exports returned to growth path once again in November 2017
after a marginal drop in October 2017. Exports during November 2017 exhibited a
robust 30.55 percent growth in dollar terms vis-à-vis November 2016. Exports during
November 2017 were at US$ 26,195.76 million as compared to US$ 20,066.26 million
during November 2016. After 14 straight months' of year-on-year growth, India's
merchandise export declined by 1.12 percent in October 2017. In Rupee terms, the
growth was seen at 25.21 percent during November 2017.
� Major commodity groups showing positive year-on-year growth in Exports during
November 2017 were Engineering Goods (43.76%), Petroleum Products (47.68%), Gems
& Jewellery (32.69%), Organic & Inorganic Chemicals (54.28%), and Drugs &
Pharmaceuticals (13.39%).
� Cumulative value of exports for the period April-November 2017-18 was US$ 196,482.31
million as against US$ 175,410.66 million, registering a positive growth of 12.01 per cent
in Dollar term.
� Merchandise Imports also surged by a much higher 19.61 percent year-on-year during
November 2017 as against 7.60 percent in October 2017. Imports went up to US$
40,024.96 million in November 2017 from US$ 33,461.87 million during the same month
last year.
� Major commodity groups of import showing high growth in November 2017 over the
corresponding month of last year were Petroleum, Crude & products (39.14%),
Electronic goods (24.97%), Pearls, precious & Semi-precious stones (85.80%),
Machinery, electrical & non-electrical (23.24%) and Coal, Coke & Briquettes, etc.
(51.80%).
� Cumulative value of imports for the period April-November 2017-18 was US$
296,459.17 million as against US$ 243,296.85 million during the same period last fiscal,
registering 21.85 per cent growth in Dollar terms.
� Trade deficit in November 2017 increased by 3.24 percent to US$ 13,829.2 million from
US$ 13,395.61 million in November 2016. Cumulative trade deficit during April -
November 2017-18 surged by 47.27 percent to US$ 99,976.86 million from US$
67,886.19 million during the same period last fiscal.
India's Engineering Exports scenario
� Indian engineering exports maintained the growth run for the 16th straight month to
November 2017 and this time, the growth accelerated substantially by 43.68 percent
year-on-year just in-line with the broader merchandise exports.
� Overseas shipment of India's engineering products rose to US$ 6,956.22 million during
November 2017 from US$ 4,841.37 million in the same month last year.
� Cumulative growth of India's engineering export during April-November 2017-18 was
recorded at 22.35 percent on a year-on-year basis which was somewhat higher than the

EEPC India Page 2
cumulative growth registered during April-October 2017-18. Engineering exports during
April - November 2017-18 was recorded at US$ 48,951.2 million as against US$
40,008.04 million during the same period last fiscal.
� The share of engineering exports in India's total merchandise exports increased to 26.6
percent during November 2017 from 24.8 percent in October 2017 and 24.9 percent in
September 2017.
� Out of 33 engineering panels, 29 panels recorded growth in exports in November 2017
over the same month last year while the remaining 4 panels conceded decline during
the month of November 2017.
� During November 2017, out of top 25 countries 22 countries recorded year-on-year
growth in engineering exports from India over the same month last year.
1. Trend in overall merchandise trade
India's merchandise exports returned to growth path once again in November 2017 after a
marginal drop in October 2017. Exports during November 2017 exhibited a robust 30.55
percent growth in dollar terms vis-à-vis November 2016. Export during November 2017 was at
US$ 26,195.76 million as compared to US$ 20,066.26 million during November 2016. After 14
straight months' of year-on-year growth, India's merchandise export declined by 1.12 percent
in October 2017. In Rupee terms, the growth was seen at 25.21 percent during November 2017.
Major commodity groups showing positive year-on-year growth in Exports during November
2017 were Engineering Goods (43.76%), Petroleum Products (47.68%), Gems & Jewellery
(32.69%), Organic & Inorganic Chemicals (54.28%), and Drugs & Pharmaceuticals (13.39%).
Non-petroleum and Non Gems & Jewellery exports in November 2017 were valued at US$
19,247.56 million as against US$ 15,104.42 million in November 2016, registering an increase of
27.43 percent. Cumulative exports of Non-petroleum and Non Gems and Jewellery segment
during April -November 2017-18 were at US$ 143,528.58 million as against US$ 126,660.74
million during the corresponding period in 2016-17 with an increase of 13.32 percent.
Merchandise Imports also surged by a much higher 19.61 percent year-on-year during
November 2017 as against 7.60 percent in October 2017. Imports went up to US$ 40,024.96
million in November 2017 from US$ 33,461.87 million during the same month last year.
Cumulative value of imports for the period April-November 2017-18 was US$ 296,459.17
million as against US$ 243,296.85 million during the same period last fiscal, registering 21.85
per cent growth in Dollar terms.
Major commodity groups of import showing high growth in November 2017 over the
corresponding month of last year were Petroleum, Crude & products (39.14%), Electronic goods
(24.97%), Pearls, precious & Semi-precious stones (85.80%), Machinery, electrical & non-
electrical (23.24%) and Coal, Coke & Briquettes, etc. (51.80%).
EEPC India Page 3
Oil import during November 2017 at US$ 9,550.97 million was 39.14 percent higher than that of
in November 2016 at US$ 6,864.25 million. Oil imports during April-November 2017-18 were
valued at US$ 65,802.97 million, which was 22.65 per cent higher than the oil imports of US$
53,652.71 million recorded during the corresponding period of the last fiscal. Global Brent
prices (US$/bbl) have increased by 34.73 percent year-on-year in November 2017 as per World
Bank commodity price data (The pink sheet).
Non-oil imports during November 2017 were estimated at US$ 30,473.99 million which was
14.57 per cent higher than non-oil imports of US$ 26,597.62 million in November 2016. Non-oil
imports during April-November 2017-18 were valued at US$ 230,656.20 million which was
21.63 per cent higher than the level of such imports valued at US$ 189,644.14 million in April-
November 2016-17.
Trade deficit in November 2017 increased by 3.24 percent to US$ 13,829.2 million from US$
13,395.61 million in November 2016. Cumulative trade deficit during April - November 2017-18
surged by 47.27 percent to US$ 99976.86 million from US$ 67,886.19 million during the same
period last fiscal.
2. Engineering exports
Indian engineering exports maintained the growth run for the 16th straight month to
November 2017 and this time, the growth accelerated substantially by 43.68 percent year-on-
year just in-line with the broader merchandise exports.
Overseas shipment of India's engineering products rose to US$ 6,956.22 million during
November 2017 from US$ 4,841.37 million in the same month last year.
Cumulative growth of India's engineering export during April-November 2017-18 was recorded
at 22.35 percent on a year-on-year basis which was somewhat higher than the cumulative
growth registered during April-October 2017-18. Engineering exports during April - November
2017-18 was recorded at US$ 48,951.2 million as against US$ 40,008.04 million during the same
period last fiscal.
The share of engineering exports in India's total merchandise exports increased to 26.6 percent
during November 2017 from 24.8 percent in October 2017 and 24.9 percent in September
2017.
Out of 33 engineering panels, 29 panels recorded growth in exports in November 2017 over the
same month last year while the remaining 4 panels conceded decline during the month of
November 2017.
During November 2017, out of top 25 countries 22 countries recorded year-on-year growth in
engineering exports from India over the same month last year.

EEPC India Page 4
The monthly engineering figures for fiscal 2017-18 vis-à-vis 2016-17 is depicted below as per
the latest availability of figure:
Table1: Engineering Exports
(US$ Million)
Months 2016-17 2017-18 Growth (%)
Apr 4744.32 5920.35 24.79
May 5636.17 6075.48 7.79
Jun 5066.99 5719.49 12.88
Apr - Jun 15447.48 17715.32 14.68
Jul 4794.12 5626.09 17.35
Aug 4873.71 5804.32 19.09
Sep 4917.78 7121.44 44.81
Jul - Sep 14585.61 18551.85 27.19
Oct 5133.58 5727.81 11.58
Nov 4841.37 6956.22 43.68
Apr - Nov 40008.04 48951.2 22.35
(Source: Department of Commerce, Government of India)
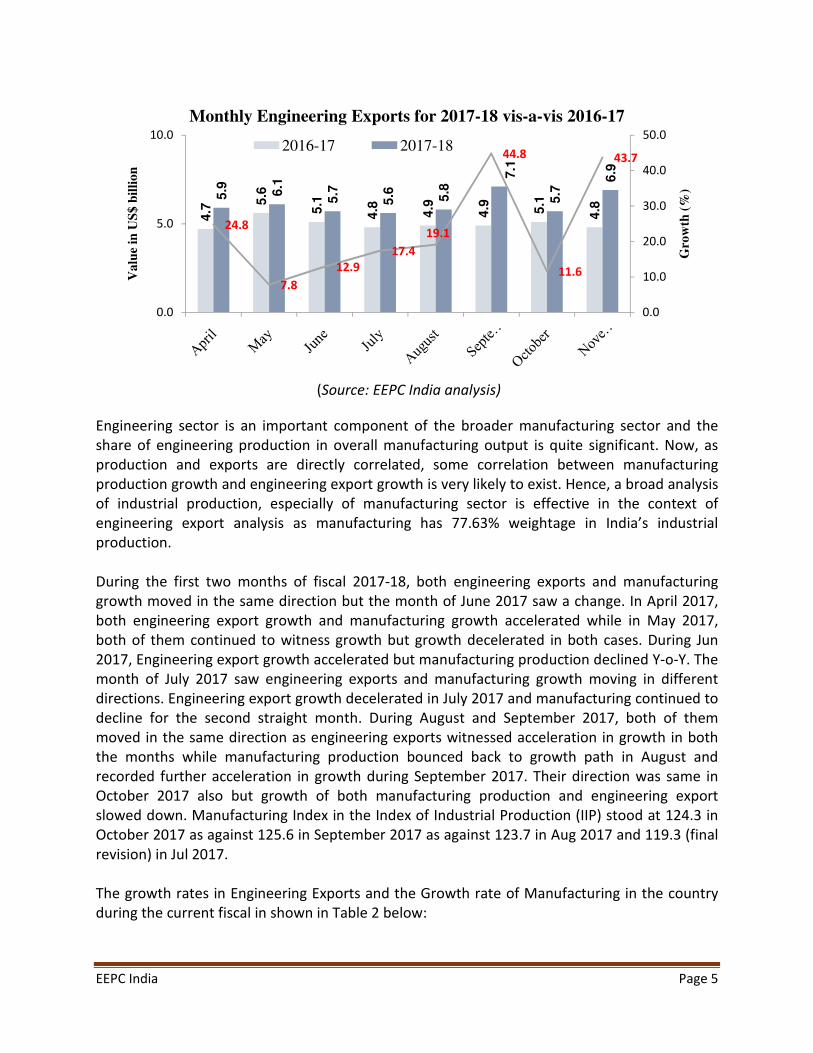
Figure 1 below depicts the monthly trend in engineering exports for 2016-17 and 2017-18
Figure1: Trend in Monthly Engineering Exports (In US$ Million)
EEPC India Page 5
(Source: EEPC India analysis)
Engineering sector is an important component of the broader manufacturing sector and the
share of engineering production in overall manufacturing output is quite significant. Now, as
production and exports are directly correlated, some correlation between manufacturing
production growth and engineering export growth is very likely to exist. Hence, a broad analysis
of industrial production, especially of manufacturing sector is effective in the context of
engineering export analysis as manufacturing has 77.63% weightage in India’s industrial
production.
During the first two months of fiscal 2017-18, both engineering exports and manufacturing
growth moved in the same direction but the month of June 2017 saw a change. In April 2017,
both engineering export growth and manufacturing growth accelerated while in May 2017,
both of them continued to witness growth but growth decelerated in both cases. During Jun
2017, Engineering export growth accelerated but manufacturing production declined Y-o-Y. The
month of July 2017 saw engineering exports and manufacturing growth moving in different
directions. Engineering export growth decelerated in July 2017 and manufacturing continued to
decline for the second straight month. During August and September 2017, both of them
moved in the same direction as engineering exports witnessed acceleration in growth in both
the months while manufacturing production bounced back to growth path in August and
recorded further acceleration in growth during September 2017. Their direction was same in
October 2017 also but growth of both manufacturing production and engineering export
slowed down. Manufacturing Index in the Index of Industrial Production (IIP) stood at 124.3 in
October 2017 as against 125.6 in September 2017 as against 123.7 in Aug 2017 and 119.3 (final
revision) in Jul 2017.
The growth rates in Engineering Exports and the Growth rate of Manufacturing in the country
during the current fiscal in shown in Table 2 below:
4.7
5.6
5.1
4.8
4.9
4.9 5.1
4.8
5.9 6.1
5.7
5.6 5.8
7.1
5.7
6.9
24.8
7.8
12.9
17.4
19.1
44.8
11.6
43.7
0.0
10.0
20.0
30.0
40.0
50.0
0.0
5.0
10.0
Gro
wth
(%
)
Va
lue
in U
S$
bil
lio
nMonthly Engineering Exports for 2017-18 vis-a-vis 2016-17
2016-17 2017-18

EEPC India Page 6
Table 2: Engineering Exports Growth vis-à-vis Manufacturing Growth (2017-18)
Months/ Year Engg Exports Growth (%) Manufacturing Growth (%)
April - March 2016-17 11.33 4.9
April 2017 24.79 2.9
May 2017 7.79 2.6
June 2017 12.88 -0.7
Apr - Jun 2017-18 14.68 1.6
July 2017 17.35 -0.1
August 2017 19.09 3.1
September 2017 44.81 3.8
Jul - Sep 2017 27.19 2.3
October 2017 11.58 2.5
November 2017 43.68 N A
(Source: Department of Commerce and CSO)
An analysis of the engineering export and manufacturing growth data for fiscal 2016-17 also
established some correlation between this two. Continuous downfall in Indian engineering
exports has been arrested in May 2016 after 8 months and growth continued in June 2016.
During May and June 2016, both engineering exports and manufacturing bounced back to year-
on-year growth while in July 2016, both of them slipped to negative growth. In the month of
August and September 2016 also both moved in the same direction. In August, engineering
exports came back to growth path and accelerated further in September. Manufacturing
output, on the other hand saw a lower decline in August and then witnesses growth in
September. In October, engineering exports recorded a sudden jump in growth but
manufacturing just saw the reverse, a decline in production from feeble growth in September
2016. In November 2016 however, both moved in the same direction showing accelerated year-
on-year growth over the previous month while in December2016 and in January 2017, they
moved in opposite direction. In January 2017, engineering exports growth decelerated over the
month while manufacturing came back to growth path after a decline in December 2016. In
February 2017, manufacturing output declined while engineering exports registered solid
EEPC India Page 7
growth and in March 2017, engineering exports growth decelerated slightly but manufacturing
bounced back to growth path.
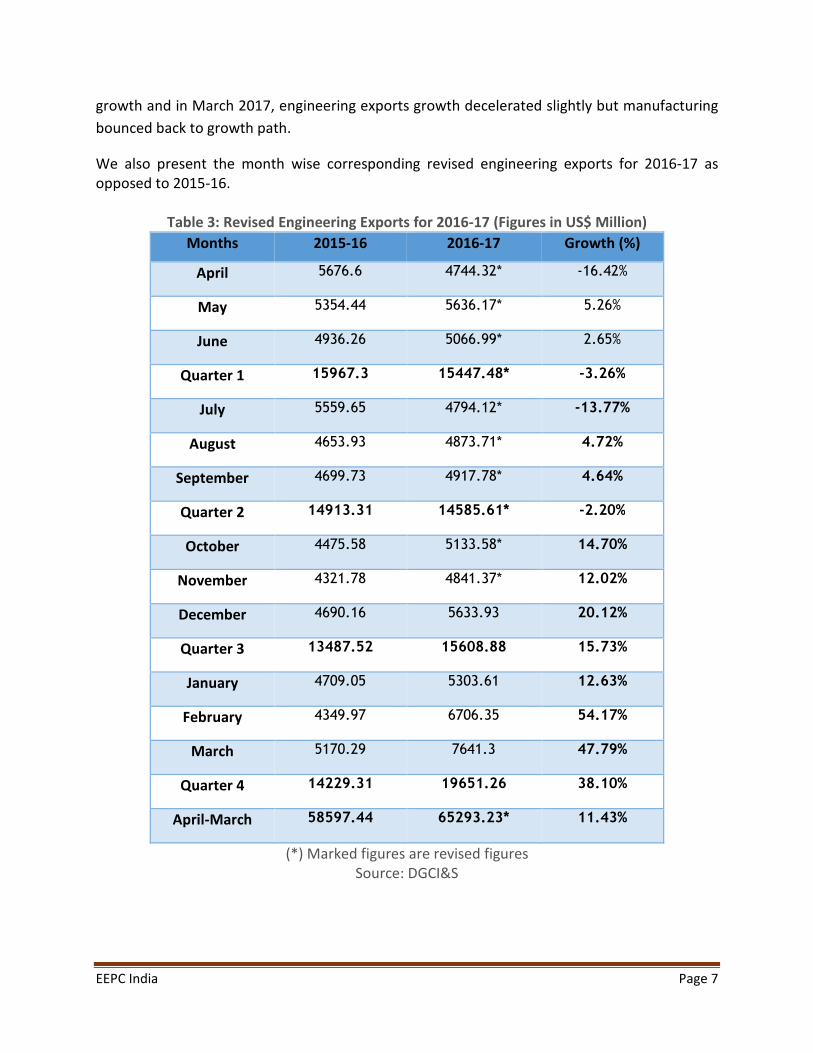
We also present the month wise corresponding revised engineering exports for 2016-17 as
opposed to 2015-16.
Table 3: Revised Engineering Exports for 2016-17 (Figures in US$ Million)
Months 2015-16 2016-17 Growth (%)
April 5676.6 4744.32* -16.42%
May 5354.44 5636.17* 5.26%
June 4936.26 5066.99* 2.65%
Quarter 1 15967.3 15447.48* -3.26%
July 5559.65 4794.12* -13.77%
August 4653.93 4873.71* 4.72%
September 4699.73 4917.78* 4.64%
Quarter 2 14913.31 14585.61* -2.20%
October 4475.58 5133.58* 14.70%
November 4321.78 4841.37* 12.02%
December 4690.16 5633.93 20.12%
Quarter 3 13487.52 15608.88 15.73%
January 4709.05 5303.61 12.63%
February 4349.97 6706.35 54.17%
March 5170.29 7641.3 47.79%
Quarter 4 14229.31 19651.26 38.10%
April-March 58597.44 65293.23* 11.43%
(*) Marked figures are revised figures
Source: DGCI&S
EEPC India Page 8
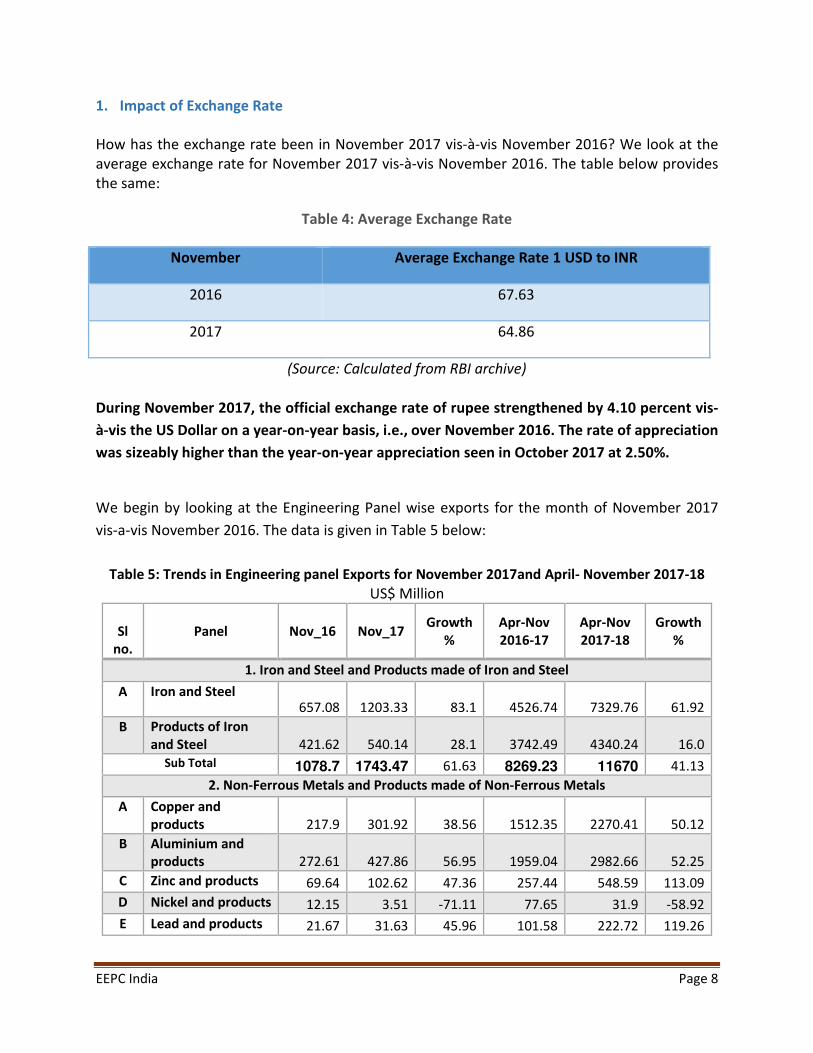
1. Impact of Exchange Rate
How has the exchange rate been in November 2017 vis-à-vis November 2016? We look at the
average exchange rate for November 2017 vis-à-vis November 2016. The table below provides
the same:
Table 4: Average Exchange Rate
November Average Exchange Rate 1 USD to INR
2016 67.63
2017 64.86
(Source: Calculated from RBI archive)
During November 2017, the official exchange rate of rupee strengthened by 4.10 percent vis-
à-vis the US Dollar on a year-on-year basis, i.e., over November 2016. The rate of appreciation
was sizeably higher than the year-on-year appreciation seen in October 2017 at 2.50%.
We begin by looking at the Engineering Panel wise exports for the month of November 2017
vis-a-vis November 2016. The data is given in Table 5 below:
Table 5: Trends in Engineering panel Exports for November 2017and April- November 2017-18
US$ Million
Sl
no.
Panel Nov_16 Nov_17 Growth
%
Apr-Nov
2016-17
Apr-Nov
2017-18
Growth
%
1. Iron and Steel and Products made of Iron and Steel
A Iron and Steel 657.08 1203.33 83.1 4526.74 7329.76 61.92
B Products of Iron
and Steel 421.62 540.14 28.1 3742.49 4340.24 16.0
Sub Total 1078.7 1743.47 61.63 8269.23 11670 41.13
2. Non-Ferrous Metals and Products made of Non-Ferrous Metals
A Copper and
products 217.9 301.92 38.56 1512.35 2270.41 50.12
B Aluminium and
products 272.61 427.86 56.95 1959.04 2982.66 52.25
C Zinc and products 69.64 102.62 47.36 257.44 548.59 113.09
D Nickel and products 12.15 3.51 -71.11 77.65 31.9 -58.92
E Lead and products 21.67 31.63 45.96 101.58 222.72 119.26

EEPC India Page 9
Sl
no.
Panel Nov_16 Nov_17 Growth
%
Apr-Nov
2016-17
Apr-Nov
2017-18
Growth
%
F Tin and products 0.33 0.59 78.79 3.66 7.12 94.54
G Other Non-Ferrous
Metals 29.59 38.91 31.50 286.5 324 13.09
Sub Total 623.89 907.04 45.38 4198.22 6387.4 52.15
3. Industrial Machinery
A Industrial
Machinery like
Boilers, parts, etc 40.94 36.19 -11.6 452.92 366.94 -19.0
B IC Engines and
Parts 139.67 209.28 49.8 1401.79 1676.72 19.6
C Pumps of all types 63.11 80.21 27.10 479.18 623.26 30.07
D Air condition and
Refrigerators 61.86 114.92 85.8 632.01 740.84 17.2
E Industrial
Machinery for
dairy, food
processing , textiles
etc 322 465.53 44.6 2935.36 3338.38 13.7
F Machine Tools 32.03 40.67 26.97 302.13 309.43 2.42
G Machinery for
Injecting moulding,
valves and ATMs 96.28 127.34 32.3 812 979.77 20.7
Sub Total 755.89 1074.14 42.1 7015.39 8035.34 14.5
4 Electrical
Machinery 382.12 703.49 84.10 3072.13 4040.08 31.51
5. Automobiles
A Motor Vehicle/cars 597.6 801.24 34.1 4920.36 5130.9 4.3
B Two and Three
Wheelers 123.47 178.3 44.4 1072.07 1308.75 22.1
C Auto
Components/Part 298.43 448.19 50.18 2763.63 3266.57 18.20
Sub Total 1019.5 1427.73 40.04 8756.06 9706.22 10.85
6 Aircrafts and
Spacecraft parts
and products 239.07 266.89 11.64 2139.28 1570.43 -26.59
7 Ships Boats and
Floating products
and parts 279.7 168.73 -39.67 2303.85 2588.93 12.37
8. Other engineering products
A Medical and
Scientific
instruments 112.34 142 26.40 900.82 1044.7 15.97

EEPC India Page 10
Sl
no.
Panel Nov_16 Nov_17 Growth
%
Apr-Nov
2016-17
Apr-Nov
2017-18
Growth
%
B Railway Transport 5.4 24.79 359.07 118.89 194.75 63.81
C Hand Tools &
Cutting Tools 42.08 57.81 37.38 421.32 459.76 9.12
D Electrodes
Accumulators 3.25 3.83 17.85 27.51 28.73 4.43
E Accumulator and
Batteries 15.39 28.74 86.74 145.13 171.65 18.27
F Bicycle & Parts 19.46 24.72 27.03 188.61 204.16 8.24
G Cranes Lifts &
Winches 22.45 39.22 74.70 271.1 224.77 -17.09
H Office Equipments 12.64 7.93 -37.26 76.23 60.45 -20.70
I Other Construction
Machinery 75.99 136.61 79.77 651.56 875.31 34.34
J Prime Mica & Mica
Products 1.55 1.8 16.13 11.73 14.38 22.59
K OTHER MISC.
ITEMS 151.95 197.28 29.83 1440.98 1674.14 16.18
Sub total 462.5 664.73 43.73 4253.88 4952.8 16.43
Total engineering exports 4841.37 6956.22 43.68 40008.04 48951.2 22.35
(Source: Department of Commerce, Government of India)
Some factors that need to be noted are:
� For the month of October, panel-wise analysis of engineering export showed that the
overall scenario improved again in November post low growth observed in October
compared to that of the previous month. Engineering exports recovered high growth
similar to that of September to the extent of 44 percent in November 2017 vis-a-vis
November 2016. Out of 33 engineering panels, 29 panels sharing almost 88% of the
products, recorded growth in exports over the same month last year while the
remaining 4 panels conceded decline during the month of November 2017.
� Iron and Steel exports more or less maintained similar growth pattern like in the
previous month scaling up by 83.1 percent during November 2017 with an overseas
shipment recording US$ 1203.3 million from US$ 657 million in the same month last
year. Cumulative figure showed 61.9 percent growth of exports during April –November
2017 to US$ 7329.7 million from US$ 4526.7 million during the same period last fiscal.
Products of Iron and Steel experienced an increase in exports by 28 percent during
November 2017 over the same month last year while its cumulative exports increased
by 16 percent to US$ 4340.24 million during April - November 2017 from US$ 3742.5
million during the same period last in 2016-17.

EEPC India Page 11
� Among the 7 non-ferrous metals and products made of non-ferrous metals, ‘Tin and
Products’, ‘Aluminium and products, ‘Zinc and products’, ‘Lead and products’ ‘Copper
and products’ recorded substantial growth in exports during November 2017. 'Tin and
its products' recorded highest growth of 79 percent during November 2017. Nickel and
products were the only non ferrous sector that experienced a drop down to the extent
of 71 percent in November 2017 compared to same period last fiscal.
� Industrial machinery recorded a high growth in exports to the extent of 42.1 percent
during November 2017 and a positive growth of 14.5 percent cumulatively from April-
November 2017 vis-à-vis same period last fiscal. Industrial segments like Industrial
Boilers, recorded fall in exports to the extent of 11.6 percent and 19 percent
respectively in November 2017 compared to that of November 2016. Other exporting
segments like, IC Engines, Air Condition and Repair Machinery, ‘Industrial Machinery for
dairy’ recorded positive growth in exports to the extent of 86%, 50%, and 45%
respectively during November 2017 compared to November 2016.
� Electrical Machinery and equipments panel faced positive growth in November 2017 by
84.1 percent. On a cumulative basis, the growth was lower at 31.5 percent during April -
November 2017 over the same period last fiscal.
� Exports of 'Aircrafts and Spacecraft parts and products' recorded 11.6 percent growth in
November 2017 and a decline faced to the extent of 27 percent cumulatively during
April –November 2017 over the same period last year.
� Among other panels, Ship and Boats scaled down by more than 39% moving down from
US$ 279.7 million to US$ 168.7 million in November 2017 compared to that over last
fiscal. Office Equipments squeezed by 37.3 percent during November 2017 and to the
extent of 20.7 percent during April - November 2017. Railway and Transport,
Accumulators and Battery, Construction and Machinery, Other Construction Machinery,
are some of the engineering panels that more than 50 percent growth during November
2017 over the same period last year.
2. Top 25 destinations for Indian Engineering Exports
We now look at the export scenario of top 25 nations that have highest demand for Indian
engineering products during November 2017 over November 2016 in Absolute Value. Country
wise cumulative figures for April- November 2017-2018 have also been taken into concern to
see the trend of India’s engineering exports in the current fiscal.
Table 6: Engineering Exports Country wise (2017-18)
EEPC India Page 12
COUNTRY NOVEMBER,
2016
NOVEMBER,
2017
Growth
(%)
APRIL, 2016 -
NOVEMBER,
2016
APRIL, 2017-
NOVEMBER,
2017
Growth
(%)
U S A 495.72 994.62 100.64 4,353.95 6,490.69 49.08
U A E 169.96 279.57 64.49 2,649.83 3,084.53 16.41
CHINA 257.09 321.19 24.93 960.44 1,998.93 108.13
GERMANY 156.28 273.49 75.00 1,397.55 1,987.12 42.19
U K 166.06 329.36 98.34 1,625.75 1,924.44 18.37
MEXICO 179.70 199.47 11.00 1,591.61 1,805.97 13.47
ITALY 161.67 278.19 72.07 1,171.07 1,646.49 40.60
NEPAL 174.14 242.15 39.05 1,445.28 1,535.77 6.26
BANGLADESH 173.73 238.14 37.07 1,250.68 1,489.28 19.08
MALAYSIA 424.32 220.51 -48.03 1,538.76 1,325.40 -13.87
SINGAPORE 130.37 162.61 24.72 1,435.60 1,314.47 -8.44
KOREA 91.43 194.69 112.93 841.70 1,248.91 48.38
INDONESIA 93.10 181.16 94.59 874.17 1,117.89 27.88
TURKEY 126.17 121.86 -3.41 1,084.70 1,067.64 -1.57
FRANCE 110.97 113.98 2.71 793.54 966.28 21.77
SRI LANKA 87.96 119.79 36.19 965.13 949.92 -1.58
SOUTH AFRICA 85.23 111.52 30.85 664.61 919.51 38.35
BELGIUM 86.40 125.60 45.38 664.43 833.71 25.48
VIETNAM 85.24 141.89 66.46 513.23 807.48 57.33
THAILAND 68.15 107.65 57.97 555.97 792.90 42.62
SAUDI ARAB 98.80 73.86 -25.25 785.96 750.92 -4.46
SPAIN 84.11 92.08 9.47 598.94 730.57 21.98
JAPAN 79.99 90.52 13.16 512.65 642.30 25.29
BRAZIL 39.63 72.41 82.71 390.69 600.05 53.59
EGYPT 34.32 41.65 21.37 357.36 570.62 59.67
Top 25
Countries Total 3,660.56 5,127.96 40.09 29,023.59 36,601.79 26.11
Engg Total 4,841.38 6,956.23 43.68 40,007.99 48,951.21 (90.11)
Share of Top
25 Countries
73.7%
74.7%
Note: Red font indicates negative growth
(Source: Department of Commerce, Government of India)
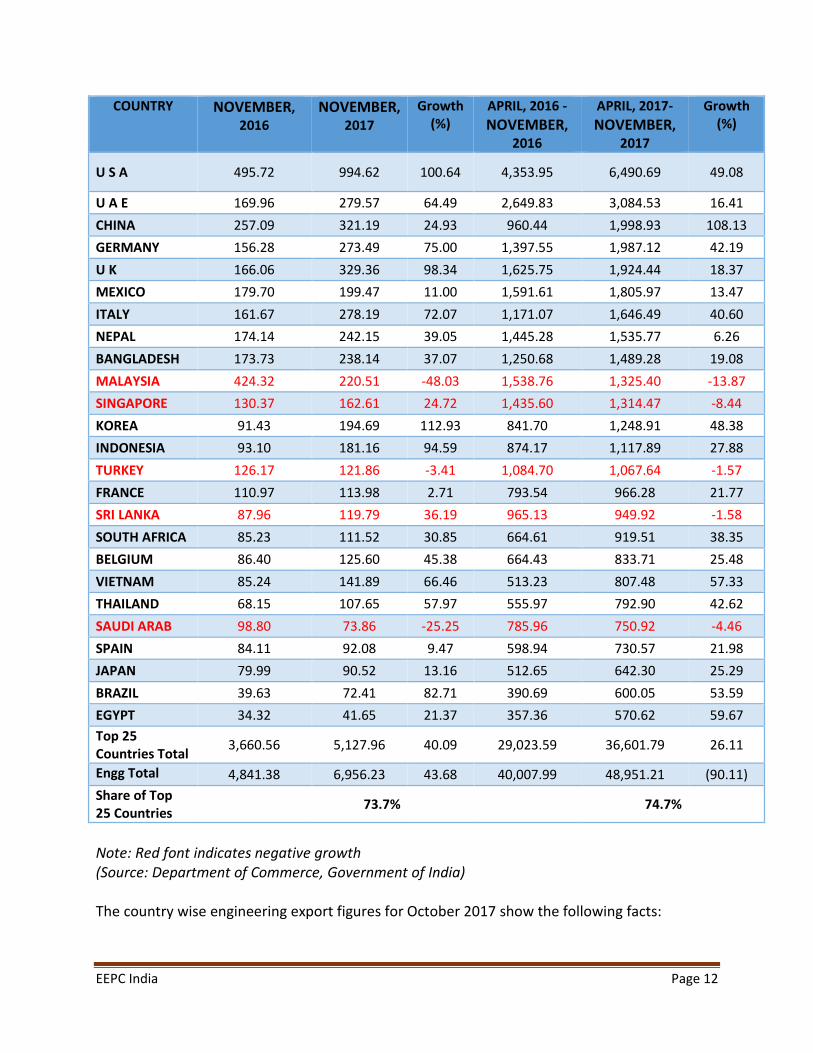
The country wise engineering export figures for October 2017 show the following facts:

EEPC India Page 13
� During November 2017, out of top 25 countries 22 countries recorded year-on-year
growth in engineering exports from India over the same month last year.
� USA continued to be the top most exporting destination for India's engineering products
in November 2017. It registered positive growth both on monthly basis as well as in
cumulative basis during Apr-November 2017-18 over the same period last fiscal to the
extent of 100 percent and 49 percent respectively.
� Countries like Korea recorded more than 100 percent export growth during November
2017 vis-à-vis November 2016. On the other hand France and Spain recorded less than
10 percent export growth in November 2017.
� Out of the top 25 export destinations, countries like Turkey, Malaysia, Sri Lanka,
Singapore and Saudi Arabia recorded dip in exports both monthly as well as on
cumulative basis during April-Nov 2017-18 compared to the same period last fiscal.
� All European nations falling under the top 25 engineering export destinations like
Germany, Italy, Belgium and France recorded considerable growth during Apr-
November 2017-18 over Apr- November 2016-17.
� Even, among the ASEAN countries under the top 25 engineering export destinations like
Indonesia, Thailand and Vietnam have recorded sharp growth in engineering exports
with high export base in Apr- November2017-18.
� Out of 224 exports destinations of Indian engineering goods, top 25 nations accounted
for 73.7 percent of India's total engineering exports on monthly basis during November
2017 compared to November 2016 and 74.7 percent on cumulative basis from Apr-
November 2017-18 compared to same period last fiscal.
� Overall, India's engineering exports to its top 25 destinations registered a rise in exports
both monthly to the extent of 40.1 percent in November 2017 and cumulatively to the
extent of 26.1 percent during April- November 2017 compared to the same period
previous year.
3. Regional Distribution of Engineering Exports
We now look at the Regional Distribution of Engineering Exports for April- November 2017-18
as opposed to April- November 2016-17. We also look at the trend in November 2017 vis-à-vis
November 2016. The Table below gives this picture:
Table 7: Region Wise Exports Trend

EEPC India Page 14
US$ Million
COUNTRY NOVEMBER,
2016
NOVEMBER,
2017
Growth
(%)
APRIL, 2016 -
NOVEMBER,
2016
APRIL, 2017-
NOVEMBER,
2017
Growth
(%)
AFRICA 407.20 606.29 48.89 3,752.39 4,503.80 20.02
ASEAN+2 852.73 907.05 6.37 5,436.13 6,041.85 11.14
CIS 52.97 81.53 53.93 493.23 545.69 10.64
E U 1,089.96 1,607.62 47.49 9,412.19 11,271.59 19.76
LATIN AMERICA 190.24 264.49 39.03 1,699.74 2,104.76 23.83
MIDDLE EAST AND
WEST ASIA (MEWA) 505.52 630.95 24.81 5,196.26 5,965.46 14.80
N AMERICA 702.27 1,268.60 80.64 6,224.48 8,681.89 39.48
N E ASIA 492.14 722.74 46.86 2,806.45 4,573.80 62.97
OTHERS 77.13 207.26 168.72 987.23 945.44 -4.23
SOUTH ASIA 471.24 659.70 39.99 3,999.89 4,316.93 7.93
Grand Total 4,841.38 6,956.23 43.68 40,007.99 48,951.21 22.35
(Source: Department of Commerce, Government of India)
Note: *Figures have been rounded off. Source: DGCI&S; **Myanmar has been included in
ASEAN+2 and not in South Asia, since ASEAN is a formal economic grouping.
Figure 2: India’s region wise exports during April-November
AFRICA
9%
ASEAN+2
12%
CIS
1%
E U
23%
LATIN AMERICA
4%
MIDDLE
EAST AND
WEST ASIA
(MEWA)
12%
N AMERICA
18%
N E ASIA
10%
OTHERS
2%SOUTH ASIA
9%
AFRICA
ASEAN+2
CIS
E U
LATIN AMERICA
MIDDLE EAST AND WEST ASIA
(MEWA)
N AMERICA
N E ASIA
OTHERS
EEPC India Page 15
(Source: EEPC India analysis)
� EU ranks as the region with highest shipment of engineering products from India during
November 2017 with a share of more than 23% of total engineering exports.
� India’s exports to ASEAN+2 and North East Asia recorded considerable growth both
monthly and cumulatively during Apr-November 2017-18 over the same period last
fiscal.
� India’s engineering exports to N E Asia countries recorded highest positive growth in
April – November 2017-18 to the extent of 63 percent over the same period in the
previous year.
� India’s exports to South Asia and CIS region registered slow growth in exports in
November 2017.
� Engineering exports to North America, Latin America, EU, also recorded noteworthy
positive growth in cumulative terms.
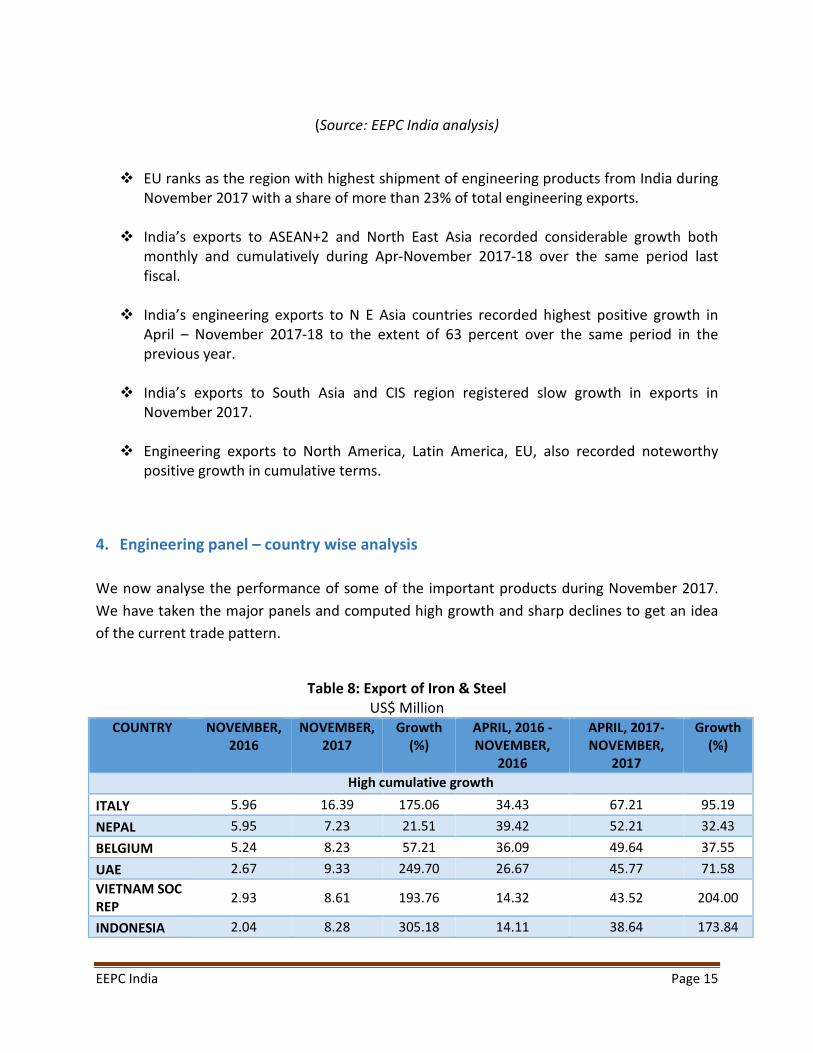
4. Engineering panel – country wise analysis
We now analyse the performance of some of the important products during November 2017.
We have taken the major panels and computed high growth and sharp declines to get an idea
of the current trade pattern.
Table 8: Export of Iron & Steel
US$ Million
COUNTRY NOVEMBER,
2016
NOVEMBER,
2017
Growth
(%)
APRIL, 2016 -
NOVEMBER,
2016
APRIL, 2017-
NOVEMBER,
2017
Growth
(%)
High cumulative growth
ITALY 5.96 16.39 175.06 34.43 67.21 95.19
NEPAL 5.95 7.23 21.51 39.42 52.21 32.43
BELGIUM 5.24 8.23 57.21 36.09 49.64 37.55
UAE 2.67 9.33 249.70 26.67 45.77 71.58
VIETNAM SOC
REP 2.93 8.61 193.76 14.32 43.52 204.00
INDONESIA 2.04 8.28 305.18 14.11 38.64 173.84
EEPC India Page 16
SPAIN 3.11 2.86 -8.06 18.11 27.45 51.55
Sharp cumulative decline
BANGLADESH 3.21 1.97 -38.75 26.40 16.76 -36.50
MEXICO 1.55 1.28 -17.46 10.80 10.35 -4.13
ETHIOPIA 0.57 0.35 -38.78 9.27 9.21 -0.67
ECUADOR 0.42 0.32 -25.11 2.87 2.58 -10.18
(Source: Department of Commerce, Government of India)
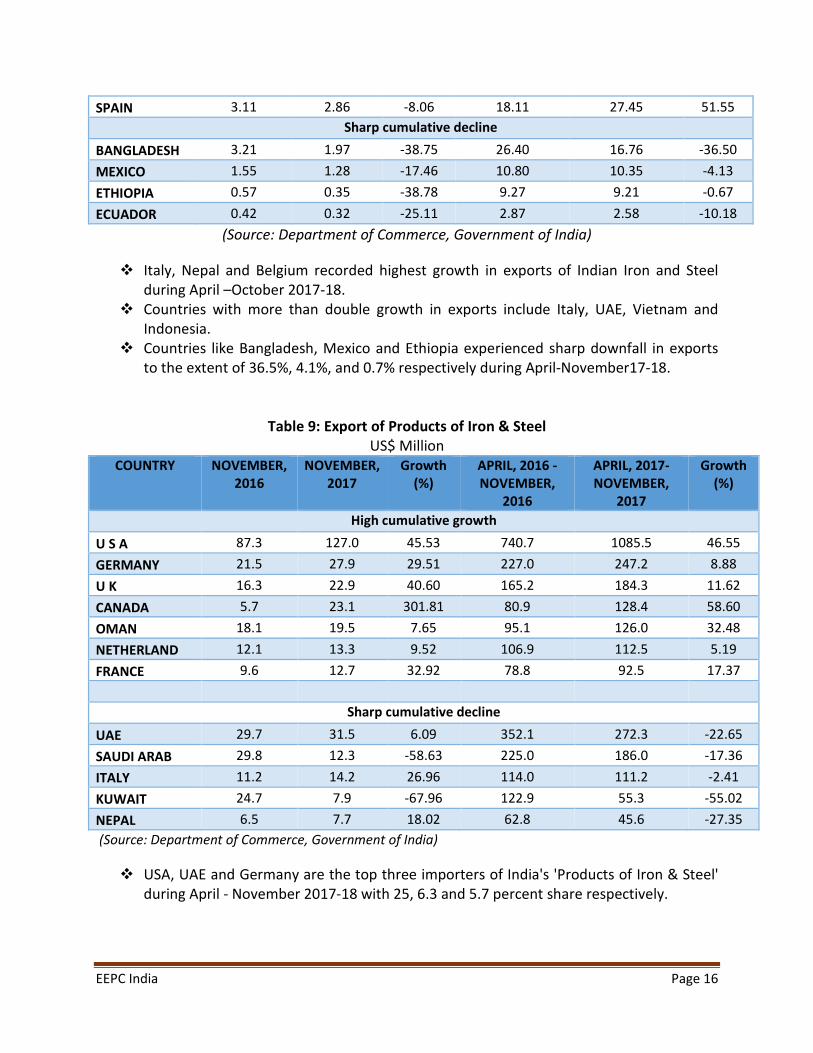
� Italy, Nepal and Belgium recorded highest growth in exports of Indian Iron and Steel
during April –October 2017-18.
� Countries with more than double growth in exports include Italy, UAE, Vietnam and
Indonesia.
� Countries like Bangladesh, Mexico and Ethiopia experienced sharp downfall in exports
to the extent of 36.5%, 4.1%, and 0.7% respectively during April-November17-18.
Table 9: Export of Products of Iron & Steel
US$ Million
COUNTRY NOVEMBER,
2016
NOVEMBER,
2017
Growth
(%)
APRIL, 2016 -
NOVEMBER,
2016
APRIL, 2017-
NOVEMBER,
2017
Growth
(%)
High cumulative growth
U S A 87.3 127.0 45.53 740.7 1085.5 46.55
GERMANY 21.5 27.9 29.51 227.0 247.2 8.88
U K 16.3 22.9 40.60 165.2 184.3 11.62
CANADA 5.7 23.1 301.81 80.9 128.4 58.60
OMAN 18.1 19.5 7.65 95.1 126.0 32.48
NETHERLAND 12.1 13.3 9.52 106.9 112.5 5.19
FRANCE 9.6 12.7 32.92 78.8 92.5 17.37
Sharp cumulative decline
UAE 29.7 31.5 6.09 352.1 272.3 -22.65
SAUDI ARAB 29.8 12.3 -58.63 225.0 186.0 -17.36
ITALY 11.2 14.2 26.96 114.0 111.2 -2.41
KUWAIT 24.7 7.9 -67.96 122.9 55.3 -55.02
NEPAL 6.5 7.7 18.02 62.8 45.6 -27.35
(Source: Department of Commerce, Government of India)
� USA, UAE and Germany are the top three importers of India's 'Products of Iron & Steel'
during April - November 2017-18 with 25, 6.3 and 5.7 percent share respectively.

EEPC India Page 17
� USA recorded 47 percent growth in imports of 'Products of Iron & Steel' from India
while Germany saw 9 percent growth. UAE recorded 23 percent decline in imports
during April - November 2017-18.
� Among major exporters, exports to Sri Lanka, Colombia, and Iran witnessed notable
growth during April - November 2017-18.
� Among major importers, UAE, Saudi Arabia, Italy, Kuwait, Nepal, China conceded
substantial decline in imports during April - November 2017-18.
Table 10: Export of Industrial Machinery
US$ Million
COUNTRY NOVEMBER,
2016
NOVEMBER,
2017
Growth
(%)
APRIL, 2016 -
NOVEMBER,
2016
APRIL, 2017-
NOVEMBER,
2017
Growth (%)
High cumulative growth
U S A 95.86 161.98 68.98 949.31 1251.15 31.80
U K 28.09 51.52 83.41 258.58 386.63 49.52
BANGLADESH 39.00 60.65 55.53 284.91 367.58 29.01
GERMANY 28.25 45.47 60.93 313.46 346.18 10.44
UAE 32.98 38.00 15.24 291.74 293.15 0.48
CHINA 36.63 37.79 3.17 236.93 288.43 21.74
ITALY 16.55 32.24 94.78 179.44 242.03 34.88
NEPAL 23.79 29.59 24.37 197.04 202.72 2.89
THAILAND 16.93 24.21 42.98 133.79 197.55 47.65
Sharp cumulative decline
TURKEY 34.73 41.07 18.23 298.81 288.06 -3.60
MALAYSIA 22.63 14.01 -38.10 152.70 139.04 -8.94
VIETNAM SOC
REP 11.65 14.00 20.25 129.99 129.26 -0.56
IRAN 9.03 16.16 78.87 114.67 101.45 -11.53
RUSSIA 9.78 19.13 95.54 150.73 95.31 -36.77
KENYA 10.54 11.03 4.67 98.57 91.76 -6.91
PHILIPPINES 4.53 5.59 23.44 73.97 68.84 -6.93
(Source: Department of Commerce, Government of India)
� USA was the largest importer of Indian 'Industrial machinery' during April–November
2017-18 with 15.6 percent share and 31.8% year-on-year growth in imports followed by
UK with 4.8% share and 49.5% y-o-y growth in imports from India. Bangladesh and
Germany also imported over US$ 367 million and US$ 346 million of "industrial
Machinery" respectively from India during the first eight months of fiscal 2017-18.
� Among the major importers, export to Iran, Russia, Algeria, Bhutan recorded sharp
declines in imports during April - November 2017-18.

EEPC India Page 18
Table 11: Export of Automobiles
US$ Million
COUNTRY NOVEMBER,
2016
NOVEMBER,
2017
Growth
(%)
APRIL, 2016 -
NOVEMBER,
2016
APRIL, 2017-
NOVEMBER,
2017
Growth (%)
High cumulative growth
MEXICO 121.4 125.6 3.5 1032.4 1214.9 17.7
SOUTH AFRICA 56.6 66.8 18.1 359.0 540.0 50.4
BANGLADESH 44.3 63.7 43.8 254.2 362.4 42.6
INDONESIA 9.5 21.2 123.6 64.6 213.9 231.0
U S A 0.1 160.0 110228.4 4.9 202.2 4045.6
CHILE 19.2 24.9 29.4 139.7 154.4 10.6
ALGERIA 11.6 43.0 270.8 80.5 144.2 79.2
Sharp cumulative decline
NEPAL 34.8 50.2 44.4 335.9 315.6 -6.0
SRI LANKA 39.2 37.8 -3.5 348.2 263.4 -24.3
ITALY 26.8 10.4 -61.0 227.6 199.8 -12.2
U K 34.2 10.7 -68.6 298.3 131.2 -56.0
COLOMBIA 18.5 19.6 5.8 136.4 126.3 -7.4
PERU 14.8 18.3 23.2 136.5 124.3 -8.9
(Source: Department of Commerce, Government of India)
(Note: Automobiles sector includes Motor vehicles and Two & Three Wheelers)
� Mexico, South Africa and Bangladesh were top three importers of India's
Automobiles during April-November of 2017-18 witnessing 18, 50.4 and 43 percent
growth in year-on-year imports respectively. Mexico being the largest importer
shares 19 percent of imports of automobiles from India.
� Countries like USA, Indonesia, Cote D' Ivoire, Ecuador, Singapore saw over 100
percent growths in imports of Indian automobile during April - November 2017-28
among major importers.
� UK, Sri Lanka, Saudi Arabia, Spain conceded substantial decrease in imports of
Automobiles from India during April-November 2017-18.

EEPC India Page 19
Table 12: Export of Non-Ferrous metals
US$ Million
COUNTRY OCTOBER,
2016
OCTOBER,
2017
Growth
(%)
APRIL, 2016 -
OCTOBER, 2016
APRIL, 2017-
OCTOBER, 2017
Growth
(%)
High cumulative growth
QATAR 0.66 14.56 2117.67 7.38 109.66 1385.59
BAHARAIN 0.20 0.38 91.40 11.15 46.48 316.99
COLOMBIA 1.18 11.40 865.98 17.75 62.52 252.12
CHINA 147.80 194.59 31.66 331.37 1151.47 247.49
BANGLADESH 15.24 26.91 76.62 76.84 161.00 109.54
THAILAND 5.62 9.38 66.90 40.40 79.61 97.07
Sharp cumulative decline
SAUDI ARABIA 12.38 7.36 -40.52 110.99 69.49 -37.40
SOUTH AFRICA 3.77 2.38 -36.88 30.29 21.18 -30.08
KENYA 5.93 4.92 -17.00 49.29 35.86 -27.24
SINGAPORE 18.13 33.77 86.25 263.31 207.36 -21.25
� China (USD 1151.47 million), South Korea (USD 764.39 million) and Malaysia (USD
740.29 million) were the top three importers of Indian Non-ferrous metals during April -
Nov 2017-18 with Y-o-Y growth of 247.49%, 64.18% and 42.90% respectively.
� Qatar, Bahrain, Colombia and China witnessed highest growth in imports of Indian Non-
ferrous metal products during April-November 2017-18.
� Saudi Arabia, South Africa, Kenya and Singapore conceded significant decline in imports
of non-ferrous metals from India during the April - November of fiscal 2017-18.
Table 13: Export of Electrical Machinery and Components
US$ Million
COUNTRY NOVEMBER,
2016
NOVEMBER,
2017
Growth (%) APRIL, 2016 -
NOVEMBER,
2016
APRIL, 2017-
NOVEMBER,
2017
Growth
(%)
High cumulative growth
UKRAINE 0.32 7.95 2398.27 1.26 10.18 709.09
TAIWAN 0.19 8.59 4368.09 11.35 36.68 223.09
GERMANY 27.47 95.92 249.18 180.04 556.84 209.29
IRAN 0.21 3.38 1511.67 4.01 11.68 191.43
ISRAEL 1.53 12.10 691.09 9.02 24.51 171.70
ARGENTINA 0.34 1.65 382.52 6.51 15.17 133.11
RUSSIA 0.62 1.46 133.66 9.68 21.09 117.99
POLAND 2.03 6.22 205.92 18.85 37.95 101.35
VIETNAM 5.04 17.50 247.47 44.20 87.43 97.78

EEPC India Page 20
MEXICO 4.57 8.24 80.38 17.68 32.43 83.41
MYANMAR 0.27 6.88 2480.61 15.03 27.46 82.77
CHINA 6.77 42.62 529.36 77.28 140.69 82.06
SINGAPORE 8.48 21.59 154.61 72.95 128.90 76.69
Sharp cumulative decline
ALGERIA 15.21 0.04 -99.73 64.43 4.59 -92.88
LIBYA 0.26 0.48 84.04 17.32 1.81 -89.56
IRAQ 2.02 0.69 -66.08 17.22 6.20 -64.02
PHILIPPINES 2.49 1.62 -35.09 38.46 14.45 -62.41
(Source: Department of Commerce and CSO)
� USA (US$ 773.93 million), Germany (US$ 556.84 million) and UK (US$ 263.06 million)
were the three top importers of Indian Electrical Machinery and Components during
April - November 2017-18 with market shares of 19.2%, 13.8% and 6.5% respectively.
These three nations witnessed 61.5%, 209.29% and 22.33% year-on-year growth in
imports of Indian 'Electrical Machinery and Components' during April - November 2017-
18.
� Ukraine, Taiwan and Germany recorded highest growth in imports of India's Electrical
Machinery and Components during April - November2017-18.
� On the other hand, Algeria, Libya and Nepal conceded highest declines in imports of
India's Electrical Machinery and Components during the first eight months of fiscal
2017-18.
Table 14: Export of Aircrafts &Spacecrafts
US$ Million
COUNTRY NOVEMBER,
2016
NOVEMBER,
2017
Growth (%) APRIL, 2016 -
NOVEMBER,
2016
APRIL, 2017-
NOVEMBER,
2017
Growth
(%)
High cumulative growth
THAILAND 0.15 1.38 837.84 3.91 11.19 186.20
GERMANY 12.98 23.26 79.23 88.61 155.02 74.95
POLAND 1.09 2.16 99.23 14.94 21.61 44.62
U K 14.27 77.15 440.57 153.95 208.06 35.15
Sharp cumulative decline
BULGARIA 0.00 0.00 ---- 93.70 0.00 -100.00
CZECH
REPUBLIC 0.03 0.03 2.62 171.18 0.23 -99.87
SRI LANKA 0.13 0.02 -87.78 78.22 0.18 -99.77
UAE 1.43 0.89 -37.74 151.39 4.56 -96.99

EEPC India Page 21
TURKEY 0.85 1.08 27.37 100.08 11.22 -88.78
SWITZERLAND 1.42 1.60 13.16 109.93 25.29 -76.99
(Source: Department of Commerce and CSO)
� USA, UK, France and Singapore were the top importers of India's 'Aircrafts &
Spacecrafts' during April - November 2017-18 with 26.70 percent, 13.25 percent, 12.92
percent and 10.96 percent shares respectively in India's total global exports of the
product. Among them, Singapore conceded 9.30% decline in imports of the product
group during April - November 2017-18 while USA, UK and France recorded 2.16%,
35.15% and 5.37% growth in imports respectively during the same time period.
� Thailand, Germany, Poland and UK achieved significant growth in imports of India's
'Aircrafts & Spacecrafts' during April - November 2017-18.
� Demand from Bulgaria, Czech Republic, Sri Lanka, UAE, Turkey and Switzerland declined
significantly during April - November 2017-18.
Table 15: Export of Ships, Boats and Floating Structures and parts
US$ Million
COUNTRY NOVEMBER,
2016
NOVEMBER,
2017
Growth
(%)
APRIL, 2016 -
NOVEMBER,
2016
APRIL, 2017-
NOVEMBER,
2017
Growth (%)
High cumulative growth
EGYPT 0.00 0.00 8.05 0.00 213.77 6744154.69
U S A 0.01 0.05 476.79 0.22 443.72 204133.47
LIBERIA 0.00 0.00 ---- 0.00 84.61 ----
NORWAY 0.00 82.41 ---- 0.00 82.42 ----
Sharp cumulative decline
BAHARAIN 0.00 0.00 ---- 45.81 0.00 -100.00
MALAYSIA 247.66 0.00 -100.00 502.05 6.22 -98.76
INDONESIA 0.00 0.00 ---- 233.32 36.07 -84.54
SINGAPORE 30.84 47.64 54.50 605.85 418.72 -30.89
(Source: Department of Commerce and CSO)
� UAE is the largest importer of India's 'Ships, Boats and Floating Structures and Parts'
during Apr - Nov 2017-18 with 40% share of India's total global exports of the same.
USA, Singapore and Egypt were the other top importers during the same time period
with 17.14%, 16.17% and 8.26% shares respectively. Among them, Egypt recorded no
imports during April - November 2016-17, USA continued to see a gigantic growth in
imports, and Singapore conceded decline in imports.
EEPC India Page 22
� Egypt, USA, Liberia and Norway, achieved significant increase in year-on-year imports of
Indian 'Ships, Boats and Floating Structures and Parts' during April - November 2017-18.
� Exports of Indian 'Ships, Boats and Floating Structures and Parts' to Bahrain, Malaysia,
Indonesia and Singapore recorded significant decline during April - November 2017-18.
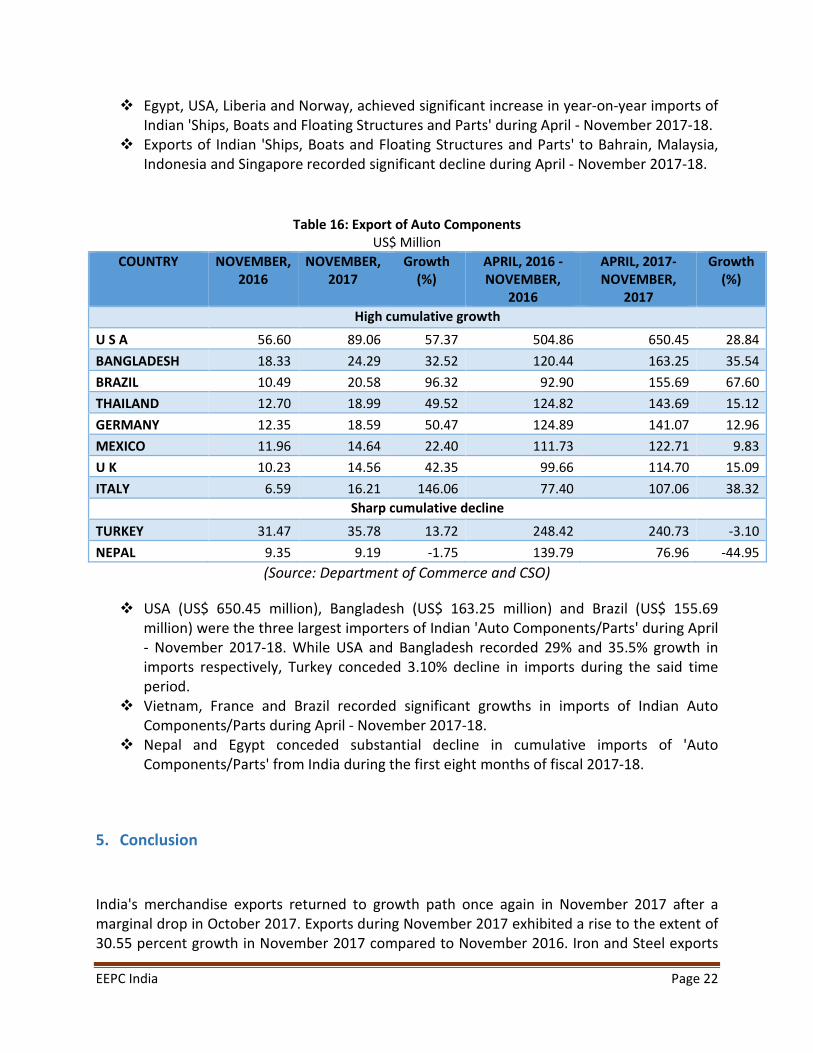
Table 16: Export of Auto Components
US$ Million
COUNTRY NOVEMBER,
2016
NOVEMBER,
2017
Growth
(%)
APRIL, 2016 -
NOVEMBER,
2016
APRIL, 2017-
NOVEMBER,
2017
Growth
(%)
High cumulative growth
U S A 56.60 89.06 57.37 504.86 650.45 28.84
BANGLADESH 18.33 24.29 32.52 120.44 163.25 35.54
BRAZIL 10.49 20.58 96.32 92.90 155.69 67.60
THAILAND 12.70 18.99 49.52 124.82 143.69 15.12
GERMANY 12.35 18.59 50.47 124.89 141.07 12.96
MEXICO 11.96 14.64 22.40 111.73 122.71 9.83
U K 10.23 14.56 42.35 99.66 114.70 15.09
ITALY 6.59 16.21 146.06 77.40 107.06 38.32
Sharp cumulative decline
TURKEY 31.47 35.78 13.72 248.42 240.73 -3.10
NEPAL 9.35 9.19 -1.75 139.79 76.96 -44.95
(Source: Department of Commerce and CSO)
� USA (US$ 650.45 million), Bangladesh (US$ 163.25 million) and Brazil (US$ 155.69
million) were the three largest importers of Indian 'Auto Components/Parts' during April
- November 2017-18. While USA and Bangladesh recorded 29% and 35.5% growth in
imports respectively, Turkey conceded 3.10% decline in imports during the said time
period.
� Vietnam, France and Brazil recorded significant growths in imports of Indian Auto
Components/Parts during April - November 2017-18.
� Nepal and Egypt conceded substantial decline in cumulative imports of 'Auto
Components/Parts' from India during the first eight months of fiscal 2017-18.
5. Conclusion
India's merchandise exports returned to growth path once again in November 2017 after a
marginal drop in October 2017. Exports during November 2017 exhibited a rise to the extent of
30.55 percent growth in November 2017 compared to November 2016. Iron and Steel exports
EEPC India Page 23
more or less maintained similar growth pattern like in the previous month scaling up by 83.1
percent during November 2017 with an overseas shipment recording US$ 1203.3 million from
US$ 657 million in the same month last year. Industrial machinery recorded a high growth in
exports to the extent of 42.1 percent during November 2017 even Electrical Machinery and
equipments panel faced positive growth in November 2017 by 84.1 percent.
India’s engineering exports to N E Asia countries recorded highest positive growth to the extent
of 62.9 percent in April -November 2017-18 over the same period in the previous year, followed
by North America and Latin America. On the flipside, India’s exports to South Asia and CIS
registered slow growth in exports in November 2017. USA and UAE still remained top two
importers of Indian engineering products with over USD 6490.7 million and USD 3084.5 million
of imports respectively during April – November 2017-18.
The slowdown in engineering export growth may continue as corrected measures approved by
the GST Council is yet to be implemented properly and the fund crisis faced by the exporters,
especially from the MSME sector still persists as a consequence. The situation may worsen if
this problem is not addressed immediately. Moreover, global uncertainties, rupee volatility and
economic slowdown on the domestic front are also apprehended to weigh on India's overseas
shipment in the near term.
���������
![[XLS] of applications... · Web view10/16/2017 10/16/2017 12/4/2017 12/4/2017 12/4/2017 12/4/2017 12/4/2017 12/4/2017 12/4/2017 12/4/2017 12/4/2017 2/10/2017 2/10/2017 9/2/2017 12/7/2017](https://static.fdocuments.in/doc/165x107/5b0243937f8b9a89598f584c/xls-of-applicationsweb-view10162017-10162017-1242017-1242017-1242017.jpg)