India’s Experiences on - CUTS...
127
Transcript of India’s Experiences on - CUTS...


India’s Experiences onPreferential Trade Agreements


India’s Experiences onPreferential Trade Agreements
Faisal AhmedAssociate Director, CUTS International
Purna Chandra JenaAssistant Policy Analyst, CUTS International
D-217, Bhaskar Marg, Bani ParkJaipur 302016, India
Tel: +91.141.2282821, Fax: +91.141.2282485Email: [email protected]
Web site: www.cuts-international.org
©CUTS International, 2012
First published: March 2012
The material in this publication may be reproduced in whole or inpart and in any form for education or non-profit uses, without
special permission from the copyright holders, providedacknowledgment of the source is made. The publishers wouldappreciate receiving a copy of any publication, which uses this
publication as a source. No use of this publication may be made forresale or other commercial purposes without prior written
permission of CUTS.The views expressed here are those of the authors and can thereforein no way be taken to reflect the positions of CUTS International.
ISBN: 978-81-8257-162-4
Printed in India by Jaipur Printers Private Limited, Jaipur
#1202
India’s Experiences onPreferential Trade Agreements
Published by
Contents
Abbreviations i
Preface v
Executive Summary ix
1. Introduction 1
2. India’s Negotiating Process on PTAs 8Evolution of India’s PTA Negotiations 9
Evaluation and Analyses of NegotiatingProcess and Preparedness 12
3. Negotiation Process and the Country Experiences 15An Ideal Negotiation Process 15
Lessons from Country/Regional Experiences 20
4. Cost and Benefit Analysis of PTAs 24India’s Engagement with PTAs 25
Trade Creation and Diversion of India’s PTAs 36
Impact on Key Sectors 39
Services and Investment in PTAs 44
Treatment of Other Related Areas in PTAs 47
5. Conclusion and the Way Forward 51
References 54
Endnotes 57
Appendix 63

a ‘fair use’ of copyrighted materials as provided for inArticle 10 of the Berne Convention for the Protection ofLiterary and Artistic Works (the Paris Text of 1971) and inSection 107 of the US Copyright Law. If anybody wishes touse materials from this volume for purposes that go beyond‘fair use’, s/he must obtain permission from the copyrightowner. CUTS International will not draw any profit from thisvolume, since it is solely for informative and educationalpurposes. Suggested contribution has been sought from thepublic for printing and postage costs only.
Pradeep S MehtaBipul Chatterjee

Abbreviations
APEC Asia Pacific Economic CooperationASEAN Association of Southeast Asian Nations
BIMSTEC Bay of Bengal Initiative for Multi-sectoralTechnical and Economic Cooperation
BoP Balance of PaymentBoT Balance of TradeBPO Business Process OutsourcingBRICS-TERN BRICS Trade & Economics Research
Network
CAT Competition Appellate TribunalCCI Competition Commission of IndiaCECA Comprehensive Economic Cooperation
AgreementCEP Closed Economic PartnershipCEPA Comprehensive Economic Partnership
AgreementCGE Computable General Equilibrium
EU European Union
FDI Foreign Direct InvestmentFTAs Free Trade Agreements

GATT General Agreement on Tariffs and TradeGDP Gross Domestic ProductGEAC Genetic Engineering Approval CommitteeGoE Group of Experts
HLC High Level CommitteeHRP Human Resource Planning
IIT Intra-industry TradeIMF International Monetary FundIPR Intellectual Property RightISLFTA India-Sri Lanka Free Trade Agreement
JSG Joint Study GroupJWG Joint Working Group
LDCs Least Developed CountriesLPO Legal Process Outsourcing
MDGs Millennium Development GoalsMERCOSUR Mercado Común del SurMFN Most Favoured NationMRTP Monopolies and Restrictive Trade PracticesMTP Monopolistic Trade Practices
NTBs Non-tariff BarriersOFDI Outward Foreign Direct Investment
PTAs Preferential Trade Agreements
RCA Revealed Comparative AdvantageRCGM Review Committee on Genetic ManipulationRoO Rules of Origin
ii India’s Experiences on Preferential Trade Agreements

RTAs Regional Trade AgreementsRTPs Restrictive Trade Practices
SAFTA South Asia Free Trade AgreementSAPTA South Asia Preferential Trade AgreementSAARC South Asian Association for Regional
CooperationSEZs Special Economic Zones
TCI Trade Complementarity IndexTDCA Trade Development and Cooperation
AgreementTERC Trade and Economic Relations Committee
UTPs Unfair Trade Practices
WTO World Trade Organisation
India’s Experiences on Preferential Trade Agreements iii


Preface
Why is India pursuing a number of preferential tradeagreements while, at the same time, acting like a good
international citizen by highlighting the virtues ofmultilateralism. Conventional thinking and a narrow approachto address this question lead us to an easy answer: as the DohaRound of negotiations by the WTO Members is not comingto an end, India is engaging itself more and more withpreferential trade agreements in order to garner benefits fromgradual trade liberalisation. Some of the PTAs are motivatedby strategic interests also.
India is gradually moving away from shallow preferentialismto deep engagement so as to develop its capacity to deal withnew issues of trade governance which are expected to comeup on the multilateral platform – sooner or later. In otherwords, India’s approach to preferential trade agreements isbased on the paradigm of multilateralising preferentialism.
The genesis of this study dates back to 2008 when theDepartment of Commerce, Government of India asked us toprepare a diagnostic study on India’s engagement with PTAs.It was on account of our proposal to the Department to engagea think- and action-tank like us to implement a rollingprogramme focusing on India’s preferential trade agreementsso to develop our capacity to negotiate.
While there was considerable political buy-in for ourproposal, it was railroaded by ill informed opinion.Nevertheless, we produced a paper on Preferential Trade

Agreements and India, which was appreciated by many in theDepartment of Commerce and the trade policy community.
Incidentally, our proposal was a part of our largerengagement with the Government of India, through theDepartment of Commerce, to develop the country’s capacityon economic diplomacy.
With support from the Department of Commerce, we hadimplemented a very successful rolling programme on India’seconomic diplomacy. The programme was scheduled to bedone over a period of three years. The feedback from thosewho attended the programme was very encouraging. For e.g.one back office official said that his notes are now moreprofessional and tailored with negotiating calculus in mind, asagainst the unilateral notes which he had produced in the past.Alas, the same ill informed official railroaded it too. Whosuffered – not he, neither us but our country!
In our lexicon, failure is not absolute but deferred success.We are sure that sooner than later the Department ofCommerce will realise the value of our proposal and startimplementing. It does not matter whether we do it or not; ourcountry should benefit from its implementation.
This study is a comprehensive extension of our earlier workand evaluates India’s negotiating experiences on preferentialtrade agreements. It draws lessons from some selectengagements such as like India-Sri Lanka Free TradeAgreement, Bay of Bengal Initiative for Multi-sectoralTechnical and Economic Cooperation, India-ThailandComprehensive Economic Cooperation Agreement, India-MERCOSUR Preferential Trade Agreement, India-SingaporeComprehensive Economic Cooperation Agreement, India-ASEAN Free Trade Agreement.
The focus is on evaluating and analysing India’s negotiatingprocess and its preparedness for negotiation. The study makescase based analyses of good practices highlighting ways of
vi India’s Experiences on Preferential Trade Agreements

preparedness adopted by other countries. Given the advancesthat India has made in negotiating PTAs, such analytical studiesunderline the scope for improvement in negotiatingpreparedness.
Cost-benefit analysis has also been undertaken for somePTAs. In some cases, it was found that while economic costwas more than economic benefits, political benefits from aPTA often outweigh economic costs.
Moreover, such analysis is extended to countries like Brazil,Russia, China and South Africa to make a case for greatereconomic integration among the BRICS group of countries.Incidentally, a draft version of this paper was presented at thelaunch of a new initiative called BRICS Trade & EconomicsResearch Network. CUTS and a group of like-minded think-tanks from among BRICS countries came together to launchthis initiative to conduct network-based research and advocacyon emerging issues of global economic governance.
The initiation of this Network provided us with anopportunity to revise and extend this work. Incidentally, ourBrazilian partner of this initiative is doing a study looking atcommonalities and differences between the PTAs thatindustrialised countries like those in Europe and the US haveentered into and those of emerging economies like us. Thisstudy will provide significant inputs to this larger work onPTAs.
Lessons derived in this study will help our negotiators –not only in negotiating preferential trade agreements but alsoin the realm of economic diplomacy. For instance, theEuropean Union and India are entering into a final stage ofnegotiation of the EU-India free trade agreement. We areclosely following this negotiation including having donequalitative and quantitative analyses in partnership withreputed institutions like the Centre for Regional Integrationat Sussex University.
India’s Experiences on Preferential Trade Agreements vii

Recommendations made here will help in appreciating theeconomic/political costs and benefits from EU-India free tradeagreements and other such agreements in future. Thus, oureffort is not just to do ex-post analyses but also to do ex-anteanalyses on PTAs including their social, economic andenvironmental sustainability.
I am sure that this study will develop the negotiating capacityof our present and future trade negotiators including theircapacity to understand better larger issues of economicdiplomacy. I thank my colleagues who have made this studypossible.
Jaipur Pradeep S MehtaMarch 2012 Secretary General
viii India’s Experiences on Preferential Trade Agreements

Executive Summary
International trade has been an engine of India’s growthstory. Both trade and investment have helped India benefit
from global economic asymmetries, reduce economicvulnerability, focus on environmental sustainability, andmobilise financial and natural resources for creating avenuesfor development in both rural and urban areas, thereby creatingwelfare effects.
India’s commitment to multilateralism does continue butbesides that it has been taking several measures of economicintegration in order to increase liberalisation and enhancemarket access opportunities. India has concluded severalPreferential Trade Agreements (PTAs), Free TradeAgreements (FTAs) and Comprehensive EconomicCooperation Agreements (CECAs) and is also negotiatingseveral others.
This study evaluates India’s negotiation experiences onPTAs especially in cases of some select integration effortsincluding India-Sri Lanka FTA (ISLFTA), Bay of BengalInitiative for Multi-sectoral Technical and EconomicCooperation (BIMSTEC), India-Thailand CECA India-MERCOSUR PTA, India-Singapore CECA, India-ASEANFTA, and India-Malaysia CECA. It discusses India’snegotiating process on PTAs, and also makes an evaluationand analyses of negotiating process and the preparedness fornegotiation. Though the negotiation process suggests that Indiahas made considerable advances, yet there are still room for

improvement in the preparedness for such negotiations. Anevaluation of India’s negotiation process highlights severalissues and also presents the scope of improving preparedness.Moreover, cases of country and regional experiences on PTAshave been undertaken to derive best practices.
India’s approach to negotiating PTAs have evolved overtime in the direction of greater methodological sophistication,more systematic procedures and attention to economicrewards. There is more emphasis on the establishment andachievement of comprehensive economic goals, as opposed tothe mere enhancement of trade in goods and services. Thishas defined India’s negotiation stances at a bilateral andregional level, which are also duly reflected in its multilateralnegotiations.
The study also undertakes a cost and benefits analyses ofselect PTAs of India. Various statistical and econometrictechniques like Revealed Comparative Advantage (RCA)index, Intra-industry Trade (IIT) index, TradeComplementarity Index (TCI) and an augmented GravityModel of trade have been employed for the same. The analysisalso includes those for BRICS countries, and recommends ahigher degree of intra-BRICS engagement and economicintegration.
On the basis of lessons derived from this study, the papermakes several recommendations on how to enhancepreparedness for negotiations and also outlines the wayforward for the BRICS Trade and Economics ResearchNetwork (BRICS TERN).
The genesis of BRICS TERN, which is a network of like-minded think tanks from BRICS countries, stems from theSanya Summit op BRICS Leaders, held in April 2011, whichcalls for greater cooperation among the BRICS economies,forming the necessary base for a strong economic growth anddevelopment. The Sanya Declaration laid out current and
x India’s Experiences on Preferential Trade Agreements

future action areas, which emphasises on the need to holdBRICS think-tank symposia, and consider establishing anetwork of research centres of BRICS countries. BRICSTERN was launched in Shanghai, China, on November 19,2011.
The objective of this Network is for partner organisationsto work together on issues of trade and economics, and jointlyproduce outputs which can assist policy making in BRICScountries.
It recommends that BRICS-TERN can undertake studieson best practices adopted by their respective governments andshare these practices to identify gaps for further training andcapacity building of the negotiators. It should seek to enhancepublic participation in economic policy-making and on mattersof economic governance through network-based policyresearch and advocacy on trade and regulatory issues includingcompetition law, investment policies and economic diplomacy.
India’s Experiences on Preferential Trade Agreements xi


1Introduction
International trade continues to be a universally acceptableengine of a country’s socio-economic development and
economic growth. Trade has helped India in its economicdevelopment through harnessing global economic asymmetries,reducing economic vulnerability, environmental sustainability,mobilising financial and natural resources and creating avenuesfor development infrastructure in both rural and urban areasthereby creating welfare effects.
Trade and globalisation is not new to India. Its economichistory can be traced to the period of Indus Valley Civilisation(3000-1500 BC) when people practiced agriculture,domesticated animals, traded with other cities, and followedexcellent urban planning. India had the world’s largesteconomy from the 1st to the 18th century. It had a 32.9 percentshare of world’s Gross Domestic Product (GDP) in the 1st
century and 28.9 percent in 1000 AD. In 1700 AD, it wasestimated to be 24.4 percent.1
Moreover, an overview of independent India reveals thattrade openness and reforms have largely contributed todevelopment. In the early years of post-independence era, Indiawitnessed a growth rate of around three-four percent. Thistrend continued to around three decades till it crossed thefigure of five percent in the 1980s.

2 India’s Experiences on Preferential Trade Agreements
Owing to India’s policy of non-alignment, the nationalleadership set forth to build the economy through dedicatedpolicies aimed at self-sufficiency. At the time when Indialaunched its first five year plans, agriculture was the mainstayof the economy with its contribution of approximately 55-56percent of the country’s GDP. The rural-urban ratio of thepopulation was such that more than 70 percent of thepopulation lived in rural areas. Other indicators like per capitaincome were very low. A life expectancy of 32 years at thetime of birth and a literacy rate of merely 18 percent explainsthe level of development at that time, thus making it easy toclassify India as a poor country then.
Such nuances can well be supported by other data like grossdomestic savings which was about 8 percent of the GDP andexports which were approximately six percent of the GDP.Till the 1980s that is before the reforms, government regulationand control of economic activity was pervasive, and the tradesector did very poorly. One consequence was that importswere highly restricted and their scarcity was itself a majorconstraint on growth.2
India faced a severe balance of payment (BoP) crisis in thelate 80s and early 90s which compelled it to secure a US$1.8bnloan from International Monetary Fund (IMF). This landmarkevent created a new chapter and marked the beginning ofeconomic reforms in 1991 initiated by Prime MinisterManmohan Singh who was then the Finance Minister of thecountry.
The reforms were comprehensive and structural in natureand made meaningful contribution in accelerating the overallgrowth of the economy. Often described as one of the mostcomprehensive economic reforms in Asia, it included amongstothers, economic liberalisation, deregulation, privatisation ofstate-owned enterprises, and increasing opportunities forforeign investments.

India’s Experiences on Preferential Trade Agreements 3
In the first phase of liberalisation till 1997, the economygrew at more than seven percent per annum owing to growthin industrial and services sector, while it grew at an averageof close to nine percent in the few years preceding the globalrecession. For instance, the real GDP registered a growth ofnine percent in 2007-08 as compared to 9.4 in the previousfiscal, especially owing to the increased activities in themanufacturing sector and the growth of the services sector.The growth rate, however, declined to 7.1 percent during2008-09 as a result of global economic slowdown. Though,the growth rate declined during this period, India maintainedits resilience during those turbulent times. It is noteworthythat the growth rate was 7.8 percent in the first quarter of2011 over the same quarter, previous year.
From 2004 until 2010, India’s average quarterly GDPgrowth was 8.4 percent reaching a historical high of 10.1percent in September 2006 and a record low of 5.5 percent inDecember 2004.3 The services sector makes the highestcontribution to GDP (55.3 percent), while the share of industryis 28.6 percent and that of agricultural sector is 16.1 percent.4
India has always played a significant role in the evolutionof international trading systems; and its economic diplomacyhas been influencing the direction of trade policies at all levels.And thus, being an open economy, India maintains a vibranttrade policy with an urge to enhance its global engagements.The country’s total merchandise exports account forUS$176.76bn; with UAE (US$25.41bn), US (US$19.12bn) andChina (US$10.37bn) being its top three export destinations asof 2009. Moreover, its world imports account for US$266.4bnwith its top three sources of imports being China, UAE andUS accounting for US$30.61bn, US$19.73bn, and US$15.99bnrespectively. In its participation in international trade, Indiahas an unfavourable Balance of Trade (BoT) of US$89.63bn;and on a bilateral level, it has a positive BoT with UAE

4 India’s Experiences on Preferential Trade Agreements
(US$5.68bn), Netherlands (US$4.48bn) and US (US$3.12bn),among few others; while with China and Saudi Arabia, amongothers it has a negative trade balance of US$20.24bn andUS$10.62bn respectively.5
India has been able to position itself strongly in the globaleconomic order owing to the evolutionary nature of its foreigntrade policy. The present foreign trade policy covering theperiod of 2009-14 aims to provide a stable and conduciveenvironment for increasing exports. Some of its key objectivesinclude: 25 percent annual growth in exports by 2014, doubleIndia’s share in global trade by 2020, improving export relatedinfrastructure, reducing transaction costs through tradefacilitation measures, and securing enhanced market access,among others. It also aims to for diversification of exportmarkets with focus on new markets like Africa, Latin America,Oceania and the CIS.
Investment has also played a crucial role in the country’sdevelopment. The consolidated FDI policy of India waslaunched in March 2011 ‘with the intent of promoting foreigndirect investment through a policy framework which istransparent, predictable, simple and clear and reducesregulatory burden the Government of India introduced aconsolidated FDI policy. The system of periodic consolidationand updation was also introduced as an investor friendlymeasure’.6
In India FDI can come through ‘automatic route’ or through‘government route’. The magnitude of FDI in different sectoris also defined by this policy. A look at the sectoral descriptionreveals how investment is affecting development in India:
Agriculture and Animal Husbandry: 100 percent FDI hasbeen allowed through automatic route in the activities viz.floriculture, horticulture, cultivation of vegetables &mushrooms under controlled conditions; development andproduction of seeds and planting material; animal husbandry

India’s Experiences on Preferential Trade Agreements 5
(including of breeding of dogs), pisciculture, aquaculture undercontrolled conditions; and, services related to agro and alliedsector.7
Mining: 100 percent FDI has been allowed throughautomatic route in the following activities: a) mining andexploration of metal and non-metal ores including diamond,gold, silver and precious ores8, b) coal & lignite mining forcaptive consumption by power projects, iron & steel andcement units9, c) setting up coal processing plants likewasheries10, and, d) mining and mineral separation of titaniumbearing minerals & ores, its value addition and integratedactivities.11
Electricity Generation, Transmission and Distribution: 100percent FDI has been allowed through automatic route in thefollowing activities: a) generation and transmission of electricenergy produced in hydroelectric, coal/lignite-based thermal,oil-based thermal and gas-based thermal power plants, b) non-conventional energy generation and distribution, c) distributionof electric energy to households, industrial, commercial andother users, and, d) power trading.12
Petroleum and Natural Gas Sector: 100 percent FDI hasbeen allowed through automatic route in the activities likeexploration activities of oil and natural gas fields, infrastructurerelated to marketing of petroleum products and natural gas,marketing of natural gas and petroleum products, petroleumproduct pipelines, natural gas/ pipelines, LNG regasificationinfrastructure, market study and formulation, and, petroleumrefining in the private sector.13
Development of Townships, Housing, Built-upinfrastructure and Construction-Development projects: 100percent FDI is allowed through automatic route in the areasof developing townships, housing, built-up infrastructure andconstruction development projects (which would include, butnot be restricted to, housing, commercial premises, hotels,
6 India’s Experiences on Preferential Trade Agreements
resorts, hospitals, educational institutions, recreationalfacilities, city and regional level infrastructure).14
Development of Industrial Parks: 100 percent FDI isallowed through automatic route in the areas of bothdeveloping new and existing Industrial Parks.
Telecommunication: 74 percent FDI is allowed in the sectorof which 49 percent is allowed through automatic route. Anyinvestment above 49 percent but upto 74 percent is allowedonly through the government route.15
Trading related activities: 100 percent FDI throughautomatic route has been allowed in trading activitiespertaining to cash & carry trading, e-commerce marketingand test marketing.
E-Commerce: FDI up to 100 percent is permitted for e-commerce activities subject to the condition that suchcompanies would divest 26 percent of their equity in favourof the Indian public in five years, if these companies are listedin other parts of the world.16
Food Processing: 100 percent FDI is allowed in the sectorthrough automatic route.
The multilateral trading system may be the first best optionfor achieving an efficient outcome via global welfaremaximisation. However, with the impasse in the Doha round,countries are increasingly engaging in PTAs to realise benefitsthrough trade and integration. Apart from the economicbenefits, PTAs have been seen to contribute in enhancingpolitical ties and friendly relations among member countrieswhich may also contribute towards a breakthrough inmultilateralism. The measures of economic integrationundertaken by India has also played a vital role in the processof development especially through increased liberalisation andbetter market access opportunities for India. India hasconcluded several Preferential Trade Agreements (PTA), FreeTrade Agreements (FTA) and Comprehensive Economic

India’s Experiences on Preferential Trade Agreements 7
Cooperation Agreements (CECA) and is also negotiatingseveral others.
The successive part of this paper discusses India’snegotiating process on PTAs, and also evaluation and analysesof negotiating process and the preparedness. The next part ofthe paper deals with negotiation process and the countryexperiences. Further, the cost and benefits analyses of selectPTAs of India have been undertaken and various econometrictechniques like Revealed Comparative Advantage (RCA)index17 , Intra-industry Trade (IIT) index18 , TradeComplementarity Index (TCI)19 and an augmented gravitymodel of trade have been used. The analysis also includes thosefor BRICS countries.

2India’s Negotiating
Process on PTAs
India has always supported the cause of multilateralism andoften adopted a cautious approach to forming PTAs. Though
modest in outcomes, such an approach characterises most ofthe economic decisions India has made since its independence,opting for a mixed economy frame work, rather than goingfor the extremes.
The post-Cold War era prompted many developingcountries to form regional congregations and enter intoregional trade agreements (RTAs) and PTAs at a fast pace.This activity stemmed from the perception that those non-aligned to regional groupings were losing out on economicgains from PTAs, even though these agreements were inviolation of the basic tenets of WTO, i.e. Most FavouredNation (MFN) and National Treatment. Similarly, it can beargued that India too resorted to preferential trading as adefensive strategy against loss of markets, rather than as aproactive strategy to expand markets.
India’s approach to international trade has mostly been thatof increasing liberalisation, while its belief in multilateralismonly allowed it to sign a handful of PTAs, and operationalisingeven fewer. Initially such agreements were largely governed

India’s Experiences on Preferential Trade Agreements 9
by geo-economic reasons and were not merely economicinstruments. In the contemporary context, India’s impetus tomore such preferential agreement can, to a considerableextent, be attributed to the slow progress under World TradeOrganisation (WTO) and the intangibility of associatedbenefits. This is largely because the Doha Agenda has beengenerating too much political scrutiny domestically andagreements like PTAs seem to offer a less complicated pathwayto trade openness.
India’s negotiation process on PTAs can well be understoodby evolution pattern of such negotiations and evaluating theneed for preparedness.
Evolution of India’s PTA NegotiationsIndia’s approaches to negotiating PTAs have evolved over
time in the direction of greater methodological sophistication,more systematic procedures and attention to economicrewards. There is more emphasis on the establishment andachievement of comprehensive economic goals, as opposed tothe mere enhancement of trade in goods and services. Thishas defined India’s negotiation stances especially in cases ofComprehensive Economic Cooperation Agreements (CECA)in which it has shown keen interest in recent years.
India’s engagement in PTAs can be broadly divided intotwo phases. The first phase entails the formation of PTAs as aresult of various political considerations and the prevailinginternational setting. Agreements that were formed on thisbasis include the India-Bhutan Treaty (1949), India-NepalFriendship Treaty (1950)20 and the Bangkok Agreement(1975).21 Economic considerations and incentives were notthe primary motivations behind the initiation of negotiationsfor these agreements. In addition, stakeholder consultationsbefore or during the negotiation process were almost absentin reaching these agreements.
10 India’s Experiences on Preferential Trade Agreements
The second phase saw the emergence of economic issuesduring the consultation process. The inclusion of these issueswas initiated in the third round of SAARC Preferential TradeAgreement (SAPTA) negotiations. In the initial part of thisphase, the consultation process was largely limited to Centralgovernment ministries and apex chambers of commerce, atrend that continued into the fourth round of negotiations onSAPTA. However, in both the aforementioned rounds,negotiations and consultations were not guided by any ex-ante economic analysis of costs and benefits from the proposedagreement.
India’s first FTA, the India-Sri Lanka FTA (ISLFTA) wassigned in December 1998, and originated from geopoliticalfactors. Neither was an ex-ante cost and benefit analysis carriedout, nor were there broad based stakeholder consultations inthe negotiation of this agreement. A Joint Committee wasestablished only at the ministerial level in order to review theprogress of the agreement every year. The Committeenominated one apex chamber from each country as a nodalchamber to represent the views of the industries. The successof ISLFTA has paved the way for deepening the engagementby including services and investments through aComprehensive Economic Partnership Agreement (CEPA).CEPA negotiations are ongoing since 2005 after a Joint StudyGroup (JSG) recommended it in 2003. Though negotiationswere concluded in 2008, but were again resumed in December2010 owing to some reservations from Sri Lankan side.
Another important agreement is the Bay of Bengal Initiativefor Multi-sectoral Technical and Economic Cooperation(BIMSTEC). It is an important element in India’s ‘Look East’policy and was signed in February 2004. It marked the firstinstance of involvement of academia, business and Governmentin the Group of Experts (GoE) laying out the contours of thenegotiation and the Framework Agreement itself.

India’s Experiences on Preferential Trade Agreements 11
The India-Thailand FTA was signed in October 2003. Itestablished a Joint Working Group (JWG) to draft theFramework Agreement.22 This development marks an advancefrom the BIMSTEC Agreement. For the first time, a feasibilitystudy comprising Computable General Equilibrium (CGE)modelling and Revealed Comparative Advantage (RCA)analysis was carried out to assess the possible impact of theproposed agreement. This agreement also marked thebeginning of extensive stakeholder consultations prior to theFTA, which have subsequently been integrated into thepreparedness strategies for all FTAs.
The PTA between India and Mercado Común del Sur(MERCOSUR), was signed in January 2004. MERCOSURcomprises of Argentina, Brazil, Paraguay and Uruguay. Besidestrade in goods, it also has considerable focus on RoO. Beforethe signing of PTA, a comprehensive feasibility study wascarried out.
In 2005, India signed CECA with Singapore, known asIndia-Singapore CECA. A JSG was set up in 2002 to study itsfeasibility which submitted its report in 2003 andrecommended the launching of negotiations.
In 2009, the India-ASEAN FTA was signed.23 It providesan interesting insight into India’s negotiation process. Therewere many stumbling blocks in the process mainly due to thefact that this was the first time India was negotiating a tradingagreement with a regional trading bloc that was not a CustomsUnion.24 This meant that negotiations on tariff lines provedto be extremely complicated as every nation in the regionalbloc had to individually agree to Indian tariff proposals andvice-versa.25
Most recently, that is, in February 2011, India entered intoCECA with Malaysia. The negotiations took time owing tosome critical issues which needed deeper negotiations. Theywere the issues like movement of persons which happened to
12 India’s Experiences on Preferential Trade Agreements
be a key concern to New Delhi, while palm oil was an issuefor Malaysia, which sought significant tariff reduction in thiscommodity. It may be noted that India is one of Malaysia’sbiggest markets for palm oil. Stakeholder’s consultations wereheld and Joint Study Group was also constituted to do afeasibility study.
The history of India’s negotiation of PTAs reveals that apartfrom the evolution of stakeholder involvement in theformulation of PTAs, there have been developments alongother lines. However, India’s urge for a higher degree ofeconomic diplomacy in its neighbourhood does continue.India’s market should be available to all its smaller neighboursif we are to develop common stakes in regional prosperity.26
Evaluation and Analyses of Negotiating Processand Preparedness
Though the negotiation process suggests that India has madeconsiderable advances, yet there are still room forimprovement in the preparedness for such negotiations. Anevaluating of India’s negotiation process highlights severalissues and also presents the scope of improving preparedness.Such issues need to be given pragmatic impetus by the Tradeand Economic Relations Committee (TERC), Government ofIndia. This committee, constituted in May 2005 is directlyheaded by the Prime Minister and has supervised thenegotiations on recent/proposed PTAs and also taken a stockof the progress of existing PTAs like India-Chile PTA.
First and foremost, preparedness and consistency innegotiations is desired. The rapid transfer of personnel alsodeters the formation of an expert group on negotiation. Thus,a better Human Resource Planning (HRP) in the Ministry isrequired to enhance preparedness.
It is generally observed that enough time is not spent inanalysing sectoral complexities. The key stakeholders in the

India’s Experiences on Preferential Trade Agreements 13
negotiation process which include the corporate houses arealso generally not equipped enough to provide inputs worthconsidering to the government during the negotiation process.A series of multi-stakeholder meetings need to be organised,and their inputs be further analysed. It is important thatinformation available in the public domain on negotiationsshould be updated regularly. Also, a standard templatecontaining a core set of questionnaire relating to each sectorshould be developed for the purpose of stakeholderconsultations.
Moreover, there is a need to develop a roster of institutionsand individuals capable of conducting country and sector-specific studies. Instead of assigning all such studies to a fewselect institutions, competition should be encouraged amongservice providers listed in the roster through an open biddingprocess.27
Importantly in PTAs/FTAs, the benefits are not limited togains from trade in goods. Spin offs from a PTA/FTA couldoutweigh the apparent trade benefits and will have to beadequately factored in. These spin-offs may be in the form ofbetter investment opportunities (as in the case of the Indo- SriLanka FTA); ease of visa procedures (Indo-Singapore CECA)and the like. It is important to gauge these spin-offs on an ex-ante basis prior to starting negotiations.
Prior market analyses in prospective partner countries aregenerally not conducted by India. This could bias evaluationof the feasibility of the agreement, thereby resulting in sub-optimal outcomes of negotiations. In one instance, South Koreacommissioned Indian research organisations to carry out India-specific analyses. It is suggested that the Indian governmentshould do the same in prospective partner countries.
Planning and management of the negotiation of each PTAshould be improved. For instance, a greater role should beplayed by the Indian Embassy in each country in gathering

14 India’s Experiences on Preferential Trade Agreements
information that may not be readily available to the researchorganisation conducting the study. There should be greatercoordination between the former and the latter. Similarly, thereshould be better coordination between the ministries ofExternal Affairs and Commerce throughout the negotiationprocess.
Though, India’s negotiation strategies have come a long wayand improved greatly over the years with PTA negotiationsnow following a systematised process, yet there is much scopefor improvement to match prospective partners. Someexamples of best practices in negotiations can be adopted fromnegotiators like the European Union (EU) which follow acomprehensive process encompassing detailed market studies,sectoral complexities and keen attention to multi-stakeholdersconsultations.

3Negotiation Process andthe Country Experiences
Having discussed the evolution and the need forpreparedness in negotiating PTAs, it is vital to
understand the nitty-gritty of an ideal negotiation process. Also,the lessons from country experiences in negotiating PTAs canbe beneficial for keeping a track of best practices in suchnegotiation processes.
An Ideal Negotiation ProcessStephen Hoadley, Professor of Political Studies at the
University of Auckland uses his detailed study of the NewZealand-Singapore FTA to sketch out an ideal negotiationprocess. This FTA was also known as the Closed EconomicPartnership (CEP) Agreement. The various elements of thelarger process in which negotiations are couched are describedby Hoadley as follows:
1. Identification of a Trade Problem: According to Hoadley,the persistence of a problem leads to the recognition that thestatus quo is unsatisfactory.28 New Zealand had been facedwith the problem of an insecure market for its agriculturalproducts throughout the three decades preceding thementioned agreement.29

16 India’s Experiences on Preferential Trade Agreements
New Zealand tried unsuccessfully through the GATT inthe 1980s and 1990s to get barriers facing the exports of itsagricultural products lowered. In 1999 after severalunsuccessful attempts, New Zealand’s trade access tointernational markets (except Australia) was still largelyrestricted. Thus, the existence of a trade problem leads tonegotiations. This also hints at one primary reason for theproliferation of new style PTAs – the impasse at the Doharounds.30
2. Diagnosis Phase: The diagnosis phase begins when theawareness of a problem stimulates the country’s governmentinto action – identifying the possibility for and then defining anegotiation with a specific country which can solve thementioned problem.
In the case of New Zealand, the frustration of not beingable to overcome barriers to agricultural trade was recognisedat a luncheon meeting in Wellington on July 01, 1999 attendedby New Zealand’s trade minister, Lockwood Smith; hiscounterpart from Singapore, George Yeo; and New Zealand’sformer Minister of Finance, Sir William Birch. After listeningto the outpouring of frustrations on both sides Birch suggestedthat New Zealand and Singapore should go in for a bilateralFTA. Birch’s solution can be labelled as a ‘diagnosis’. Diagnosisinvolves the identification of a country which is complementaryto the initiating country in both economic interests and othercharacteristics.
3. Pre-negotiation Stage – Setting the Agenda: The pre-negotiation stage is best described in Hoadley’s own words:“In the pre-negotiation phase, the parties confirm thatnegotiation is the best way to proceed, establish what theyhope to achieve and decide what they will negotiate aboutand how. In this phase they clarify and prioritise options, set

India’s Experiences on Preferential Trade Agreements 17
parameters, establish boundaries, choose participants andassess each other’s likely demands”
In the case of the FTA between New Zealand andSingapore, the pre-negotiation phase began on August 11, 1999with both officials from New Zealand and Singaporereaffirming their commitment in the multilateral trading systemand wish to remain consistent with the rules of the WTO andAsia Pacific Economic Cooperation (APEC) – free trade andinvestment by 2010-2020.
New Zealand officials then set the ball rolling by proposingthe major elements of the potential FTA which include a)elimination of all tariffs, b) under RoO minimum local contentof 50 percent to qualify as duty free in the other country, c)nil export restrictions except those allowed by WTO underArticle XX, d) removal of all subsidies on both sides, e) replaceanti-dumping laws by competition laws, f) no nationalprocurement requirement, g) a mutual recognition agreement,and, h) free trade in all services.
The responses from Singapore to each of these proposalsrespectively, were as follows: a) agreed; except that it wouldcontinue to retain levies on alcoholic beverages for socialreasons, b) minimum local content of 20 percent, c) agreed,d) wanted to retain subsidies for domestic supportprogrammes, e) had problem with adopting competition lawsas Singapore had no experience with these, f) wanted to retainthe right of government procurement, g) agreed, and, h) waskeen to protect some of its services.
In a way, therefore, the pre-negotiation phase serves tonot only flag the main issues of interest for both countriesgoing in for an agreement but also helps to identify the issueswithin these over which there is agreement and therefore thoseon which there is no agreement.

18 India’s Experiences on Preferential Trade Agreements
4. Negotiation: According to Hoadley, the following are theelements associated with formal full scale negotiation:
Strategies – These are general plans adopted by negotiatorsto achieve certain objectives. For example, it includes:
• avoidance of thorny issues• yielding or a show of meeting the other party half way
on some issues by initially adopting a stand which ismore extreme than what one really believes in – thisallows the striking of bargains on other issues
• contending to intentionally oppose certain proposals sothat any moderation of stand seems like a majorconcession
• problem solving, that is, cooperation with the other sideto arrive at an agreement on an issue on which there isinitially a major disagreement
Tactics – These are actions used which are components ofa strategy. For example, requests, proposals, offers,concessions etc.; and others such as rhetoric, warnings, threats,bluffs and displays of good faith.
There were compromises and adjustments made on bothsides. New Zealand did manage to get certain concessionsfrom Singapore and ended up also granting some. Theconcessions that New Zealand exacted included an improvedaccess to Singapore’s service market, a single New Zealand/Singapore procurement market, more stringent rules of origin(RoO) than originally agreed to by Singapore, less threateninganti-dumping provisions etc.
Among the concessions obtained by Singapore from NewZealand were: access to electrical and electronic equipmentwithout further testing; elimination of tariffs onpetrochemicals, electrical and machinery products; investmentfacilitation etc. On the other hand, there were deferrals –wishes made by each side which were not granted by theother.31 This illustrates that negotiations involve give and take

India’s Experiences on Preferential Trade Agreements 19
to arrive at an agreement. Underlying any agreement arecompromises, adjustments and deferrals made during theprocess of negotiation.
5. Legitimation: The negotiation phase ends when thenegotiators have agreed on a text. But for the formal adoptionof an agreement it has to be accepted politically.
However, legitimation can be explained through a two-stage game.32 Democratic governments striving to reachinternational agreements have to negotiate with leaders ofdomestic political parties and interest groups as well as withtheir foreign counterparts. Therefore, the acceptance of anagreement can only be achieved if there is broad consensus inthe stands taken by foreign counterparts and domestic leaders.It is in this way that citizens in a democracy get to influencethe content of the agreement.
In the case of the New Zealand-Singapore agreement thelegitimation phase began when the New Zealand governmentendorsed the text of the CEP Agreement on August 23, 2000.The Cabinet then released a briefing paper, National InterestAnalysis and a cost-benefit assessment to the Parliament andpublic.
As the second step in the legitimation process the CEPAgreement was submitted to the Parliament where it wasdebated. It was then referred to the Select Committee onForeign Affairs, Defence and Trade, which, in turn, invitedwritten submissions from the public. The Committee alsoconducted oral hearings of its members and conveyed to theParliament that a majority of its members had endorsed theagreement. On the basis of the endorsement, the Parliamentconducted a debate and then voted 89 to 30 to take notice ofthe recommendations of the Select Committee’s report on theagreement.33

20 India’s Experiences on Preferential Trade Agreements
With the completion of this step in the legitimation phase,the New Zealand Cabinet approved the draft agreement. Then,a week later, on November 14, 2004, New Zealand andSingapore signed the CEP agreement.
6. Ratification: The facilitation of the agreement requiredcertain legislative changes which were introduced to theParliament in the form of the CEP Bill. Since only the requiredlegislative changes constituted the bill and not the surroundingclauses of the agreement it seemed quite harmless. There werethree statutes and a regulation as follows:
• amendment of Tariff Act to eliminate all tariffs onimports from Singapore
• raising of the threshold for legitimacy of anti-dumpingclaims from two to five percent
• waiving of the residency requirement for Singaporeengineers
• legal change to lower the content requirement for animport to be classified as belonging to Singapore
Given the harmless nature of the bill, it was easily passed.Though the above discussion provides the stage-wisedescription of the ideal negotiation process, yet there areaspects to negotiations like human capital formation,preparedness etc. that cannot be captured through suchdescription of stages.34
Below are the lessons which can be taken from theexperiences of different countries/regions:
Lessons from Country/Regional ExperiencesThe ASEAN Experience
• The most important lesson from the Association ofSoutheast Asian Nations (ASEAN) experience is forleaderships to give primacy to economic issues and not
India’s Experiences on Preferential Trade Agreements 21
allow political differences to stand in the way of regionalcooperation.
• It is necessary that negotiators have a positive attitudetowards greater openness especially in situations wheretrading relations among neighbours are not welldeveloped. In the case of ASEAN countries, largenegative lists, limited number of concessional tariff lines,restrictive RoO, exclusion of services, non-tariff barriers(NTBs) etc., changed in favour of greater opennessbecause of the cooperative attitude of negotiators on allsides. This happened despite great differences ingovernance structures and outlooks.
Lessons from Singapore’s ExperienceSingapore is at present involved in signing or negotiating a
number of FTAs/PTAs with a large number of countries, bothdeveloping and developed. It has been successful in negotiatingagreements and thus its experience is of immense value toIndia.
The International Affairs Division of Singapore came upwith a strategy for the negotiation process in 2007 which hasthe following components:
• The delegation will be led by a Chief Negotiator withteams in charge of specific areas of the FTA
• During the negotiations, two or three or even more ofthese teams may be meeting their counterpartsconcurrently in parallel sessions
• The Attorney-General’s Chambers will assign one ortwo legal officers to the Singapore delegation negotiatingeach FTA
• The legal officers assigned will not only be providingadvice and assistance to a particular negotiating teambut will also head the team in charge of negotiating thegeneral, institutional and dispute settlement chapters ofthe FTAs35

22 India’s Experiences on Preferential Trade Agreements
These lessons are valid for any FTA negotiation process.Five pointers which legal officers should bear in mind include:
• Get into the details: Since a typical FTA covers such awide range of issues, mastering technical details is adaunting task for any legal officer which one mustnevertheless endeavour to do.
• Build relationships: The building of good workingrelationships with your negotiating counterparts is veryimportant because most FTA negotiations span manyrounds and many months and one often has to deal withcounterparts repeatedly. Good working relationshipslead to a higher degree of trust among the individualsinvolved which in turn, facilitates the negotiationprocess.
• Be flexible: Sometimes clauses which are standard inother FTAs might not work for a particular FTA undernegotiation in terms of catering to the interests of thedomestic stakeholder groups of a country as well as itsnegotiating partner country.
• Watch out for precedents set: While there is a need tobe flexible about the texts of FTA provisions, one mustalso realise that what one agreed to give to one FTApartner would be difficult to refuse to another tradingpartner in a subsequent FTA negotiation.
• Manage the documentation: The better the maintenanceof records of the previous rounds, the easier it will befor the new legal officers to handle subsequentnegotiations.
Thus, the above directives lay a lot of stress on specialisationand mastery of details and at the same time flexibility andpositive thinking.

India’s Experiences on Preferential Trade Agreements 23
The South African Experience with the TradeDevelopment and Cooperation Agreement (TDCA)Negotiated with the EU
This agreement has been in force since 2000 and offersvaluable lessons for other developing countries. From a studyof the South African experience, it is apparent that the successof negotiations depends upon sufficient and informed politicalsupport.36
The political momentum led to defining of objectives fornegotiations as a part of the national development strategywhich was based on sound political backing, and theestablishment of comprehensive coordination mechanisms forthe conduct of negotiations. This ensured that negotiationswere not only given an important place in the developmentstrategy of South Africa but were supported by informationand human capital through a variety of mechanisms whichensured that the objectives of the development strategy wereindeed met.37

4Cost and BenefitAnalysis of PTAs
Though India has recently been engaging in various PTAsat bilateral and regional level, yet compared to other
countries, India’s involvement in PTAs has been rather modest.A large share of its trade occurs through the multilateralchannels indicating that trade through multilateral channelsmay be the best option for India despite the surge in PTAs inrecent years.38
Nevertheless, PTAs may offer various benefits beyondeconomic ones, such as, deep political, diplomatic ties as wellas peace dividends. In any case economic gains still hold centreplace among many PTAs as indicated by the inclusion ofvarious schemes to protect certain sectors.
Among the few PTAs that India has been engaged in, thissection looks at some selected ones, namely, South Asia FreeTrade Agreement (SAFTA), ISLFTA, India-Singapore CECA,India-ASEAN FTA, India-Malaysia CECA, and India-MERCOSUR PTA, to analyse the costs and benefits of suchengagement for India. A large share of India’s trade is withcountries with which it does not have a preferential tradingagreement.

India’s Experiences on Preferential Trade Agreements 25
In 2009-10, the combined share of MERCOSUR, SAFTAand Singapore in India’s exports stood at 10.5 percent, upfrom 6.33 percent in 1999-00, while the corresponding sharein India’s imports was only 4.2 percent declined from 4.5percent over the decade. On the contrary, the export andimport shares of its major partners, EU (27), US, ASEAN andChina were 47.72 and 38.8 percent respectively in 2009-10(Tables 2 and 4).39
While accurate measurements of cost and benefit fromPTAs are difficult due to a range of factors and criss-crossingoverlaps of bilateral, regional and plurilateral PTAs, a fairdiagnosis can be made through examination of some keyindicators as well as the gravity trade model. Key indicatorslike Intra-Industry Trade (IIT) index, Trade ComplementarityIndex (TCI) and Revealed Comparative Advantage (RCA)index have also been calculated for the same.
Further, two key export sectors of India – textiles &clothing (T&C) and the spice sector – are studied to understandhow PTAs have affected them. Moreover, the treatment ofsome important issues like intellectual property rights, tradeand environment, trade and social standards, competitionpolicy, trade facilitation, and government procurement in acountry’s PTAs have also been discussed.
India’s Engagement with PTAsSouth Asian Free Trade Agreement
SAARC Preferential Trading Agreement (SAPTA) wasinitiated by the SAARC member countries in 1993 (andoperationalised in 1995) to promote trade liberalisation on apreferential basis. During the 12th SAARC Summit inIslamabad in 2004, SAFTA was signed with the aim ofenhancing mutual trade and cooperation. SAFTA came intoeffect from January 01, 2006 and Afghanistan joined in as theeighth member in 2008.

26 India’s Experiences on Preferential Trade Agreements
Exports from India to SAFTA were recorded atUS$8391mn during 2009-10 while imports were US$1657.4mn(Tables 1 and 3). Average annual growth rates for Indianexports and imports to SAFTA during 1999-00 and 2009-10were 21 and 17 percent respectively.40
SAFTA accounts for only about 4.69 percent of India’sexports and a meagre 0.6 percent of its total imports.41 WithinSAFTA in the year 2009-10, Bangladesh, Sri Lanka, Pakistanand Nepal account for 29, 26, 19 and 18 percent respectivelyof India’s exports while their shares in Indian imports fromSAFTA are 15, 24, 17 and 27 percent respectively. India hasseparate bilateral trading agreements with all these countriesexcept Pakistan.
Bangladesh: Considering that Bangladesh has not offeredany substantial tariff and non-tariff concessions to Indianexports, there remains a large potential for Indian exports topenetrate the Bangladeshi market.
India’s top three exports to Bangladesh include cotton,edible vegetables and certain roots and tubers and vehiclesother than railway or tramway rolling stock, and parts andaccessories thereof. Bangladesh has global comparativeadvantage in the following sectors: Vegetable textile fibresnes, paper yarn, woven fabric (114.01); Articles of apparel,accessories, knit or crochet (39.04); Articles of apparel,accessories, not knit or crochet (32.80) (Table 11). There ismoderate trade complementarity between India and Bangladeshas reflected from the TCI calculations which stands at 48percent (Table 16).
Nepal: The exports basket to Nepal is changing over theyears from Mineral fuels, oils and distillation products makeup which constituted 35 percent of India’s exports to Nepalin the year 2007 excluding petroleum products, rice is the

India’s Experiences on Preferential Trade Agreements 27
country’s top export product to Nepal followed by cementsand medicines. Under the Indo-Nepal treaty of trade, Nepalesemanufactured goods receive duty free non-reciprocal accessto India’s markets subject to RoO.42
Considering that carpets, particularly woollen carpets areNepal’s top most exports, and India also has a comparativeadvantage in this sector, Nepal has imposed an ad valoremtariff equivalent of 24.7 percent. However, Nepal is losing itscompetitive edge in this sector due to its own internal supplyconstraints, while India has managed to increase carpet andtextile floor covering exports to the rest of the world at anannual growth rate of 11 percent over 2001-2010. Moreover,Indian carpet and textile floor covering exports to Nepal haveexperienced a robust annual average growth rate of 349percent during 2001-2009.
India’s top three exports to Nepal include mineral fuels,mineral oils and products of their distillation; bituminoussubstances; mineral waxes, iron and steel, salt; sulphur; earthsand stone; plastering materials, lime and cement while animal/vegetable fats are India’s major import from Nepal. Nepal hasglobal comparative advantage in the following sectors Vegetableplaiting materials, vegetable products nes (362.21); Carpetsand other textile floor coverings (79.13); Vegetable textilefibres nes, paper yarn, woven fabric (46.98) in 2010 (Table13). There is high trade complementarity between India andNepal as reflected from the TCI calculations which stands at65 percent (Table 16) in 2010.
Pakistan: Trade between India and Pakistan remains modestdespite large potential for trade and investment cooperation.43
Export structures of the two countries are quite similar as thetop ten sectors in each of these countries in terms ofcomparative advantages. Another indicator of further tradeand integration potential is the relatively high intra-industry

28 India’s Experiences on Preferential Trade Agreements
trades between India and Pakistan vis-à-vis other South Asiancountries. This implies that although the two countries havecomparative advantages in similar industries, they havemanaged to diversify and specialise in differentiated productswithin those industries. India’s exports to Pakistan haveincreased from US$93mn in 1999-00 to US$1573mn in 2009-10 at an average annual rate of 40 percent. On the other hand,India’s imports from Pakistan have risen from US$68.2mn toUS$370.17mn in 2008-09 and which declined to US$275.94mnduring the same period at a growth rate of 22 percent.
India’s top three exports to Pakistan include organicchemicals; cotton; and man-made filaments, however,Pakistan’s top three exports to India are salt; sulphur; earthsand stone; plastering materials, lime and cement; edible fruits,nuts, peel of citrus fruit, and melons; and cotton. Pakistan hasglobal comparative advantage in the following sectors such asCotton (51.21); other made textile articles, sets, worn clothingetc. (45.90); Cereals (19.61) in 2010 (Table 13). There ismoderate trade complementarity between India and Pakistanas reflected from the TCI calculations which stands at 65percent (Table 16) in 2010.
Maldives: India’s top three exports to Maldives includeCereals, salt; sulphur; earths and stone; plastering materials,lime and cement and pharmaceutical products while, Maldives’top three exports to India are Iron and steel, Copper andarticles thereof, and Aluminium & articles thereof. Maldiveshas global comparative advantage in the following sectors suchas Fish, crustaceans, molluscs, aquatic invertebrates nes(128.42); Meat, fish and seafood food preparations nes (26.31);Residues, wastes of food industry, animal fodder (1.79) in2010 (Table 13). There is perfect trade complementaritybetween India and Maldives as reflected from the TCIcalculations which stands at 100 percent (Table 16) in 2010.

India’s Experiences on Preferential Trade Agreements 29
Due to India’s dominant position in the region, trade withalmost all of its partners has been lop-sided with India beingthe major trading partner for most of them. The high growthand shares of Indian exports in the imports of partners indicatesthat India has benefited from the export expansion of itsneighbours. Some of this Indian export expansion can beattributed to falling tariffs in partner countries – the resultwas trade diversion i.e. Indian goods replacing lower costproducts from non-SAFTA members.
India-Sri Lanka Free Trade Agreement (ISLFTA)The ISLFTA was signed in 1998 and operationalised in
March 2000. This FTA is based on ‘less than full reciprocity’as Sri Lanka has been given a larger share of concessions interms of the negative list and RoO along with a longer timeframe for tariff reduction. Owing to Sri Lanka’s already lowexisting tariffs and the generous concessions offered by India,Sri Lankan exporters appear to have benefited considerablymore than Indian exporters from this FTA. Although Indiahas managed to choose its negative list quite strategically, onesector which has experienced detrimental effects from ISLFTAis spices, which Sri Lanka pushed for removal from India’ssensitive list.
Following the FTA, Sri Lanka’s exports to India haveincreased substantially from pre-existing negligible levels.India’s exports to Sri Lanka have gone up from US$499mn toUS$2188mn during 1999-00 to 2009-10 registering an averageannual growth rate of 18 percent. Likewise, imports to Indiahave increased from US$44.2mn to US$392.2mn during thesame period, recording an annual average growth rate of 33percent. At present, India enjoys a trade surplus with Sri Lanka.However, in 2001, India’s average applied MFN tariff onmanufactured goods equalled 31.7 percent compared to 8percent for Sri Lanka.44

30 India’s Experiences on Preferential Trade Agreements
India’s top three exports to Sri Lanka include Mineral fuels,mineral oils and products of their distillation; bituminoussubstances; mineral waxes; Vehicles other than railway ortramway rolling stock, and parts and accessories thereof;Cotton while, Sri Lanka’s top three exports to India are Coffee,tea, mate and spices; Residues and waste from the foodindustries; prepared animal fodder; Rubber and articlesthereof. Sri Lanka has global comparative advantage in thefollowing sectors such as Coffee, tea, mate and spices (74.82);Vegetable textile fibres nes, paper yarn, woven fabric (51.64);Vegetable plaiting materials, vegetable products nes (21.86)in 2010 (Table 14).
There is high trade complementarity between India and SriLanka as reflected from the TCI calculations which stands at63 percent (Table 16) in 2009. The IIT index between Indiaand Singapore reveals that the intra-industry trade is the highestin Products of residues, wastes of food industry, animal fodder;Ships, boats and other floating structures; and Special wovenor tufted fabric, lace, tapestry etc. (Table 21) in 2009.
India-Singapore Comprehensive Economic CooperationAgreement (CECA) and India-ASEAN FTA
India’s first ever CECA agreement was signed withSingapore on June 29, 2005 and became operational fromAugust 01, 2005. In addition to a FTA in goods, the CECAhave three more components: trade in services, arrangementfor investment flows and an agreement for avoiding doubletaxation. A RoO clause with 40 percent local contentrequirement and change of classification at the 4-digit HS levelis also included. Moreover, there are detailed product specificrules for a long list of items.
Due to pre-existing zero MFN tariffs applied by Singapore,Indian exports to the Singapore market have not recorded asurge while imports from Singapore have increased three folds

India’s Experiences on Preferential Trade Agreements 31
since CECA enforcement. Exports from India to Singaporehave increased from US$4,001mn to US$7,592.17mn whileimports have gone up from US$2,651mn to US$6454.57mnover 2004-05 to 2009-10. In 2009-10, Indian exports toSingapore as a share of total Indian exports stand at 4.25percent while the corresponding import share is 2.2 percent,which is larger than its import shares vis-à-vis SAFTA andMERCOSUR.45
Singapore has increased its exports of high end electronicproducts to India, while India’s exports to Singapore areconcentrated in petroleum oils (HS 2710) which account for37.4 percent of total Indian exports to the country. Petroleumoil exports by Singapore also account for about 23.1 percentof its exports to India, while nuclear reactors, boilers,machinery, etc.; and electronic products make up 17.18 and17.86 percent respectively.
Singapore is currently the second largest foreign directinvestor in India with cumulative investment flows reachingUS$7934mn during April 2000 to April 2009.46 This was thefirst time India had entered into a bilateral agreement inservices. As a result, Singapore now has increased presence inthe construction, communication, business services, insuranceand banking sectors of India.
India’s top three exports to Singapore include Mineral fuels,mineral oils and products of their distillation, bituminoussubstances, mineral waxes; ships, boats and floating structures;and miscellaneous goods, while, Singapore top three exportsto India are Mineral fuels, mineral oils and products of theirdistillation; bituminous substances; mineral waxes; electricalmachinery and equipment and parts thereof; sound recordersand reproducers, television image and sound recorders andreproducers, and parts, nuclear reactors, boilers, machineryand mechanical appliances, parts thereof.

32 India’s Experiences on Preferential Trade Agreements
Singapore has global comparative advantage in the followingsectors such Commodities not elsewhere specified (4.51), Tinand articles thereof (4.37), Electrical, electronic equipment(2.66) in 2010 (Table 14). There is moderate tradecomplementarity between India and Singapore as reflected fromthe TCI calculations which stands at 50 percent (Table 9.1) in2010. The IIT index between India and Singapore reveals thatthe intra-industry trade is the highest in Products of Umbrellas,walking-sticks, seat-sticks, whips, etc., Articles of iron or steeland Salt, sulphur, earth, stone, plaster, lime and cement (Table21) in 2009.
India-ASEAN FTA was signed in 2009. It is supposedlyone of the most comprehensive FTAs negotiated by India inrecent times. India’s top three exports to ASEAN includecotton, mineral fuels, mineral oils and products of theirdistillation; bituminous substances; mineral waxes, ships, boatsand floating structures, and miscellaneous goods.
India top three imports from ASEAN are mineral fuels,mineral oils and products of their distillation; bituminoussubstances; mineral waxes; animal or vegetable fats and oilsand their cleavage products, pre edible fats, animal or vegetablewaxes; and electrical machinery and equipment and partsthereof, sound recorders and reproducers, television imageand sound recorders and reproducers, and parts. There ismoderate trade complementarity between India and ASEANas reflected from the TCI calculations of ASEAN countries.
The IIT index between India and ASEAN reveals that theintra-industry trade is the highest in Products of animal origin,nes, Headgear and parts thereof and Articles of iron or steel(Table 21) in 2009.
India-MERCOSUR PTAIndia signed PTA with MERCOSUR on January 25, 2004.
This was to be ratified in July 2007. Argentina, Brazil, Paraguay

India’s Experiences on Preferential Trade Agreements 33
and Uruguay are the founder members while Venezuela joinedlater. Unlike other PTAs, this was based on an offer list withreciprocal fixed tariff preferences. MERCOSUR will providepreferential access to 452 items while getting Indian marketaccess to 450 products in return.47 RoO, safeguard measuresand dispute settlement clauses are included in the agreement.
At the outset, a PTA with MERCOSUR potentially offersIndia market access to a region with a combined estimatedGDP of US$1tn and a population of about 200 million. Despitethe large markets of the two regions and dynamic growth rates,India’s export to MERCOSUR as a share of total Indianexports is only 0.63 and 1.55 percent respectively while thecorresponding import share is 1.4 percent during 1999-00 and2009-10.48
Over the last ten years (1999-00 to 2009-10), Indian exportsto MERCOSUR have increased from US$231mn toUS$2770mn while imports from MERCOSUR have gone fromUS$680.6mn to US$4131.4mn. Thus, at present India has atrade surplus with MERCOSUR. Not surprisingly, among theMERCOSUR countries, Brazil and Argentina account for 87and 10 percent of India’s exports to MERCOSUR respectively.
Likewise, 83 and 16 percent of India’s imports fromMERCOSUR originated from Brazil and Argentinarespectively in the above mentioned period. Since India’s MFNapplied tariffs are higher than those of MERCOSUR countries,exports from the region to India may possibly increase in somesectors.
India’s top three exports to MERCOSUR include mineralfuels, oils, distillation products, etc; organic chemicals;miscellaneous chemical products, While India top threeimports from MERCOSUR are mineral fuels, oils, distillationproducts, etc; sugars and sugar confectionery; animal, vegetablefats and oils, cleavage products, etc.

34 India’s Experiences on Preferential Trade Agreements
There is moderate to high trade complementarity betweenIndia and MERCOSUR as reflected from the TCI calculationswhich stands at 61 percent (Tables 15 and 16) in 2010. TheIIT index between India and MERCOSUR reveals that theintra-industry trade is the highest in products of cork andarticles of cork; explosives, pyrotechnics, matches, pyrophoric,etc. optical, photo, technical, medical, etc. apparatus (Table21) in 2009.
India and other BRICS countriesAn analysis of India and other BRICS countries reveals that
there exists potential for cooperation and deeper engagementamong the BRICS countries also.
Brazil: India’s top three exports to Brazil include mineralfuels, mineral oils and products of their distillation, bituminous;organic chemicals; electrical machinery and equipment andparts thereof, sound recorders and reproducers, televisionimage and sound recorders and reproducers, and parts, WhileIndia top three imports from Brazil are mineral fuels, mineraloils and products of their distillation; bituminous substances;mineral waxes; sugars and sugar confectionery; and iron andsteel. The trade complementarity between India and Brazil asreflected from the TCI calculations stands at 93 percent (Table15) in 2010. The IIT index between India and Brazil revealsthat the intra-industry trade is the highest in products ofinorganic chemicals, precious metal compound, isotopes,rubber and articles thereof and printed books, newspapers,pictures etc. (Table 20) in 2009.
Russia: India’s top three exports to Russia includepharmaceutical products; coffee, tea, mate and spices;miscellaneous edible preparations, While India top threeimports from Russia are fertilisers; mineral fuels, mineral oils

India’s Experiences on Preferential Trade Agreements 35
and products of their distillation, bituminous substances,mineral waxes and iron and steel. There is moderate tradecomplementarity between India and Russia as reflected fromthe TCI calculations which stands at 50 percent (Table 15) in2010. The IIT index between India and Russia reveals thatthe intra-industry trade is the highest in products of soaps,lubricants, waxes, candles, modelling pastes; Electrical,electronic equipment and miscellaneous chemical products(Table 20) in 2009.
China: India’s top three exports to China include ores, slagand ash; cotton; copper and articles thereof, While India topthree imports from China are electrical machinery andequipment and parts thereof; sound recorders and reproducers,television image and sound recorders and reproducers, andparts; nuclear reactors, boilers, machinery and mechanicalappliances; parts thereof; organic chemicals. There is moderatetrade complementarity between India and China as reflectedfrom the TCI calculations which stands at 50 percent (Table15) in 2010. The IIT index between India and China revealsthat the intra-industry trade is the highest in Products ofaircraft, spacecraft, and parts thereof; cocoa and cocoapreparations; products of animal origin, nes (Table 20) in 2009.
South Africa: India’s top three exports to South Africainclude mineral fuels, mineral oils and products of theirdistillation; bituminous substances, mineral waxes; vehiclesother than railway or tramway rolling stock, and parts andaccessories thereof and pharmaceutical products. India topthree imports from South Africa are natural or cultured pearls,precious or semiprecious stones, preview metals, clad withprecious metal and articles thereof, imitation jewellery, coin;mineral fuels, mineral oils and products of their distillation;bituminous substances; mineral waxes; ores, slag and ash.

36 India’s Experiences on Preferential Trade Agreements
There is moderate trade complementarity between India andSouth Africa as reflected from the TCI calculations whichstands at 50 percent (Table 15) in 2010. The IIT index betweenIndia and South Africa reveals that the intra-industry trade isthe highest in salt, sulphur, earth, stone, plaster, lime andcement; copper and articles thereof and cocoa and cocoapreparations (Table 20) in 2009.
Trade Creation and Diversion of India’s PTAsUsing an augmented gravity trade model with bilateral trade
flows between India and 166 trading partners over the 2000-2010 time periods, the trade creation and diversion effects ofIndia’s PTAs has been seen.49 However, it should be notedthat such trade creation and diversion effects of PTAs cannotbe related to welfare effects directly and many studies thathave looked at these effects have been inconclusive or haveproduced conflicting predictions depending on country andtime period coverage and model use. Nevertheless, the gravitymodel has become popular in studying the impact of RTAs/PTAs on trade flows, especially after the establishment oftheoretical foundations for using it.50
In the equations used in the study, Xij is exports fromcountry i to country j. Mij is imports from country i to countryj. GDPj is GDP of country j at constant US$2000. POPj ispopulation of country j. As India is the common trading partnerfor each country in the sample, we do not include GDP andpopulation figures for India. Dist. is the geographical distancebetween the trading partners i and j. The equation has beenaugmented using dummy variables. Comlang means commonlanguage; if the two countries share a common language, assign1 otherwise 0. Contig. means contiguity; if the two countriesshare a common border, assign 1 otherwise 0. Comcol meanscommon colony; if the two countries have been colony of thesame coloniser, assign 1 otherwise 0. Smctry means same

India’s Experiences on Preferential Trade Agreements 37
country; if the two countries were the same country in thepast, assign 1 otherwise 0. eij is the error term.
For analysis, only the PTAs where India has membership,namely SAFTA, BIMSTEC, MERCOSUR, Indo-Sri Lanka andASEAN FTA and Indo-Singapore CECA, have been includedas PTA dummies. In equation 1, PTA dummies take the value1 if country j is also a member of the PTA along with India. Apositive coefficient of the PTAs indicates trade creation. Itmeasures the impact on India’s exports to country j of countryj being a member of the PTA. Therefore, the as abovementioned, six PTA dummies have been included in theequation.
In the bilateral imports equation 2, all these six PTAdummies have been taken and have been assigned 1 only ifIndia is a member of that PTA and 0 if both India and countryj are members of that PTA. This variable looks at the impacton Indian imports from country j of the partner country j(exporter) not being a PTA member. A negative coefficient ofthe PTA dummies implies that exports from country j to Indiaget reduced because of its non-member status, that is, tradediversion.
According to this model, bilateral trade flows between twocountries are enhanced by their economic sizes (GDP) andpopulations (Pop.) but reduced by geographical distance (Dist.).Additional variables like sharing of a common language(comlang.), contiguity (contig.), common colony (comcol.), andhistorically been one country (smctry) membership in PTAsare also included in the model to control for trade impediments.An augmented gravity model somewhat similar to that ofSoloaga and Winters (2001) and Srinivasan and Archana (2008)has been used to investigate the impact of PTAs on India’sbilateral trade flows (details in Tables 17-19 of Appendix).
The results from empirical exercise imply that larger GDPand population of India’s trading partner have a significant

38 India’s Experiences on Preferential Trade Agreements
positive impact on bilateral trade flows while greatergeographical distance reduces trade. It shows good amount oftrade creation in terms of India-Singapore CECA and also lowtrade creation for SAFTA, BIMSTEC and very less in case ofMERCOSUR. Sharing a common border with a tradingpartner, however, does not appear to impact India’s tradeflows. This is unusual as the border effect on trade flows ispositive and significant in most gravity model estimations. Thedeviant result for India further confirms that it has not beenable to convert geographical proximity into an advantage fortrading with SAFTA members relative to its other tradingpartners. Even the smctry variable has negatively impactedwhich is obvious considering the low intra-regional trade inSouth Asia.
However, ISLFTA and India-ASEAN largely reflects lackof trade creation, though some previous studies have shownthat ISLFTA creates trade. There is some difference in resultspertaining to trade creation from PTAs depending upon thetype of estimation procedure, and the differences owing tothe country and time period coverage of the data used foranalysis.
OLS estimations for the imports flow in equation 2 showssignificant negative coefficients on the PTA variables for Indo-Singapore CECA implying trade diversion. In other words,for countries which are not a part of the above two PTAs,there has been a reduction in their exports to India.
These results are in line with the analysis using other keytrade related indicators, which implies that almost all of India’sPTA partner countries (except Singapore) have similar exportstructures, and exhibit low intra-industry trade and relativelylow degree of trade complementarity with India, all pointingtowards low potential for growth of trade in goods.

India’s Experiences on Preferential Trade Agreements 39
Impact on Key SectorsIn this section two key sensitive sectors of India have been
examined to infer the sector specific impacts of PTAs. Indiahas undertaken substantial tariff liberalisation for itsmanufactured goods: average MFN applied tariffs have fallenfrom 31.6 percent in 2001 to close to 9.3 percent in 2008implying that its domestic manufactured goods market is quitecompetitive. However, such tariff reduction schemes havebypassed agriculture, livestock, processed food, T&C sectors.India’s SAFTA partners also have comparative advantage insome of these sectors. Most of them have maintained asensitive items list much longer than the one put forward byIndia.
Although the sensitive list maintained towards non-LDCsis required to be different from those facing LDCs, not allmembers have enforced it. For example, India’s sensitive listcontains 865 and 744 products for non-LDCs and LDCsrespectively while Sri Lanka has maintained 1079 productsfor both groups. However, a closer look at the specific itemsindicates that India has been quite strategic in choosingproducts for this list. The sensitive list is dominated by twoproduct groups that hold major importance for its SAFTApartners, namely vegetable products, accounting for 20.2percent of the sensitive list items, and textiles and clothingproducts, making up 34.2 percent.51
The products in the sensitive list maintained by India makeup a relatively bigger portion of a typical partner’s top tenRCA sectors compared to its sensitive list’s share in India’stop ten RCA sectors. In the case of Sri Lanka, the sensitivelist maintained by India is longer in SAFTA compared to theone maintained in the India-Sri Lanka FTA.52 Such a strategicapproach in the selection of sensitive items has certainly helpedIndia protect some of its industries from export competition.

40 India’s Experiences on Preferential Trade Agreements
India-Singapore CECA has the shortest time line for tariffreduction, but since India is undertaking this unilaterally, theremay not be much scope for gains for India purely in terms oftrade in goods. Recently, India has decided to provide additionalconcessions on 539 products (8 digit HS code), mostly basemetal, machinery and mechanical appliances, chemicals, plasticand rubber articles and textiles. Tariff elimination will beundertaken for 307 items in five phases from January 15, 2008to December 01, 2011 with 97 products slated for duty freestatus by 2015.
SAFTA, with the longest time frame for tariff reduction,offers no substantial benefits for India in the near future. TheIndia-MERCOSUR PTA has a fixed offer list of very limitedproducts with no arrangements for future tariff reduction orelimination.
Moreover, India-MERCOSUR PTA has the most restrictiverules of origin with a 60 percent domestic value addedrequirement while ISLFTA requires only 35 percent domesticvalue added with a change in tariff heading. However, due tolax product specific rules within RoO under ISLFTA, Europeanand Chinese products have made their way into India afterundergoing minor modifications or re-packaging.53
Both SAFTA and Indo-Singapore FTA have provisions for40 percent value added with change in classification; however,the safeguard measures and product specific rules under theIndo-Singapore CECA are much more detailed in scope, withthe objective of ensuring that only goods actually produced inthe two countries benefit from the agreement.
Textiles & Clothing SectorOne of the common features of South Asian economies is
their comparative advantage in the labour intensive readymadegarment (RMG) sector. India’s exports in the T&C sectors(HS lines 50-63) for 2009-10 were US$23.49bn accounting

India’s Experiences on Preferential Trade Agreements 41
for 13.14 percent of its total exports. According to IndianTextile Journal report, India’s share in world clothing exportsfell from 2.63 percent to 2.55 percent over the MFA phaseout period of 1996-2004, while the country’s share in worldtextile imports increased from 2.91 to 3.58 percent duringthe same period.54
Over the recent years, countries like Bangladesh havesuccessfully specialised in this sector thereby penetratinglarger overseas markets, while Nepal has lost its competitiveedge due to its inefficient production systems. India still has acompetitive domestic RMG sector; however, the country’sstrength lies in relatively more capital intensive textilemanufacturing. At present, only India and Pakistan from SouthAsia have a competitive export-oriented textile industry.
The RMG sector also comes under the top ten RCA sectorsfor Sri Lanka. As mentioned above, the T&C sector is notcovered by India’s tariff liberalisation scheme. A long list ofproducts from this sector have made their way into India’ssensitive list and high specific tariffs have been also introducedin addition to ad valorem tariffs to protect producers in thissector. About 41 percent of the T&C tariff lines (HS chapters50-63) face specific duties and the system is designed to restrictRMG imports from developing countries.
In 2009, about 19 percent internal tariffs were imposed byIndia on duty-free RMG from Bangladesh.55 Due to thesehidden barriers, out of 3.65 million duty-free quota certificatesapplied for by Bangladeshi exporters in 2008, only 50 percentwas successfully processed as high internal duties discouragedIndian importers. Although these internal tariffs are notdiscriminatory as these are applied to domestic goods as well,they do lead to increased transaction costs and unnecessarydelay in movement of consignments.
Bangladesh’s RMG sector has recorded unprecedentedgrowth in other markets while with regard to India; its RMG

42 India’s Experiences on Preferential Trade Agreements
export performance has been nominal. Although preferentialrates on both ad valorem and specific duties have been extendedto Bangladesh in addition to an annual export quota of 8 millionpieces, Bangladesh has not been able to increase its RMGexports to India partially due to the fact it may be lesscompetitive vis-à-vis India’s RMG sector.56 Poor facilitationat the Indo-Bangladesh Land Customs Station is also a crucialfactor impeding RMG exports to India.
Sri Lanka has a large garment export sector but its garmentexports to India are negligible. Garments have been givenpreferential market access of 50 percent for 8 million piecesper year while textiles have been granted a preferential marginof 25 percent with no quantitative restrictions. It should benoted that in the granted quota of 8 million pieces, at least 2million pieces are required to have Indian fabric content.
India also faces various impediments from its SAFTApartners in this sector. For example, Bangladesh had imposeda ban on textile fabric imports for domestic use, therebyadversely affecting India’s textile exports into the country.Although this ban has been eliminated since 2005, the sectoris still protected by high tariffs. Moreover, textile yarn importsfrom India can only enter Bangladesh through its sea ports.
Such measures have been taken to curb trade throughinformal channels, but there is no saying that such NTBs donot impact regular trade flows. Moreover, such portrestrictions not only increase informal trade but could also bea breeding ground for bribes to customs officials at the borders.
To sum up, despite India’s provision of concessions andpreferential market access to South Asian RMG producers,they have not been able to increase RMG exports to India.There are two reasons for this. One, the Indian RMG sectoris quite competitive relative to this sector in its neighbouringcountries. Not only does it have easy access to domestic fabricand textiles but the sector is far more diversified than RMG

India’s Experiences on Preferential Trade Agreements 43
sectors in its neighbouring countries. Second, various hiddenduties, port restrictions and many NTBs have made RMGexports from neighbours uncompetitive.
SpicesIndia is one of the largest consumers and producers of
spices in the world. According to the Spice Board of India,total exports in spices (pepper, cardamoms, chilli, ginger,turmeric, coriander, cumin, celery, fennel, fenugreek, otherseeds, garlic, nutmeg & mace, vanilla, curry powder, mintproducts, oils & oleoresins and other spices) stood atUS$1502.85mn in 2010-11, up from US$1173.75mn in 2009-10. In terms of volume, India’s share in world spice trade is48 percent while in terms of value this figure is 44 percent.
Sri Lanka is another major global player in the spice industryand has received duty free treatment for the same from Indiaunder the Indo-Sri Lanka FTA. Following the exemption ofspices from the sensitive list in the ISLFTA, India’s existingtrade deficit in pepper took a significant jump. In 1999, a yearprior to the enforcement of the ISLFTA, India exportedUS$69,025 worth of pepper (HS 090411) to Sri Lanka. By2005, pepper exports declined to US$9,203 while imports keptrising. In addition to pepper originating from Sri Lanka, thirdcountry pepper also made its way into the Indian market viaSri Lanka.
During the same time period, Vietnamese pepper displacedIndian pepper from a large portion of the US market, whileunfavourable weather conditions at home adversely affecteddomestic production. All these factors depressed pepper pricesand generated a lot of hue and cry among pepper producers inKerala. Kerala contributes to 92 percent of pepper exports,74 percent of cardamom and 63 percent of ginger exportsamong others, making up 67.5 percent of total national spiceexport.57

44 India’s Experiences on Preferential Trade Agreements
Although not entirely responsible for bringing distress inthe pepper industry, the ISLFTA did have an impact. Hence,in 2006, the India Pepper Spice Trade Association put forth ademand for a quota restriction on Sri Lankan pepper imports.58
The Government of India responded favourably by placing anannual import cap of 2,500 tonnes on Sri Lankan pepper aswell as designating only one port, i.e. Kochi, for such importsin order to monitor quantity and quality of pepper imports.59
India also has substantial trade deficits with Sri Lanka incinnamon and cinnamon-tree flowers (HS 0906) nutmeg, maceand cardamoms (HS 0908) and cloves (HS 0907).
Some other spices that have experienced a decrease inproduction are pepper, cardamom, fenugreek, saffron andcelery; however, the rates of decrease have been fairly modestwhen compared to that in cloves and cinnamon. India has zeroexports in cloves while recently cinnamon exports to Sri Lankastood at a mere US$1,000. On the other hand, India importedUS$1.1mn and US$7.3mn worth of cinnamon and cloves fromSri Lanka. Change in weather conditions with extended dryspells is also cited as a major reason for the decline inproduction of some spices like cardamom and pepper.
Other spices, namely, chilli, ginger, turmeric, coriander,fennel, cumin, vanilla, garlic, dill seed and ajwan have seen anincrease in production. Also certain spices have lost theircompetitive edge adversely affecting livelihoods of Indian spicefarmers. But the fact that others enjoy a trade surplus despiteduty-free access to Sri Lankan spices is an indicator that Indiais still competitive in those products.
Services and Investment in PTAsIndia has focused on deregulation of services sectors. The
telecommunication sector has been opened up to competition.Several other services including the knowledge-based sectorslike IT and ITES sectors have been able to make up a mark

India’s Experiences on Preferential Trade Agreements 45
and contribute favourably to the success story of the Indianservices sector. The increase in such knowledge knowledge-based sectors including BPO, LPO, business process re-engineering and others have provided robust growth to theeconomy. This has been possible owing to the series oftechnological advances and availability of low-cost and skilledmanpower with competence in English language.
India has made services commitments in the WTO UruguayRound, and has made partial commitments in 42 subsectors,across six of the 12 major services groupings (business,communications, construction, financial, health and tourism)in the Service Sectoral Classification List. India opened up itsservices sectors and this is reflected in its Offer at the WTOwherein it has offered 11 out of 12 services sectors as per theServices Sectoral classification of the WTO.60
A majority of PTAs have only included provisions for tradein goods while trade in services, investment flows andcooperation in other spheres have been left out of most tradeagreements. Given India’s success in knowledge intensivesectors like information technology and the growing share ofthe service sector in its GDP, including service trade is likelyto greatly enhance economic gains from PTAs. SAFTA, India-ASEAN and India-MERCOSUR are largely goods-based PTAswhile the above mentioned issues are included in ISLFTA andIndo-Singapore CECA to certain degrees.
In terms of investments, before 1991, the amount of FDIflow in and out of India was not very significant. While theamount of FDI in India has been US$252mn in 1992, the figurestood at US$40,418mn in 2008.
In order to attract FDI, India has gradually reduced variouscaps on FDI inflow. It has recently formulated a consolidatedFDI policy in 2011 which is expected to facilitate greater FDIinflow. Mauritius, Singapore, US, Japan, Netherlands and UKare the major sources of FDI for India. The Outward FDI

46 India’s Experiences on Preferential Trade Agreements
(OFDI) from India is also expanding gradually over the time.While the OFDI figure for India was US$0.35mn in 1993, itincreased to US$14,896.72mn in 2009.61
In 1999, that is, pre-ISLFTA, there were only 18 projectswith Indian investment flows in Sri Lanka with 67.8 percentof such investment taking place in the food, beverage andtobacco sector. By 2006, the number of projects went up to83, with 30 in the service sector soaking up 71.1 percent ofIndian investment flows.62
An increase in goods exports to Sri Lanka under the FTAcontributed towards creating a positive business climate andbusiness confidence of Indian suppliers, thereby motivatingthem to undertake foreign direct investment (FDI) in theregion. Sri Lanka attracts the largest share of outward IndianFDI in the South Asia region with more than 50 percent ofIndian joint ventures and wholly owned subsidiaries.
Indian FDI in manufacturing is mostly concentrated infabricated metal products, machinery and transport equipmentwhile significant resources are also flowing into Vanaspatiand copper sectors. In the service sector, India’s presence isseen in tourism, information technology, advertising, financialservices, hotels, health services and in retailing and distribution.
India has been able to attract a large number of Sri Lankanstudents in the higher education sector, who view the countryas an inexpensive alternative to western countries. India iskeen on penetrating the Sri Lankan market in a variety ofprofessional services like engineering, architecture, IT,accounting, health etc. Involvement in such service trade willdefinitely be complemented with increased investments. Withgrowing service sectors in both countries, there is much morescope for bilateral investments and service trade under ISLFTA.
With investors and service providers receiving nationaltreatment in each other’s countries, the Indo-Singapore CECAhas been widely successful in attracting inward FDI into India.

India’s Experiences on Preferential Trade Agreements 47
Singapore was India’s seventh largest investor during the pre-CECA period, but at present it occupies the second position.63
Being a regional economic hub and holding the top mostrank in Asia with regards to ease of doing businesses, Singaporeis high on competitiveness. sService trade and investments haveextended to sectors like telecommunications, transportation,construction, distribution, health and tourism along withbusiness services and IT. The potential for further cooperationin investment in sectors like infrastructure, food processing,bio-technology, entertainment and tourism has not beenexploited fully.
Another area where Singapore could bring in substantialinvestments and expertise is in developing Special EconomicZones (SEZs) in India, having successfully done the same inChina and Vietnam.64
Treatment of Other Related Areas in PTAsThis part discusses the treatment of some related issues
like intellectual property rights (IPR), trade and environment,trade and social standards, competition policy, tradefacilitation, and government procurement in India’s PTAs.
India has paid due attention to the IPRs and is continuouslystriving to modernise its administrative mechanism to meetdomestic and international standards. The number of patentsbeing filed in India has also shown an increase. For instance,analysis of patenting activity in IT sector in India gives a goodaccount of the intellectual property generation and the amountof innovation and technological innovation taking place.65
Also, latest report reveals that in the 2010-11 financial yearthe total number of applications for patent in India, was 37,000as compared to 34,000 in the preceding year; and, consideringthe success rate of approval that is 75 percent in India, it is asizeable number. It may be noted that in the year 1999-2000,the total patent application were numbered at merely 4,824.

48 India’s Experiences on Preferential Trade Agreements
Also the total number of applications for trademarks during2010-11 is 170,000 which have seen an increase from 140,000in the preceding year.66
With one of the most vibrant IP regimes in the world,supported by an integrated legislative and judicial framework,India’s IPR strategy is committed to meet obligations andsafeguard public interest.67
The Annex-II of the SAFTA Agreement identifies areas forTechnical Assistance to Least Developed Contracting Statesunder Article 11 (d) in which it outlines Legislative and policyrelated measures, assistance for improvement of nationalcapacity on IPRs but with little impetus. Also, the India-Singapore CECA mentions IPR in the context of necessity ofboth parties for mutual capacity building in this field.
In the PTAs signed by India, the issues related toenvironment has not been given due impetus and in the matterof social standards, the pragmatic considerations are missingin PTAs already concluded. However, SAFTA does mentioncompetition issues as one of its objective. It seeks to promoteconditions of fair competition in the free trade area, andensuring equitable benefits to all Contracting States, takinginto account their respective levels and pattern of economicdevelopment. Yet, there is no pragmatic consideration to theprocedure to be adopted for such initiatives.
The competition regime in India has evolved substantiallysince the independence days. Article 39 (clauses b and c) ofthe Constitution of India also significantly points out the vitalityof competition policies.68 The first law related to competitionin India was the Monopolies and Restrictive Trade Practices(MRTP) Act, 1969. The Act aimed for prevention ofconcentration of economic power to the common detriment;control of monopolies; prohibition of Monopolistic TradePractices (MTPs); prohibition of Restrictive Trade Practices(RTPs); and, the prohibition of Unfair Trade Practices (UTPs).

India’s Experiences on Preferential Trade Agreements 49
Based on the provisions of this the MRTP Commission wasalso constituted in 1984.
In the wake of economic reforms, the MRTP Act wasamended in 1991. Further, in October 1999, considering theglobal developments and the need for a more systemiccompetition regime, the Government of India appointed a HighLevel Committee (HLC) on Competition Policy and Law tosuggest a legislative framework which could either propose anew law or make appropriate amendments to the MRTP Act.The recommendations of the HLC which came in the year2000, paved the way for the Competition Act which was passedby the Parliament in 2002.
The Competition Act, 2002 was subsequently amended bythe Competition (Amendment) Act, 2007; and in accordanceto the provisions of this Amendment Act, the CompetitionCommission of India (CCI) and Competition AppellateTribunal (CAT) has been established. CCI has a Chairpersonand six members. Moreover, the Ministry of Corporate Affairsvide its Notification dated August 28, 2009, repealed theMRTP Act, 1969 and replaced it by the Competition Act,2002 with effect from September 01, 2009.
In terms of trade facilitation, PTAs have largely given dueimpetus to it. For instance, Annex-II of the SAFTA agreementidentifies areas for Technical Assistance to Least DevelopedContracting States under Article 11(d) under which it mentionsabout Customs procedures related measures as: Assistance toimprove institutional, managerial, regulatory and proceduralmatters relating to customs, Assistance for creation ofdatabase, training, post clearance audit for the customsvaluation; and automation of customs administrations, HSNomenclature and issues pertaining to RoO.
In terms of government procurement, the PTAs have notfailed to give it a due consideration. Though, SAFTA in itsArticle 11 mentions the issue of government procurement but

50 India’s Experiences on Preferential Trade Agreements
with no practical considerations. It is noteworthy that, in 2010,India attained the status of an observer to the WTO PlurilateralAgreement on Government Procurement.69
As a result, although India can observe negotiations andother proceedings it cannot take part in them with officialsubmissions. However, there can be informal bilateral/plurilateral meetings with other members of that agreement.India has also become an active player in the governmentprocurement market by agreeing to negotiate this subject aspart of the India-Japan FTA and the EU-India FTA.Interestingly, India’s market for government procurement atcentral government level is estimated to be M250bn, and moreand more Indian firms are also bidding for foreign contracts.

5Conclusion and the
Way Forward
1. Negotiations must be couched in a larger processconsisting of: a) identification of economic/tradeproblems; b) identification of a potential partner andpossible subject for negotiation which solves the identifiedeconomic problem; c) firming up of the agenda fornegotiation through the pooling of demands from bothsides and identification of issues on which there isagreement (implying that no negotiation on such issues isnecessary) and otherwise; d) use of strategies andfacilitating tactics to gain the maximum benefit fromnegotiations i.e. use of these tools to arrive at preferredoutcomes; and e) the garnering of political backing andnecessary legislative approval. BRICS Trade andEconomics Research Network (BRICS TERN) canundertake studies on best practices adopted by theirrespective governments and share these practices toidentify gaps for further training and capacity of thenegotiators.
2. There are still room for improvement in the preparednessfor such negotiations. Thus, the BRICS TERN needs toadvocate for a better Human Resource Planning (HRP)

52 India’s Experiences on Preferential Trade Agreements
in public administration, governance and at ministeriallevels for trade negotiations. The network can establishinter-linkages with key stakeholders, and help theirrespective governments in enhancing preparedness forsuch negotiations.
3. The BRICS TERN should seek to enhance publicparticipation in economic policy-making and on mattersof economic governance through network-based policyresearch and advocacy on trade and regulatory issuesincluding competition and investment policies, andeconomic diplomacy.
4. Generally, in the event of PTA negotiations, prior marketanalyses in prospective partner countries are notconducted. This could bias evaluation of the feasibility ofthe agreement, thereby resulting in sub-optimal outcomesof negotiations. BRICS TERN also needs to stronglyadvocate, and may be, undertake such practices.
5. Some of these critical issues like competition policies needto be harmonised among the BRICS countries, which shallbe a task of this network.
6. In such negotiations, the impact assessment of domesticregulations is crucial. Effective regulations are vital forensuring healthy development of market economies,protecting producer and consumer interests andpromoting fair competition. BRICS TERN needs to assistthe on-going efforts of promoting effective regulationsrelated to domestic regulations, trade costs (includingNTBs), competition policy and investment.

India’s Experiences on Preferential Trade Agreements 53
7. The network should also advocate for due impetus to IPRs,trade and environment, trade and social standards,competition policy, trade facilitation, and governmentprocurement for inclusion in their respective government’sapproach to PTA/FTA/CECA negotiations.
8. BRICS TERN needs to engage in policy research andadvocacy on institutional reforms and support the causeof South-South cooperation.
9. BRICS countries represent a progressive model ofdevelopment. Yet upon deeper reflection the spectaculargrowth of these countries is accompanied by socio-economic realities of low human development which arebecoming a cause of concern for social stability. BRICSTERN needs to work towards policy solutions forsustainable human development in the medium to longterm, and also support all such programs and projectswhich can help their respective government attainMillennium Development Goals (MDGs) by 2015.
10. BRICS countries support the development and use ofrenewable energy resources as a means to addresssustainability concerns. BRICS TERN through itsnetworking activities need to play a role in emphasisingthe importance of cooperation and information exchangeon knowledge and technologies to address climate changeconcerns and other relevant issues of sustainabledevelopment.

References
Anderson, J. E. (1979). “A Theoretical Foundation for the GravityEquation”, American Economic Review, Vol. 69, No. 1, pp. 106-116.
Apparel Bulletin (2009). “India Charges 18 percent Internal Taxeson ‘Duty-free’ RMG from Bangladesh”, 10 March 2009, http://www.apparel.com.bd/2009/03/india-charges-18pc-internal-taxes-on-duty-free-rmg-from-bangladesh/
Bilal, Sanoussi (2003). “Preparation for the Negotiation of PreferentialTrade Agreements with the EU: Preliminary Lessons from SomeDeveloping Countries”, www.acp-eu-trade.org
Financial Express (2004). “Foreign Trade Policy Ignores SpiceExports” 6 September 2004, http://www.financialexpress.com/news/foreign-trade-policy-ignores-spice-exports/114564
Helpman, E. and Krugman P. (1985). Market Structure and ForeignTrade: Increasing Returns, Imperfect Competition and theInternational Economy, Cambridge: MIT Press.
Hoadley, Stephen (2003). “Strategic Goals, Diplomatic Processes andPolitical Obstacles in Negotiating Free Trade Agreements: Lessonsfrom the New Zealand-Singapore Experience”, in Okamoto J. (ed.)Whither free trade agreements?: Proliferation, Evaluation andMultilateralization, IDE-JETRO, Chiba.
IAD Report, Malaysia (2005-06). Report of the International AffairsDivision (2005/06), Attorney General’s Chambers, Malaysia can beaccessed via the following web link: http://www.agc.gov.my/pdf/annualreports/agc/international.pdf while the tri-annual report of2007-09 can be accessed via web link http://www.agc.gov.my/pdf/annualreports/tri07-09/international.pdf
India’s Experiences on Preferential Trade Agreements 55
IAD Report, Singapore (2005-06). Report of International AffairsDivision from the Attorney-General’s Chambers, Singapore, availablethrough the following web link: http://www.agc.gov.sg/aboutus/docs/AGC_Annual_Report_2005-2006.pdf; while the 2008 Annual isavailable at http://www.agc.gov.sg/aboutus/docs/AGC_Annual_Report_2008.pdf
Joshi, R N and Singh, S. P. (2008). “Textiles & Clothing Exports:Trends & Prospects”, Indian Textile Journal, http://www.indiantextilejournal.com/articles/FAdetails.asp?id=1546
Krueger, A. O. (2003). “The Role of Trade and InternationalEconomic Policy in Indian Economic Performance”, Asian EconomicPolicy Review, Vol. 3, pp. 266–285.
Kumar, P. (2008). “Multilateral Trading System – Is it India’s BestOption?” CUTS CITEE Working Paper, No. 4/2008.
Kundu, K. K. (2004). “Free Trade at a Heavy Cost for India” AsiaTimes Online, December 11, 2004, Available: http://www.atimes.com/atimes/South_Asia/FL11Df03.html
Madison, Agnus (2001). The World Economy: A MillennialPerspective, Paris: OECD
Nair, G K (2006). “Centre decides to cap import of Lankan pepper”The Hindu Business Line, August 23, 2006, http://www.blonnet.com/2006/08/23/stories/2006082301520800.htm
Ponappa, Leela K. (2011). “The Crafting of the India-Sri Lanka FreeTrade Agreement”, in Kishan S. Rana and Bipul Chatterjee (ed.)Economic Diplomacy: India’s Experience, Jaipur: CUTS International,pp. 177-187.
Putnam, R. D. (1988). “Diplomacy and domestic politics: the logicof two-level games”, International Organization, Vol. 42, No. 3,pp. 427-460.
RBI (2008). “Reserve Bank of India Annual Report 2007-2008”,Reserve Bank of India.
Singh, Y. (2008). “India-Singapore CECA enters second phase”,Institute of Peace and Conflict Studies, Available: http://www.ipcs.org/article_details.php?articleNo=2481
Soloaga, I. and Winters L. A. (2001). “Regionalism in the Nineties:

56 India’s Experiences on Preferential Trade Agreements
What Effect on Trade?” North American Journal of Economics andFinance, Vol. 12, No. 1, pp. 1-29.
Srinivasan, T. N. and Archana V. (2008). “India in the Global andRegional Trade: Determinants of Aggregate and Bilateral Trade Flowsand Firm’s Decision to Export”, ICRIER Working Paper No. 232.
Suman, Yogesh, Nishy P. and V. K. Gupta (2009). “Trends in ITPatents filed from India: An Analysis”, Journal of Intellectual PropertyRights, Vol. 14, pp. 149-152.
Taneja, N and A Sawhney (2007). “Revitalizing SAARC Trade”,Economic Political Weekly, Vol. 42, No. 13, pp. 1081-1084.
VUAT (2007). “Impact of PTAs and FTAs on Kerala’s Agri-Sector”,Virtual University for Agricultural Trade, Dept. of Agriculture, Kerala,Available: http://www.vuatkerala.org/static/eng/wta/impact_rta/impact_rta_kerala.htm
Weerakoon, D. and Thennakoon J. (2007). “India-Sri Lanka FTA:Lessons for SAFTA”, mimeo written for CUTS International, Jaipur,under research grant from the Economic Affairs Division of theCommonwealth Secretariat
World Bank (2006). “India-Bangladesh Bilateral Trade and PotentialFree Trade Agreement”, Bangladesh Development Series Paper No.13, World Bank Office Dhaka.

Endnotes
1 Madison, 2001
2 Krueger, 2008
3 Trading Economics, Available: www.tradingeconomics.com/india/gdp-growth
4 CIA World Factbook, 2010 est.
5 Trade Map, ITC Geneva, 2009 data
6 Consolidated FDI Policy, DIPP, Ministry of Commerce and Industries,Government of India, March 2011
7 It also mentions that in case any company is dealing with transgenic/genetically modified seeds, relevant clearance from the GeneticEngineering Approval Committee (GEAC) and Review Committee onGenetic Manipulation (RCGM) has been made mandatory. Furtherthe policy also mandates compliance to the Environment ProtectionAct.
8 It excludes titanium bearing minerals and its ores and is subject to theMines and Minerals (Development & Regulation) Act, 1957
9 It also includes other eligible activities permitted under and subject tothe provisions of Coal Mines (Nationalisation) Act, 1973
10 This is subject to the condition that the company shall not do coalmining and shall not sell washed coal or sized coal from its coalprocessing plants in the open market and shall supply the washed orsized coal to those parties who are supplying raw coal to coal processingplants for washing or sizing
11 This is subject to sectoral regulations and the Mines and Minerals(Development and Regulation Act, 1957)
12 FDI in the Atomic Energy sector is prohibited and is reserved for thepublic sector
13 This is subject to the existing sectoral policy and regulatory frameworkin the oil marketing sector and the policy of the government on privateparticipation in exploration of oil and the discovered fields of national

58 India’s Experiences on Preferential Trade Agreements
oil companies. However, an FDI cap of 49 percent has been put onactivities pertaining to Petroleum refining by the Public SectorUndertakings (PSU), without any disinvestment or dilution of domesticequity in the existing PSUs
14 This is also subject to some restrictions. Also, more importantly, FDIis not allowed in Real Estate
15 Similar FDI route and FDI cap also applies to ISP with gateways, ISP’snot providing gateways, i.e. without gate-ways (both for satellite andmarine cables), radio paging, and end-to-end bandwidth.
16 Also, such companies would engage only in business to business (B2B)e-Commerce and not in retail trading, inter alia, implying that existingrestrictions on FDI in domestic trading would be applicable to e- comm.also
17 RCA has been calculated using the following formula: RCAij = (Xij/Xwj)/(Xi/Xw)
Where, Xij = ith country’s export of commodity j Xwj = world exportsof commodity j Xi = total exports of country i; and, Xw = total worldexports. An RCA index value of more than one reveals that the countryhas a comparative advantage. The data for calculation of RCA hasbeen taken from Trade Map database of International Trade Centre,Geneva
18 IIT is calculated as: IITjk = 1 – [sumi | Xijk – Mijk | / (Xijk + Mijk)]. Where,Xijk and Mijk represent exports and imports of products from industryi in country j to and from country k. Intra-industry trade attempts toascertain how much trade between two economies occurs within thesame industry. It is based upon the premise that economies of scaleprovide an incentive to trade, even when factor endowments andconsumer preferences are identical between partner economies. TheIIT index ranges between zero and one, with larger values indicating agreater level of trade between firms in the same industry. Higher IITratios suggest that net gains from specialisation in different productsare being exploited and that the participating country is increasing itsintegration into the world economy
19 It is one of the overlapping indices that enable a comparison of exportand import profiles between two countries i.e., how the export set ofindustries from the source country matches with the import set ofindustries from a destination country. In one conception of thedeterminants of trade, complementarity can be thought of as a proxyfor relative resource endowments and can show how much scope
there is for further trade TCI=
Where: d - importing country of interest; s - exporting country of

India’s Experiences on Preferential Trade Agreements 59
interest; w - set of all countries in the world; i - set of industries; x -commodity export flow; X - total export flow; m - commodity importflow; M - the total import flow. The degree of TCI ranges between 0and 100 percent. Higher complementarity value indicates a betterexport/import match, while 0 (zero) indicates no complementarity atall
20 In October 2009, India and Nepal entered into an Agreement of Co-operation to Control Unauthorised Trade
21 The Bangkok Agreement was an initiative of Economic and SocialCommission for Asia and the Pacific (ESCAP). It is a preferential tariffarrangement that aims at promoting intra-regional trade throughexchange of mutually agreed concessions by six member countrieswhich include Bangladesh, China, India, Korea, Lao PDR, and SriLanka. Interestingly, other countries like Pakistan, Fiji, Iran and NewZealand, among others have indicated their desire to join
22 The Framework Agreement covers FTA in Goods, Services andInvestment and other areas of Economic Cooperation. The FrameworkAgreement also provided for an Early Harvest Scheme (EHS) forelimination of tariff on a fast track basis on 82 items of export interestto the sides. The tariff concessions on 82 items of EHS list began fromSeptember 2004 and have become zero for both sides from September2006
23 India and ASEAN will eliminate import duties on 71 percent of productsby December 31, 2012 and another nine percent by 2015. Tariffs onsensitive tariff lines will be brought down to five percent by 2015 andIndia will keep 489 tariff lines insulated from tariff cuts
24 India-Singapore CECA was signed in June 2005 and India-MalaysiaCECA was recently signed in February 2011
25 As envisaged, this was the main reason why it took almost six yearsfor the negotiations to come to a conclusion. When India and ASEANkicked off negotiations, a comprehensive agreement was meant to beforged in goods, services and investment. However, ASEAN managedto convince India to first negotiate an agreement on goods beforemoving onto services and investment
26 Ponappa, 2011
27 An important point to consider here is that the budgetary allocationfor such studies will have to be demarcated. Lack of a consistent policyon this front affects the vendor organisation’s ability to conduct thestudies effectively. The Market Access Initiative (MAI) under theMinistry of Commerce provides almost uniform budgetary supportfor all FTAs, even if they differ in importance. In certain cases, thedifference in magnitudes is counter intuitive. For instance, the budgetary

60 India’s Experiences on Preferential Trade Agreements
allocations for studies on the India-Australia PTA were lower thanthose for the India-Indonesia PTA, despite the former having moretrade potential
28 Hoadley, 2003
29 The insecurity began in 1973, when Britain’s joining the EuropeanEconomic Community reduced access for Kiwi cheese, butter and sheepmeat to UK markets
30 Here it must be remembered that the old style PTAs were motivatedmore by geo-strategic considerations. These considerations still play amajor role in the negotiation of PTAs by the US and Europe. Thus, thelabelling of the ‘existence of a trade problem’ as an essential pre-condition for a FTA by Hoadley can only apply to new style PTAswhich are motivated primarily by economic considerations
31 For example, New Zealand was not granted the following demands: adefinite target date for unrestricted access to the Singapore servicemarket, the elimination of all subsidies by Singapore, introduction ofa comprehensive competition policy by Singapore, elimination ofinvestment restrictions facing New Zealand investors in Singapore
32 Putnam, 1988
33 This was the roundabout route taken to complete the legitimation ofthe report. Use of this route was facilitated by the fact that accordingto New Zealand law the Parliament has no powers as far as treatyratification is concerned. The circuitous route ensured that no moveto create a precedent for giving a direct treaty ratification role to theParliament was initiated
34 The lessons for India for the negotiation of PTAs that can be culledfrom international experience not only relate to the processes revealedby these stages but also consist of those that relate to human capital,staff deployment and the like
35 IAD Report, Singapore, 2005-06
36 Bilal, 2003
37 Expressed in another way, any functioning democratically electedgovernment can view the suitability of negotiations in the context ofthe national development strategy. In the case of a democracy thenational development strategy in most cases would be quiterepresentative of the interests of the entire population or at least asubstantial portion. Thus, negotiations with expected outcomes thatare consistent with the national development strategy should be takenup while others should be discarded. Such consistency and consequentpolitical support will lead to the successful implementation of thecoordination mechanisms highlighted above

India’s Experiences on Preferential Trade Agreements 61
38 Kumar, P. (2008), “Multilateral Trading System – Is it India’s BestOption?” CUTS CITEE Working Paper, No. 4/2008
39 Nevertheless, India’s own domestic economic reforms and unilateralliberalisation have played a major role in making the countrycompetitive in various sectors, thereby, enabling it to take advantageof the opportunities offered by PTAs
40 See Appendix Tables 1 and 3
41 See Appendix Tables 2 and 4
42 However, four items, namely, vegetable fats (vanaspati), copperproducts, acrylic yarn and zinc oxide face quota restrictions. Inaddition, alcoholic liquors/ beverages, non-Nepalese/non-Indianperfumes, cosmetics and cigarettes and tobacco are also not grantedpreferential access into India. Likewise Nepal has also protected itsbeverages and tobacco sector with an ad valorem tariff equivalent of70 and 41.1 percent respectively
43 The recent visit by Pakistan’s Commerce Minister in September 2011to India have raised hope about Pakistan granting MFN status toIndia
44 WTO Trade Profiles 2011
45 See Appendix Tables 2 and 4
46 DIPP, Federal Ministry of Commerce and Industry, Government ofIndia
47 India-MERCOSUR PTA, Department of Commerce, Government ofIndia
48 Lack of information on policies and regulations, large geographicaldistance with few direct shipping lines, poor air transportation links,differences in language and cultural aspects along with inadequatebanking and insurance facilities have been identified as possible factorsfor low volumes of trade between the two regions
49 The study uses the following equations:
LnXij = β0 +
β
1 LnGDPj +
β
2 LnPOPj +
β
3 LnDist.ij +
β
4 cont +
β
5
comlang +
β
6 comcol +
β
7 smctry +
∑β
k PTAkij +
ε
ij……………….(1)
LnMij =
β
0 +
β
1 LnGDPj +
β
2 LnPOPj +
β
3 LnDist.ij +
β
4 cont +
β
5
comlang +
β
6 comcol +
β
7 smctry +
∑β
k PTAkij +
ε
ij……………….(2)
50 See Anderson, 1979; Helpman and Krugman, 1985
51 Taneja and Sawhney, 2007
52 See Appendix Table 6
53 Kundu, 2004

62 India’s Experiences on Preferential Trade Agreements
54 Joshi and Singh, 2008
55 Apparel Bulletin, 2009
56 World Bank, 2006
57 VUAT, 2007
58 Financial Express, 2004
59 Nair, 2006
60 The details are reflected in India’s Revised Offer of 2005 at the WTO
61 World Investment Report, 2010
62 Weerakoon, D. and J. Thennakoon, 2007
63 RBI, 2010
64 Singh, 2008
65 Suman et al., 2009
66 News-item ‘37,000 patents filed in India this fiscal’, The EconomicTimes, March 13, 2011
67 There are substantial improvement in the way in which IPRs areenforced, with strong civil and criminal regulations in place for dealingwith counterfeiting and piracy. Also there is an inter-ministerialcommittee which coordinates on issues related IP enforcement
68 Article 39 states that ‘the State shall, in particular, direct its policytowards securing – (clause b) that the ownership and control ofmaterial resources of the community are so distributed as best tosubserve the common good; and, (clause c) that the operation of theeconomic system does not result in the concentration of wealth andmeans of production to the common detriment’
69 The Doha Agenda on government procurement was limited totransparency in government procurement, but the WTO PlurilateralAgreement on Government Procurement covers transparency as wellas market access

APPENDIX

64 India’s Experiences on Preferential Trade Agreements
Tab
le 1:
Indi
a’s M
erch
andi
se E
xpor
ts to
Cou
ntrie
s/G
roup
s (U
S$m
n)R
egio
n19
99-0
020
00-0
120
01-0
220
02-0
320
03-0
420
04-0
520
05-0
620
06-0
720
07-0
820
08-0
920
09-1
0A
AG
RA
rgen
tina
6399
6560
8718
620
021
229
035
227
022
%Br
azil
135
226
219
479
276
678
1091
1453
2518
2651
2414
45%
Para
guay
78
77
1112
1627
4739
3722
%U
rugu
ay27
3626
1719
2528
3751
6648
10%
MER
CO
SUR
231
369
317
563
393
901
1334
1729
2905
3108
2770
36%
Afg
hani
stan
3326
2461
145
165
143
182
249
394
464
40%
Bang
lade
sh63
693
510
0211
7617
4116
3116
6416
2829
1824
9824
3418
%Bh
utan
81
839
8985
9958
8711
111
911
8%M
aldi
ves
725
2732
4248
6869
9012
880
41%
Nep
al15
114
121
435
066
974
386
092
815
0715
7015
3330
%Pa
kist
an93
187
144
206
287
521
689
1350
1945
1440
1573
40%
Sri
Lank
a49
964
063
192
113
1914
1320
2522
5628
2724
2621
8818
%SA
FTA
1428
1954
2050
2785
4294
4606
5548
6469
9622
8567
8391
21%
Sing
apor
e67
387
797
214
2221
2540
0154
2560
6973
7184
44.9
7592
.17
30%
BRIC
S19
07.3
2256
.723
22.1
3642
4484
.179
09.3
1011
012
892.
316
953.
415
082
1707
127
%A
SEA
N22
3829
1434
5746
1958
2284
2610
411
1261
416
384
1914
118
114
24%
EU(2
7)96
6610
694
1015
511
886
1451
718
249
2322
926
806
3450
739
351
3602
815
%C
hina
539
831
952
1975
2955
5616
6759
8294
1083
493
53.5
1161
7.88
40%
Chi
le68
.61
108.
4583
.25
72.1
383
.02
111.
215
2.15
377.
2225
0.21
393.
4727
7.32
25%
Japa
n16
85.4
1794
.515
10.4
1864
1709
.29
2127
.91
2481
.26
2868
.12
3858
.48
3025
.736
29.5
410
%K
orea
476.
5645
0.78
471.
3764
4.85
764.
8610
41.6
818
27.2
125
18.4
2860
.84
3952
.334
21.0
524
%U
S83
9693
0585
1310
896
1149
013
766
1735
318
866
2072
221
150
1953
5.49
9%In
dia’
s T
otal
3682
244
560
4382
752
719
6384
2.6
8353
5.9
1030
9112
6414
1631
3218
5295
1787
51.4
18%
Expo
rtSo
urce
: Exp
ort I
mpo
rt D
ata B
ank,
Min
istry
of C
omm
erce
, Gov
ernm
ent o
f Ind
iaN
ote:
AA
GR
: Ave
rage
Ann
ual G
row
th R
ate;
Figu
res a
re in
mill
ions
of U
S$

India’s Experiences on Preferential Trade Agreements 65
Tab
le 2:
Indi
a’s M
erch
andi
se E
xpor
t Sha
res (
%)
Reg
ion/
Cou
ntry
1999
-00
2000
-01
2001
-02
2002
-03
2003
-04
2004
-05
2005
-06
2006
-07
2007
-08
2008
-09
2009
-10
MER
CO
SUR
0.63
0.83
0.72
1.07
0.62
1.08
1.29
1.37
1.78
1.68
1.55
SAFT
A3.
884.
394.
685.
286.
735.
515.
385.
125.
904.
624.
69BR
ICS
5.18
5.06
5.30
6.91
7.02
9.47
9.81
10.2
010
.39
8.14
9.55
ASE
AN
6.08
6.54
7.89
8.76
9.12
10.0
910
.10
9.98
10.0
410
.33
10.1
3EU
(27)
26.2
524
.00
23.1
722
.55
22.7
421
.85
22.5
321
.20
21.1
521
.24
20.1
6Sr
i La
nka
1.36
1.44
1.44
1.75
2.07
1.69
1.96
1.78
1.73
1.31
1.22
Sing
apor
e1.
831.
972.
222.
703.
334.
795.
264.
804.
524.
564.
25C
hina
1.46
1.86
2.17
3.75
4.63
6.72
6.56
6.56
6.64
5.05
6.50
Chi
le0.
190.
240.
190.
140.
130.
130.
150.
300.
150.
210.
16Ja
pan
4.58
4.03
3.45
3.54
2.68
2.55
2.41
2.27
2.37
1.63
2.03
Kor
ea1.
291.
011.
081.
221.
201.
251.
771.
991.
752.
131.
91U
S22
.80
20.8
819
.42
20.6
718
.00
16.4
816
.83
14.9
212
.70
11.4
110
.93
Sour
ce: E
xpor
t Im
port
Dat
a Ban
k, M
inist
ry o
f Com
mer
ce, G
over
nmen
t of I
ndia

66 India’s Experiences on Preferential Trade Agreements
Tab
le 3:
Indi
a’s M
erch
andi
se Im
ports
from
Cou
ntrie
s/G
roup
sC
ount
ry/R
egio
n19
99-0
020
00-0
120
01-0
220
02-0
320
03-0
420
04-0
520
05-0
620
06-0
720
07-0
820
08-0
920
09-1
0A
AG
RA
rgen
tina
347.
538
0.8
436
404.
152
453
9.6
754
879.
990
5.9
499.
0767
2.21
10%
Braz
il33
0.9
145.
230
8.2
316.
831
3.5
792.
489
3.1
990.
994
8.8
1186
3437
.97
44%
Para
guay
0.2
0.5
18.1
0.6
0.8
2.8
4.2
2.8
0.5
0.58
5.22
461%
Uru
guay
22.
93.
54.
710
.24.
14
7.3
13.3
14.7
316
.04
34%
MER
CO
SUR
680.
652
9.4
765.
772
6.2
848.
513
38.8
1655
.418
80.9
1868
.417
00.3
4131
.44
26%
Afg
hani
stan
21.1
26.6
17.5
18.5
40.5
4758
.434
.510
9.3
126.
2412
5.19
35%
Bang
lade
sh78
.280
.559
.162
.177
.659
.412
722
8.3
257.
131
3.11
254.
6619
%Bh
utan
1821
.123
.932
.252
.471
88.8
141.
319
4.5
151.
7915
3.11
26%
Mal
dive
s0.
40.
20.
40.
30.
40.
62
3.1
4.2
3.97
3.63
42%
Nep
al18
8.6
255.
135
5.9
281.
828
634
5.8
379.
930
5.7
628
496.
0445
2.61
14%
Paki
stan
68.2
6464
.844
.957
.795
179.
632
328
7.9
370.
1727
5.94
22%
Sri
Lank
a44
.245
67.4
90.8
194.
737
8.4
577.
747
0.3
631.
435
6.57
392.
1933
%SA
FTA
418.
749
2.5
589
530.
470
9.3
997.
214
13.3
1506
.221
12.4
1817
.916
57.3
417
%Si
ngap
ore
1160
.314
63.9
1304
.114
34.8
2085
.426
51.4
3353
.854
85.3
8121
.676
54.9
6454
.57
21%
BRIC
S42
52.8
3186
.77
4320
.61
5794
.89
7225
.32
1141
0.81
1625
5.09
2331
7.09
3414
8.31
4352
543
503.
2829
%A
SEA
N46
2941
4743
8751
5074
3391
1510
884
1809
022
675
2620
325
797.
9620
%EU
(27)
1113
510
675
1064
912
834
1507
519
302
2599
829
809
3843
242
733
3843
3.12
14%
Chi
le85
.49
57.1
494
.79
167.
3115
6.73
345.
5743
4.5
1923
.48
1837
.21
1503
.911
19.3
854
%JA
PAN
2535
.818
42.1
921
46.4
418
36.3
326
67.6
832
35.1
340
61.1
4599
.54
6325
.92
7886
.367
34.1
813
%K
orea
Sou
th11
04.4
289
3.76
1141
.37
1522
.01
2829
.17
3508
.77
4563
.85
4803
.15
6044
.886
76.8
8576
.07
26%
Chi
na12
8315
0220
3627
9240
5370
9810
868
1744
727
116
3249
730
824.
0239
%U
S35
6030
1531
5044
4450
3570
0194
5511
727
2103
018
561
1697
3.68
20%
Indi
a’s
Tot
al49
738.
0650
536.
4551
413.
2861
412.
1478
149.
1111
1517
.414
9165
.718
5735
.225
1654
3036
9628
8372
.920
%Im
port
Sour
ce: E
xpor
t Im
port
Dat
a Ban
k, M
inist
ry o
f Com
mer
ce, G
over
nmen
t of I
ndia
Not
e: A
AG
R: A
vera
ge A
nnua
l Gro
wth
Rat
e; Fi
gure
s are
in m
illio
ns o
f US$

India’s Experiences on Preferential Trade Agreements 67
Tab
le 4:
Indi
a’s M
erch
andi
se Im
port
Shar
es (%
)R
egio
n/C
ount
ry19
99-0
020
00-0
120
01-0
220
02-0
320
03-0
420
04-0
520
05-0
620
06-0
720
07-0
820
08-0
920
09-1
0M
ERC
OSU
R1.
41.
01.
51.
21.
11.
21.
11.
00.
70.
61.
4SA
FTA
0.8
1.0
1.1
0.9
0.9
0.9
0.9
0.8
0.8
0.6
0.6
BRIC
S8.
66.
38.
49.
49.
210
.210
.912
.613
.614
.315
.1A
SEA
N9.
38.
28.
58.
49.
58.
27.
39.
79.
08.
68.
9EU
(27)
22.4
21.1
20.7
20.9
19.3
17.3
17.4
16.0
15.3
14.1
13.3
Sri
Lank
a0.
10.
10.
10.
10.
20.
30.
40.
30.
30.
10.
1Si
ngap
ore
2.3
2.9
2.5
2.3
2.7
2.4
2.2
3.0
3.2
2.5
2.2
Chi
le0.
20.
10.
20.
30.
20.
30.
31.
00.
70.
50.
4JA
PAN
5.1
3.6
4.2
3.0
3.4
2.9
2.7
2.5
2.5
2.6
2.3
Kor
ea S
outh
2.2
1.8
2.2
2.5
3.6
3.1
3.1
2.6
2.4
2.9
3.0
Chi
na2.
63.
04.
04.
55.
26.
47.
39.
410
.810
.710
.7U
S7.
26.
06.
17.
26.
46.
36.
36.
38.
46.
15.
9So
urce
: Exp
ort I
mpo
rt D
ata B
ank,
Min
istry
of C
omm
erce
, Gov
ernm
ent o
f Ind
ia

68 India’s Experiences on Preferential Trade Agreements
Tab
le 5:
Ave
rage
MFN
App
lied
Tar
iffs
Cou
ntry
2000
2006
2009
2006
2
009
2006
2009
Man
ufac
ture
d G
oods
Non
-Agr
icul
tura
lA
gric
ultu
ral
Non
Agr
i.A
gri
All
Prod
ucts
Prod
ucts
Prod
ucts
Indi
a31
.7 (2
001)
15.3
(200
5)9.
316
.437
.610
.131
.819
.212
.9A
fgha
nist
an—
—5.
85.
7 (2
008)
5.7
5.5
5.5
(200
8)5.
8 (2
008)
5.7
5.6
(200
8)A
rgen
tina
13.7
9.8
10.7
12.6
10.1
1310
.312
.212
.6Ba
ngla
desh
22.2
15.4
14.5
(200
7)14
.917
.314
.3 (2
008)
17.6
(200
8)15
.214
.7 (2
008)
Bhut
an16
.5 (2
002)
18.7
(200
5)18
.4 (2
007)
19.2
41.3
—-
22.1
Braz
il16
.813
.415
.210
.214
.110
.212
.313
.6C
hile
76
6—
-—
-6
6—
-6
Chi
na16
.59.
59.
3—
-—
-8.
715
.6—
-9.
6Ja
pan
2.9
2.5
2.5
—-
—-
2.5
21—
-4.
9M
aldi
ves
20.4
20.4
20.7
20.5
18.4
20.7
18.3
20.2
20.4
Nep
al13
.712
.612
.613
.714
.912
.114
.313
.912
.4Pa
kist
an21
.1 (2
001)
14.8
14 (2
008)
1416
.313
.417
.114
.313
.9Pa
ragu
ay13
.810
.410
.910
9.8
10.3
10.3
9.9
10.3
Rus
sia
10.2
(200
1)9.
7 (2
005)
8.7
10.1
13.2
10.5
Sing
apor
e0
00
00.
20
0.2
00
Sri
Lank
a8
9.4
99.
223
.89.
224
.811
.211
.2U
rugu
ay14
.711
.311
.210
.710
10.6
10.1
10.6
10.5
Sour
ce: U
NC
TA
D H
andb
ook
of S
tatis
tics 2
000,
200
6; W
TO
Tra
de P
rofil
es 2
011

India’s Experiences on Preferential Trade Agreements 69
ISLF
TA
Indi
a
Sri
Lank
a
SAFT
A
LDC
Sri
Lank
a
419
1180
Neg
ativ
e Li
st(H
S-6
digi
t)
Bang
lade
sh:
1249
(for
LD
C)
1254
(for
NLD
C)
Nep
al: 1
335
Bhut
an: 1
37M
aldi
ves:
671
1065
Imm
edia
tely
1351
pro
duct
s
319
prod
ucts
& 5
0pe
rcen
t mar
gin
ofpr
efer
ence
on
889
item
s
In 2
Yea
rs(F
irst
Pha
se)
30 p
erce
nt(a
nnua
l red
uctio
n of
5per
cent
)
20 p
erce
nt re
duct
ion
(ann
ual r
educ
tion
of 1
0pe
rcen
t)
By 2
003
(in 3
yea
rs)
50 p
erce
nt, 7
5 pe
rcen
tan
d 10
0 pe
rcen
tre
duct
ion
70 p
erce
nt, 9
0 pe
rcen
tan
d 10
0 pe
rcen
t on
889
item
s
By 2
013
(in 5
yea
rs)
(Sec
ond
Phas
e)
0-5
perc
ent r
educ
tion
with
in 6
yea
rs
By 2
008
(In
8 ye
ars)
35 p
erce
nt, 7
0pe
rcen
tan
d 10
0 pe
rcen
t
By 2
016
(in 8
yea
rs)
(Sec
ond
phas
e)
0-5
perc
ent
redu
ctio
n
Dom
estic
Val
ue A
dded
35 p
erce
nt
35 p
erce
nt
30 p
erce
nt
35 p
erce
nt
Cha
nge
inT
ariff
Hea
ding
4-di
git
4-di
git
4-di
git
4-di
git
Rul
es o
f Ori
gin
Tar
iff L
iber
alis
atio
n Sc
hedu
leN
egat
ive
List
(HS-
6 di
git)
Tab
le 6:
Pre
fere
ntia
l Arr
ange
men
ts in
Indi
a’s P
TA
s
cont
d...

70 India’s Experiences on Preferential Trade Agreements
Fixe
d T
ariff
con
cess
ions
rang
ing
from
10
perc
ent t
o 10
0 pe
rUSc
ent
Sour
ce: V
ario
us T
rade
Agr
eem
ents
, Dep
artm
ent o
f Com
mer
ce, G
over
nmen
t of I
ndia
Non
-LD
C
Indo
-Si
ngap
ore
CEC
A
Indi
a
Sing
apor
e
Indi
a-M
ERC
OSU
R
MER
CO
SUR
Indi
a
Indi
a:86
5 (f
or N
LDC
)74
4 (f
or L
DC
)Pa
kist
an: 1
183
Neg
ativ
e Li
st(H
S 8
digi
t)
6551
pro
duct
s
-
Posi
tive
List
(H
S 8
digi
t)
452
450
20 p
erce
nt re
duct
ion
(ann
ual r
educ
tion
of 1
0pe
rcen
t)
Earl
y H
arve
st S
chem
e
506
prod
ucts
-
Phas
ed T
ariff
Elim
inat
ion-
by
2009
At
five
stag
es
mar
gin
of p
refe
renc
e 10
perc
ent,
25 p
erce
nt, 5
0pe
rcen
t, 75
per
cent
and
100
perc
ent o
n 22
02ite
ms
-
40 p
erce
nt
40 p
erce
nt
40 p
erce
nt
60 p
erce
nt
60 p
erce
nt
4-di
git
4-di
git
4-di
git
Phas
ed T
ariff
Red
uctio
n
At
five
stag
esm
argi
n of
pref
eren
ce 5
perc
ent,
10pe
rcen
t, 20
perc
ent,
35 p
erce
ntan
d 50
per
cent
on
2407
item
s
-

India’s Experiences on Preferential Trade Agreements 71
Tab
le 8
: Rev
eale
d C
ompa
rativ
e A
dvan
tage
for
Indi
a (S
ervi
ces)
Sect
ors
2009
Sect
ors
2004
Com
pute
r an
d in
form
atio
n se
rvic
es8.
59C
ompu
ter
and
info
rmat
ion
serv
ices
9.46
Pers
onal
rem
ittan
ces
7.45
Pers
onal
rem
ittan
ces
8.29
Tra
nspo
rtat
ion
0.88
Com
mun
icat
ions
ser
vice
s1.
24T
rave
l0.
71O
ther
bus
ines
s se
rvic
es0.
88In
sura
nce
serv
ices
0.67
Tra
vel
0.86
Oth
er b
usin
ess
serv
ices
0.59
Insu
ranc
e se
rvic
es0.
85C
omm
unic
atio
ns s
ervi
ces
0.59
Tra
nspo
rtat
ion
0.77
Fina
ncia
l se
rvic
es0.
50C
onst
ruct
ion
serv
ices
0.67
Pers
onal
, cul
tura
l and
rec
reat
iona
l ser
vice
s0.
50G
over
nmen
t se
rvic
es, n
.i.e.
0.37
Con
stru
ctio
n se
rvic
es0.
33Fi
nanc
ial
serv
ices
0.14
Sour
ce: C
alcu
latio
ns b
ased
on
ITC
dat
a
Tab
le 7:
Rev
ealed
Com
para
tive A
dvan
tage
for I
ndia
(Goo
ds)
Sect
ors
2010
Sect
ors
2005
Lac,
gum
s, r
esin
s, v
eget
able
sap
s an
d ex
trac
ts n
es9.
40Si
lk12
.94
Car
pets
and
oth
er te
xtile
floo
r co
veri
ngs
8.74
Lac,
gum
s, r
esin
s, v
eget
able
sap
s an
d ex
trac
ts n
es11
.79
Veg
etab
le p
laiti
ng m
ater
ials
, veg
etab
le p
rodu
cts
nes
8.52
Car
pets
and
oth
er te
xtile
floo
r co
veri
ngs
9.27
Cot
ton
8.40
Pear
ls, p
reci
ous
ston
es, m
etal
s, c
oins
, etc
8.47
Veg
etab
le te
xtile
fibr
es n
es, p
aper
yar
n, w
oven
fabr
ic7.
71O
ther
mad
e te
xtile
art
icle
s, s
ets,
wor
n cl
othi
ng e
tc7.
28O
ther
mad
e te
xtile
art
icle
s, s
ets,
wor
n cl
othi
ng e
tc5.
66O
res,
sla
g an
d as
h7.
07Si
lk5.
34C
otto
n5.
69O
res,
sla
g an
d as
h5.
28V
eget
able
pla
iting
mat
eria
ls, v
eget
able
pro
duct
s ne
s5.
22Bi
rd s
kin,
fea
ther
s, a
rtifi
cial
flo
wer
s, h
uman
hai
r3.
81V
eget
able
text
ile fi
bres
nes
, pap
er y
arn,
wov
en fa
bric
4.92
Cof
fee,
tea,
mat
e an
d sp
ices
3.69
Cof
fee,
tea,
mat
e an
d sp
ices
4.86
Sour
ce: C
alcu
latio
ns b
ased
on
ITC
dat
a

72 India’s Experiences on Preferential Trade Agreements
Tab
le 9:
Rev
ealed
Com
para
tive A
dvan
tage
(top
10
sect
ors)
for I
ndia
’s tra
ding
par
tner
s-Bra
zil an
d R
ussia
Bra
zil
Rus
sia
Sect
ors
Oil
seed
, ole
agic
fru
its,
grai
n, s
eed,
fru
it, e
tc, n
es
Suga
rs a
nd s
ugar
conf
ectio
nery
Cof
fee,
tea,
mat
e an
d sp
ices
Ore
s, s
lag
and
ash
Mea
t and
edi
ble
mea
t off
al
Res
idue
s, w
aste
s of
food
indu
stry
, ani
mal
fod
der
Pulp
of w
ood,
fibr
ous
cellu
losi
c m
ater
ial,
was
te e
tc
Tob
acco
and
man
ufac
ture
dto
bacc
o su
bstit
utes
Raw
hid
es a
nd s
kins
(oth
erth
an fu
rski
ns) a
nd le
athe
r
Prod
ucts
of
anim
al o
rigi
n,ne
s
2005
15.6
4
14.8
9
12.2
3
9.90
9.83
8.95
6.79
5.93
4.57
2.94
Sect
ors
Suga
rs a
nd s
ugar
conf
ectio
nery
Oil
seed
, ole
agic
fru
its,
grai
n, s
eed,
fru
it, e
tc, n
es
Ore
s, s
lag
and
ash
Cof
fee,
tea,
mat
e an
d sp
ices
Mea
t and
edi
ble
mea
t off
al
Pulp
of w
ood,
fibr
ous
cellu
losi
c m
ater
ial,
was
te e
tc
Res
idue
s, w
aste
s of
food
indu
stry
, ani
mal
fod
der
Tob
acco
and
man
ufac
ture
dto
bacc
o su
bstit
ute
Prod
ucts
of
anim
al o
rigi
n,ne
s
Raw
hid
es a
nd s
kins
(oth
erth
an fu
rski
ns) a
nd le
athe
r
2010
21.9
4
11.6
3
11.0
1
10.7
2
9.04
7.60
6.51
5.82
4.55
4.54
Sect
ors
Nic
kel a
nd a
rtic
les
ther
eof
Fert
ilise
rs
Min
eral
fue
ls,
oils
,di
still
atio
n pr
oduc
ts, e
tc
Iron
and
ste
el
Woo
d an
d ar
ticle
s of
woo
d, w
ood
char
coal
Oth
er b
ase
met
als,
cerm
ets,
art
icle
s th
ereo
f
Alu
min
ium
and
art
icle
sth
ereo
f
Cop
per
and
artic
les
ther
eof
Inor
gani
c ch
emic
als,
prec
ious
met
alco
mpo
und,
isot
opes
Arm
s an
d am
mun
ition
,pa
rts
and
acce
ssor
ies
ther
eof
2005
8.00
5.89
4.58
2.70
2.41
2.38
2.25
1.41
1.15
0.18
Sect
ors
Nic
kel a
nd a
rtic
les
ther
eof
Arm
s an
d am
mun
ition
, par
tsan
d ac
cess
orie
s th
ereo
f
Fert
ilise
rs
Min
eral
fue
ls,
oils
,di
still
atio
n pr
oduc
ts, e
tc
Woo
d an
d ar
ticle
s of w
ood,
woo
d ch
arco
al
Inor
gani
c ch
emic
als,
pre
ciou
sm
etal
com
poun
d, is
otop
es
Iron
and
ste
el
Oth
er b
ase
met
als,
cer
met
s,ar
ticle
s th
ereo
f
Alu
min
ium
and
art
icle
sth
ereo
f
Cop
per
and
artic
les
ther
eof
2010
7.01
6.81
5.31
4.65
2.25
2.21
1.95
1.92
1.80
1.24
Sour
ce:
Cal
cula
tion
s ba
sed
on I
TC
dat
a

India’s Experiences on Preferential Trade Agreements 73
Tab
le 10
: Rev
ealed
Com
para
tive A
dvan
tage
(top
10
sect
ors)
for I
ndia
’s tra
ding
par
tner
s-Chi
na an
d So
uth
Afri
ca
C
hina
Sou
th A
fric
a
Sect
ors
2005
Sect
ors
2010
Sect
ors
2005
Sect
ors
2010
Man
ufac
ture
s of
pla
iting
8.30
Um
brel
las,
wal
king
-stic
ks,
7.14
Pear
ls, p
reci
ous
ston
es,
9.57
Ore
s, s
lag
and
ash
9.86
mat
eria
l, ba
sket
wor
k, e
tc.
seat
-stic
ks, w
hips
, etc
met
als,
coi
ns, e
tc
Um
brel
las,
wal
king
-stic
ks,
7.99
Bird
ski
n, f
eath
ers,
art
ifici
al6.
45O
res,
sla
g an
d as
h7.
35Pe
arls
, pre
ciou
s st
ones
,6.
86se
at-s
ticks
, whi
ps, e
tcflo
wer
s, h
uman
hai
rm
etal
s, c
oins
, etc
Bird
ski
n, f
eath
ers,
art
ifici
al6.
25M
anuf
actu
res
of p
laiti
ng6.
33Ed
ible
frui
t, nu
ts, p
eel
5.53
Edib
le fr
uit,
nuts
, pee
l of
5.80
flow
ers,
hum
an h
air
mat
eria
l, ba
sket
wor
k, e
tc.
of c
itrus
frui
t, m
elon
sci
trus
fru
it, m
elon
s
Silk
5.64
Silk
5.09
Expl
osiv
es, p
yrot
echn
ics,
5.06
Expl
osiv
es, p
yrot
echn
ics,
5.74
mat
ches
, pyr
opho
rics
, etc
mat
ches
, pyr
opho
rics
, etc
Hea
dgea
r an
d pa
rts
ther
eof
4.51
Hea
dgea
r an
d pa
rts
ther
eof
4.23
Iron
and
ste
el4.
48W
ool,
anim
al h
air,
hor
seha
ir 4
.53
yarn
and
fabr
ic th
ereo
f
Art
icle
s of
leat
her,
ani
mal
4.39
Art
icle
s of
leat
her,
ani
mal
4.04
Alu
min
ium
and
art
icle
s3.
67Ir
on a
nd s
teel
4.23
gut,
harn
ess,
tra
vel g
oods
gut,
harn
ess,
tra
vel g
oods
ther
eof
Toy
s, g
ames
, sp
orts
4.21
Oth
er m
ade
text
ile a
rtic
les,
3.75
Pulp
of w
ood,
fibr
ous
3.45
Pulp
of w
ood,
fibr
ous
3.42
requ
isite
sse
ts, w
orn
clot
hing
etc
cellu
losi
c m
ater
ial,
was
te e
tcce
llulo
sic
mat
eria
l, w
aste
etc
Oth
er m
ade
text
ile a
rtic
les,
4.16
Toy
s, g
ames
, sp
orts
3.55
Woo
l, an
imal
hai
r, h
orse
hair
3.2
3N
icke
l and
art
icle
s th
ereo
f2.
94se
ts, w
orn
clot
hing
etc
req
uisi
tes
yarn
and
fabr
ic th
ereo
f
Foot
wea
r, g
aite
rs a
nd th
e3.
89A
rtic
les
of a
ppar
el,
3.53
Beve
rage
s, s
piri
ts a
nd3.
06A
lum
iniu
m a
nd a
rtic
les
2.73
like,
par
ts th
ereo
fac
cess
orie
s, k
nit o
r cr
oche
tvi
nega
rth
ereo
f
Art
icle
s of
app
arel
,3.
39Fo
otw
ear,
gai
ters
and
the
like,
3.44
Nic
kel a
nd a
rtic
les
ther
eof
2.87
Beve
rage
s, s
piri
ts a
nd2.
59ac
cess
orie
s, k
nit o
r cr
oche
tpa
rts t
here
ofvi
nega
r
Sour
ce: C
alcu
latio
ns b
ased
on
ITC
dat
a

74 India’s Experiences on Preferential Trade Agreements
Tab
le 11
: Rev
ealed
Com
para
tive A
dvan
tage
(top
10
sect
ors)
for I
ndia
’s tra
ding
par
tner
s: A
fgha
nista
n, A
rgen
tina,
Ban
glad
esh,
and
Bhut
anA
fgha
nist
anA
rgen
tina
Bang
lade
shBh
utan
Sect
ors
2010
Sect
ors
2010
Sect
ors
2010
Sect
ors
2009
Mea
t, fis
h an
d se
afoo
d37
.64
Res
idue
s, w
aste
s of
food
34.3
2V
eget
able
text
ile fi
bres
nes
,11
4.01
Inor
gani
c ch
emic
als,
pre
ciou
s6.
23fo
od p
repa
ratio
ns n
esin
dust
ry, a
nim
al f
odde
rpa
per
yarn
, wov
en fa
bric
met
al c
ompo
und,
isot
opes
Mis
cella
neou
s37
.30
Oil
seed
, ole
agic
fru
its,
21.4
9A
rtic
les
of a
ppar
el,
39.0
4Sa
lt, s
ulph
ur, e
arth
, sto
ne,
4
3.11
man
ufac
ture
d ar
ticle
sgr
ain,
see
d, f
ruit,
etc
., ne
sac
cess
orie
s, k
nit o
r cr
oche
tpl
aste
r, li
me
and
cem
ent
Iron
and
ste
el27
.85
Cer
eals
11.5
1A
rtic
les
of a
ppar
el,
32.8
0Ph
otog
raph
ic o
r0.
00ac
cess
orie
s, n
ot k
nit o
r cr
oche
tci
nem
atog
raph
ic g
oods
Edib
le v
eget
able
s an
d25
.16
Mill
ing
prod
ucts
, mal
t,11
.18
Hea
dgea
r an
d pa
rts
ther
eof
14.7
9Ir
on a
nd s
teel
1.14
cert
ain
root
s an
d tu
bers
star
ches
, inu
lin, w
heat
glu
ten
Silk
17.6
7A
nim
al,v
eget
able
fat
s an
d8.
08O
ther
mad
e te
xtile
art
icle
s,10
.85
Hea
dgea
r an
d pa
rts
ther
eof
0.00
oils
, cle
avag
e pr
oduc
ts, e
tcse
ts, w
orn
clot
hing
etc
Esse
ntia
l oi
ls,
perf
umes
,13
.19
Raw
hid
es a
nd s
kins
(oth
er7.
65Fi
sh,
crus
tace
ans,
mol
lusc
s,4.
84W
orks
of a
rt, c
olle
ctor
s0.
01co
smet
ics,
toi
lete
ries
than
furs
kins
) and
leat
her
aqua
tic in
vert
ebra
tes
nes
piec
es a
nd a
ntiq
ues
Mea
t and
edi
ble
mea
t off
al12
.05
Woo
l, an
imal
hai
r, h
orse
hair
5.08
Raw
hid
es a
nd s
kins
(oth
er4.
14V
eget
able
, fru
it, n
ut, e
tc1.
66ya
rn a
nd fa
bric
ther
eof
than
furs
kins
) and
leat
her
food
pre
para
tions
Com
mod
ities
not
els
ewhe
re8.
12Ed
ible
frui
t, nu
ts, p
eel o
f4.
95Fo
otw
ear,
gai
ters
and
the
2.13
Cer
eals
0.06
spec
ified
citr
us f
ruit,
mel
ons
like,
par
ts th
ereo
f
Soap
s, lu
bric
ants
, wax
es,
6.83
Mea
t and
edi
ble
mea
t off
al4.
16T
obac
co a
nd m
anuf
actu
red
1.60
Com
mod
ities
not
els
ewhe
re0.
00ca
ndle
s, m
odel
ling
past
esto
bacc
o su
bstit
utes
spec
ified
Mis
cella
neou
s ch
emic
al5.
71Fi
sh,
crus
tace
ans,
mol
lusc
s,4.
01M
anuf
actu
res
of p
laiti
ng1.
17Ed
ible
veg
etab
les
and
cert
ain
5.22
prod
ucts
aqua
tic in
vert
ebra
tes
nes
mat
eria
l, ba
sket
wor
k, e
tc.
root
s and
tube
rsSo
urce
: Cal
cula
tions
bas
ed o
n IT
C d
ata

India’s Experiences on Preferential Trade Agreements 75
Tab
le 12
: Rev
ealed
Com
para
tive A
dvan
tage
(top
10
sect
ors)
for I
ndia
’s tra
ding
par
tner
s: Br
azil,
Chi
le, Ja
pan,
and
Sout
h K
orea
Bra
zil
Chi
leJa
pan
Kor
ea S
outh
Sect
ors
2010
Sect
ors
2010
Sect
ors
2010
Sect
ors
2010
Suga
rs a
nd s
ugar
21.9
4C
oppe
r an
d ar
ticle
s th
ereo
f37
.92
Phot
ogra
phic
or
4.97
Ship
s, b
oats
and
oth
er8.
77co
nfec
tione
ryci
nem
atog
raph
ic g
oods
float
ing
stru
ctur
es
Oil
seed
, ole
agic
fru
its,
11.6
3O
res,
sla
g an
d as
h16
.00
Com
mod
ities
not
els
ewhe
re3.
31K
nitt
ed o
r cro
chet
ed fa
bric
4.69
grai
n, s
eed,
fru
it, e
tc, n
essp
ecifi
ed
Ore
s, s
lag
and
ash
11.0
1Pu
lp o
f woo
d, fi
brou
s11
.46
Ship
s, b
oats
and
oth
er2.
94O
ptic
al, p
hoto
, tec
hnic
al,
2.52
cellu
losi
c m
ater
ial,
was
te e
tcflo
atin
g st
ruct
ures
med
ical
, etc
app
arat
us
Cof
fee,
tea,
mat
e an
d10
.72
Edib
le fr
uit,
nuts
, pee
l of
9.51
Veh
icle
s ot
her
than
rai
lway
,2.
56M
anm
ade
filam
ents
2.42
spic
esci
trus
fru
it, m
elon
str
amw
ay
Mea
t and
edi
ble
mea
t9.
04Fi
sh,
crus
tace
ans,
mol
lusc
s,6.
68M
usic
al in
stru
men
ts, p
arts
2.29
Zin
c an
d ar
ticle
s th
ereo
f1.
97of
fal
aqua
tic in
vert
ebra
tes
nes
and
acce
ssor
ies
Pulp
of w
ood,
fibr
ous
7.60
Beve
rage
s, s
piri
ts a
nd3.
93G
lass
and
gla
ssw
are
1.99
Elec
tric
al,
elec
tron
ic1.
87ce
llulo
sic
mat
eria
l, w
aste
etc
vine
gar
equi
pmen
t
Res
idue
s, w
aste
s of
food
6.51
Veg
etab
le p
laiti
ng m
ater
ials
,3.
72Ir
on a
nd s
teel
1.93
Impr
egna
ted,
coa
ted
or1.
81in
dust
ry, a
nim
al f
odde
rve
geta
ble
prod
ucts
nes
lam
inat
ed te
xtile
fabr
ic
Tob
acco
and
man
ufac
ture
d5.
82W
ood
and
artic
les o
f woo
d,3.
64O
ther
bas
e m
etal
s, c
erm
ets,
1.61
Iron
and
ste
el1.
78to
bacc
o su
bstit
utes
woo
d ch
arco
alar
ticle
s th
ereo
f
Prod
ucts
of a
nim
al4.
55La
c, g
ums,
res
ins,
veg
etab
le3.
60O
ptic
al, p
hoto
, tec
hnic
al,
1.60
Plas
tics
and
artic
les
ther
eof
1.58
orig
in,
nes
saps
and
ext
ract
s ne
sm
edic
al, e
tc a
ppar
atus
Raw
hid
es a
nd s
kins
(oth
er4.
54Fe
rtili
sers
2.53
Mac
hine
ry, n
ucle
ar r
eact
ors,
1.60
Veh
icle
s ot
her
than
rai
lway
,1.
54th
an fu
rski
ns) a
nd le
athe
rbo
ilers
, etc
tram
way
Sour
ce: C
alcu
latio
ns b
ased
on
ITC
dat
a

76 India’s Experiences on Preferential Trade Agreements
Tab
le 13
: Rev
ealed
Com
para
tive A
dvan
tage
(top
10
sect
ors)
for I
ndia
’s tra
ding
par
tner
s: M
alay
sia, M
aldi
ves,
Nep
al, a
nd P
akist
anM
alay
sia
Mal
dive
sN
epal
Paki
stan
Sect
ors
2010
Sect
ors
2010
Sect
ors
2010
Sect
ors
2010
Ani
mal
,veg
etab
le f
ats
and
15.1
3Fi
sh,
crus
tace
ans,
mol
lusc
s,12
8.42
Veg
etab
le p
laiti
ng m
ater
ials
,36
2.21
Cot
ton
1.21
oils
, cle
avag
e pr
oduc
ts, e
tcaq
uatic
inve
rteb
rate
s ne
sve
geta
ble
prod
ucts
nes
Tin
and
art
icle
s th
ereo
f8.
47M
eat,
fish
and
seaf
ood
food
26.3
1C
arpe
ts a
nd o
ther
text
ile79
.13
Oth
er m
ade
text
ile a
rtic
les,
45.9
0pr
epar
atio
ns n
esflo
or c
over
ings
sets
, wor
n cl
othi
ng e
tc
Veg
etab
le p
laiti
ng m
ater
ials
,4.
66R
esid
ues,
was
tes
of fo
od1.
79V
eget
able
text
ile fi
bres
nes
,46
.98
Cer
eals
9.61
vege
tabl
e pr
oduc
ts n
esin
dust
ry, a
nim
al f
odde
rpa
per
yarn
, wov
en fa
bric
Rub
ber
and
artic
les
ther
eof
3.42
Com
mod
ities
not
els
ewhe
re1.
73M
anm
ade
stap
le fi
bres
29.7
9M
anm
ade
stap
le fi
bres
10.6
0sp
ecifi
ed
Woo
d an
d ar
ticle
s of w
ood,
2.93
Cer
eals
1.24
Man
mad
e fil
amen
ts29
.08
Raw
hid
es a
nd s
kins
(oth
er10
.22
woo
d ch
arco
alth
an fu
rski
ns) a
nd le
athe
r
Coc
oa a
nd c
ocoa
2.32
Min
eral
fue
ls,
oils
,0.
63C
offe
e, te
a, m
ate
and
spic
es19
.05
Salt,
sul
phur
, ear
th, s
tone
,9.
18pr
epar
atio
nsdi
still
atio
n pr
oduc
ts, e
tcpl
aste
r, li
me
and
cem
ent
Elec
tric
al,
elec
tron
ic2.
21T
obac
co a
nd m
anuf
actu
red
0.49
Wad
ding
, fel
t, no
nwov
ens,
17.0
0A
rtic
les
of le
athe
r, a
nim
al8.
84eq
uipm
ent
toba
cco
subs
titut
esya
rns,
twin
e, c
orda
ge, e
tcgu
t, ha
rnes
s, t
rave
l goo
ds
Mis
cella
neou
s ch
emic
al1.
49Pr
inte
d bo
oks,
new
spap
ers,
0.46
Hea
dgea
r an
d pa
rts
ther
eof
16.9
9A
rtic
les
of a
ppar
el,
7.73
prod
ucts
pict
ures
etc
acce
ssor
ies,
kni
t or
croc
het
Cer
eal,
flour
, st
arch
, m
ilk1.
28O
il se
ed, o
leag
ic f
ruits
,0.
32Ed
ible
veg
etab
les
and
cert
ain
16.1
4C
arpe
ts a
nd o
ther
text
ile6.
58pr
epar
atio
ns a
nd p
rodu
cts
grai
n, s
eed,
fru
it, e
tc, n
esro
ots a
nd tu
bers
floor
cov
erin
gs
Man
mad
e fil
amen
ts1.
27A
nim
al,v
eget
able
fat
s an
d0.
32O
ther
mad
e te
xtile
art
icle
s,14
.52
Art
icle
s of
app
arel
,6.
05oi
ls, c
leav
age
prod
ucts
, etc
sets
, wor
n cl
othi
ng e
tcac
cess
orie
s, no
t kn
it or
cro
chet
Sour
ce: C
alcu
latio
ns b
ased
on
ITC
dat
a
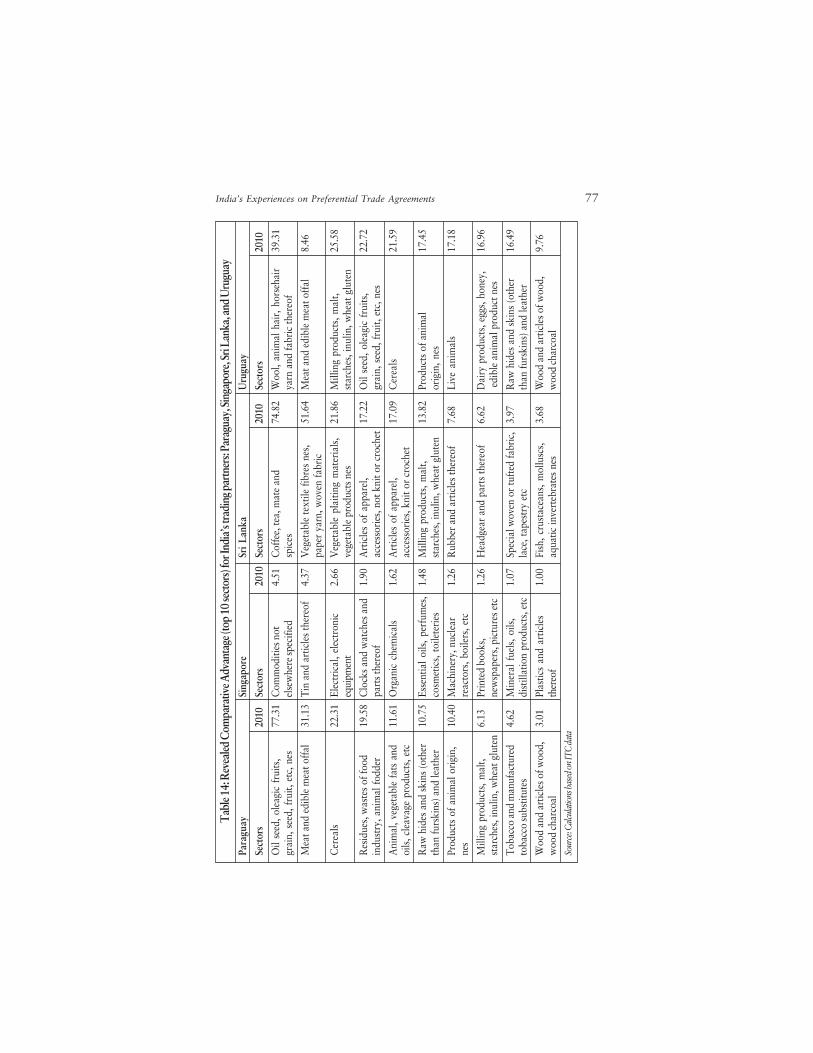
India’s Experiences on Preferential Trade Agreements 77
Tab
le 14
: Rev
ealed
Com
para
tive A
dvan
tage
(top
10
sect
ors)
for I
ndia
’s tra
ding
par
tner
s: Pa
ragu
ay, S
inga
pore
, Sri
Lank
a, an
d U
rugu
ayPa
ragu
aySi
ngap
ore
Sri L
anka
Uru
guay
Sect
ors
2010
Sect
ors
2010
Sect
ors
2010
Sect
ors
2010
Oil
seed
, ole
agic
fru
its,
77.3
1C
omm
oditi
es n
ot4.
51C
offe
e, te
a, m
ate
and
74.8
2W
ool,
anim
al h
air,
hor
seha
ir39
.31
grai
n, s
eed,
fru
it, e
tc, n
esel
sew
here
spec
ified
spic
esya
rn a
nd fa
bric
ther
eof
Mea
t and
edi
ble
mea
t off
al31
.13
Tin
and
art
icle
s th
ereo
f4.
37V
eget
able
text
ile fi
bres
nes
,51
.64
Mea
t and
edi
ble
mea
t off
al8.
46pa
per
yarn
, wov
en fa
bric
Cer
eals
22.3
1El
ectr
ical
, el
ectr
onic
2.66
Veg
etab
le p
laiti
ng m
ater
ials
,21
.86
Mill
ing
prod
ucts
, mal
t,25
.58
equi
pmen
tve
geta
ble
prod
ucts
nes
star
ches
, inu
lin, w
heat
glu
ten
Res
idue
s, w
aste
s of
food
19.5
8C
lock
s and
wat
ches
and
1.90
Art
icle
s of
app
arel
,17
.22
Oil
seed
, ole
agic
fru
its,
22.7
2in
dust
ry, a
nim
al f
odde
rpa
rts t
here
ofac
cess
orie
s, n
ot k
nit o
r cr
oche
tgr
ain,
see
d, f
ruit,
etc
, nes
Ani
mal
, veg
etab
le f
ats
and
11.6
1O
rgan
ic c
hem
ical
s1.
62A
rtic
les
of a
ppar
el,
17.0
9C
erea
ls21
.59
oils
, cle
avag
e pr
oduc
ts, e
tcac
cess
orie
s, k
nit o
r cr
oche
t
Raw
hid
es a
nd s
kins
(oth
er10
.75
Esse
ntia
l oi
ls,
perf
umes
,1.
48M
illin
g pr
oduc
ts, m
alt,
13.8
2Pr
oduc
ts o
f ani
mal
17.4
5th
an fu
rski
ns) a
nd le
athe
rco
smet
ics,
toi
lete
ries
star
ches
, inu
lin, w
heat
glu
ten
orig
in,
nes
Prod
ucts
of
anim
al o
rigi
n,10
.40
Mac
hine
ry, n
ucle
ar1.
26R
ubbe
r an
d ar
ticle
s th
ereo
f7.
68Li
ve a
nim
als
17.1
8ne
sre
acto
rs, b
oile
rs, e
tc
Mill
ing
prod
ucts
, mal
t,6.
13Pr
inte
d bo
oks,
1.26
Hea
dgea
r an
d pa
rts
ther
eof
6.62
Dai
ry p
rodu
cts,
egg
s, h
oney
,16
.96
star
ches
, inu
lin, w
heat
glu
ten
new
spap
ers,
pic
ture
s etc
edi
ble
anim
al p
rodu
ct n
es
Tob
acco
and
man
ufac
ture
d4.
62M
iner
al f
uels
, oi
ls,
1.07
Spec
ial w
oven
or
tuft
ed fa
bric
,3.
97R
aw h
ides
and
ski
ns (o
ther
16.4
9to
bacc
o su
bstit
utes
dist
illat
ion
prod
ucts
, etc
lace
, tap
estr
y et
cth
an fu
rski
ns) a
nd le
athe
r
Woo
d an
d ar
ticle
s of w
ood,
3.01
Plas
tics
and
artic
les
1.00
Fish
, cr
usta
cean
s, m
ollu
scs,
3.68
Woo
d an
d ar
ticle
s of w
ood,
9.76
woo
d ch
arco
alth
ereo
faq
uatic
inve
rteb
rate
s ne
sw
ood
char
coal
Sour
ce: C
alcu
latio
ns b
ased
on
ITC
dat
a

78 India’s Experiences on Preferential Trade Agreements
Tab
le 16
: Ind
ia’s
TC
I (%
) with
PT
A p
artn
er co
untri
es d
urin
g 200
1-20
10Y
ear
Arg
entin
aBa
ngla
desh
Mal
dive
sN
epal
Paki
stan
Para
guay
Sing
apor
eSr
i Lan
kaU
rugu
ay20
0145
%N
A50
%N
AN
A39
%34
%51
%47
%20
0246
%51
%50
%N
AN
A41
%37
%53
%50
%20
0346
%51
%50
%53
%50
%42
%38
%55
%51
%20
0445
%51
%50
%N
A54
%45
%40
%56
%52
%20
0547
%51
%50
%N
A58
%50
%45
%59
%56
%20
0645
%52
%50
%N
A58
%47
%46
%61
%56
%20
0748
%51
%50
%N
A63
%46
%50
%62
%60
%20
0848
%48
%50
%N
A54
%49
%48
%57
%55
%20
0951
%47
%50
%61
%60
%52
%50
%63
%60
%20
1050
%48
%10
0%65
%50
%50
%50
%50
%50
%So
urce
: Cal
cula
tions
bas
ed o
n IT
C d
ata
Tab
le 15
: Ind
ia’s
Tra
de C
ompl
emen
tarit
y Ind
ex (T
CI)
with
Bra
zil R
ussia
, Chi
na an
d So
uth
Afri
ca d
urin
g 200
1-20
10C
ount
ryB
razi
lR
ussi
aC
hina
Sout
h A
fric
a20
0160
%45
%43
%43
%20
0258
%43
%45
%45
%20
0356
%43
%47
%48
%20
0456
%44
%48
%49
%20
0556
%43
%50
%53
%20
0656
%44
%49
%54
%20
0756
%43
%49
%58
%20
0859
%47
%50
%56
%20
0956
%48
%55
%58
%20
1093
%50
%50
%50
%So
urce
: Cal
cula
tions
bas
ed o
n IT
C d
ata

India’s Experiences on Preferential Trade Agreements 79
Tab
le 17
: Gra
vity
Tra
de M
odel
Estim
atio
ns
Part
icul
ars
OLS
, dep
enda
nt v
aria
ble:
exp
ort
OLS
dep
enda
nt v
aria
ble:
impo
rt
ln_P
OP
0.44
7 (5
.720
)*0.
545
(4.0
32)*
ln_G
DP
0.56
3 (9
.081
)*0.
940
(8.7
80)*
ln_D
IST
-0.6
13 (-
3.03
3)-0
.663
(-1.
898)
cont
ig-0
.165
(-0.
155)
0.13
7 (0
.075
)
com
lang
0.21
9 (0
.773
)-0
.904
(-1.
834)
com
col
1.04
2 (3
.341
)*1.
578
(2.9
27)*
smct
ry-2
.647
(-2.
370)
-3.6
70 (-
1.90
0)
SAFT
A1.
018
(1.2
77)
0.14
2 (0
.103
)
BIM
STEC
0.91
6 (1
.000
)-1
.798
(-1.
135)
Indi
a-A
SEA
N-0
.107
(-0.
212)
-0.0
30 (-
0.03
4)
Indi
a-M
ERC
OSU
R0.
160
(0.2
30)
0.42
0 (0
.348
)
ISLF
TA
-0.8
42 (-
0.48
4)2.
614
(0.8
69)
Indi
a-Si
ngap
ore
2.32
0 (1
.636
)-2
.373
(-0.
968)
Sour
ce: C
alcu
late
d es
timat
ions
thro
ugh
SPSS
Not
e: Fi
gure
s in
pare
nthe
sis d
enot
e t-st
atist
ics. I
n eq
uatio
n 1
(i.e.
for e
xpor
t as d
epen
dant
varia
ble)
, the
R2 v
alue
is 0
.687
whi
le th
e val
ue fo
r Adj
. R2 is
0.66
0. In
equa
tion
2 (i.
e.fo
r im
port
as d
epen
dant
varia
ble)
, the
R2 v
alue
is 0
.628
whi
le th
e val
ue fo
r Adj
. R2 i
s 0.5
96.
*den
otes
sign
ifica
nce a
t 1%
leve
l of s
igni
fican
ce

80 India’s Experiences on Preferential Trade Agreements
Tab
le 18
: List
of C
ount
ries i
n th
e Sam
ple (
166
coun
tries
)A
fgha
nist
anB
ulga
ria
Esto
nia
Jam
aica
Mex
icoR
ussi
an F
eder
atio
nT
rini
dad
and
Tob
ago
Alb
ania
Burk
ina
Faso
Ethi
opia
Japa
nM
icro
nesi
aR
wan
daT
unis
iaA
lger
iaBu
rund
iFi
jiJo
rdan
Mol
dova
Saud
i A
rabi
aTu
rkey
Ang
ola
Cam
bodi
aFi
nlan
dK
azak
hsta
nM
ongo
liaSe
nega
lT
urkm
enist
anA
ntig
ua &
Bar
buda
Cam
eroo
nFr
ance
Ken
yaM
oroc
coSe
yche
lles
Uni
ted
Ara
b Em
irat
esA
rgen
tina
Can
ada
Gab
onK
uwai
tM
ozam
biqu
eSi
erra
Leo
neU
nite
d K
ingd
omA
rmen
iaC
ape
Ver
deG
eorg
iaK
yrgy
zsta
nM
yanm
arSi
ngap
ore
Uni
ted
Stat
esA
ustr
alia
Cay
man
Isl
ands
Ger
man
yLa
o PD
RN
amib
iaSl
ovak
iaU
gand
aA
ustr
iaC
had
Gha
naLa
tvia
Nep
alSl
oven
iaU
krai
neA
zerb
aija
nC
hile
Gre
ece
Leba
non
Net
herl
ands
Som
alia
Uru
guay
Baha
mas
Chi
naG
rena
daLe
soth
oN
ew Z
eala
ndSo
uth
Afr
ica
Uzb
ekist
anBa
hrai
nC
olom
bia
Gui
nea
Libe
ria
Nic
arag
uaSo
uth
Kor
eaV
enez
uela
Bang
lade
shC
osta
Ric
aG
uine
a Bi
ssau
Liby
aN
iger
Spai
nV
ietn
amBa
rbad
osC
ôte
d’Iv
oire
Guy
ana
Lith
uani
aN
iger
iaSr
i La
nka
Yem
enBe
laru
sC
roat
iaH
aïti
Luxe
mbo
urg
Nor
way
Suda
nZ
ambi
aBe
lgiu
mC
uba
Hon
dura
sM
acao
Om
anSu
rina
me
Zim
babw
eBe
lize
Cyp
rus
Hon
g K
ong
Mac
edon
iaPa
kist
anSw
azila
nd
Beni
nC
zech
Rep
ublic
Hun
gary
Mad
agas
car
Pana
ma
Swed
enBe
rmud
aD
enm
ark
Icel
and
Mal
awi
Papu
a N
ew G
uine
aSw
itzer
land
Bhut
anD
jibou
tiIn
done
siaM
alay
sia
Para
guay
Syri
aBo
livia
Dom
inic
an R
epub
licIr
anM
aldi
ves
Peru
Tai
wan
Bosn
iaEc
uado
rIr
aqM
ali
Phili
ppin
esT
ajik
ista
nBo
tsw
ana
Egyp
tIr
elan
dM
alta
Pola
ndT
anza
nia
Braz
ilEl
Sal
vado
rIs
rael
Mau
rita
nia
Port
ugal
Tha
iland
Brun
eiEr
itrea
Ital
yM
auri
tius
Qat
arTo
go

India’s Experiences on Preferential Trade Agreements 81
Tab
le 19
: Dat
a Sou
rce
Var
iabl
esSo
urce
GD
P, P
opul
atio
nW
orld
Dev
elop
men
t Ind
icat
ors,
Wor
ld B
ank
Dis
tanc
e, C
ontig
, com
col,
com
lang
, sm
ctry
Cen
tre
d’Et
udes
Pro
spec
tives
et d
’ Inf
orm
atio
ns In
tern
atio
nale
s (C
EPII
dat
abas
e), F
ranc
eEx
port
and
Impo
rt d
ata,
RC
A, I
IT, T
CI
Inte
rnat
iona
l Tra
de C
entr
e’s
Mar
ket A
naly
sis
Too
l Dat
abas
e, G
enev
a
Tab
le 20
: Ind
ia’s
IIT w
ith ea
ch B
RIC
S cou
ntrie
s in
2009
HS
Cod
eSe
ctor
sB
razi
lR
ussi
aC
hina
Sout
h A
fric
a‘0
1Li
ve a
nim
als
0.00
10.
000
0.00
00.
000
‘02
Mea
t and
edi
ble
mea
t off
al0.
000
0.00
00.
000
0.00
0‘0
3Fi
sh, c
rust
acea
ns, m
ollu
scs,
aqu
atic
inve
rteb
rate
s ne
s0.
000
0.00
00.
001
0.00
2‘0
4D
airy
pro
duct
s, e
ggs,
hon
ey, e
dibl
e an
imal
pro
duct
nes
0.00
00.
000
0.40
40.
000
‘05
Prod
ucts
of a
nim
al o
rigi
n, n
es0.
000
0.00
00.
916
0.03
3‘0
6Li
ve tr
ees,
pla
nts,
bul
bs, r
oots
, cut
flow
ers
etc
0.00
00.
000
0.59
10.
078
‘07
Edib
le v
eget
able
s an
d ce
rtai
n ro
ots
and
tube
rs0.
137
0.37
80.
000
0.01
5‘0
8Ed
ible
frui
t, nu
ts, p
eel o
f citr
us fr
uit,
mel
ons
0.81
30.
000
0.15
10.
748
‘09
Cof
fee,
tea,
mat
e an
d sp
ices
0.16
80.
004
0.35
10.
003
‘10
Cer
eals
0.00
00.
000
0.00
00.
000
‘11
Mill
ing
prod
ucts
, mal
t, st
arch
es, i
nulin
, whe
at g
lute
n0.
000
0.00
00.
534
0.00
0‘1
2O
il se
ed, o
leag
ic f
ruits
, gra
in, s
eed,
fru
it, e
tc, n
es0.
237
0.84
40.
676
0.06
4‘1
3La
c, g
ums,
res
ins,
veg
etab
le s
aps
and
extr
acts
nes
0.42
20.
000
0.33
60.
007
‘14
Veg
etab
le p
laiti
ng m
ater
ials
, veg
etab
le p
rodu
cts
nes
0.00
00.
000
0.01
50.
000
‘15
Ani
mal
,veg
etab
le f
ats
and
oils
, cle
avag
e pr
oduc
ts, e
tc0.
102
0.06
80.
018
0.00
0‘1
6M
eat,
fish
and
seaf
ood
food
pre
para
tions
nes
0.00
00.
000
0.03
30.
001
‘17
Suga
rs a
nd s
ugar
con
fect
ione
ry0.
000
0.00
00.
120
0.19
5

82 India’s Experiences on Preferential Trade Agreements
‘18
Coc
oa a
nd c
ocoa
pre
para
tions
0.00
00.
226
0.92
40.
876
‘19
Cer
eal,
flour
, sta
rch,
milk
pre
para
tions
and
pro
duct
s0.
000
0.00
00.
580
0.08
1‘2
0V
eget
able
, fru
it, n
ut, e
tc fo
od p
repa
ratio
ns0.
039
0.00
10.
339
0.69
4‘2
1M
isce
llane
ous
edib
le p
repa
ratio
ns0.
133
0.00
10.
555
0.07
2‘2
2Be
vera
ges,
spi
rits
and
vin
egar
0.00
20.
000
0.33
40.
350
‘23
Res
idue
s, w
aste
s of
food
indu
stry
, ani
mal
fodd
er0.
221
0.21
60.
307
0.52
3‘2
4T
obac
co a
nd m
anuf
actu
red
toba
cco
subs
titut
es0.
102
0.00
00.
695
0.00
0‘2
5Sa
lt, s
ulph
ur, e
arth
, sto
ne, p
last
er, l
ime
and
cem
ent
0.18
60.
051
0.50
80.
942
‘26
Ore
s, s
lag
and
ash
0.00
00.
036
0.00
90.
001
‘27
Min
eral
fue
ls, o
ils, d
istil
latio
n pr
oduc
ts, e
tc0.
719
0.00
30.
329
0.68
7‘2
8In
orga
nic
chem
ical
s, p
reci
ous
met
al c
ompo
und,
isot
opes
0.98
70.
185
0.35
60.
061
‘29
Org
anic
che
mic
als
0.57
30.
612
0.28
30.
873
‘30
Phar
mac
eutic
al p
rodu
cts
0.02
60.
008
0.47
80.
047
‘31
Fert
ilise
rs0.
000
0.00
00.
000
0.02
0‘3
2T
anni
ng, d
yein
g ex
trac
ts, t
anni
ns, d
eriv
s,pi
gmen
ts e
tc0.
123
0.08
50.
536
0.55
9‘3
3Es
sent
ial o
ils, p
erfu
mes
, cos
met
ics,
toi
lete
ries
0.57
70.
072
0.85
40.
032
‘34
Soap
s, lu
bric
ants
, wax
es, c
andl
es, m
odel
ling
past
es0.
613
0.95
40.
553
0.07
5‘3
5A
lbum
inoi
ds, m
odifi
ed s
tarc
hes,
glu
es, e
nzym
es0.
444
0.04
60.
117
0.80
6‘3
6Ex
plos
ives
, pyr
otec
hnic
s, m
atch
es, p
yrop
hori
cs, e
tc0.
867
0.00
00.
000
0.10
1‘3
7Ph
otog
raph
ic o
r cin
emat
ogra
phic
goo
ds0.
707
0.00
00.
005
0.08
5‘3
8M
isce
llane
ous c
hem
ical
pro
duct
s0.
160
0.88
80.
522
0.47
2‘3
9Pl
astic
s an
d ar
ticle
s th
ereo
f0.
941
0.81
90.
597
0.63
1‘4
0R
ubbe
r an
d ar
ticle
s th
ereo
f0.
978
0.12
90.
168
0.31
4‘4
1R
aw h
ides
and
ski
ns (o
ther
than
furs
kins
) and
leat
her
0.01
30.
718
0.33
60.
312
‘42
Art
icle
s of
leat
her,
ani
mal
gut
, har
ness
, tra
vel g
oods
0.01
60.
000
0.06
50.
010
HS
Cod
eSe
ctor
sB
razi
lR
ussi
aC
hina
Sout
h A
fric
a

India’s Experiences on Preferential Trade Agreements 83
HS
Cod
eSe
ctor
sB
razi
lR
ussi
aC
hina
Sout
h A
fric
a‘4
3Fu
rski
ns a
nd a
rtifi
cial
fur,
man
ufac
ture
s th
ereo
f0.
000
0.00
00.
000
0.00
0‘4
4W
ood
and
artic
les o
f woo
d, w
ood
char
coal
0.13
80.
204
0.03
10.
337
‘45
Cor
k an
d ar
ticle
s of
cor
k0.
000
0.00
00.
000
0.00
0‘4
6M
anuf
actu
res
of p
laiti
ng m
ater
ial,
bask
etw
ork,
etc
.0.
000
0.00
00.
071
0.00
0‘4
7Pu
lp o
f woo
d, fi
brou
s ce
llulo
sic
mat
eria
l, w
aste
etc
0.00
10.
000
0.00
80.
000
‘48
Pape
r &
pap
erbo
ard,
art
icle
s of
pul
p, p
aper
and
boa
rd0.
393
0.10
10.
020
0.34
7‘4
9Pr
inte
d bo
oks,
new
spap
ers,
pic
ture
s etc
0.97
70.
082
0.06
00.
040
‘50
Silk
0.81
90.
000
0.03
00.
000
‘51
Woo
l, an
imal
hai
r, h
orse
hair
yar
n an
d fa
bric
the
reof
0.94
70.
000
0.48
40.
075
‘52
Cot
ton
0.00
40.
001
0.30
90.
054
‘53
Veg
etab
le te
xtile
fibr
es n
es, p
aper
yar
n, w
oven
fabr
ic0.
066
0.00
00.
635
0.08
1‘5
4M
anm
ade
filam
ents
0.00
20.
246
0.03
30.
331
‘55
Man
mad
e st
aple
fibr
es0.
000
0.00
00.
579
0.00
2‘5
6W
addi
ng, f
elt,
nonw
oven
s, y
arns
, tw
ine,
cor
dage
, etc
0.30
70.
000
0.12
50.
157
‘57
Car
pets
and
oth
er te
xtile
floo
r co
veri
ngs
0.00
00.
000
0.42
50.
041
‘58
Spec
ial w
oven
or
tuft
ed fa
bric
, lac
e, ta
pest
ry e
tc0.
016
0.00
00.
030
0.00
2‘5
9Im
preg
nate
d, c
oate
d or
lam
inat
ed te
xtile
fabr
ic0.
562
0.39
70.
011
0.03
0‘6
0K
nitt
ed o
r cro
chet
ed fa
bric
0.00
00.
000
0.00
10.
030
‘61
Art
icle
s of
app
arel
, acc
esso
ries
, kni
t or
croc
het
0.00
20.
017
0.54
20.
001
‘62
Art
icle
s of
app
arel
, acc
esso
ries
, not
kni
t or
croc
het
0.00
00.
004
0.68
50.
002
‘63
Oth
er m
ade
text
ile a
rtic
les,
set
s, w
orn
clot
hing
etc
0.00
00.
000
0.29
00.
001
‘64
Foot
wea
r, g
aite
rs a
nd th
e lik
e, p
arts
ther
eof
0.95
50.
000
0.06
60.
001
‘65
Hea
dgea
r an
d pa
rts
ther
eof
0.00
00.
000
0.02
90.
194
‘66
Um
brel
las,
wal
king
-stic
ks, s
eat-
stic
ks, w
hips
, etc
0.00
00.
000
0.00
00.
000
‘67
Bird
ski
n, f
eath
ers,
art
ifici
al f
low
ers,
hum
an h
air
0.00
00.
000
0.09
50.
000

84 India’s Experiences on Preferential Trade Agreements
‘68
Ston
e, p
last
er, c
emen
t, as
best
os, m
ica,
etc
art
icle
s0.
222
0.02
20.
466
0.09
3‘6
9C
eram
ic p
rodu
cts
0.16
20.
034
0.02
10.
041
‘70
Gla
ss a
nd g
lass
war
e0.
157
0.19
40.
498
0.23
6‘7
1Pe
arls
, pre
ciou
s st
ones
, met
als,
coi
ns, e
tc0.
929
0.41
10.
740
0.03
1‘7
2Ir
on a
nd s
teel
0.39
90.
080
0.75
50.
305
‘73
Art
icle
s of
iron
or
stee
l0.
363
0.72
90.
044
0.07
8‘7
4C
oppe
r an
d ar
ticle
s th
ereo
f0.
332
0.01
90.
330
0.92
3‘7
5N
icke
l and
art
icle
s th
ereo
f0.
047
0.00
60.
010
0.04
4‘7
6A
lum
iniu
m a
nd a
rtic
les
ther
eof
0.95
80.
053
0.80
10.
138
‘78
Lead
and
art
icle
s th
ereo
f0.
000
0.00
00.
622
0.56
7‘7
9Z
inc
and
artic
les
ther
eof
0.00
00.
044
0.14
80.
128
‘80
Tin
and
art
icle
s th
ereo
f0.
000
0.00
00.
044
0.02
2‘8
1O
ther
bas
e m
etal
s, c
erm
ets,
art
icle
s th
ereo
f0.
715
0.00
00.
114
0.11
3‘8
2T
ools
, im
plem
ents
, cut
lery
, etc
of b
ase
met
al0.
177
0.27
70.
203
0.07
2‘8
3M
isce
llane
ous
artic
les
of b
ase
met
al0.
586
0.37
20.
080
0.05
1‘8
4M
achi
nery
, nuc
lear
rea
ctor
s, b
oile
rs, e
tc0.
956
0.83
50.
109
0.61
9‘8
5El
ectr
ical
, ele
ctro
nic
equi
pmen
t0.
302
0.95
30.
046
0.10
1‘8
6R
ailw
ay, t
ram
way
loco
mot
ives
, rol
ling
stoc
k, e
quip
men
t0.
000
0.05
00.
019
0.24
9‘8
7V
ehic
les
othe
r th
an r
ailw
ay, t
ram
way
0.69
70.
122
0.11
00.
021
‘88
Air
craf
t, sp
acec
raft
, and
par
ts th
ereo
f0.
014
0.71
80.
985
0.32
1‘8
9Sh
ips,
boa
ts a
nd o
ther
floa
ting
stru
ctur
es0.
197
0.11
60.
124
0.31
0‘9
0O
ptic
al, p
hoto
, tec
hnic
al, m
edic
al, e
tc a
ppar
atus
0.96
90.
354
0.28
40.
185
‘91
Clo
cks
and
wat
ches
and
par
ts th
ereo
f0.
000
0.23
50.
003
0.05
1‘9
2M
usic
al in
stru
men
ts, p
arts
and
acc
esso
ries
0.00
00.
000
0.21
70.
000
‘93
Arm
s an
d am
mun
ition
, par
ts a
nd a
cces
sori
es th
ereo
f0.
016
0.00
00.
024
0.00
0
HS
Cod
eSe
ctor
sB
razi
lR
ussi
aC
hina
Sout
h A
fric
a

India’s Experiences on Preferential Trade Agreements 85
‘94
Furn
iture
, lig
htin
g, s
igns
, pre
fabr
icat
ed b
uild
ings
0.12
50.
004
0.02
80.
015
‘95
Toy
s, g
ames
, spo
rts
requ
isite
s0.
072
0.29
00.
008
0.03
4‘9
6M
isce
llane
ous
man
ufac
ture
d ar
ticle
s0.
089
0.00
00.
024
0.01
3‘9
7W
orks
of a
rt, c
olle
ctor
s pi
eces
and
ant
ique
s0.
381
0.00
00.
593
0.02
3‘9
9C
omm
oditi
es n
ot e
lsew
here
spec
ified
0.04
70.
330
0.08
60.
782
Tot
alA
ll pr
oduc
ts0.
762
0.43
80.
506
0.56
0So
urce
: Cal
cula
tions
bas
ed o
n IT
C d
ata
HS
Cod
eSe
ctor
sB
razi
lR
ussi
aC
hina
Sout
h A
fric
a
Tab
le 21
: Ind
ia’s
IIT w
ith se
lect P
TA
par
tner
s and
BR
ICS
Prod
uct c
ode
Prod
uct l
abel
Sing
apor
eSr
i Lan
kaBR
ICS
ASE
AN
MER
CO
SUR
SAA
RC
‘01
Live
ani
mal
s0.
1374
0.00
000.
0011
0.64
090.
0012
0.00
00‘0
2M
eat a
nd e
dibl
e m
eat o
ffal
0.00
00.
0000
0.00
060.
0000
0.00
000.
0000
‘03
Fish
, cru
stac
eans
, mol
lusc
s, a
quat
ic in
vert
ebra
tes
nes
0.02
520.
0068
0.00
120.
0417
0.27
660.
9953
‘04
Dai
ry p
rodu
cts,
egg
s, h
oney
, edi
ble
anim
al p
rodu
ct n
es0.
0126
0.00
000.
7128
0.05
230.
0000
0.12
40‘0
5Pr
oduc
ts o
f ani
mal
ori
gin,
nes
0.01
170.
1783
0.88
340.
9971
0.00
000.
6749
‘06
Live
tree
s, p
lant
s, b
ulbs
, roo
ts, c
ut fl
ower
s et
c0.
0116
0.00
000.
9964
0.93
470.
7358
0.17
83‘0
7Ed
ible
veg
etab
les
and
cert
ain
root
s an
d tu
bers
0.06
260.
0050
0.10
830.
2058
0.13
370.
0139
‘08
Edib
le fr
uit,
nuts
, pee
l of c
itrus
frui
t, m
elon
s0.
1516
0.89
490.
3170
0.63
320.
9438
0.93
72‘0
9C
offe
e, te
a, m
ate
and
spic
es0.
0243
0.69
690.
3027
0.86
160.
3450
0.64
12‘1
0C
erea
ls0.
0000
0.00
000.
0000
0.00
020.
0104
0.01
30‘1
1M
illin
g pr
oduc
ts, m
alt,
star
ches
, inu
lin, w
heat
glu
ten
0.07
790.
5609
0.92
210.
6978
0.00
930.
2250
‘12
Oil
seed
, ole
agic
fru
its, g
rain
, see
d, f
ruit,
etc
, nes
0.00
950.
3315
0.58
810.
1136
0.21
030.
3097
‘13
Lac,
gum
s, r
esin
s, v
eget
able
sap
s an
d ex
trac
ts n
es0.
6439
0.53
140.
2609
0.95
670.
3454
0.40
10‘1
4V
eget
able
pla
iting
mat
eria
ls, v
eget
able
pro
duct
s ne
s0.
4839
0.00
000.
0142
0.83
080.
0000
0.82
82

86 India’s Experiences on Preferential Trade Agreements
Prod
uct c
ode
Prod
uct l
abel
Sing
apor
eSr
i Lan
kaBR
ICS
ASE
AN
MER
CO
SUR
SAA
RC
‘15
Ani
mal
,veg
etab
le f
ats
and
oils
, cle
avag
e pr
oduc
ts, e
tc0.
9334
0.21
760.
9535
0.02
390.
0262
0.58
84‘1
6M
eat,
fish
and
seaf
ood
food
pre
para
tions
nes
0.08
810.
3841
0.02
140.
0574
0.00
000.
4318
‘17
Suga
rs a
nd s
ugar
con
fect
ione
ry0.
2528
0.02
140.
0051
0.10
110.
0000
0.12
15‘1
8C
ocoa
and
coc
oa p
repa
ratio
ns0.
0827
0.37
820.
9927
0.16
510.
0000
0.92
43‘1
9C
erea
l, flo
ur, s
tarc
h, m
ilk p
repa
ratio
ns a
nd p
rodu
cts
0.35
110.
0339
0.60
610.
5926
0.00
000.
3242
‘20
Veg
etab
le, f
ruit,
nut
, etc
food
pre
para
tions
0.32
920.
7116
0.51
670.
9637
0.09
520.
9384
‘21
Mis
cella
neou
s ed
ible
pre
para
tions
0.28
450.
9586
0.17
420.
6094
0.14
080.
4730
‘22
Beve
rage
s, s
piri
ts a
nd v
ineg
ar0.
7824
0.20
640.
0430
0.71
840.
0019
0.54
55‘2
3R
esid
ues,
was
tes
of fo
od in
dust
ry, a
nim
al fo
dder
0.19
720.
9965
0.33
050.
0773
0.12
630.
3160
‘24
Tob
acco
and
man
ufac
ture
d to
bacc
o su
bstit
utes
0.39
550.
0000
0.03
350.
2541
0.08
140.
0016
‘25
Salt,
sul
phur
, ear
th, s
tone
, pla
ster
, lim
e an
d ce
men
t0.
9812
0.06
690.
8968
0.72
660.
1694
0.68
89‘2
6O
res,
sla
g an
d as
h0.
2061
0.23
200.
1900
0.10
900.
0000
0.20
44‘2
7M
iner
al f
uels
, oils
, dis
tilla
tion
prod
ucts
, etc
.0.
7764
0.07
590.
5399
0.69
150.
7195
0.13
29‘2
8In
orga
nic
chem
ical
s, p
reci
ous
met
al c
ompo
und,
isot
opes
0.31
600.
1379
0.26
050.
9463
0.91
650.
7254
‘29
Org
anic
che
mic
als
0.42
920.
0077
0.39
150.
8310
0.43
860.
1798
‘30
Phar
mac
eutic
al p
rodu
cts
0.52
070.
0057
0.22
170.
2268
0.05
240.
0464
‘31
Fert
ilise
rs0.
1267
0.00
000.
0003
0.33
600.
4000
0.74
36‘3
2T
anni
ng, d
yein
g ex
trac
ts, t
anni
ns, d
eriv
s, p
igm
ents
etc
.0.
8510
0.06
680.
9327
0.98
700.
1340
0.32
19‘3
3Es
sent
ial o
ils, p
erfu
mes
, cos
met
ics,
toi
lete
ries
0.63
260.
1117
0.93
430.
7933
0.44
260.
2850
‘34
Soap
s, lu
bric
ants
, wax
es, c
andl
es, m
odel
ling
past
es0.
8220
0.00
320.
9204
0.60
830.
6824
0.30
19‘3
5A
lbum
inoi
ds, m
odifi
ed s
tarc
hes,
glu
es, e
nzym
es0.
8491
0.02
500.
1661
0.91
010.
5232
0.07
51‘3
6Ex
plos
ives
, pyr
otec
hnic
s, m
atch
es, p
yrop
hori
cs, e
tc0.
8235
0.00
000.
1058
0.00
380.
9901
0.00
00‘3
7Ph
otog
raph
ic o
r cin
emat
ogra
phic
goo
ds0.
6695
0.01
020.
0398
0.82
270.
0448
0.02
03‘3
8M
isce
llane
ous c
hem
ical
pro
duct
s0.
7144
0.11
160.
8925
0.81
130.
1246
0.23
85‘3
9Pl
astic
s an
d ar
ticle
s th
ereo
f0.
2484
0.15
930.
6991
0.44
710.
8147
0.55
29

India’s Experiences on Preferential Trade Agreements 87
Prod
uct c
ode
Prod
uct l
abel
Sing
apor
eSr
i Lan
kaBR
ICS
ASE
AN
MER
CO
SUR
SAA
RC
‘40
Rub
ber
and
artic
les
ther
eof
0.84
090.
6655
0.33
390.
5386
0.88
720.
5352
‘41
Raw
hid
es a
nd s
kins
(oth
er th
an fu
rski
ns) a
nd le
athe
r0.
4812
0.09
670.
5768
0.33
290.
0160
0.39
75‘4
2A
rtic
les
of le
athe
r, a
nim
al g
ut, h
arne
ss, t
rave
l goo
ds0.
2375
0.09
600.
3222
0.47
810.
0173
0.11
34‘4
3Fu
rski
ns a
nd a
rtifi
cial
fur,
man
ufac
ture
s th
ereo
f0.
0000
0.00
00.
0000
0.00
000.
0000
0.82
35‘4
4W
ood
and
artic
les o
f woo
d, w
ood
char
coal
0.58
120.
7956
0.06
660.
0082
0.17
160.
8662
‘45
Cor
k an
d ar
ticle
s of
cor
k0.
8000
0.00
000.
1196
0.31
680.
000
0.00
00‘4
6M
anuf
actu
res
of p
laiti
ng m
ater
ial,
bask
etw
ork,
etc
.0.
3158
0.00
000.
1254
0.48
610.
0000
0.17
99‘4
7Pu
lp o
f woo
d, fi
brou
s ce
llulo
sic
mat
eria
l, w
aste
etc
0.00
000.
1444
0.00
110.
0034
0.00
110.
1458
‘48
Pape
r &
pap
erbo
ard,
art
icle
s of
pul
p, p
aper
and
boa
rd0.
9442
0.26
510.
1135
0.61
910.
4255
0.16
60‘4
9Pr
inte
d bo
oks,
new
spap
ers,
pic
ture
s etc
0.16
840.
4691
0.20
190.
4071
0.74
710.
2630
‘50
Silk
0.03
100.
0305
0.04
710.
6232
0.93
790.
0723
‘51
Woo
l, an
imal
hai
r, h
orse
hair
yar
n an
d fa
bric
the
reof
0.01
420.
0000
0.25
260.
2814
0.00
360.
8131
‘52
Cot
ton
0.04
720.
0537
0.26
600.
0685
0.00
330.
1253
‘53
Veg
etab
le te
xtile
fibr
es n
es, p
aper
yar
n, w
oven
fabr
ic0.
3417
0.12
540.
7086
0.50
830.
0434
0.36
32‘5
4M
anm
ade
filam
ents
0.62
630.
1162
0.56
730.
9395
0.00
380.
0730
‘55
Man
mad
e st
aple
fibr
es0.
1641
0.06
000.
7693
0.95
780.
0093
0.56
52‘5
6W
addi
ng, f
elt,
nonw
oven
s, y
arns
, tw
ine,
cor
dage
, etc
0.04
090.
5118
0.43
420.
5921
0.32
470.
6819
‘57
Car
pets
and
oth
er te
xtile
floo
r co
veri
ngs
0.30
260.
3803
0.70
050.
9782
0.00
000.
4183
‘58
Spec
ial w
oven
or
tuft
ed fa
bric
, lac
e, ta
pest
ry e
tc0.
4104
0.96
620.
1045
0.82
330.
0134
0.69
52‘5
9Im
preg
nate
d, c
oate
d or
lam
inat
ed te
xtile
fabr
ic0.
7492
0.12
230.
0320
0.16
180.
6232
0.46
56‘6
0K
nitt
ed o
r cro
chet
ed fa
bric
0.96
910.
1648
0.03
260.
8044
0.00
000.
3458
‘61
Art
icle
s of
app
arel
, acc
esso
ries
, kni
t or
croc
het
0.04
910.
5051
0.30
890.
2229
0.00
330.
5257
‘62
Art
icle
s of
app
arel
, acc
esso
ries
, not
kni
t or
croc
het
0.03
080.
4410
0.35
260.
0591
0.00
110.
6596
‘63
Oth
er m
ade
text
ile a
rtic
les,
set
s, w
orn
clot
hing
etc
0.38
020.
2270
0.83
290.
6432
0.00
000.
3679
‘64
Foot
wea
r, g
aite
rs a
nd th
e lik
e, p
arts
ther
eof
0.30
270.
2080
0.32
110.
7477
0.61
330.
8508

88 India’s Experiences on Preferential Trade Agreements
Prod
uct c
ode
Prod
uct l
abel
Sing
apor
eSr
i Lan
kaBR
ICS
ASE
AN
MER
CO
SUR
SAA
RC
‘65
Hea
dgea
r an
d pa
rts
ther
eof
0.43
900.
0571
0.37
430.
9933
0.00
000.
5970
‘66
Um
brel
las,
wal
king
-stic
ks, s
eat-
stic
ks, w
hips
, etc
1.00
000.
0827
0.00
080.
0777
0.00
000.
0550
‘67
Bird
ski
n, f
eath
ers,
art
ifici
al f
low
ers,
hum
an h
air
0.00
680.
0000
0.07
840.
0411
0.00
000.
0444
‘68
Ston
e, p
last
er, c
emen
t, as
best
os, m
ica,
etc
art
icle
s0.
5195
0.76
530.
6304
0.86
310.
7996
0.60
97‘6
9C
eram
ic p
rodu
cts
0.36
720.
5606
0.09
480.
9656
0.15
870.
3242
‘70
Gla
ss a
nd g
lass
war
e0.
8467
0.54
880.
6031
0.57
440.
1679
0.90
67‘7
1Pe
arls
, pre
ciou
s st
ones
, met
als,
coi
ns, e
tc0.
3528
0.71
440.
5013
0.52
460.
7990
0.51
54‘7
2Ir
on a
nd s
teel
0.53
710.
0488
0.49
160.
6202
0.44
140.
5820
‘73
Art
icle
s of
iron
or
stee
l0.
9997
0.10
020.
1750
0.98
880.
6258
0.40
67‘7
4C
oppe
r an
d ar
ticle
s th
ereo
f0.
1305
0.38
980.
5293
0.51
030.
3632
0.95
13‘7
5N
icke
l and
art
icle
s th
ereo
f0.
3987
0.00
000.
0110
0.72
500.
0474
0.81
47‘7
6A
lum
iniu
m a
nd a
rtic
les
ther
eof
0.23
140.
1140
0.61
410.
6179
0.91
440.
2558
‘78
Lead
and
art
icle
s th
ereo
f0.
7047
0.82
660.
1915
0.21
660.
0000
0.46
39‘7
9Z
inc
and
artic
les
ther
eof
0.37
970.
5393
0.28
120.
2080
0.00
000.
0810
‘80
Tin
and
art
icle
s th
ereo
f0.
1489
0.00
000.
2016
0.15
560.
0000
0.00
00‘8
1O
ther
bas
e m
etal
s, c
erm
ets,
art
icle
s th
ereo
f0.
5991
0.00
000.
1045
0.92
990.
3042
0.00
00‘8
2T
ools
, im
plem
ents
, cut
lery
, etc
of b
ase
met
al0.
8382
0.66
400.
5933
0.95
230.
1527
0.20
90‘8
3M
isce
llane
ous
artic
les
of b
ase
met
al0.
9227
0.19
870.
2220
0.95
990.
7615
0.08
57‘8
4M
achi
nery
, nuc
lear
rea
ctor
s, b
oile
rs, e
tc0.
5893
0.73
780.
1619
0.57
040.
9361
0.25
10‘8
5El
ectr
ical
, ele
ctro
nic
equi
pmen
t0.
5229
0.79
060.
1063
0.70
330.
2891
0.33
91‘8
6R
ailw
ay, t
ram
way
loco
mot
ives
, rol
ling
stoc
k, e
quip
men
t0.
0765
0.00
000.
0522
0.11
530.
0000
0.00
00‘8
7V
ehic
les
othe
r th
an r
ailw
ay, t
ram
way
0.32
580.
0059
0.75
700.
6387
0.59
580.
0123
‘88
Air
craf
t, sp
acec
raft
, and
par
ts th
ereo
f0.
6665
0.34
880.
7315
0.49
810.
0286
0.02
90‘8
9Sh
ips,
boa
ts a
nd o
ther
floa
ting
stru
ctur
es0.
6437
0.97
740.
3032
0.39
280.
1974
0.63
74‘9
0O
ptic
al, p
hoto
, tec
hnic
al, m
edic
al, e
tc a
ppar
atus
0.57
160.
1456
0.33
890.
6200
0.98
090.
1574

India’s Experiences on Preferential Trade Agreements 89
‘91
Clo
cks
and
wat
ches
and
par
ts th
ereo
f0.
3167
0.00
220.
0060
0.78
410.
0000
0.00
10‘9
2M
usic
al in
stru
men
ts, p
arts
and
acc
esso
ries
0.30
850.
0000
0.24
870.
3478
0.00
000.
0063
‘93
Arm
s an
d am
mun
ition
, par
ts a
nd a
cces
sori
es th
ereo
f0.
0142
0.00
000.
0934
0.00
230.
0158
0.00
00‘9
4Fu
rnitu
re, l
ight
ing,
sig
ns, p
refa
bric
ated
bui
ldin
gs0.
1732
0.47
250.
0926
0.12
680.
0993
0.85
41‘9
5T
oys,
gam
es, s
port
s re
quis
ites
0.41
580.
5427
0.09
050.
7174
0.17
030.
4240
‘96
Mis
cella
neou
s m
anuf
actu
red
artic
les
0.84
210.
2533
0.15
480.
5620
0.07
190.
1035
‘97
Wor
ks o
f art
, col
lect
ors
piec
es a
nd a
ntiq
ues
0.90
930.
0074
0.62
150.
6852
0.27
690.
3741
‘99
Com
mod
ities
not
els
ewhe
re sp
ecifi
ed0.
1744
0.10
370.
0990
0.19
500.
0489
0.20
02T
otal
All
prod
ucts
0.94
710.
3202
0.52
840.
8550
0.74
790.
3363
Sour
ce: C
alcu
latio
ns b
ased
on
ITC
dat
a
Prod
uct c
ode
Prod
uct l
abel
Sing
apor
eSr
i Lan
kaBR
ICS
ASE
AN
MER
CO
SUR
SAA
RC

90 India’s Experiences on Preferential Trade Agreements
Tab
le 2
2: R
evea
led
Com
para
tive
Adv
anta
ge (R
CA
) for
99
sect
ors
for
BR
ICS
HS
Cod
eSe
ctor
sB
razi
lR
ussi
aIn
dia
Chi
naSo
uth
Afr
ica
‘01
Live
ani
mal
s2.
800.
010.
030.
230.
36‘0
2M
eat a
nd e
dibl
e m
eat o
ffal
9.04
0.01
0.65
0.10
0.28
‘03
Fish
, cru
stac
eans
, mol
lusc
s, a
quat
ic in
vert
ebra
tes
nes
0.18
1.03
1.96
1.00
1.13
‘04
Dai
ry p
rodu
cts,
egg
s, h
oney
, edi
ble
anim
al p
rodu
ct n
es0.
320.
100.
160.
050.
25‘0
5Pr
oduc
ts o
f ani
mal
ori
gin,
nes
4.55
0.12
1.00
1.76
0.46
‘06
Live
tree
s, p
lant
s, b
ulbs
, roo
ts, c
ut fl
ower
s et
c0.
100.
000.
240.
090.
63‘0
7Ed
ible
veg
etab
les
and
cert
ain
root
s an
d tu
bers
0.02
0.05
1.09
1.23
0.22
‘08
Edib
le fr
uit,
nuts
, pee
l of c
itrus
frui
t, m
elon
s0.
850.
020.
900.
335.
80‘0
9C
offe
e, te
a, m
ate
and
spic
es10
.72
0.09
3.69
0.42
0.24
‘10
Cer
eals
2.38
1.19
0.89
0.06
0.85
‘11
Mill
ing
prod
ucts
, mal
t, st
arch
es, i
nulin
, whe
at g
lute
n0.
280.
260.
390.
381.
79‘1
2O
il se
ed, o
leag
ic f
ruits
, gra
in, s
eed,
fru
it, e
tc, n
es11
.63
0.05
1.14
0.27
0.49
‘13
Lac,
gum
s, r
esin
s, v
eget
able
sap
s an
d ex
trac
ts n
es1.
010.
019.
401.
060.
15‘1
4V
eget
able
pla
iting
mat
eria
ls, v
eget
able
pro
duct
s ne
s1.
020.
258.
520.
620.
15‘1
5A
nim
al,v
eget
able
fat
s an
d oi
ls, c
leav
age
prod
ucts
, etc
1.53
0.37
0.90
0.04
0.46
‘16
Mea
t, fis
h an
d se
afoo
d fo
od p
repa
ratio
ns n
es2.
790.
120.
311.
430.
27‘1
7Su
gars
and
sug
ar c
onfe
ctio
nery
21.9
40.
110.
700.
231.
36‘1
8C
ocoa
and
coc
oa p
repa
ratio
ns0.
740.
270.
060.
050.
45‘1
9C
erea
l, flo
ur, s
tarc
h, m
ilk p
repa
ratio
ns a
nd p
rodu
cts
0.26
0.21
0.34
0.23
0.38
‘20
Veg
etab
le, f
ruit,
nut
, etc
food
pre
para
tions
3.04
0.06
0.77
1.08
2.05
‘21
Mis
cella
neou
s ed
ible
pre
para
tions
1.71
0.26
0.72
0.30
1.02
‘22
Beve
rage
s, s
piri
ts a
nd v
ineg
ar0.
930.
150.
060.
112.
59‘2
3R
esid
ues,
was
tes
of fo
od in
dust
ry, a
nim
al fo
dder
6.51
0.22
2.05
0.32
0.44
‘24
Tob
acco
and
man
ufac
ture
d to
bacc
o su
bstit
utes
5.82
0.43
1.78
0.28
1.45

India’s Experiences on Preferential Trade Agreements 91
‘25
Salt,
sul
phur
, ear
th, s
tone
, pla
ster
, lim
e an
d ce
men
t1.
360.
943.
130.
751.
83‘2
6O
res,
sla
g an
d as
h11
.01
0.43
5.28
0.03
9.86
‘27
Min
eral
fue
ls, o
ils, d
istil
latio
n pr
oduc
ts, e
tc0.
654.
651.
130.
110.
67‘2
8In
orga
nic
chem
ical
s, p
reci
ous
met
al c
ompo
und,
isot
opes
1.72
2.21
0.56
0.95
1.99
‘29
Org
anic
che
mic
als
0.60
0.32
2.16
0.76
0.69
‘30
Phar
mac
eutic
al p
rodu
cts
0.21
0.03
1.32
0.09
0.07
‘31
Fert
ilize
rs0.
425.
310.
130.
920.
73‘3
2T
anni
ng, d
yein
g ex
trac
ts, t
anni
ns, d
eriv
s,pi
gmen
ts e
tc0.
430.
092.
050.
570.
71‘3
3Es
sent
ial o
ils, p
erfu
mes
, cos
met
ics,
toi
lete
ries
0.58
0.13
0.71
0.26
0.70
‘34
Soap
s, lu
bric
ants
, wax
es, c
andl
es, m
odel
ling
past
es0.
500.
290.
500.
410.
97‘3
5A
lbum
inoi
ds, m
odifi
ed s
tarc
hes,
glu
es, e
nzym
es0.
990.
041.
080.
720.
35‘3
6Ex
plos
ives
, pyr
otec
hnic
s, m
atch
es, p
yrop
hori
cs, e
tc0.
470.
641.
381.
535.
74‘3
7Ph
otog
raph
ic o
r cin
emat
ogra
phic
goo
ds0.
310.
010.
110.
560.
30‘3
8M
isce
llane
ous c
hem
ical
pro
duct
s0.
440.
090.
800.
580.
76‘3
9Pl
astic
s an
d ar
ticle
s th
ereo
f0.
490.
120.
520.
680.
41‘4
0R
ubbe
r an
d ar
ticle
s th
ereo
f0.
900.
660.
760.
820.
43‘4
1R
aw h
ides
and
ski
ns (o
ther
than
furs
kins
) and
leat
her
4.54
0.25
2.10
0.14
1.34
‘42
Art
icle
s of
leat
her,
ani
mal
gut
, har
ness
, tra
vel g
oods
0.14
0.02
3.42
4.04
0.10
‘43
Furs
kins
and
art
ifici
al fu
r, m
anuf
actu
res
ther
eof
0.30
0.30
0.06
2.55
0.11
‘44
Woo
d an
d ar
ticle
s of w
ood,
woo
d ch
arco
al1.
282.
250.
120.
830.
70‘4
5C
ork
and
artic
les
of c
ork
0.08
0.00
0.09
0.09
0.28
‘46
Man
ufac
ture
s of
pla
iting
mat
eria
l, ba
sket
wor
k, e
tc.
0.00
0.00
1.87
6.33
0.40
‘47
Pulp
of w
ood,
fibr
ous
cellu
losi
c m
ater
ial,
was
te e
tc7.
600.
990.
010.
033.
42‘4
8Pa
per
& p
aper
boar
d, a
rtic
les
of p
ulp,
pap
er a
nd b
oard
0.86
0.36
0.34
0.52
0.78
‘49
Prin
ted
book
s, n
ewsp
aper
s, p
ictu
res e
tc0.
090.
280.
490.
590.
43
HS
Cod
eSe
ctor
sB
razi
lR
ussi
aIn
dia
Chi
naSo
uth
Afr
ica

92 India’s Experiences on Preferential Trade Agreements
‘50
Silk
0.85
0.00
5.34
5.09
0.01
‘51
Woo
l, an
imal
hai
r, h
orse
hair
yar
n an
d fa
bric
the
reof
0.20
0.05
1.00
1.76
4.53
‘52
Cot
ton
1.35
0.04
8.40
2.26
0.09
‘53
Veg
etab
le te
xtile
fibr
es n
es, p
aper
yar
n, w
oven
fabr
ic0.
850.
197.
712.
360.
07‘5
4M
anm
ade
filam
ents
0.17
0.03
2.09
2.39
0.09
‘55
Man
mad
e st
aple
fibr
es0.
370.
033.
062.
240.
08‘5
6W
addi
ng, f
elt,
nonw
oven
s, y
arns
, tw
ine,
cor
dage
, etc
0.93
0.13
0.61
1.20
0.37
‘57
Car
pets
and
oth
er te
xtile
floo
r co
veri
ngs
0.12
0.01
8.74
1.35
0.49
‘58
Spec
ial w
oven
or
tuft
ed fa
bric
, lac
e, ta
pest
ry e
tc0.
270.
011.
753.
180.
16‘5
9Im
preg
nate
d, c
oate
d or
lam
inat
ed te
xtile
fabr
ic0.
410.
060.
372.
360.
26‘6
0K
nitt
ed o
r cro
chet
ed fa
bric
0.16
0.00
0.44
3.26
0.06
‘61
Art
icle
s of
app
arel
, acc
esso
ries
, kni
t or
croc
het
0.04
0.00
2.51
3.53
0.04
‘62
Art
icle
s of
app
arel
, acc
esso
ries
, not
kni
t or
croc
het
0.03
0.02
3.38
3.06
0.06
‘63
Oth
er m
ade
text
ile a
rtic
les,
set
s, w
orn
clot
hing
etc
0.31
0.03
5.66
3.75
0.36
‘64
Foot
wea
r, g
aite
rs a
nd th
e lik
e, p
arts
ther
eof
1.24
0.01
1.94
3.44
0.06
‘65
Hea
dgea
r an
d pa
rts
ther
eof
0.06
0.02
0.37
4.23
0.23
‘66
Um
brel
las,
wal
king
-stic
ks, s
eat-
stic
ks, w
hips
, etc
0.01
0.00
0.07
7.14
0.36
‘67
Bird
ski
n, f
eath
ers,
art
ifici
al f
low
ers,
hum
an h
air
0.00
0.00
3.81
6.45
0.24
‘68
Ston
e, p
last
er, c
emen
t, as
best
os, m
ica,
etc
art
icle
s1.
950.
272.
331.
420.
38‘6
9C
eram
ic p
rodu
cts
0.69
0.19
0.50
2.60
0.40
‘70
Gla
ss a
nd g
lass
war
e0.
340.
190.
601.
530.
45‘7
1Pe
arls
, pre
ciou
s st
ones
, met
als,
coi
ns, e
tc0.
470.
813.
470.
336.
86‘7
2Ir
on a
nd s
teel
1.59
1.95
1.12
0.70
4.23
‘73
Art
icle
s of
iron
or
stee
l0.
450.
301.
161.
490.
97‘7
4C
oppe
r an
d ar
ticle
s th
ereo
f0.
311.
240.
840.
290.
90
HS
Cod
eSe
ctor
sB
razi
lR
ussi
aIn
dia
Chi
naSo
uth
Afr
ica

India’s Experiences on Preferential Trade Agreements 93
‘75
Nic
kel a
nd a
rtic
les
ther
eof
1.03
7.01
0.07
0.40
2.94
‘76
Alu
min
ium
and
art
icle
s th
ereo
f0.
861.
800.
560.
902.
73‘7
8Le
ad a
nd a
rtic
les
ther
eof
0.01
1.10
1.60
0.24
0.59
‘79
Zin
c an
d ar
ticle
s th
ereo
f0.
730.
452.
960.
190.
60‘8
0T
in a
nd a
rtic
les
ther
eof
0.36
0.04
0.11
0.25
0.03
‘81
Oth
er b
ase
met
als,
cer
met
s, a
rtic
les
ther
eof
0.54
1.92
0.22
1.73
1.35
‘82
Too
ls, i
mpl
emen
ts, c
utle
ry, e
tc o
f bas
e m
etal
0.66
0.11
0.97
1.59
0.76
‘83
Mis
cella
neou
s ar
ticle
s of
bas
e m
etal
1.27
0.07
0.96
1.75
0.31
‘84
Mac
hine
ry, n
ucle
ar r
eact
ors,
boi
lers
, etc
0.45
0.12
0.38
1.61
0.59
‘85
Elec
tric
al, e
lect
roni
c eq
uipm
ent
0.20
0.06
0.45
1.94
0.16
‘86
Rai
lway
, tra
mw
ay lo
com
otiv
es, r
ollin
g st
ock,
equ
ipm
ent
1.26
0.60
0.14
2.44
1.07
‘87
Veh
icle
s ot
her
than
rai
lway
, tra
mw
ay0.
810.
080.
550.
331.
21‘8
8A
ircr
aft,
spac
ecra
ft, a
nd p
arts
ther
eof
1.40
0.00
0.06
0.05
0.18
‘89
Ship
s, b
oats
and
oth
er fl
oatin
g st
ruct
ures
0.08
0.54
0.06
2.22
0.13
‘90
Opt
ical
, pho
to, t
echn
ical
, med
ical
, etc
app
arat
us0.
130.
100.
241.
030.
17‘9
1C
lock
s an
d w
atch
es a
nd p
arts
ther
eof
0.01
0.01
0.10
0.91
0.05
‘92
Mus
ical
inst
rum
ents
, par
ts a
nd a
cces
sori
es0.
060.
000.
232.
290.
05‘9
3A
rms
and
amm
uniti
on, p
arts
and
acc
esso
ries
ther
eof
1.75
6.81
0.18
0.07
NA
‘94
Furn
iture
, lig
htin
g, s
igns
, pre
fabr
icat
ed b
uild
ings
0.37
0.08
0.54
2.75
0.74
‘95
Toy
s, g
ames
, spo
rts
requ
isite
s0.
040.
040.
223.
550.
09‘9
6M
isce
llane
ous
man
ufac
ture
d ar
ticle
s0.
430.
340.
903.
070.
18‘9
7W
orks
of a
rt, c
olle
ctor
s pi
eces
and
ant
ique
s0.
080.
010.
370.
080.
46‘9
9C
omm
oditi
es n
ot e
lsew
here
spec
ified
1.19
0.35
0.36
0.06
0.03
Sour
ce: C
alcu
latio
ns b
ased
on
ITC
dat
a
HS
Cod
eSe
ctor
sB
razi
lR
ussi
aIn
dia
Chi
naSo
uth
Afr
ica

94 India’s Experiences on Preferential Trade Agreements
Tab
le 2
3: R
evea
led
Com
para
tive
Adv
anta
ge (R
CA
) for
99
sect
ors
HS
Cod
eSe
ctor
sA
fgha
nist
anA
rgen
tina
Bang
lade
shBh
utan
Chi
le‘0
1Li
ve a
nim
als
0.47
1144
0.38
4993
0.00
00
0.13
81‘0
2M
eat a
nd e
dibl
e m
eat o
ffal
12.0
5343
4.16
288
0.00
10.
3803
031.
5283
‘03
Fish
, cru
stac
eans
, mol
lusc
s, a
quat
ic in
vert
ebra
tes
nes
0.11
8596
4.00
9093
4.84
20.
5491
536.
6827
‘04
Dai
ry p
rodu
cts,
egg
s, h
oney
, edi
ble
anim
al p
rodu
ct n
es0.
2914
892.
3639
660.
001
00.
5748
‘05
Prod
ucts
of a
nim
al o
rigi
n, n
es0.
1092
972.
7836
330.
294
0.10
3147
0.90
68‘0
6Li
ve tr
ees,
pla
nts,
bul
bs, r
oots
, cut
flow
ers
etc
0.06
9918
0.03
7153
0.00
00
0.46
07‘0
7Ed
ible
veg
etab
les
and
cert
ain
root
s an
d tu
bers
25.1
6408
2.49
8209
0.25
61.
4855
090.
5434
‘08
Edib
le fr
uit,
nuts
, pee
l of c
itrus
frui
t, m
elon
s0.
1489
424.
9490
070.
024
0.06
919
9.51
22‘0
9C
offe
e, te
a, m
ate
and
spic
es1.
1799
230.
7942
990.
730
0.02
0259
0.08
63‘1
0C
erea
ls0.
0509
2211
.506
080.
031
1.87
0676
0.44
52‘1
1M
illin
g pr
oduc
ts, m
alt,
star
ches
, inu
lin, w
heat
glu
ten
0.12
7121
11.1
8346
0.00
60
1.28
67‘1
2O
il se
ed, o
leag
ic f
ruits
, gra
in, s
eed,
fru
it, e
tc, n
es4.
5017
2421
.492
370.
132
0.09
5542
0.92
97‘1
3La
c, g
ums,
res
ins,
veg
etab
le s
aps
and
extr
acts
nes
0.00
7371
0.08
802
0.01
10
3.60
23‘1
4V
eget
able
pla
iting
mat
eria
ls, v
eget
able
pro
duct
s ne
s0.
2833
652.
3711
320.
487
03.
7219
‘15
Ani
mal
,veg
etab
le f
ats
and
oils
, cle
avag
e pr
oduc
ts, e
tc0.
1697
918.
0778
80.
017
00.
2381
‘16
Mea
t, fis
h an
d se
afoo
d fo
od p
repa
ratio
ns n
es37
.635
730.
9726
790.
531
NA
1.91
08‘1
7Su
gars
and
sug
ar c
onfe
ctio
nery
0.15
4596
2.38
350.
008
00.
1524
‘18
Coc
oa a
nd c
ocoa
pre
para
tions
NA
0.65
9348
0.00
0N
A0.
1891
‘19
Cer
eal,
flour
, sta
rch,
milk
pre
para
tions
and
pro
duct
s0.
0393
431.
3508
740.
145
00.
6576
‘20
Veg
etab
le, f
ruit,
nut
, etc
food
pre
para
tions
0.06
4616
3.73
3594
0.04
23.
2288
392.
2630
‘21
Mis
cella
neou
s ed
ible
pre
para
tions
0.17
2528
0.91
5537
0.00
90
1.57
73‘2
2Be
vera
ges,
spi
rits
and
vin
egar
0.01
9291
2.45
8704
0.00
80
3.93
08‘2
3R
esid
ues,
was
tes
of fo
od in
dust
ry, a
nim
al fo
dder
NA
34.3
1976
0.00
20
2.19
16‘2
4T
obac
co a
nd m
anuf
actu
red
toba
cco
subs
titut
es0.
3761
062.
4166
541.
605
NA
0.35
85

India’s Experiences on Preferential Trade Agreements 95
HS
Cod
eSe
ctor
sA
fgha
nist
anA
rgen
tina
Bang
lade
shBh
utan
Chi
le‘2
5Sa
lt, s
ulph
ur, e
arth
, sto
ne, p
last
er, l
ime
and
cem
ent
1.25
0906
0.82
6598
0.01
913
.308
810.
7382
‘26
Ore
s, s
lag
and
ash
0.00
8481
1.78
7769
0.08
00
15.9
994
‘27
Min
eral
fue
ls, o
ils, d
istil
latio
n pr
oduc
ts, e
tc.
0.01
311
0.64
4032
0.03
90.
2209
520.
0270
‘28
Inor
gani
c ch
emic
als,
pre
ciou
s m
etal
com
poun
d, is
otop
es4.
4915
480.
6551
970.
044
59.2
9539
2.31
98‘2
9O
rgan
ic c
hem
ical
s1.
8495
870.
3213
140.
000
0.00
3872
0.14
52‘3
0Ph
arm
aceu
tical
pro
duct
s0.
4734
440.
3591
740.
048
0.00
1648
0.05
85‘3
1Fe
rtili
sers
0.03
3342
0.24
693
0.36
50
2.53
49‘3
2T
anni
ng, d
yein
g ex
trac
ts, t
anni
ns, d
eriv
s, p
igm
ents
etc
.0.
1254
460.
6781
840.
001
0.01
0566
0.06
06‘3
3Es
sent
ial o
ils, p
erfu
mes
, cos
met
ics,
toi
lete
ries
13.1
8847
1.70
6248
0.00
40.
1754
580.
1732
‘34
Soap
s, lu
bric
ants
, wax
es, c
andl
es, m
odel
ling
past
es6.
8337
380.
9858
90.
004
00.
0482
‘35
Alb
umin
oids
, mod
ified
sta
rche
s, g
lues
, enz
ymes
0.17
0064
2.76
9569
0.01
7N
A0.
1693
‘36
Expl
osiv
es, p
yrot
echn
ics,
mat
ches
, pyr
opho
rics
, etc
.0.
0073
650.
4423
830.
000
NA
1.74
44‘3
7Ph
otog
raph
ic o
r cin
emat
ogra
phic
goo
ds0.
3183
070.
8826
990.
000
10.2
6822
0.02
38‘3
8M
isce
llane
ous c
hem
ical
pro
duct
s5.
7135
182.
9563
520.
003
0.01
4546
0.16
76‘3
9Pl
astic
s an
d ar
ticle
s th
ereo
f0.
0102
810.
6565
260.
080
0.60
6152
0.20
24‘4
0R
ubbe
r an
d ar
ticle
s th
ereo
f1.
6438
70.
5453
430.
030
0.22
7045
0.23
60‘4
1R
aw h
ides
and
ski
ns (o
ther
than
furs
kins
) and
leat
her
0.09
2662
7.64
7635
4.14
40
0.25
38‘4
2A
rtic
les
of le
athe
r, a
nim
al g
ut, h
arne
ss, t
rave
l goo
ds0.
4464
730.
1823
510.
424
0.01
5461
0.01
48‘4
3Fu
rski
ns a
nd a
rtifi
cial
fur,
man
ufac
ture
s th
ereo
f0.
0017
331.
4525
130.
046
00.
0000
‘44
Woo
d an
d ar
ticle
s of w
ood,
woo
d ch
arco
al0.
0936
060.
6524
840.
007
0.27
2893
3.63
52‘4
5C
ork
and
artic
les
of c
ork
NA
0.24
846
0.00
0N
A1.
0981
‘46
Man
ufac
ture
s of
pla
iting
mat
eria
l, ba
sket
wor
k, e
tc.
0.77
9696
0.00
2506
1.17
10
0.00
53‘4
7Pu
lp o
f woo
d, fi
brou
s ce
llulo
sic
mat
eria
l, w
aste
etc
0.01
6281
0.87
6595
0.00
20
11.4
640
‘48
Pape
r &
pap
erbo
ard,
art
icle
s of
pul
p, p
aper
and
boa
rd0.
9657
80.
5379
010.
012
0.02
614
0.80
82‘4
9Pr
inte
d bo
oks,
new
spap
ers,
pic
ture
s etc
0.20
2906
0.38
4129
0.01
90.
3123
210.
2131

96 India’s Experiences on Preferential Trade Agreements
‘50
Silk
17.6
697
0.00
0233
0.00
20
0.00
92‘5
1W
ool,
anim
al h
air,
hor
seha
ir y
arn
and
fabr
ic t
here
of0.
1068
435.
0844
510.
002
00.
5718
‘52
Cot
ton
0.07
3273
0.36
1631
0.25
70
0.12
93‘5
3V
eget
able
text
ile fi
bres
nes
, pap
er y
arn,
wov
en fa
bric
0.04
9593
0.00
3329
114.
006
0.21
6041
0.09
63‘5
4M
anm
ade
filam
ents
0.21
7437
0.32
2246
0.08
60.
4727
980.
0634
‘55
Man
mad
e st
aple
fibr
es0.
0806
080.
0651
070.
053
00.
0595
‘56
Wad
ding
, fel
t, no
nwov
ens,
yar
ns, t
win
e, c
orda
ge, e
tc0.
3532
970.
7901
230.
641
1.17
6132
0.09
24‘5
7C
arpe
ts a
nd o
ther
text
ile fl
oor
cove
ring
s1.
9572
190.
1605
650.
533
0.71
5168
0.04
41‘5
8Sp
ecia
l wov
en o
r tu
fted
fabr
ic, l
ace,
tape
stry
etc
1.26
5908
0.37
7903
0.12
9N
A0.
0228
‘59
Impr
egna
ted,
coa
ted
or la
min
ated
text
ile fa
bric
0.18
3684
0.53
0324
0.01
90.
0667
640.
0485
‘60
Kni
tted
or c
roch
eted
fabr
ic0.
4761
040.
1327
430.
062
NA
0.10
24‘6
1A
rtic
les
of a
ppar
el, a
cces
sori
es, k
nit o
r cr
oche
t0.
3803
070.
0722
0339
.036
0.55
2594
0.01
39‘6
2A
rtic
les
of a
ppar
el, a
cces
sori
es, n
ot k
nit o
r cr
oche
t0.
7336
710.
0430
5532
.797
0.25
9879
0.02
06‘6
3O
ther
mad
e te
xtile
art
icle
s, s
ets,
wor
n cl
othi
ng e
tc0.
0620
890.
1023
8910
.854
0.06
048
0.02
98‘6
4Fo
otw
ear,
gai
ters
and
the
like,
par
ts th
ereo
f0.
9983
340.
0766
722.
128
0.00
7698
0.02
60‘6
5H
eadg
ear
and
part
s th
ereo
f2.
7353
740.
0729
7114
.792
4.45
7129
0.02
66‘6
6U
mbr
ella
s, w
alki
ng-s
ticks
, sea
t-st
icks
, whi
ps, e
tcN
A0.
0226
140.
094
NA
0.00
10‘6
7Bi
rd s
kin,
fea
ther
s, a
rtifi
cial
flo
wer
s, h
uman
hai
rN
A0.
0207
20.
324
00.
0007
‘68
Ston
e, p
last
er, c
emen
t, as
best
os, m
ica,
etc
art
icle
s0.
8692
880.
4990
090.
004
0.43
0809
0.08
32‘6
9C
eram
ic p
rodu
cts
0.49
2977
0.46
9956
0.68
70.
2991
580.
0467
‘70
Gla
ss a
nd g
lass
war
e0.
5246
050.
1729
510.
010
00.
1433
‘71
Pear
ls, p
reci
ous
ston
es, m
etal
s, c
oins
, etc
0.01
7567
0.87
9659
0.00
10.
0020
990.
8679
‘72
Iron
and
ste
el27
.854
030.
3143
750.
031
6.62
7673
0.24
87‘7
3A
rtic
les
of ir
on o
r st
eel
0.14
8168
0.82
4523
0.01
70.
3247
680.
2239
‘74
Cop
per
and
artic
les
ther
eof
0.14
5084
0.02
9509
0.14
90
37.9
227
HS
Cod
eSe
ctor
sA
fgha
nist
anA
rgen
tina
Bang
lade
shBh
utan
Chi
le

India’s Experiences on Preferential Trade Agreements 97
‘75
Nic
kel a
nd a
rtic
les
ther
eof
NA
0.00
3601
0.00
0N
A0.
0004
‘76
Alu
min
ium
and
art
icle
s th
ereo
f1.
2600
011.
3801
450.
002
0.02
4779
0.11
74‘7
8Le
ad a
nd a
rtic
les
ther
eof
NA
1.79
1495
0.00
00
0.56
85‘7
9Z
inc
and
artic
les
ther
eof
NA
0.30
6554
0.02
8N
A0.
0018
‘80
Tin
and
art
icle
s th
ereo
f0.
2140
450.
0022
610.
002
00.
0082
‘81
Oth
er b
ase
met
als,
cer
met
s, a
rtic
les
ther
eof
0.34
8036
0.02
883
0.01
10
0.75
85‘8
2T
ools
, im
plem
ents
, cut
lery
, etc
of b
ase
met
al0.
0458
010.
2112
30.
010
0.84
2119
0.07
76‘8
3M
isce
llane
ous
artic
les
of b
ase
met
al0.
0121
910.
2227
850.
005
0.27
7728
0.16
17‘8
4M
achi
nery
, nuc
lear
rea
ctor
s, b
oile
rs, e
tc0.
0045
90.
2057
890.
015
0.59
3089
0.06
50‘8
5El
ectr
ical
, ele
ctro
nic
equi
pmen
t0.
4180
480.
0530
810.
016
0.18
8537
0.02
35‘8
6R
ailw
ay, t
ram
way
loco
mot
ives
, rol
ling
stoc
k, e
quip
men
t0.
3617
610.
0784
390.
004
0.10
8899
0.00
73‘8
7V
ehic
les
othe
r th
an r
ailw
ay, t
ram
way
0.18
9874
1.64
7998
0.04
40.
7289
220.
0564
‘88
Air
craf
t, sp
acec
raft
, and
par
ts th
ereo
f0.
5741
670.
0028
260.
021
0.01
3123
0.01
04‘8
9Sh
ips,
boa
ts a
nd o
ther
floa
ting
stru
ctur
es0.
0207
090.
0248
0.00
5N
A0.
1404
‘90
Opt
ical
, pho
to, t
echn
ical
, med
ical
, etc
app
arat
us0.
0187
230.
0860
30.
037
0.06
1283
0.01
44‘9
1C
lock
s an
d w
atch
es a
nd p
arts
ther
eof
0.04
2366
0.03
7484
0.00
1N
A0.
0100
‘92
Mus
ical
inst
rum
ents
, par
ts a
nd a
cces
sori
es0.
7699
660.
0661
160.
003
00.
0121
‘93
Arm
s an
d am
mun
ition
, par
ts a
nd a
cces
sori
es th
ereo
fN
A0.
3382
020.
000
0.16
6794
0.06
88‘9
4Fu
rnitu
re, l
ight
ing,
sig
ns, p
refa
bric
ated
bui
ldin
gs0.
2791
190.
1445
350.
098
0.35
9629
0.06
56‘9
5T
oys,
gam
es, s
port
s re
quis
ites
0.16
8747
0.05
1662
0.17
00.
3088
530.
0093
‘96
Mis
cella
neou
s m
anuf
actu
red
artic
les
37.3
0184
0.17
8736
0.01
70.
1127
180.
0553
‘97
Wor
ks o
f art
, col
lect
ors
piec
es a
nd a
ntiq
ues
5.08
4089
0.20
6998
0.01
43.
3160
590.
0091
‘99
Com
mod
ities
not
els
ewhe
re sp
ecifi
ed8.
1173
240.
1570
150.
064
1.82
6343
1.60
10So
urce
: Cal
cula
tions
bas
ed o
n IT
C d
ata
HS
Cod
eSe
ctor
sA
fgha
nist
anA
rgen
tina
Bang
lade
shBh
utan
Chi
le

98 India’s Experiences on Preferential Trade Agreements
Tab
le 24
: Rev
ealed
Com
para
tive A
dvan
tage
(RC
A) f
or 9
9 se
ctor
sH
S C
ode
Sect
ors
Japa
nK
orea
Mal
dive
sM
alay
sia
Nep
al‘0
1Li
ve a
nim
als
0.03
0.00
NA
0.71
0.54
‘02
Mea
t and
edi
ble
mea
t off
al0.
010.
01N
A0.
020.
10‘0
3Fi
sh, c
rust
acea
ns, m
ollu
scs,
aqu
atic
inve
rteb
rate
s ne
s0.
300.
5312
8.42
0.63
0.00
‘04
Dai
ry p
rodu
cts,
egg
s, h
oney
, edi
ble
anim
al p
rodu
ct n
es0.
010.
010.
000.
310.
4‘0
5Pr
oduc
ts o
f ani
mal
ori
gin,
nes
0.15
0.25
0.00
0.07
0.27
‘06
Live
tree
s, p
lant
s, b
ulbs
, roo
ts, c
ut fl
ower
s et
c0.
070.
16N
A0.
470.
25‘0
7Ed
ible
veg
etab
les
and
cert
ain
root
s an
d tu
bers
0.01
0.07
NA
0.19
16.1
4‘0
8Ed
ible
frui
t, nu
ts, p
eel o
f citr
us fr
uit,
mel
ons
0.03
0.06
0.03
0.10
1.56
‘09
Cof
fee,
tea,
mat
e an
d sp
ices
0.04
0.03
0.31
0.22
19.0
5‘1
0C
erea
ls0.
010.
001.
240.
000.
10‘1
1M
illin
g pr
oduc
ts, m
alt,
star
ches
, inu
lin, w
heat
glu
ten
0.10
0.16
0.00
0.35
1.21
‘12
Oil
seed
, ole
agic
fru
its, g
rain
, see
d, f
ruit,
etc
, nes
0.04
0.09
0.32
0.04
1.57
‘13
Lac,
gum
s, r
esin
s, v
eget
able
sap
s an
d ex
trac
ts n
es0.
120.
32N
A0.
087.
26‘1
4V
eget
able
pla
iting
mat
eria
ls, v
eget
able
pro
duct
s ne
s0.
030.
00N
A4.
6636
2.21
‘15
Ani
mal
,veg
etab
le f
ats
and
oils
, cle
avag
e pr
oduc
ts, e
tc0.
030.
020.
3215
.13
0.96
‘16
Mea
t, fis
h an
d se
afoo
d fo
od p
repa
ratio
ns n
es0.
330.
1526
.31
0.30
0.06
‘17
Suga
rs a
nd s
ugar
con
fect
ione
ry0.
040.
290.
010.
440.
21‘1
8C
ocoa
and
coc
oa p
repa
ratio
ns0.
030.
03N
A2.
320.
01‘1
9C
erea
l, flo
ur, s
tarc
h, m
ilk p
repa
ratio
ns a
nd p
rodu
cts
0.18
0.34
0.00
1.28
3.55
‘20
Veg
etab
le, f
ruit,
nut
, etc
food
pre
para
tions
0.02
0.12
0.00
0.22
5.48
‘21
Mis
cella
neou
s ed
ible
pre
para
tions
0.32
0.45
0.01
1.11
1.05
‘22
Beve
rage
s, s
piri
ts a
nd v
ineg
ar0.
080.
170.
000.
472.
38‘2
3R
esid
ues,
was
tes
of fo
od in
dust
ry, a
nim
al fo
dder
0.03
0.07
1.79
0.43
3.65
‘24
Tob
acco
and
man
ufac
ture
d to
bacc
o su
bstit
utes
0.17
0.54
0.49
0.69
0.53

India’s Experiences on Preferential Trade Agreements 99
HS
Cod
eSe
ctor
sA
fgha
nist
anA
rgen
tina
Bang
lade
shBh
utan
Chi
le‘2
5Sa
lt, s
ulph
ur, e
arth
, sto
ne, p
last
er, l
ime
and
cem
ent
0.36
0.29
0.01
0.92
7.75
‘26
Ore
s, s
lag
and
ash
0.01
0.03
NA
0.06
‘27
Min
eral
fue
ls, o
ils, d
istil
latio
n pr
oduc
ts, e
tc.
0.11
0.46
0.63
1.05
0.00
‘28
Inor
gani
c ch
emic
als,
pre
ciou
s m
etal
com
poun
d, is
otop
es0.
740.
790.
020.
270.
00‘2
9O
rgan
ic c
hem
ical
s1.
101.
380.
040.
720.
01‘3
0Ph
arm
aceu
tical
pro
duct
s0.
150.
060.
000.
030.
14‘3
1Fe
rtili
sers
0.05
0.24
NA
0.59
0.00
‘32
Tan
ning
, dye
ing
extr
acts
, tan
nins
, der
ivs,
pigm
ents
etc
1.31
0.68
0.01
0.61
0.83
‘33
Esse
ntia
l oils
, per
fum
es, c
osm
etic
s, t
oile
teri
es0.
380.
350.
010.
272.
44‘3
4So
aps,
lubr
ican
ts, w
axes
, can
dles
, mod
ellin
g pa
stes
0.83
0.36
0.00
1.18
2.11
‘35
Alb
umin
oids
, mod
ified
sta
rche
s, g
lues
, enz
ymes
0.90
0.40
0.00
0.31
0.07
‘36
Expl
osiv
es, p
yrot
echn
ics,
mat
ches
, pyr
opho
rics
, etc
0.17
0.13
NA
0.24
0.68
‘37
Phot
ogra
phic
or c
inem
atog
raph
ic g
oods
4.97
0.56
0.02
0.51
0.66
‘38
Mis
cella
neou
s che
mic
al p
rodu
cts
1.52
0.58
0.00
1.49
0.84
‘39
Plas
tics
and
artic
les
ther
eof
1.17
1.58
0.06
0.96
0.71
‘40
Rub
ber
and
artic
les
ther
eof
1.44
1.22
0.02
3.42
0.04
‘41
Raw
hid
es a
nd s
kins
(oth
er th
an fu
rski
ns) a
nd le
athe
r0.
150.
910.
000.
065.
42‘4
2A
rtic
les
of le
athe
r, a
nim
al g
ut, h
arne
ss, t
rave
l goo
ds0.
020.
070.
030.
060.
13‘4
3Fu
rski
ns a
nd a
rtifi
cial
fur,
man
ufac
ture
s th
ereo
f0.
000.
06N
A0.
030.
00‘4
4W
ood
and
artic
les o
f woo
d, w
ood
char
coal
0.02
0.02
0.13
2.93
1.11
‘45
Cor
k an
d ar
ticle
s of
cor
k0.
030.
00N
A0.
010.
00‘4
6M
anuf
actu
res
of p
laiti
ng m
ater
ial,
bask
etw
ork,
etc
.0.
010.
020.
000.
030.
86‘4
7Pu
lp o
f woo
d, fi
brou
s ce
llulo
sic
mat
eria
l, w
aste
etc
.0.
480.
070.
020.
62‘4
8Pa
per
& p
aper
boar
d, a
rtic
les
of p
ulp,
pap
er a
nd b
oard
0.38
0.51
0.02
0.42
0.57
‘49
Prin
ted
book
s, n
ewsp
aper
s, p
ictu
res e
tc0.
370.
260.
460.
410.
21

100 India’s Experiences on Preferential Trade Agreements
‘50
Silk
0.66
0.95
NA
0.09
0.06
‘51
Woo
l, an
imal
hai
r, h
orse
hair
yar
n an
d fa
bric
the
reof
0.41
0.20
NA
0.24
0.06
‘52
Cot
ton
0.24
0.42
0.00
0.25
0.06
‘53
Veg
etab
le te
xtile
fibr
es n
es, p
aper
yar
n, w
oven
fabr
ic0.
140.
110.
000.
1246
.98
‘54
Man
mad
e fil
amen
ts1.
072.
420.
011.
2729
.08
‘55
Man
mad
e st
aple
fibr
es1.
011.
490.
6029
.79
‘56
Wad
ding
, fel
t, no
nwov
ens,
yar
ns, t
win
e, c
orda
ge, e
tc0.
921.
000.
000.
5417
.00
‘57
Car
pets
and
oth
er te
xtile
floo
r co
veri
ngs
0.07
0.08
NA
0.10
79.1
3‘5
8Sp
ecia
l wov
en o
r tu
fted
fabr
ic, l
ace,
tape
stry
etc
0.42
1.51
0.01
0.21
3.08
‘59
Impr
egna
ted,
coa
ted
or la
min
ated
text
ile fa
bric
0.83
1.81
NA
0.17
0.96
‘60
Kni
tted
or c
roch
eted
fabr
ic0.
534.
69N
A0.
462.
97‘6
1A
rtic
les
of a
ppar
el, a
cces
sori
es, k
nit o
r cr
oche
t0.
020.
140.
190.
280.
99‘6
2A
rtic
les
of a
ppar
el, a
cces
sori
es, n
ot k
nit o
r cr
oche
t0.
020.
130.
130.
176.
33‘6
3O
ther
mad
e te
xtile
art
icle
s, s
ets,
wor
n cl
othi
ng e
tc0.
100.
380.
050.
2014
.52
‘64
Foot
wea
r, g
aite
rs a
nd th
e lik
e, p
arts
ther
eof
0.01
0.14
0.00
0.17
1.53
‘65
Hea
dgea
r an
d pa
rts
ther
eof
0.40
0.51
0.00
0.27
16.9
9‘6
6U
mbr
ella
s, w
alki
ng-s
ticks
, sea
t-st
icks
, whi
ps, e
tc0.
000.
04N
A0.
010.
00‘6
7Bi
rd s
kin,
fea
ther
s, a
rtifi
cial
flo
wer
s, h
uman
hai
r0.
020.
31N
A0.
010.
45‘6
8St
one,
pla
ster
, cem
ent,
asbe
stos
, mic
a, e
tc a
rtic
les
1.13
0.38
0.00
0.57
0.87
‘69
Cer
amic
pro
duct
s0.
680.
100.
000.
510.
29‘7
0G
lass
and
gla
ssw
are
1.99
0.39
0.00
1.11
0.47
‘71
Pear
ls, p
reci
ous
ston
es, m
etal
s, c
oins
, etc
0.63
0.40
0.02
0.55
0.16
‘72
Iron
and
ste
el1.
931.
780.
000.
344.
67‘7
3A
rtic
les
of ir
on o
r st
eel
0.96
1.01
0.17
0.82
2.52
‘74
Cop
per
and
artic
les
ther
eof
1.10
0.88
0.21
0.71
2.49
HS
Cod
eSe
ctor
sA
fgha
nist
anA
rgen
tina
Bang
lade
shBh
utan
Chi
le

India’s Experiences on Preferential Trade Agreements 101
‘75
Nic
kel a
nd a
rtic
les
ther
eof
0.47
0.32
0.07
0.00
‘76
Alu
min
ium
and
art
icle
s th
ereo
f0.
380.
500.
010.
611.
16‘7
8Le
ad a
nd a
rtic
les
ther
eof
0.41
1.21
0.00
0.99
0.00
‘79
Zin
c an
d ar
ticle
s th
ereo
f0.
411.
970.
000.
790.
14‘8
0T
in a
nd a
rtic
les
ther
eof
0.28
0.20
0.00
8.47
0.02
‘81
Oth
er b
ase
met
als,
cer
met
s, a
rtic
les
ther
eof
1.61
0.50
0.01
0.21
0.01
‘82
Too
ls, i
mpl
emen
ts, c
utle
ry, e
tc o
f bas
e m
etal
1.25
0.85
0.23
0.42
0.10
‘83
Mis
cella
neou
s ar
ticle
s of
bas
e m
etal
0.46
0.49
0.02
0.44
0.21
‘84
Mac
hine
ry, n
ucle
ar r
eact
ors,
boi
lers
, etc
1.60
0.91
0.26
1.23
0.05
‘85
Elec
tric
al, e
lect
roni
c eq
uipm
ent
1.35
1.87
0.09
2.21
0.09
‘86
Rai
lway
, tra
mw
ay lo
com
otiv
es, r
ollin
g st
ock,
equ
ipm
ent
0.41
0.63
0.04
0.21
0.00
‘87
Veh
icle
s ot
her
than
rai
lway
, tra
mw
ay2.
561.
540.
010.
100.
03‘8
8A
ircr
aft,
spac
ecra
ft, a
nd p
arts
ther
eof
0.22
0.17
0.13
0.23
0.30
‘89
Ship
s, b
oats
and
oth
er fl
oatin
g st
ruct
ures
2.94
8.77
0.17
0.30
0.01
‘90
Opt
ical
, pho
to, t
echn
ical
, med
ical
, etc
app
arat
us1.
602.
520.
180.
870.
04‘9
1C
lock
s an
d w
atch
es a
nd p
arts
ther
eof
0.66
0.08
0.05
0.51
0.00
‘92
Mus
ical
inst
rum
ents
, par
ts a
nd a
cces
sori
es2.
290.
810.
020.
792.
31‘9
3A
rms
and
amm
uniti
on, p
arts
and
acc
esso
ries
ther
eof
0.11
0.58
NA
0.02
0.39
‘94
Furn
iture
, lig
htin
g, s
igns
, pre
fabr
icat
ed b
uild
ings
0.18
0.18
0.02
1.15
0.33
‘95
Toy
s, g
ames
, spo
rts
requ
isite
s0.
560.
180.
010.
290.
06‘9
6M
isce
llane
ous
man
ufac
ture
d ar
ticle
s1.
310.
630.
010.
620.
28‘9
7W
orks
of a
rt, c
olle
ctor
s pi
eces
and
ant
ique
s0.
150.
240.
010.
02‘9
9C
omm
oditi
es n
ot e
lsew
here
spec
ified
3.31
0.00
1.73
0.28
0.59
Sour
ce: C
alcu
latio
ns b
ased
on
ITC
dat
a
HS
Cod
eSe
ctor
sA
fgha
nist
anA
rgen
tina
Bang
lade
shBh
utan
Chi
le

102 India’s Experiences on Preferential Trade Agreements
Tab
le 25
: Tab
le- R
evea
led C
ompa
rativ
e Adv
anta
ge (R
CA
)H
S C
ode
Sect
ors
Paki
stan
Para
guay
Sri L
anka
Sing
apor
eT
haila
ndU
rugu
ay‘0
1Li
ve a
nim
als
1.00
0.02
0.03
0.02
0.45
17.1
8‘0
2M
eat a
nd e
dibl
e m
eat o
ffal
0.89
31.1
30.
040.
020.
0628
.46
‘03
Fish
, cru
stac
eans
, mol
lusc
s, a
quat
ic in
vert
ebra
tes
nes
1.92
0.00
3.68
0.15
2.62
4.65
‘04
Dai
ry p
rodu
cts,
egg
s, h
oney
, edi
ble
anim
al p
rodu
ct n
es0.
460.
090.
040.
220.
2116
.96
‘05
Prod
ucts
of a
nim
al o
rigi
n, n
es2.
9210
.40
0.98
0.10
0.37
17.4
5‘0
6Li
ve tr
ees,
pla
nts,
bul
bs, r
oots
, cut
flow
ers
etc
0.03
0.01
1.02
0.09
0.41
0.05
‘07
Edib
le v
eget
able
s an
d ce
rtai
n ro
ots
and
tube
rs1.
450.
240.
870.
021.
430.
05‘0
8Ed
ible
frui
t, nu
ts, p
eel o
f citr
us fr
uit,
mel
ons
2.32
0.17
1.83
0.06
0.58
3.13
‘09
Cof
fee,
tea,
mat
e an
d sp
ices
0.88
0.15
74.8
20.
190.
100.
04‘1
0C
erea
ls19
.61
22.3
10.
230.
015.
1821
.59
‘11
Mill
ing
prod
ucts
, mal
t, st
arch
es, i
nulin
, whe
at g
lute
n2.
376.
1313
.82
0.13
5.12
25.5
8‘1
2O
il se
ed, o
leag
ic f
ruits
, gra
in, s
eed,
fru
it, e
tc, n
es0.
3277
.31
0.29
0.04
0.10
22.7
2‘1
3La
c, g
ums,
res
ins,
veg
etab
le s
aps
and
extr
acts
nes
3.71
0.00
0.75
0.19
0.36
0.24
‘14
Veg
etab
le p
laiti
ng m
ater
ials
, veg
etab
le p
rodu
cts
nes
5.20
0.46
21.8
60.
470.
390.
01‘1
5A
nim
al,v
eget
able
fat
s an
d oi
ls, c
leav
age
prod
ucts
, etc
0.74
11.6
10.
310.
280.
333.
02‘1
6M
eat,
fish
and
seaf
ood
food
pre
para
tions
nes
0.54
0.09
0.11
0.08
11.7
72.
91‘1
7Su
gars
and
sug
ar c
onfe
ctio
nery
1.40
2.85
0.04
0.22
4.16
0.02
‘18
Coc
oa a
nd c
ocoa
pre
para
tions
0.00
0.00
0.79
0.66
0.15
0.80
‘19
Cer
eal,
flour
, sta
rch,
milk
pre
para
tions
and
pro
duct
s0.
350.
020.
400.
911.
260.
71‘2
0V
eget
able
, fru
it, n
ut, e
tc fo
od p
repa
ratio
ns0.
440.
141.
430.
082.
780.
47‘2
1M
isce
llane
ous
edib
le p
repa
ratio
ns0.
201.
022.
000.
512.
070.
68‘2
2Be
vera
ges,
spi
rits
and
vin
egar
1.47
0.04
0.07
0.89
0.53
0.30
‘23
Res
idue
s, w
aste
s of
food
indu
stry
, ani
mal
fodd
er0.
4519
.58
2.46
0.14
1.36
1.40
‘24
Tob
acco
and
man
ufac
ture
d to
bacc
o su
bstit
utes
0.35
4.62
2.90
0.70
0.22
2.84

India’s Experiences on Preferential Trade Agreements 103
‘25
Salt,
sul
phur
, ear
th, s
tone
, pla
ster
, lim
e an
d ce
men
t9.
180.
390.
650.
081.
761.
05‘2
6O
res,
sla
g an
d as
h0.
560.
000.
070.
010.
060.
01‘2
7M
iner
al f
uels
, oils
, dis
tilla
tion
prod
ucts
, etc
.0.
370.
000.
121.
070.
330.
14‘2
8In
orga
nic
chem
ical
s, p
reci
ous
met
al c
ompo
und,
isot
opes
0.18
0.03
0.18
0.17
0.32
0.44
‘29
Org
anic
che
mic
als
0.08
0.03
0.00
1.62
0.78
0.07
‘30
Phar
mac
eutic
al p
rodu
cts
0.21
0.26
0.01
0.49
0.06
0.47
‘31
Fert
ilise
rs0.
000.
020.
010.
020.
121.
16‘3
2T
anni
ng, d
yein
g ex
trac
ts, t
anni
ns, d
eriv
s,pi
gmen
ts e
tc0.
280.
010.
070.
760.
410.
96‘3
3Es
sent
ial o
ils, p
erfu
mes
, cos
met
ics,
toi
lete
ries
0.08
0.49
0.29
1.48
1.39
0.10
‘34
Soap
s, lu
bric
ants
, wax
es, c
andl
es, m
odel
ling
past
es0.
220.
240.
120.
540.
932.
95‘3
5A
lbum
inoi
ds, m
odifi
ed s
tarc
hes,
glu
es, e
nzym
es0.
280.
000.
350.
421.
931.
62‘3
6Ex
plos
ives
, pyr
otec
hnic
s, m
atch
es, p
yrop
hori
cs, e
tc3.
52N
A0.
010.
350.
150.
00‘3
7Ph
otog
raph
ic o
r cin
emat
ogra
phic
goo
ds0.
050.
000.
000.
650.
240.
01‘3
8M
isce
llane
ous c
hem
ical
pro
duct
s0.
070.
210.
650.
980.
380.
82‘3
9Pl
astic
s an
d ar
ticle
s th
ereo
f0.
590.
480.
181.
001.
461.
10‘4
0R
ubbe
r an
d ar
ticle
s th
ereo
f0.
040.
407.
680.
336.
481.
36‘4
1R
aw h
ides
and
ski
ns (o
ther
than
furs
kins
) and
leat
her
10.2
210
.75
0.02
0.13
1.19
16.4
9‘4
2A
rtic
les
of le
athe
r, a
nim
al g
ut, h
arne
ss, t
rave
l goo
ds8.
840.
510.
610.
360.
530.
16‘4
3Fu
rski
ns a
nd a
rtifi
cial
fur,
man
ufac
ture
s th
ereo
f0.
040.
000.
000.
000.
026.
21‘4
4W
ood
and
artic
les o
f woo
d, w
ood
char
coal
0.19
3.01
0.62
0.05
1.14
9.76
‘45
Cor
k an
d ar
ticle
s of
cor
k0.
000.
000.
000.
020.
010.
00‘4
6M
anuf
actu
res
of p
laiti
ng m
ater
ial,
bask
etw
ork,
etc
.0.
040.
920.
650.
030.
380.
00‘4
7Pu
lp o
f woo
d, fi
brou
s ce
llulo
sic
mat
eria
l, w
aste
etc
0.02
0.04
0.85
0.18
0.16
0.20
‘48
Pape
r &
pap
erbo
ard,
art
icle
s of
pul
p, p
aper
and
boa
rd0.
100.
140.
270.
300.
591.
11‘4
9Pr
inte
d bo
oks,
new
spap
ers,
pic
ture
s etc
0.07
0.05
3.46
1.26
3.69
0.62
HS
Cod
eSe
ctor
sPa
kist
anPa
ragu
aySr
i Lan
kaSi
ngap
ore
Tha
iland
Uru
guay

104 India’s Experiences on Preferential Trade Agreements
HS
Cod
eSe
ctor
sPa
kist
anPa
ragu
aySr
i Lan
kaSi
ngap
ore
Tha
iland
Uru
guay
‘50
Silk
0.20
1.30
0.14
0.15
0.31
0.89
‘51
Woo
l, an
imal
hai
r, h
orse
hair
yar
n an
d fa
bric
the
reof
0.64
0.00
0.00
0.02
0.33
39.3
1‘5
2C
otto
n51
.21
2.36
0.55
0.06
1.00
0.03
‘53
Veg
etab
le te
xtile
fibr
es n
es, p
aper
yar
n, w
oven
fabr
ic0.
90N
A51
.64
0.01
0.44
0.23
‘54
Man
mad
e fil
amen
ts1.
110.
510.
300.
201.
520.
00‘5
5M
anm
ade
stap
le fi
bres
10.6
00.
001.
400.
153.
270.
11‘5
6W
addi
ng, f
elt,
nonw
oven
s, y
arns
, tw
ine,
cor
dage
, etc
0.97
2.09
1.61
0.16
1.28
0.06
‘57
Car
pets
and
oth
er te
xtile
floo
r co
veri
ngs
6.58
0.00
0.70
0.07
1.01
0.43
‘58
Spec
ial w
oven
or
tuft
ed fa
bric
, lac
e, ta
pest
ry e
tc1.
510.
063.
970.
281.
320.
54‘5
9Im
preg
nate
d, c
oate
d or
lam
inat
ed te
xtile
fabr
ic0.
300.
040.
320.
180.
490.
18‘6
0K
nitt
ed o
r cro
chet
ed fa
bric
2.30
0.01
1.47
0.16
0.79
0.61
‘61
Art
icle
s of
app
arel
, acc
esso
ries
, kni
t or
croc
het
7.73
0.13
17.0
90.
160.
870.
22‘6
2A
rtic
les
of a
ppar
el, a
cces
sori
es, n
ot k
nit o
r cr
oche
t6.
050.
5217
.22
0.08
0.55
0.27
‘63
Oth
er m
ade
text
ile a
rtic
les,
set
s, w
orn
clot
hing
etc
45.9
00.
931.
720.
100.
550.
84‘6
4Fo
otw
ear,
gai
ters
and
the
like,
par
ts th
ereo
f0.
660.
590.
360.
110.
640.
07‘6
5H
eadg
ear
and
part
s th
ereo
f0.
190.
016.
620.
050.
680.
08‘6
6U
mbr
ella
s, w
alki
ng-s
ticks
, sea
t-st
icks
, whi
ps, e
tc0.
060.
010.
070.
020.
040.
07‘6
7Bi
rd s
kin,
fea
ther
s, a
rtifi
cial
flo
wer
s, h
uman
hai
r0.
000.
001.
090.
020.
750.
00‘6
8St
one,
pla
ster
, cem
ent,
asbe
stos
, mic
a, e
tc a
rtic
les
0.38
0.00
0.35
0.11
0.66
0.26
‘69
Cer
amic
pro
duct
s0.
170.
141.
730.
071.
130.
14‘7
0G
lass
and
gla
ssw
are
0.17
0.27
0.36
0.24
1.05
0.22
‘71
Pear
ls, p
reci
ous
ston
es, m
etal
s, c
oins
, etc
1.15
0.01
2.38
0.90
2.48
0.48
‘72
Iron
and
ste
el0.
060.
200.
010.
210.
290.
01‘7
3A
rtic
les
of ir
on o
r st
eel
0.42
0.02
0.05
0.47
1.01
0.40
‘74
Cop
per
and
artic
les
ther
eof
0.39
0.17
0.29
0.30
0.48
0.09

India’s Experiences on Preferential Trade Agreements 105
‘75
Nic
kel a
nd a
rtic
les
ther
eof
0.02
0.06
0.00
0.93
0.03
0.00
‘76
Alu
min
ium
and
art
icle
s th
ereo
f0.
16N
A0.
040.
200.
620.
12‘7
8Le
ad a
nd a
rtic
les
ther
eof
1.41
2.90
2.40
0.47
0.23
0.06
‘79
Zin
c an
d ar
ticle
s th
ereo
f0.
020.
110.
000.
250.
390.
02‘8
0T
in a
nd a
rtic
les
ther
eof
0.00
0.03
0.00
4.37
5.05
0.02
‘81
Oth
er b
ase
met
als,
cer
met
s, a
rtic
les
ther
eof
0.02
0.00
0.05
0.25
0.26
0.00
‘82
Too
ls, i
mpl
emen
ts, c
utle
ry, e
tc o
f bas
e m
etal
1.23
0.01
0.17
0.99
0.43
0.01
‘83
Mis
cella
neou
s ar
ticle
s of
bas
e m
etal
0.01
0.02
0.16
0.45
0.92
0.04
‘84
Mac
hine
ry, n
ucle
ar r
eact
ors,
boi
lers
, etc
0.10
0.04
0.06
1.26
1.41
0.05
‘85
Elec
tric
al, e
lect
roni
c eq
uipm
ent
0.05
0.03
0.19
2.66
1.17
0.05
‘86
Rai
lway
, tra
mw
ay lo
com
otiv
es, r
ollin
g st
ock,
equ
ipm
ent
0.01
0.00
0.00
0.03
0.06
0.03
‘87
Veh
icle
s ot
her
than
rai
lway
, tra
mw
ay0.
050.
000.
120.
161.
280.
37‘8
8A
ircr
aft,
spac
ecra
ft, a
nd p
arts
ther
eof
0.03
0.03
0.09
0.85
0.38
0.00
‘89
Ship
s, b
oats
and
oth
er fl
oatin
g st
ruct
ures
0.30
0.00
1.02
0.58
0.18
0.11
‘90
Opt
ical
, pho
to, t
echn
ical
, med
ical
, etc
app
arat
us0.
380.
010.
120.
880.
570.
07‘9
1C
lock
s an
d w
atch
es a
nd p
arts
ther
eof
0.00
0.00
0.01
1.90
1.16
0.01
‘92
Mus
ical
inst
rum
ents
, par
ts a
nd a
cces
sori
es0.
410.
010.
050.
200.
250.
00‘9
3A
rms
and
amm
uniti
on, p
arts
and
acc
esso
ries
ther
eof
0.32
0.00
0.00
0.03
0.09
0.00
‘94
Furn
iture
, lig
htin
g, s
igns
, pre
fabr
icat
ed b
uild
ings
0.39
0.22
0.30
0.10
0.59
0.80
‘95
Toy
s, g
ames
, spo
rts
requ
isite
s1.
890.
110.
990.
400.
710.
01‘9
6M
isce
llane
ous
man
ufac
ture
d ar
ticle
s0.
510.
012.
130.
390.
790.
06‘9
7W
orks
of a
rt, c
olle
ctor
s pi
eces
and
ant
ique
s0.
000.
000.
000.
370.
020.
12‘9
9C
omm
oditi
es n
ot e
lsew
here
spec
ified
0.00
NA
0.00
4.51
0.00
0.00
Sour
ce: C
alcu
latio
ns b
ased
on
ITC
dat
a
HS
Cod
eSe
ctor
sPa
kist
anPa
ragu
aySr
i Lan
kaSi
ngap
ore
Tha
iland
Uru
guay