INDIANAUNIVERSITYINDIANAUNIVERSITY 1 Evolutionary Biology and Computational Grids Craig Stewart...
41
I N D I A N A U N I V E R S I T Y 1 Evolutionary Biology and Computational Grids Craig Stewart [email protected] Director, Research and Academic Computing 10 November 1999 Please cite as: Stewart, C.A. 1999. Evolutionary Biology and Computational Grids. (Presentation) CASCON Workshop on Computational Biology (Mississauga, Ontario, Canada, 10 Nov 1999). Available from: http://hdl.handle.net/2022/14010 .
-
Upload
frank-harmon -
Category
Documents
-
view
221 -
download
2
Transcript of INDIANAUNIVERSITYINDIANAUNIVERSITY 1 Evolutionary Biology and Computational Grids Craig Stewart...

I
N
D
I
A
N
A
U
N
I
V
E
R
S
I
T
Y 1
Evolutionary Biology and Computational Grids
Craig [email protected]
Director, Research and Academic Computing10 November 1999
Please cite as: Stewart, C.A. 1999. Evolutionary Biology and Computational Grids. (Presentation) CASCON Workshop on Computational Biology (Mississauga, Ontario, Canada, 10 Nov 1999). Available from: http://hdl.handle.net/2022/14010.

I
N
D
I
A
N
A
U
N
I
V
E
R
S
I
T
Y 2
Intellectual credits
• Collaborators– National University of Singapore
• Tan Tin Wee, Louxin Zhang (NUS), Meena Sakharkar
– ACSys (Advanced Computational SYStems, Australian National University)
• Markus Buckhorn
– Indiana University• David Hart, Donald K. Berry, Jeffery Palmer, Will Fischer, Chris Parkinson,
Sean Turner, Eric Wernert
• Code development– J. Felsenstein – DNAml (PHYLIP) [U. Washington]– G. Olsen – fastDNAml [UIUC]– H. Matsuda, R. Overbeek – initial P4 parallel code [ANL]– D.K. Berry – PVM and MPI ports [IU]

I
N
D
I
A
N
A
U
N
I
V
E
R
S
I
T
Y 3
Outline
• Phylogenies• Statistical methods for estimating phylogenies &
the fastDNAml program– Models of DNA replication and evolution– Algorithm– Parallelization
• Grid computing, HPCC, visualization• What we’ve learned so far• Future plans

I
N
D
I
A
N
A
U
N
I
V
E
R
S
I
T
Y 4
• This slide previously contained an image scanned from E. Colbert. 1965. The age of reptiles. W.W. Norton, NY, NY.

I
N
D
I
A
N
A
U
N
I
V
E
R
S
I
T
Y 5
Lots of DNA sequence data
• Automation of sequencing process• Many large-scale genomic projectsthermotoga ATTTGCCCCA GAAATTAAAG CAAAAACCCC AGTAAGTTGG GGATGGCAAA AAAGGAAAAT
Tthermophi ATTTGCCCCA GGGGTTCCCG CAAAAACCCC AGTAAGTTGG GGATGGCAGG GGAGGAAAAA
Taquaticus ATTTGCCCCA GGGGTTCCCG CAAAAACCCC AGTAAGTTGG GGATGGCAGG GGAGGAAAAA
deinonema- ATTTGCCCCA GGGATTCCCG CAAAAACCCC AGTAAGTTGG GGATGGCAGG GGAGGAAAAA
ChlamydiaB ATTTTCCCCA GAAATTCCCG AAAAAACCCC AATAAATTGG GGATGGCAGG GGAGGAAGGA
flexistips ATTTTCCCCA CAAAAAAAAG AAAAAACCCC AGTAAGTTGG GGATGGCAGG GGAGGAAAAA
borrelia-b ATTTGCCCCA GAAGTTAAAG CAAAAACCCC AATAAGTTGG GGATGGCAGG GGAGGAAAAA
bacteroide ATTTGCCCCA GAAATTCCCG CAAAAACCCC AGTAAATTGG GGATGGCAGG GGAGGAAAAA
pseudomona ATTTGCCCCA GGGATTCCCG CAAAAACCCC AGTAAGTTGG GGATGGCAGG GGAGGAAAAA
ecoli----- GTTTTCCCCA GAAATTCCCG CAAAAACCCC AGTAAGTTGG GGATGGCAGG GGAGGAAAAA
• 3B bases in human genome

I
N
D
I
A
N
A
U
N
I
V
E
R
S
I
T
Y 6
Statistical Methods in Phylogeny
• Availability of large amounts of genetic data makes possible application of statistical analysis to genetic data so as to create evolutionary phylogenies of organisms, organelles, or gene products.

I
N
D
I
A
N
A
U
N
I
V
E
R
S
I
T
Y 7
Confluence of events
• Development of computationally intensive methods for estimating phylogenies
• Abundance of DNA data– The limiting factor in scientists’ ability to analyze genetic data is
often the availability of computer time, not the availability of raw data
• Development of Grids as a high performance computing architecture– The concept of computational grids is dramatically changing the
way we think about HPC.
• IU’s biologists were eating our computers alive

I
N
D
I
A
N
A
U
N
I
V
E
R
S
I
T
Y 8
Maximum Likelihood
• Typical statistical inference: calculate probability of data given the hypothesis
• Phylogenetic tree building: tree, tree lengths, and associated likelihood values all calculated from the data.
• Likelihood values used only for comparisons• ML is most computationally intensive of the
mathematically-based phylogeny methodologies

I
N
D
I
A
N
A
U
N
I
V
E
R
S
I
T
Y 9
Tree estimation

I
N
D
I
A
N
A
U
N
I
V
E
R
S
I
T
Y 10

I
N
D
I
A
N
A
U
N
I
V
E
R
S
I
T
Y 11
DNA replication
Purines: Adenine & GuaninePyrimidines: Thymine & Cytosine
I
N
D
I
A
N
A
U
N
I
V
E
R
S
I
T
Y 12
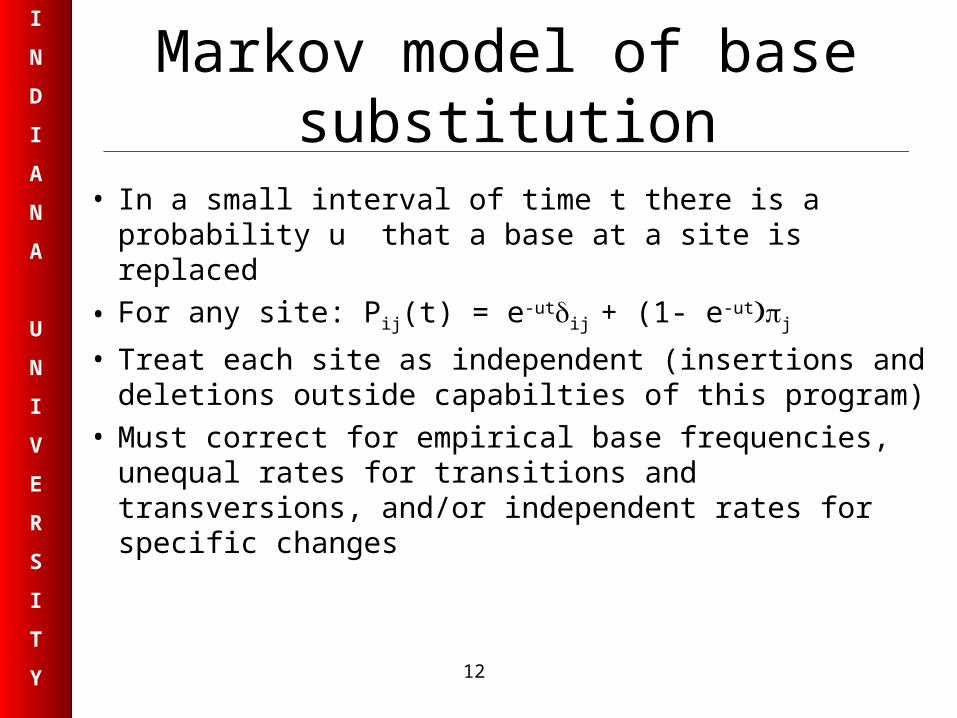
Markov model of base substitution
• In a small interval of time t there is a probability u that a base at a site is replaced
• For any site: Pij(t) = e-utij + (1- e-utj
• Treat each site as independent (insertions and deletions outside capabilties of this program)
• Must correct for empirical base frequencies, unequal rates for transitions and transversions, and/or independent rates for specific changes

I
N
D
I
A
N
A
U
N
I
V
E
R
S
I
T
Y 13
fastDNAml’s phylogeny construction
• Objective: find the tree and branch lengths that have the greatest probability of giving rise to the present day sequences
• The number of bifurcating unrooted trees for n taxa is(2n-5)! ------------ (n-3)! 2n-3
for 50 taxa the number of possible trees is O(10 74)
• So, build trees incrementally, and search within the space of all possible trees looking for best tree

I
N
D
I
A
N
A
U
N
I
V
E
R
S
I
T
Y 14
fastDNAml algorithm
• Compute the optimal tree for three taxa (chosen randomly) - only one topology possible
• Randomly pick another taxon, and consider each of the 2i-5 trees possible by adding this taxon into the first, three-taxa tree.
• Keep the best (maximum likelihood tree)

I
N
D
I
A
N
A
U
N
I
V
E
R
S
I
T
Y 15
Initial steps in tree building

I
N
D
I
A
N
A
U
N
I
V
E
R
S
I
T
Y 16
Local branch rearrangement
• Move any subtree to a neighboring branch (2i-6 possibilities)
• Keep best resulting tree• Repeat this step until local swapping no longer
improves likelihood value

I
N
D
I
A
N
A
U
N
I
V
E
R
S
I
T
Y 17
Nearest neighbor interchange

I
N
D
I
A
N
A
U
N
I
V
E
R
S
I
T
Y 18
Iterate
• Get sequence data for next taxon• Add new taxa (2i-5)• Keep best• Local rearrangements (2i-6)• Keep best• Keep going….• When all taxa have been added, perform a full tree
check

I
N
D
I
A
N
A
U
N
I
V
E
R
S
I
T
Y 19
Because of local effects….
• Where you end up sometimes depends on where you start
• This process searches a huge space of possible trees, and is thus dependent upon the randomly selected initial taxa
• Can get stuck in local optimum, rather than global• Must do multiple runs with different randomizations of
taxa, and compare the results• Similar trees and likelihood values provide some
confidence

I
N
D
I
A
N
A
U
N
I
V
E
R
S
I
T
Y 20
How many calculations are there?
• For 50 taxa, there are i-5)+(2i-6)} = 4,559i=4,50
trees to evaluate presuming that no local rearrangements ever produces an improved tree. And each step is fairly computationally intensive.
• This algorithm is ideal for parallelization, because communications involve at most a tree and a probability value

I
N
D
I
A
N
A
U
N
I
V
E
R
S
I
T
Y 21
Overview of parallel program flow

I
N
D
I
A
N
A
U
N
I
V
E
R
S
I
T
Y 22
Geographically distributed computing
• The high computation/communication ratio makes this program a good candidate for geographic distribution
• Time to completion is a constant forever and ever• The key task is to combine geographically distributed
resources so that large jobs can be completed in tolerable (for the biologist) amounts of wall clock time
I
N
D
I
A
N
A
U
N
I
V
E
R
S
I
T
Y 23
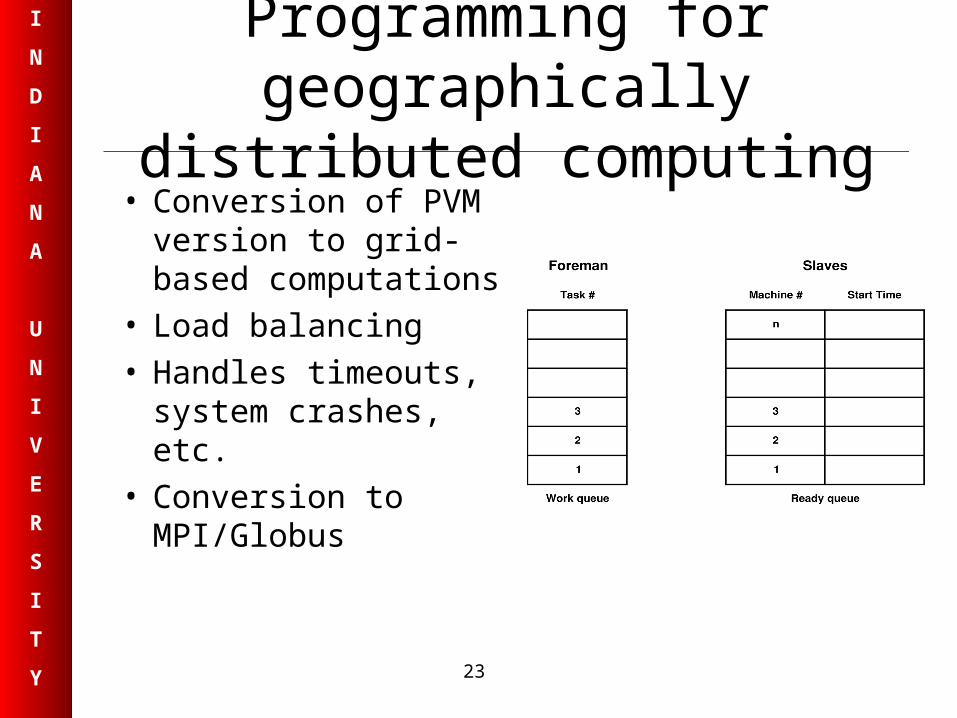
Programming for geographically distributed computing
• Conversion of PVM version to grid-based computations
• Load balancing• Handles timeouts,
system crashes, etc.• Conversion to
MPI/Globus

I
N
D
I
A
N
A
U
N
I
V
E
R
S
I
T
Y 24
StarTAP

I
N
D
I
A
N
A
U
N
I
V
E
R
S
I
T
Y 25

I
N
D
I
A
N
A
U
N
I
V
E
R
S
I
T
Y 26
SC98 Demonstration
• Indiana University - SP nodes• NUS - SP nodes• ACSys – DEC Workstations• Immersadesk on the SC98 show floor as part of the
IU/EVL iGRID demonstration

I
N
D
I
A
N
A
U
N
I
V
E
R
S
I
T
Y 27

I
N
D
I
A
N
A
U
N
I
V
E
R
S
I
T
Y 28
Cytoplasmic Coat Proteins

I
N
D
I
A
N
A
U
N
I
V
E
R
S
I
T
Y 29
Performance of fastDNAml
0
500
1000
1500
2000
2500
3000
3500
0 2 4 6 8 10 12 14 16 18
# Processors
Wal
l clo
ck ti
me
(sec
onds
)
IU Only
IU&NUS
IU&ANU

I
N
D
I
A
N
A
U
N
I
V
E
R
S
I
T
Y 30
Applications
• Better understanding of evolution (Ceolocanths)
• Medicine – example: our cousins, the fungi– classification of genes & gene products
• Maintenance of biodiversity

I
N
D
I
A
N
A
U
N
I
V
E
R
S
I
T
Y 31
What we’ve learned so far
• We can run the program• We can do productive biology• Security is a headache, especially with PVM• Security is a headache, especially with Globus• The time difference causes some problems, but more
benefits in terms of the partnering opportunities

I
N
D
I
A
N
A
U
N
I
V
E
R
S
I
T
Y 32
Computing grids and Power Grids
• When you plug your hair dryer into an outlet, you don’t know how the power was generated or where it came from.
• Someday you’ll plug your laptop into a wall and cycles and storage will be available in a similarly magical fashion, but we’re a long way from that (plus it is probably an unrealistic goal for high-end computing).
• Before the current electrical power grid, there were regional electrical suppliers
• Before the regional electrical suppliers, there were battles over power standards, organizations of power companies, what type of generators were best, etc.

I
N
D
I
A
N
A
U
N
I
V
E
R
S
I
T
Y 33
Models for Computational Grids
• Geographically distributed organizations (NASA, ASCI)
• Alliances and consortia (NCSA, NPACI, CIC)
• A new approach: communities of interest

I
N
D
I
A
N
A
U
N
I
V
E
R
S
I
T
Y 34
Future Plans
• Make the ‘evolutionary biology grid’ a (periodically available) production service
• Enhance MPI/Globus version of code, make code publicly available
• Step up a level in parallelization• Key objective: create a geographically-distributed
version of fastDNAml that makes possible new advances in understanding of evolutionary biology.

I
N
D
I
A
N
A
U
N
I
V
E
R
S
I
T
Y 35
Particular benefits of IBM RS/6000 SPs
• Distributed memory ‘preadapts’ code for an individual SP to a geographically distributed scenario
• Excellent interface with storage systems
• Luck never hurts: many of our collaborators and potential collaborators have significant IBM installations

I
N
D
I
A
N
A
U
N
I
V
E
R
S
I
T
Y 36
Acknowledgements
• In addition to the intellectual debts noted at the beginning of this talk, our research has been greatly aided by Sponsored University Research grants from IBM
• This work would not have been possible without the cooperation and collaboration of Dr. Jeffrey Palmer and his research group.

I
N
D
I
A
N
A
U
N
I
V
E
R
S
I
T
Y 37
Acknowlegements, con’t
• The phylogeny depicted in slide 4 when this slide deck was presented was taken from E. Colbert. 1965. The age of reptiles. W.W. Norton, NY, NY. This diagram is not shown in this archived version of the slide show out of respect for copyright.
• The graphic of an unrooted tree in slide 9 is adapted from Olsen et al. 1994.
• Les Teach [IU] created all other graphics for this talk

I
N
D
I
A
N
A
U
N
I
V
E
R
S
I
T
Y 38
References
• Felsenstein, J. 1981. Evolutionary trees from DNA sequences: a maximum likelihood approach. Journal of Molecular Evolution 17:368-376
• Olsen, Gary J., H. Matsuda, R. Hagstrom, R. Overbeek. 1994. fastDNAml: a tool for construction of phylogenetic trees of DNA sequences using maximum likelihood. Computer Applications in Biosciences 10: 41-48

I
N
D
I
A
N
A
U
N
I
V
E
R
S
I
T
Y 39
References, con’t
• http://www.indiana.edu/uits/~rac• Foster, I., and C. Kesselman. 1998. The Grid:
blueprint for a new computing infrastructure. Morkan Kaufman Publishers, San Francisco
• Baxevanis, A.D., and B.F.F. Ouellette. 1998. Bioinformatics: a practical guide to the analysis of genes and proteins.Wiley-Interscience, NY.

I
N
D
I
A
N
A
U
N
I
V
E
R
S
I
T
Y 40
Thank you
• Any questions?

I
N
D
I
A
N
A
U
N
I
V
E
R
S
I
T
Y 41
• Except where otherwise noted, the contents of this presentation are © the Trustees of Indiana University. This content is released under the Creative Commons Attribution 3.0 Unported license (http://creativecommons.org/licenses/by/3.0/). This license includes the following terms: You are free to share – to copy, distribute and transmit the work and to remix – to adapt the work under the following conditions: attribution – you must attribute the work in the manner specified by the author or licensor (but not in any way that suggests that they endorse you or your use of the work). For any reuse or distribution, you must make clear to others the license terms of this work.