INDIANAPOLIS,INDIANA INDOOR AIR QUALITY - State of Indiana
13
INDIANAPOLIS, INDIANA INDOOR AIR QUALITY MONITORING STUDY Mark J. Travers, PhD, MS Lisa Vogl, MPH Department of Health Behavior and Aerosol Pollution Exposure Research Laboratory (APERL) December 2012
Transcript of INDIANAPOLIS,INDIANA INDOOR AIR QUALITY - State of Indiana
INDIANAPOLIS, INDIANA
INDOOR AIR QUALITY MONITORING STUDY
Mark J. Travers, PhD, MS
Lisa Vogl, MPH
Department of Health Behavior and
Aerosol Pollution Exposure Research Laboratory (APERL)
December 2012

EXECUTIVE SUMMARY In May, August and November 2012, indoor air quality was assessed in 10 restaurants and bars in Indianapolis, Indiana. Effective June 1st, 2012, the new Indianapolis law prohibits smoking in most public places and places of employment with exemptions for nonprofit clubs, retail tobacco shops and a horse race betting parlor. Prior to the smoke-free air law, all 10 bar and restaurant locations permitted indoor smoking. After the smoke-free air law took effect all bars and restaurants were reassessed to observe the effect of the new smoke-free air law; no smoking was observed in 7 locations, while 3 locations met requirements to be exempt from the smoke-free air law.
The concentration of fine particle air pollution, PM2.5, was measured with a TSI SidePak AM510 Personal Aerosol Monitor. PM2.5 is particulate matter in the air smaller than 2.5 microns in diameter. Particles of this size are released in significant amounts from burning cigarettes, are easily inhaled deep into the lungs, and cause a variety of adverse health effects including cardiovascular and respiratory morbidity and death.
Key findings of the study include:
In all 10 locations with observed indoor smoking before the law, the level of fine particle air pollution was “very unhealthy” (PM2.5 = 229 µg/m3). In the 7 locations that went smoke-free after the law, the level of fine particle air pollutions was “hazardous” prior to the law (PM2.5 = 273 µg/m3). This level of fine particle air pollution was 21 times higher than outdoor air in Indianapolis.
Employees in all 10 locations with indoor smoking before the smoke-free air law went into effect were exposed to levels of air pollution 4.2 times higher than safe annual levels established by the U.S. Environmental Protection Agency due to their occupational exposure to tobacco smoke pollution.
In the 7 locations that prohibited indoor smoking post-law, indoor particle pollution levels declined 95% as a result of the smoke-free air law to low levels, similar to those found in outdoor air.
In the 3 locations that met requirements to be exempt from the smoke-free air law, particle pollution levels remained “very unhealthy” even after the smoke-free air law took effect.
273
127
13*14
175
0
50
100
150
200
250
300
350
400
Venues Smoke-Free Post-Law Venues Exempt Post-Law Outdoors*
Mea
n PM
2.5
(mic
rogr
ams
per
cubi
c m
eter
)
Figure 1. Effect of IndianapolisSmoke-free Air Law on Indoor Air Pollution
Pre-Law
Post-Law
*Used for comparison purposes. Based on the 2011 average PM2.5 level at Marion County, Indianapolis , Indiana EPA monitoring sites. http://www.epa.gov/airdata/ad_rep_mon.html
Good
Moderate
Unhealthy, SG
Unhealthy
Very Unhealthy
Hazardous

Roswell Park Cancer Institute December 2012
INTRODUCTION Secondhand smoke (SHS) contains at least 250 chemicals that are known to be toxic or carcinogenic, and is itself a known human carcinogen,[1] responsible for an estimated 3,000 lung cancer deaths annually in never smokers in the U.S., as well as more than 35,000 deaths annually from coronary heart disease in never smokers, and respiratory infections, asthma, Sudden Infant Death Syndrome, and other illnesses in children.[2] Although population-based data show declining SHS exposure in the U.S. overall, SHS exposure remains a major public health concern that is entirely preventable.[3, 4] Because establishing smoke-free environments is the most effective method for reducing SHS exposure in public places,[5] Healthy People 2020 Objective TU-13 encourages all States, Territories, Tribes and the District of Columbia to establish laws on smoke-free indoor air that prohibit smoking in public places and worksites.[6]
Currently in the U.S., 29 states, Washington D.C., Puerto Rico, and the U.S. Virgin Islands have passed strong smoke-free air laws that include restaurants and bars. The states are Arizona, California, Colorado, Connecticut, Delaware, Hawaii, Illinois, Iowa, Kansas, Maine, Maryland, Massachusetts, Michigan, Minnesota, Montana, Nebraska, New Hampshire, New Jersey, New Mexico, New York, North Carolina, Ohio, Oregon, Rhode Island, South Dakota, Utah, Vermont, Washington, and Wisconsin. Well over 50% of the U.S. population is now protected from secondhand smoke in all public places.[7] Nine Canadian provinces and territories also have comprehensive smoke-free air laws in effect. Thousands of cities and counties across the U.S. have also taken action, as have whole countries including Ireland, Scotland, Uruguay, Norway, New Zealand, Sweden, Italy, Spain, England and France.
The goal of this study was to determine the effect of the Indianapolis smoke-free air law on the level of fine particle air pollution in 10 bars and restaurants in Indianapolis, Indiana. The new smoke-free air law prohibits smoking in most public places and places of employment as of June 1st, 2012, with exemptions for nonprofit clubs, retail tobacco shops and a horse race betting parlor. This Indianapolis law is stronger than the recent Indiana State law (effective July 1st, 2012) which allows for more exemptions including all bars and taverns.
It is hypothesized that: 1) particle levels will decline significantly in a cohort of establishments permitting smoking at baseline that are sampled before and after the smoke-free air law; 2) there will be no significant decline in particle pollution levels in a cohort of establishments that are exempt from the smoke-free air law post-law; and 3) the degree of indoor particle air pollution will be correlated with the amount of smoking.
3

Roswell Park Cancer Institute December 2012
METHODS In general, a good marker of SHS exposure should be easily and accurately measured at an affordable cost, providing a valid assessment of SHS exposure as a whole. However, SHS is a dynamic and complex mixture of thousands of compounds in vapor and particulate phases and it is not possible to directly measure SHS in its entirety. The two most commonly used and preferred methods of measuring SHS exposure are nicotine and fine particle (PM2.5) sampling.[8] These methods are correlated with each other and with other SHS constituents. Nicotine sampling has the advantage of being specific to tobacco smoke, meaning there are no other competing sources of nicotine in the air. Active PM2.5 sampling is not specific to tobacco smoke but was chosen for this study due to several advantages of this type of sampling: 1) data can be collected quickly, discreetly, and cost-effectively with a portable battery operated machine; 2) measurements are taken continuously and stored in memory so the changes in particle levels, including peak levels, can be readily observed; 3) the machine is highly sensitive to tobacco smoke, being able to instantly detect particle levels as low as 1 microgram per cubic meter; 4) PM2.5 has known direct health effects in terms of morbidity and mortality and there are existing health standards for PM2.5 in outdoor air (e.g. US EPA and WHO) that can be used to communicate the relative harm of PM2.5 levels in places with smoking.
In May 2012 indoor air quality was assessed in 10 restaurants and bars in Indianapolis, Indiana. After the law took effect on July 1st, 2012, all 10 restaurants and bars were reassessed in August or November to observe the effect of the smoke-free air law.
Measurement Protocol A minimum of 30 minutes was spent in each venue. The number of people inside the venue and the number of burning cigarettes were recorded every 15 minutes during sampling. These observations were averaged over the time inside the venue to determine the average number of people on the premises and the average number of burning cigarettes. Room dimensions were also determined using a combination of any or all of the following techniques; a sonic measuring device, counting of construction materials of a known size such as floor tiles, or estimation. Room volumes were
TSI SIDEPAK AM510 PERSONAL AEROSOL MONITOR
PM2.5 is the concentration of particulate matter in the air smaller than 2.5 microns in diameter. Particles of this size are released in significant amounts from burning cigarettes, are easily inhaled deep into the lungs, and are associated with pulmonary and cardiovascular disease and death.
4

Roswell Park Cancer Institute December 2012 calculated from these dimensions. The active smoker density was calculated by dividing the average number of burning cigarettes by the volume of the room in meters.
A TSI SidePak AM510 Personal Aerosol Monitor (TSI, Inc., St. Paul, MN) was used to sample and record the levels of respirable suspended particles in the air. The SidePak uses a built-in sampling pump to draw air through the device where the particulate matter in the air scatters the light from a laser. This portable light-scattering aerosol monitor was fitted with a 2.5 μm impactor in order to measure the concentration of particulate matter with a mass-median aerodynamic diameter less than or equal to 2.5 μm, or PM2.5. Tobacco smoke particles are almost exclusively less than 2.5 μm with a mass-median diameter of 0.2 μm.[9] The Sidepak was used with a calibration factor setting of 0.32, suitable for secondhand smoke.[10, 11] In addition, the SidePak was zero-calibrated prior to each use by attaching a HEPA filter according to the manufacturer’s specifications.
The equipment was set to a one-minute log interval, which averages the previous 60 one-second measurements. Sampling was discreet in order not to disturb the occupants’ normal behavior. For each venue, the first and last minute of logged data were removed because they are averaged with outdoors and entryway air. The remaining data points were averaged to provide an average PM2.5 concentration within the venue.
Statistical Analyses To evaluate the first and second hypotheses, the Wilcoxon signed-rank test was used to compare the difference in the mean levels of PM2.5 between establishments with observed smoking and those with no observed smoking before and after the stronger smoke-free air law came into effect in Indianapolis. The third hypothesis is tested by using all 10 sample visits and correlating the average smoker densities to the PM2.5 levels using the Spearman rank correlation coefficient (rs). Descriptive statistics including the venue volume, number of patrons, and average smoker density (i.e., number of burning cigarettes) per 100m3 are reported for each venue and averaged for all venues.
5
Roswell Park Cancer Institute December 2012
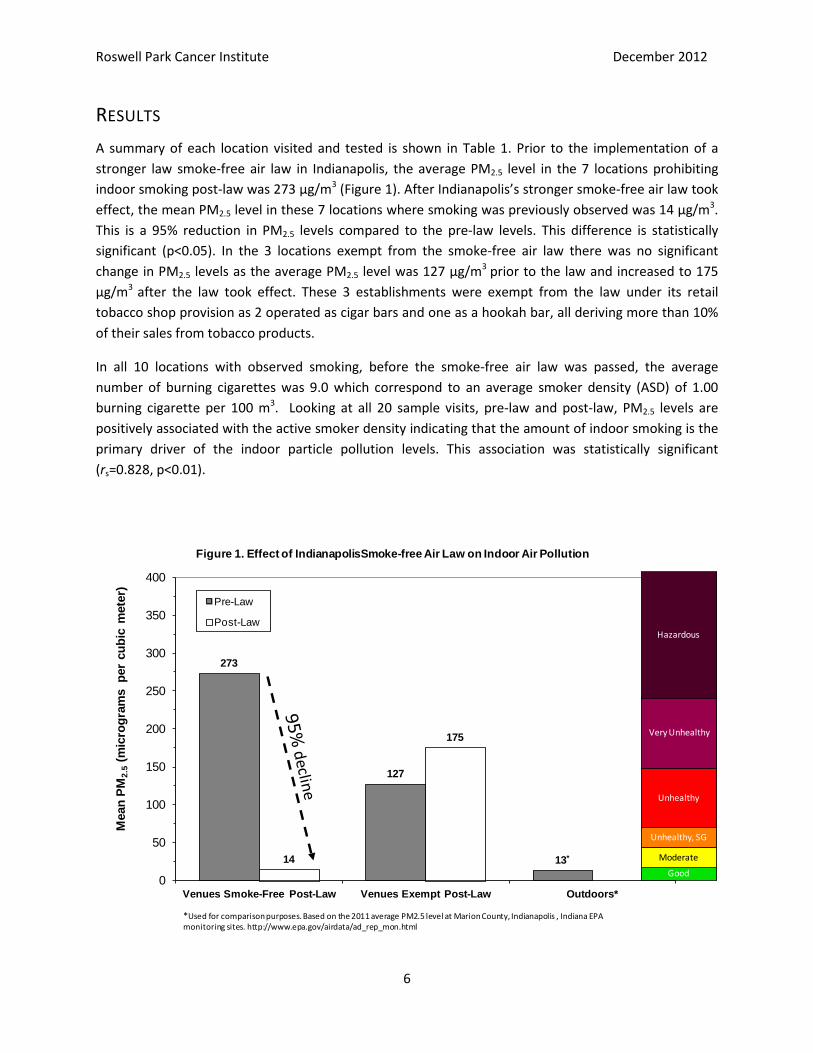
RESULTS A summary of each location visited and tested is shown in Table 1. Prior to the implementation of a stronger law smoke-free air law in Indianapolis, the average PM2.5 level in the 7 locations prohibiting indoor smoking post-law was 273 µg/m3 (Figure 1). After Indianapolis’s stronger smoke-free air law took effect, the mean PM2.5 level in these 7 locations where smoking was previously observed was 14 µg/m3. This is a 95% reduction in PM2.5 levels compared to the pre-law levels. This difference is statistically significant (p<0.05). In the 3 locations exempt from the smoke-free air law there was no significant change in PM2.5 levels as the average PM2.5 level was 127 µg/m3 prior to the law and increased to 175 µg/m3 after the law took effect. These 3 establishments were exempt from the law under its retail tobacco shop provision as 2 operated as cigar bars and one as a hookah bar, all deriving more than 10% of their sales from tobacco products.
In all 10 locations with observed smoking, before the smoke-free air law was passed, the average number of burning cigarettes was 9.0 which correspond to an average smoker density (ASD) of 1.00 burning cigarette per 100 m3. Looking at all 20 sample visits, pre-law and post-law, PM2.5 levels are positively associated with the active smoker density indicating that the amount of indoor smoking is the primary driver of the indoor particle pollution levels. This association was statistically significant (rs=0.828, p<0.01).
273
127
13*14
175
0
50
100
150
200
250
300
350
400
Venues Smoke-Free Post-Law Venues Exempt Post-Law Outdoors*
Mea
n PM
2.5
(mic
rogr
ams
per
cubi
c m
eter
)
Figure 1. Effect of IndianapolisSmoke-free Air Law on Indoor Air Pollution
Pre-Law
Post-Law
*Used for comparison purposes. Based on the 2011 average PM2.5 level at Marion County, Indianapolis , Indiana EPA monitoring sites. http://www.epa.gov/airdata/ad_rep_mon.html
Good
Moderate
Unhealthy, SG
Unhealthy
Very Unhealthy
Hazardous
6

Roswell Park Cancer Institute December 2012 The real-time plots showing the level of indoor air pollution in each venue sampled is presented in Figures 2 & 3, starting on page 12. The real-time PM2.5 plots reveal the following results: 1) low background levels are observed outdoors; 2) high levels of indoor air pollution are observed in the venues where smoking was observed; and 3) peak exposure levels in some venues where smoking was observed reached levels far in excess of the average recorded level.
Table 1. Fine Particle Air Pollution in Indianapolis Hospitality Venues
Venue Number Size (m
3) Pre-Law Post-Law
Average # people
Average # burning
cigs Active
smoker density*
Average PM2.5 level
(μg/m3)
Average # people
Average # burning
cigs Active
smoker density*
Average PM2.5 level
(μg/m3)
Venues Smoke-Free Post-Law 1 576
26 2.8 0.49 70
21 0.0 0.00 8
2 299
28 1.0 0.33 51
46 0.0 0.00 6 3 864
62 3.7 0.42 156
73 0.0 0.00 6
4 1013
143 9.3 0.92 401
32 0.0 0.00 7 5 2305
224 5.0 0.22 93
89 0.0 0.00 8
6 1720
57 5.6 0.33 595
27 0.0 0.00 26 7 665
102 6.6 0.99 546
110 0.0 0.00 35
Average 1063 92 4.9 0.53 273 57 0.0 0.00 14 Venues Exempt
Post-Law 8 3617
21 2.6 0.07 45
12 1.8 0.05 50 9 554
21 10.8 1.94 251
16 9.3 1.69 135
10 544
89 44.8 8.24 86
81 16.8 3.08 340 Average 1571 44 19.4 3.42 127 36 9.3 1.61 175 *Average number of burning cigarettes, cigars, and hookah per 100 cubic meters.
7

Roswell Park Cancer Institute December 2012
DISCUSSION The EPA cited over 80 epidemiologic studies in creating a particulate air pollution standard in 1997.[12] The EPA has recently updated this standard and, in order to protect the public health, the EPA has set limits of 15 μg/m3 as the average annual level of PM2.5 exposure and 35 μg/m3 for 24-hour exposure.[12] In order to compare the findings in this study with the annual EPA PM2.5 exposure standard, it was assumed that a full-time employee in the locations sampled that allow smoking works 8 hours, 250 days a year, is exposed to 229 μg/m3 (the average level in all 10 sites with smoking Pre-Law) on the job, and is exposed only to background particle levels of 13 μg/m3 during non-work times. For a full-time employee their average annual PM2.5 exposure is 62 μg/m3. The EPA average annual PM2.5 limit is exceeded by 4.2 times due to their occupational exposure. Based on the latest scientific evidence, the EPA staff currently proposes even lower PM2.5 standards to adequately protect the public health,[13] making the high PM2.5 exposures of people in smoking environments even more alarming.
Previous studies have evaluated air quality by measuring the change in levels of respirable suspended particles (RSP) between smoke-free venues and those that permit smoking. Ott et al. did a study of a single tavern in California and showed an 82% average decrease in RSP levels after smoking was prohibited by a city ordinance.[14] Repace studied 8 hospitality venues, including one casino, in Delaware before and after a statewide prohibition of smoking in these types of venues and found that about 90% of the fine particle pollution could be attributed to tobacco smoke.[15] Similarly, in a study of 22 hospitality venues in Western New York, Travers et al. found a 90% reduction in RSP levels in bars and restaurants, an 84% reduction in large recreation venues such as bingo halls and bowling alleys, and a 58% reduction even in locations where only SHS from an adjacent room was observed at baseline.[16] A cross-sectional study of 53 hospitality venues in 7 major cities across the U.S. showed 82% less indoor air pollution in the locations subject to smoke-free air laws, even though compliance with the laws was less than 100%.[17]
Other studies have directly assessed the effects SHS exposure has on human health. Rapid improvements in the respiratory health of bartenders were seen after a state smoke-free workplace law was implemented in California[18]. Smoke-free legislation in Scotland was associated with significant early improvements in symptoms, lung function, and systemic inflammation of all bar workers, while asthmatic bar workers also showed reduced airway inflammation and improved quality of life.[19] Farrelly et al. also showed a significant decrease in both salivary cotinine concentrations and sensory symptoms in hospitality workers after New York State’s smoke-free air law prohibited smoking in their worksites.[20] A meta-analysis of the 8 published studies looking at the effects of smoke-free air policies on heart attack admissions yielded an estimate of an immediate 19% reduction in heart attack admissions associated with these laws.[21]
The effects of passive smoking on the cardiovascular system in terms of increased platelet aggregation, endothelial dysfunction, increased arterial stiffness, increased atherosclerosis, increased oxidative stress and decreased antioxidant defense, inflammation, decreased energy production in the heart muscle, and a decrease in the parasympathetic output to the heart, are often nearly as large (averaging 80% to 90%) as chronic active smoking. Even brief exposures to SHS, of minutes to hours, are associated with
8

Roswell Park Cancer Institute December 2012 many of these cardiovascular effects. The effects of secondhand smoke are substantial and rapid, explaining the relatively large health risks associated with secondhand smoke exposure that have been reported in epidemiological studies.[22]
The hazardous health effects of exposure to secondhand smoke are now well-documented and established in various independent research studies and numerous international reports. The body of scientific evidence is overwhelming: there is no doubt within the international scientific community that SHS causes heart disease, lung cancer, nasal sinus cancer, sudden infant death syndrome (SIDS), asthma and middle ear infections in children and various other respiratory illnesses. There is also evidence suggesting SHS exposure is also causally associated with stroke, low birth weight, spontaneous abortion, negative effects on the development of cognition and behavior, exacerbation of cystic fibrosis, cervical cancer and breast cancer. The health effects of SHS exposure are detailed in recent reports by the California Environmental Protection Agency[23] and the U.S. Surgeon General[24].
CONCLUSIONS This study demonstrates that employees and patrons in Indianapolis bars and restaurants with observed indoor smoking, prior to the smoke-free air law, were exposed to harmful levels of indoor air pollution resulting from indoor smoking. The new Indianapolis smoke-free air law implemented on June 1st, 2012, that prohibits smoking in most public places and places of employment has been shown to decrease exposure to toxic tobacco smoke pollution by 95%. However, locations meeting requirements to be exempt from the smoke-free air law continue to pose a health risk as demonstrated by the harmful increase in levels of fine particle air pollution before and after the law went into effect. To guarantee a reduction in exposure to toxic tobacco smoke in all public places and places of employment, improvements in the smoke-free air law must be addressed. A 100% smoke-free air law will result in improved quality of life and health outcomes for Indianapolis workers and residents.
9
Roswell Park Cancer Institute December 2012
ACKNOWLEDGMENTS The study was funded by the Marion County Department of Health.
Support for Roswell Park Cancer Institute researchers was also provided by the Flight Attendant Medical Research Institute.
Roswell Park Cancer Institute (RPCI) is America's first cancer center founded in 1898 by Dr. Roswell Park. RPCI is the only upstate New York facility to hold the National Cancer Center designation of "comprehensive cancer center" and to serve as a member of the prestigious National Comprehensive Cancer Network.
Over its long history, Roswell Park Cancer Institute has made fundamental contributions to reducing the cancer burden and has successfully maintained an exemplary leadership role in setting the national standards for cancer care, research and education.
The campus spans 25 acres in downtown Buffalo and consists of 15 buildings with about one million square feet of space. A new hospital building, completed in 1998, houses a comprehensive diagnostic and treatment center. In addition, the Institute built a new medical research complex and renovated existing education and research space to support its future growth and expansion.
For more information about Roswell Park and cancer in general, please contact the Cancer Call Center at 1-877-ASK-RPCI (1-877-275-7724).
10

Roswell Park Cancer Institute December 2012
REFERENCES 1. National Toxicology Program, 9th Report on Carcinogens 2000. 2000, U.S. Department of Health and Human Services,
National Institute of Environmental Health Sciences: Research Triangle Park, NC. 2. CDC, Annual smoking-attributable mortality, years of potential life lost, and economic costs - United States, 1995-1999.
MMWR, 2002. 51(14): p. 300-320. 3. U.S. Department of Health and Human Services, Second national report on human exposure to environmental chemicals.
2003, US Department of Health and Human Services, Centers for Disease Control and Prevention, National Center for Environmental Health: Atlanta, GA.
4. U.S. Department of Health and Human Services, Reducing tobacco use: a report of the Surgeon General. 2000, US Government Printing Office: Washington, DC.
5. Hopkins, D.P., et al., Reviews of evidence regarding interventions to reduce tobacco use and exposure to environmental tobacco smoke. Am J Prev Med, 2001. 20(2 Suppl): p. 16-66.
6. U.S. Department of Health and Human Services, Healthy People 2010: Objectives for Improving Health (Volume 2). 2000, U.S. Government Printing Office: Washington, DC.
7. American Nonsmokers' Rights Foundation. Summary of 100% Smokefree State Laws and Population Protected by 100% U.S. Smokefree Laws. 2009 7/1/2009 [cited 2009 Jul 6]; Available from: http://www.no-smoke.org/pdf/SummaryUSPopList.pdf.
8. The Arkansas Clean Indoor Air Act of 2006, in Arkansas Code Title 20. 2006. 9. Klepeis, N.E., et al., Determining Size-Specific Emission Factors for Environmental Tobacco Smoke Particles. Aerosol
Science and Technology, 2003. 37: p. 780-790. 10. Klepeis, N.E., W.R. Ott, and P. Switzer, Real-Time Measurement of Outdoor Tobacco Smoke Particles. Journal of the Air &
Waste Management Association, 2007. 57: p. 522-534. 11. Travers, M.J., Smoke-free air policy: changing what's in the air and in the body, in Social and Preventive Medicine
[Dissertation]. 2008, State University of New York at Buffalo: Buffalo. 12. U.S. Environmental Protection Agency, National ambient air quality standards for particulate matter; final rule. Federal
Register, 1997. 62(138): p. 38651-38701. 13. U.S. Environmental Protection Agency. Draft Staff Paper for Particulate Matter Fact Sheet. 2005 [cited 2006 October 4];
Available from: http://www.epa.gov/airlinks/pdfs/pmstaff2_fact.pdf. 14. Ott, W., P. Switzer, and J. Robinson, Particle concentrations inside a tavern before and after prohibition of smoking:
evaluating the performance of an indoor air quality model. J Air Waste Manag Assoc, 1996. 46(12): p. 1120-1134. 15. Repace, J.L., Respirable particles and carcinogens in the air of Delaware hospitality venues before and after a smoking
ban. J Occup Environ Med, 2004. 46(9): p. 887-905. 16. Travers, M.J., et al., Indoor Air Quality in Hospitality Venues Before and After the Implementation of a Clean Indoor Air
Law-Western New York, 2003. Morbidity and Mortality Weekly Report (MMWR), 2004. 53(44): p. 1038-1041. 17. Travers, M.J., A. Hyland, and J.L. Repace, 7-City Air Monitoring Study (7-CAMS), March-April 2004. 2004, Roswell Park
Cancer Institute: Buffalo. 18. Eisner, M.D., A.K. Smith, and P.D. Blanc, Bartenders' respiratory health after establishment of smoke-free bars and
taverns. JAMA, 1998. 280(22): p. 1909-14. 19. Menzies, D., et al., Respiratory symptoms, pulmonary function, and markers of inflammation among bar workers before and
after a legislative ban on smoking in public places. JAMA, 2006. 296(14): p. 1742-8. 20. Farrelly, M.C., et al., Changes in hospitality workers' exposure to secondhand smoke following the implementation of New
York's smoke-free law. Tob Control, 2005. 14(4): p. 236-41. 21. Glantz, S.A., Meta-analysis of the effects of smokefree laws on acute myocardial infarction: An update. Preventive
Medicine, 2008. 47(4): p. 452-453. 22. Barnoya, J. and S.A. Glantz, Cardiovascular effects of secondhand smoke: nearly as large as smoking. Circulation, 2005.
111(20): p. 2684-98. 23. California Environmental Protection Agency, Proposed Identification of Environmental Tobacco Smoke as a Toxic Air
Contaminant. 2005, California Environmental Protection Agency, Air Resources Board, Office of Environmental Health Hazard Assessment.
24. U.S. Department of Health and Human Services, The Health Consequences of Involuntary Exposure to Tobacco Smoke: A Report of the Surgeon General. 2006, U.S. Department of Health and Human Services, Centers for Disease Control and Prevention, National Center for Chronic Disease Prevention and Health Promotion, Office on Smoking and Health: Atlanta, GA.
11

Roswell Park Cancer Institute December 2012
0
100
200
300
400
500
600
131
6191
121
151
181
211
241
271
PM2.5level in micrograms per cubic meter
Elap
sed
time
in m
inut
es
Pre-
Law
Post
-Law
Venu
e 8
Venu
e 4
Venu
e 1
Venu
e 2
Venu
e 3
Venu
e 8
was
exe
mpt
pos
t-law
Venu
es 1
-4 w
ere
smok
e-fre
e po
st-la
w
Figu
re 2
.In
dian
apol
is, In
dian
a Air
Mon
itorin
g Stu
dy
12

Roswell Park Cancer Institute December 2012
0
200
400
600
800
1000
1200
1400
1600
1800
131
6191
121
151
181
211
241
271
301
PM2.5level in micrograms per cubic meter
Elap
sed
time
in m
inut
es
Pre-
Law
Post
-Law
Venu
e 9
Venu
e 5
Venu
e 10
Venu
e 6
Venu
e 7
Venu
es 9
& 1
0 w
ere
exem
pt p
ost-l
awVe
nues
5-7
wer
e sm
oke-
free
post
-law
Figu
re 3
.In
dian
apol
is, In
dian
a Air
Mon
itorin
g Stu
dy
13