Indiana’s Hardwood Industry...Highlights of Indiana’s Forest and Hardwood Industry Total...
25
Indiana’s Hardwood Industry: Its Economic Impact (Update of the 2010 Hoover/Settle report) Jeffrey Settle, Chris Gonso Division of Forestry Indiana Department of Natural Resources Mike Seidl Indiana Department of Agriculture June 2016
Transcript of Indiana’s Hardwood Industry...Highlights of Indiana’s Forest and Hardwood Industry Total...
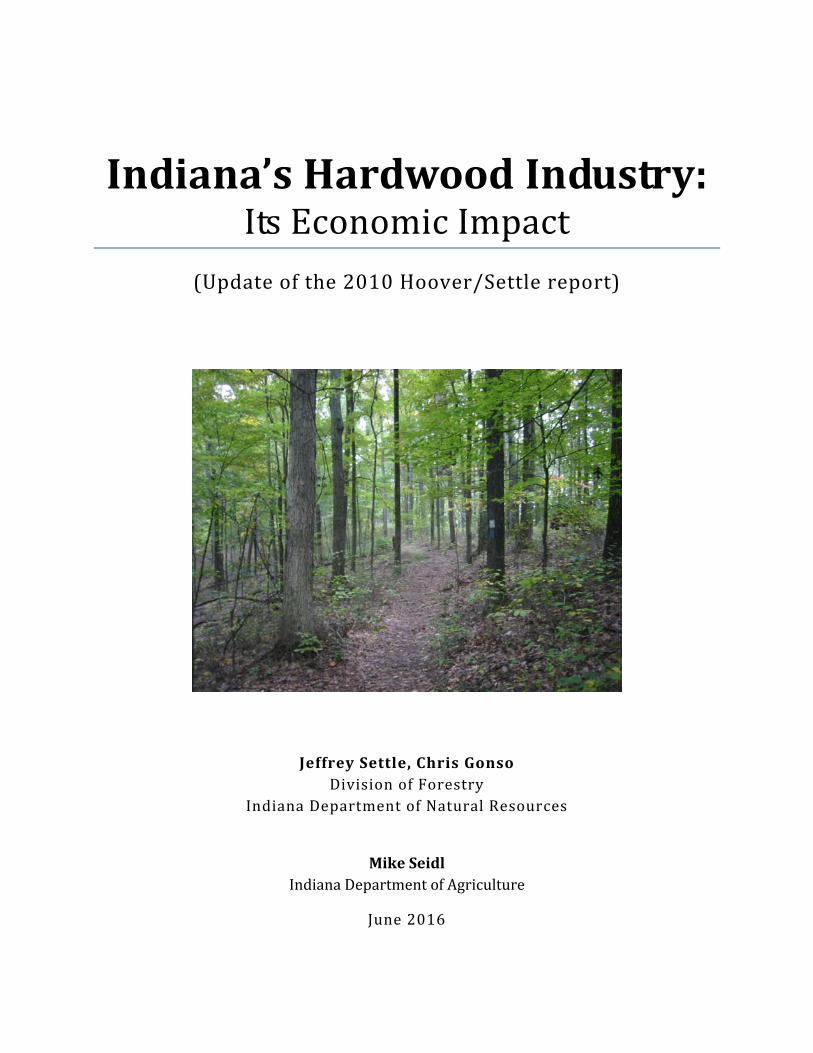
Indiana’sHardwoodIndustry:
ItsEconomicImpact
(Updateofthe2010Hoover/Settlereport)
JeffreySettle,ChrisGonsoDivisionofForestry
IndianaDepartmentofNaturalResources
MikeSeidlIndianaDepartmentofAgriculture
June2016

Highlights of Indiana’s Forest and Hardwood Industry
Total Economic Impact: $13.5 billion o Every board foot of timber processed had $43 of economic impact.i o 84% of logs processed in Indiana were harvested in Indiana.ii
There are 4,879,577 acres of forest land in Indiana.
o 84.5% is privately ownediii o 97% is available for timber productioniv o 97.5% is hardwoodsv o Timber value of managed forests is about 27% higher than value of unmanaged
forests.vi
Total Value of Shipments of $7 billion was 2.4 percent of Indiana’s Gross Domestic Product. o $166 million was paid to landowners for timber.vii o For every $1 paid to landowners for timber, $41 of value was added in the production
of final products.viii
The hardwood industry employed 30,845 people. o An additional 64,908 jobs were generated in economic sectors supporting or
supported by the hardwood industry.ix
Annual wages of $1.3 billion were paid, generating an estimated: o $43 million in state payroll taxes o $20.1 million in local payroll taxesx
Each acre of forest supports $245 of hardwood wages paid annually.xi
Indiana’s forest land increased by 41,504 acres per year from 2009 to 2014.xii
Net growth to total removals is 2.6, meaning we grow 2.6 times the volume being removed.xiii
Indiana is a leading producer of o Wood office furniture o Manufactured homes o Wood stock-line kitchen cabinets o Wooden caskets and coffins o Hardwood plywood-based products
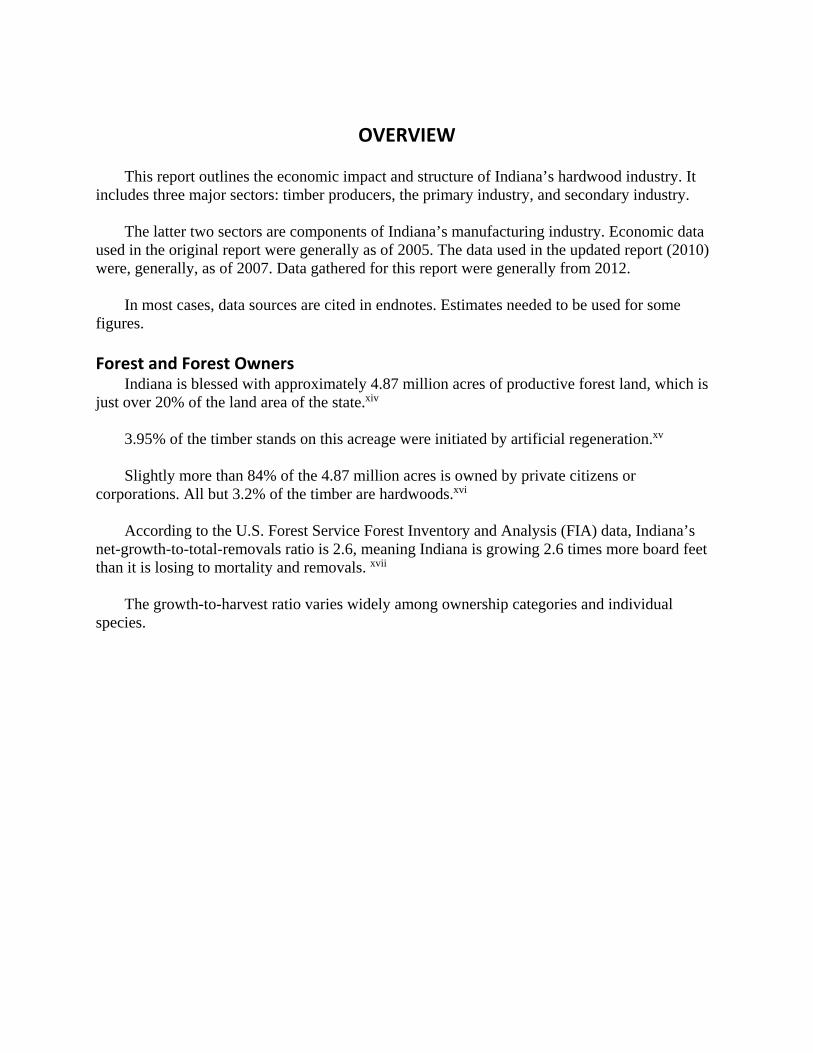
OVERVIEW
This report outlines the economic impact and structure of Indiana’s hardwood industry. It
includes three major sectors: timber producers, the primary industry, and secondary industry. The latter two sectors are components of Indiana’s manufacturing industry. Economic data
used in the original report were generally as of 2005. The data used in the updated report (2010) were, generally, as of 2007. Data gathered for this report were generally from 2012.
In most cases, data sources are cited in endnotes. Estimates needed to be used for some
figures.
Forest and Forest Owners Indiana is blessed with approximately 4.87 million acres of productive forest land, which is
just over 20% of the land area of the state.xiv 3.95% of the timber stands on this acreage were initiated by artificial regeneration.xv Slightly more than 84% of the 4.87 million acres is owned by private citizens or
corporations. All but 3.2% of the timber are hardwoods.xvi According to the U.S. Forest Service Forest Inventory and Analysis (FIA) data, Indiana’s
net-growth-to-total-removals ratio is 2.6, meaning Indiana is growing 2.6 times more board feet than it is losing to mortality and removals. xvii
The growth-to-harvest ratio varies widely among ownership categories and individual
species.

Primary Hardwood Industry
The primary industry in 2012 was composed of 102 sawmills, 31 hardwood veneer and plywood manufacturers, four softwood veneer and plywood manufacturers, 129 wood container and pallet manufacturers, 45 miscellaneous wood products manufacturers, seven wood preservation companies, and 697 companies listed as forestry and/or logging.
There are at least 60 private consulting foresters/industry foresters engaged primarily in
assisting landowners with the management of their land and conducting timber sales. The number of employees and their wages is shown below:xviii
Forestry and Logging: 697 businesses with 2,091xix employees earning total wages of $5.5
million in 2012 Sawmills: 145 businesses with 1,305 employees earning total wages of $40.1 million in
2013 Wood Preservation: Seven businesses with 75 employees earning $3.9 million in annual
wages Veneer and Plywood Manufacturing: 67 businesses with 3,206 employees earning $131.7
million in annual wages Wood Container and Pallet Manufacturing: 129 businesses with 2,017 employees
earning $58.7 million in annual wages Miscellaneous Wood Products Manufacturing: 45 businesses with 826 employees
earning $27.3 million in annual wages Total: 1,090 firms with 9,520 employees earning wages of $267.2 million

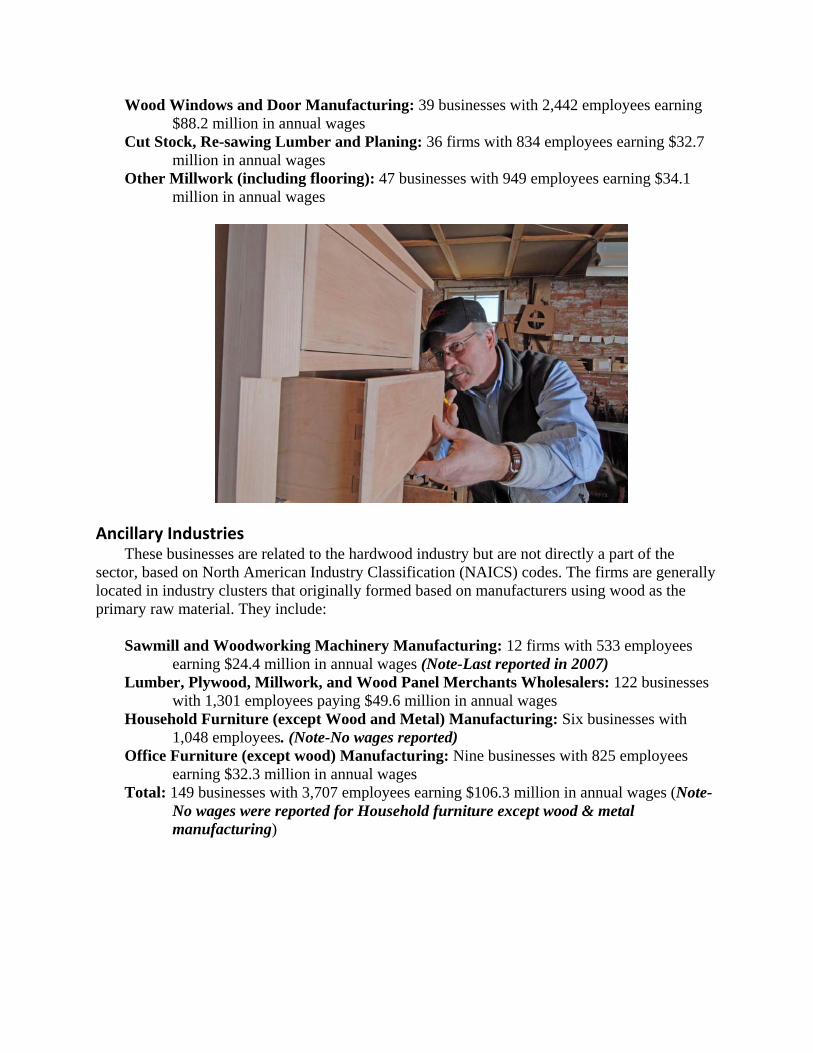
Secondary Wood Manufacturing These businesses dry, plane, cut and assemble wood products into parts or finished products.
In 2012, there were 677 such businesses with 25,491 employees paid $908 million in total wages. This included:xx
Wood Kitchen Cabinet and Counter Top Manufacturing: 180 businesses with 5,308
employees earning $187million in annual wages Upholstered Household Furniture Manufacturing: 31businesses with 2,219 employees
earning $75.4 million in annual wages Non-upholstered Wood Household Furniture Manufacturing: 73 businesses with 1,170
employees earning $34.6 million in annual wages Household and Institutional Furniture Manufacturing: 141 businesses with 6,052
employees earning $218.6 million in annual wages Wood Office Furniture Manufacturing: 22 businesses with 2,917 employees earning
$102.3 million in annual wages Custom Architectural Woodwork and Millwork Manufacturing: 44 businesses with 674
employees earning $26.1 million in annual wages Showcase, Partition, Shelving and Locker Manufacturing: 34 businesses with 1,530
employees earning $59.4 million in annual wages Blind and Shade Manufacturing: 7 businesses with 824 employees earning $25.8 million
in annual wages Truss Manufacturing: 23 businesses with 572 employees earning $23.8 million in annual
wages
Wood Windows and Door Manufacturing: 39 businesses with 2,442 employees earning $88.2 million in annual wages
Cut Stock, Re-sawing Lumber and Planing: 36 firms with 834 employees earning $32.7 million in annual wages
Other Millwork (including flooring): 47 businesses with 949 employees earning $34.1 million in annual wages
Ancillary Industries
These businesses are related to the hardwood industry but are not directly a part of the sector, based on North American Industry Classification (NAICS) codes. The firms are generally located in industry clusters that originally formed based on manufacturers using wood as the primary raw material. They include:
Sawmill and Woodworking Machinery Manufacturing: 12 firms with 533 employees
earning $24.4 million in annual wages (Note-Last reported in 2007) Lumber, Plywood, Millwork, and Wood Panel Merchants Wholesalers: 122 businesses
with 1,301 employees paying $49.6 million in annual wages Household Furniture (except Wood and Metal) Manufacturing: Six businesses with
1,048 employees. (Note-No wages reported) Office Furniture (except wood) Manufacturing: Nine businesses with 825 employees
earning $32.3 million in annual wages Total: 149 businesses with 3,707 employees earning $106.3 million in annual wages (Note-
No wages were reported for Household furniture except wood & metal manufacturing)

Combined Industry Combining all three sectors, the Indiana hardwood industry in 2012 consisted of 916 firms
with 38,718 employees earning $1.3 billion in annual wages.
Hardwood Industry Exports The U.S. Census Bureau reported that Indiana had $169 million in wood product exports
in 2013, a 10% increase from 2012 exports of $154 million. U.S. Census Bureau Trade Data reported wood product exports of $194 million in 2014 and $180 million in 2015. Since 2011, exports of wood products originating from Indiana have grown 20%.
Economic Impact
The Census of Manufacturers (2014) reported the Indiana Hardwood Industry had a total value of shipments of $7 billion and employed 30,845 Hoosiers. The $7 billion is 2.4% of Indiana’s Gross Domestic Product of $288,240 million in 2014. xxi In addition, the industry generated $43 million in state income taxes and $12.6 million in county income taxes on the $1.2 billion in wages paid. Each acre of forest supported $245 in wages paid.
Based on the 2014 Total Value of shipments and employment figures, the estimated total economic impact of the state’s hardwood industry is $13.5 billion. In addition, the state’s hardwood industry and firms related to and supporting the industry generate almost 96,000 jobs. There is a $43 economic impact for every board foot of timber harvested and processed.
There was $2.9 billion of value added from stump to product sold, paying $166 million to
forest owners. That figure is determined by multiplying the price for an average stand of trees by the amount of round wood receipts of 313,966,064 board feet. For every $1 of stumpage paid to the landowner, $20.56 of value is created. (Log receipts of 313,966,064 board feet and $0.449 per board foot paid to landowners.) This is about $9.23 per board foot. This does not imply that all landowners receive this price. The prices are obtained via the Timber Product & Output survey (2013) and the Indiana Forest Products Price Report and Trend Analysis (2013).
“Total value of shipments” is the net selling value of products shipped from a manufacturing
plant to its next destination. “Value added” is the value of shipments minus the cost of material, supplies, fuel, power, containers, and contract work used to make the product.
The $13.5 billion of total economic impact is estimated by multiplying the total output of the
industry ($6.4 billion) by the final-demand output (dollars) for the industry, obtained from the U.S. Bureau of Economic Analysis, the RIMS II multiplier, Table 1.
The multipliers are developed from the Regional Input-Output Modeling System. It is one of
the most widely used models the Department of Defense uses to determine base-closure impact, and that state departments of transportation use to estimate the impact of airport construction or road projects. It also was used to analyze the impact of Hurricane Katrina, and, before that, hurricanes Andrew (1992) and Charley (2004).
RIMS II is an input-output economic model that measures total impact of employment and
total output. These multipliers measure the impact of a $1 million change in either (1) value of
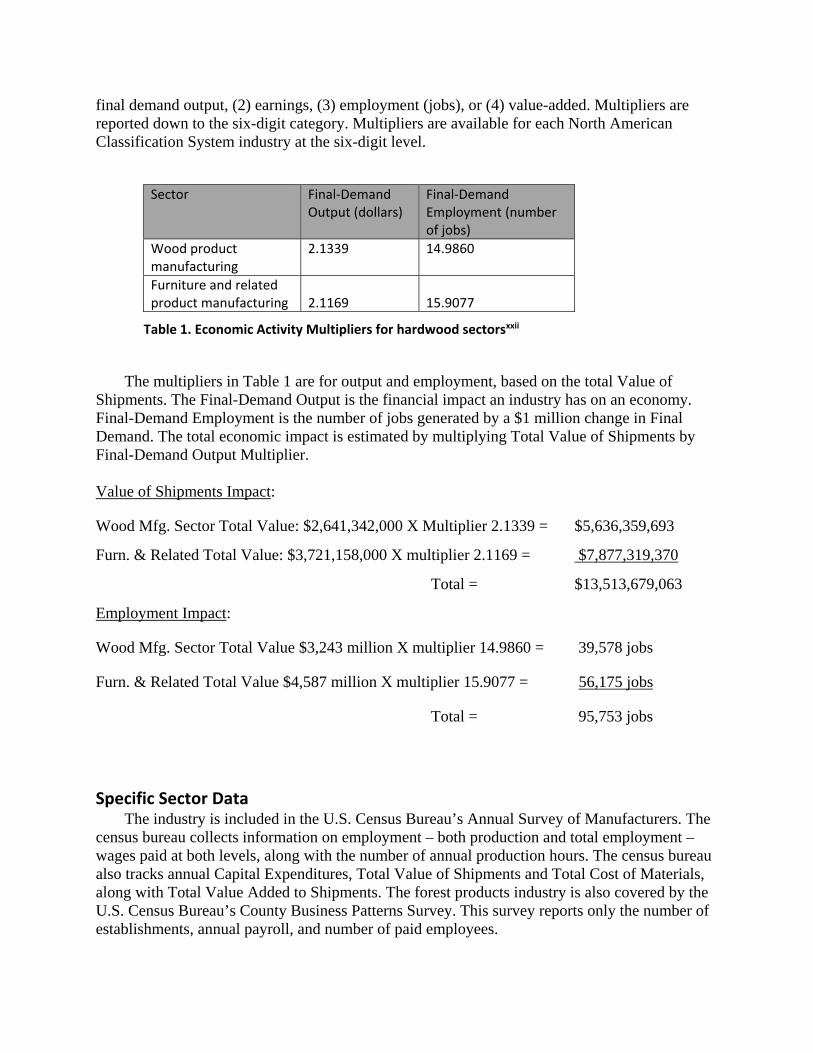
final demand output, (2) earnings, (3) employment (jobs), or (4) value-added. Multipliers are reported down to the six-digit category. Multipliers are available for each North American Classification System industry at the six-digit level.
Sector Final‐Demand Output (dollars)
Final‐Demand Employment (number of jobs)
Wood product manufacturing
2.1339 14.9860
Furniture and related product manufacturing
2.1169
15.9077
Table 1. Economic Activity Multipliers for hardwood sectorsxxii
The multipliers in Table 1 are for output and employment, based on the total Value of Shipments. The Final-Demand Output is the financial impact an industry has on an economy. Final-Demand Employment is the number of jobs generated by a $1 million change in Final Demand. The total economic impact is estimated by multiplying Total Value of Shipments by Final-Demand Output Multiplier. Value of Shipments Impact:
Wood Mfg. Sector Total Value: $2,641,342,000 X Multiplier 2.1339 = $5,636,359,693
Furn. & Related Total Value: $3,721,158,000 X multiplier 2.1169 = $7,877,319,370
Total = $13,513,679,063
Employment Impact:
Wood Mfg. Sector Total Value $3,243 million X multiplier 14.9860 = 39,578 jobs
Furn. & Related Total Value $4,587 million X multiplier 15.9077 = 56,175 jobs
Total = 95,753 jobs
Specific Sector Data
The industry is included in the U.S. Census Bureau’s Annual Survey of Manufacturers. The census bureau collects information on employment – both production and total employment – wages paid at both levels, along with the number of annual production hours. The census bureau also tracks annual Capital Expenditures, Total Value of Shipments and Total Cost of Materials, along with Total Value Added to Shipments. The forest products industry is also covered by the U.S. Census Bureau’s County Business Patterns Survey. This survey reports only the number of establishments, annual payroll, and number of paid employees.

These data are tracked based on the North American Industry Classification System (NAICS), previously called SIC codes. NAICS codes contain six digits; however, some data are only reported at the four-digit level for confidentially purposes. The employment and wage data are shared with the Bureau of Economic Analysis (BEA) and are the basis of much of the data in this report. The data were obtained using the online database of the Indiana University Business Research Center. Forests of Indiana
According to the U.S. Forest Service Inventory Analysis (FIA), there were 4,879,577 acres of forest land in Indiana in 2014xxiii. The area not available for commercial timber production was an estimated 160,946 acres in 2014xxiv. Compared to the 2009 estimate from the same source, forest land has increased by 166,000 acres. This increase is due primarily to conversion of marginal farm land to forest cover. In many cases, marginal farm land is purchased by owners interested in using the land for hunting and other recreation activities.
The 2014 estimates for other states show that Illinois had 4.97 million acres; Michigan had
20.29 million acres, with a significant portion in softwoods; and Ohio had 8.1 million acres.xxv Indiana is recognized by many timber buyers as having higher-quality timber of the premium species than other states in the region.
The proportion of black walnut sawtimber volume that is Grade 1 is 29%, about the same as
Grade 2 but significantly higher than Grade 3 (Figure 1). In surrounding states, excluding Ohio, the Grade 1 portion is much lower. Indiana is slightly behind Ohio in white oak quality (Figure 2), with Grade 1 over 40%. Indiana comes in second, again to Ohio, in red oak (30.5%). Indiana ranks third behind Kentucky and Ohio in black cherry sawtimber quality, at almost 13%.
Ownership of Indiana forest land is split between federal, state, county, and municipal governments, and family or private. Family or private ownership has consistently accounted for about 85% of forest land (Table 2).
The net volume of growing stock on timberland in Indiana has increased steadily in all
categories of ownership. There was 9.3 billion cubic feet of growing stock in accessible forests (timberland) in Indiana in 2014 among all ownership categories.xxvi The FIA report shows about a 2.2% annual tree growth.xxvii This is about 2.6 times the amount of removals.
According to the U. S. Forest Service’s Timber Products Output and Use report for 2013, Indiana mills purchased 315,794,240 board feet (Doyle rule) of logs.xxviii Of that total, 84% was grown in Indiana, 2.9% in Illinois, 2.7% in Kentucky, 4% in Michigan, 4.2% in Ohio, 0.4% in Missouri, and the balance of 1.6% in other states. xxix These roundwood receipts were made up of 93.2% sawlogs, 2.5% veneer logs, and 4.2% for other products such as wood pulp, tool handles, cabin logs, and tight cooperage.xxx
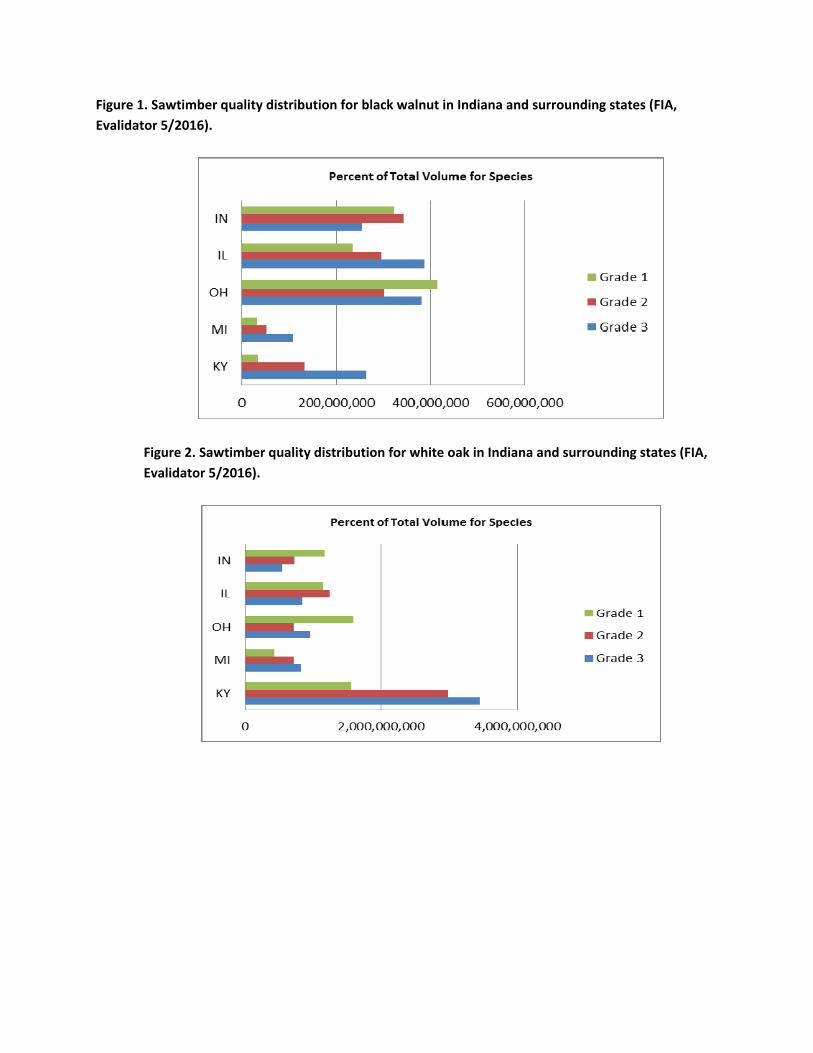
Figure 1. Sawtimber quality distribution for black walnut in Indiana and surrounding states (FIA,
Evalidator 5/2016).
Figure 2. Sawtimber quality distribution for white oak in Indiana and surrounding states (FIA,
Evalidator 5/2016).

Figure 3. Sawtimber quality proportions for red oak in Indiana and surrounding states (FIA,
Evalidator 5/2016).
Figure 4. Sawtimber quality proportions for black cherry in Indiana and surrounding states
(FIA, Evalidator 5/2016).

Table 2. Percent of forest land owned by four ownership categoriesxxxi
Federal Ownership
State
County, Municipal
Family or Private
2014 7.43 6.97 1.05 84.67
2009 7.95 7.27 0.65 84.14
2006 8.27 5.4 0.68 85.65
2003 9.19 4.54 0.60 85.67
Timber Prices and Forest Quality The value of logs delivered to mills is determined by their species, size and quality.
Although many mills have developed their own log-grading system, the two standardized systems are U.S. Forest Service Factory Log Grading and Purdue Log Grades.
In all cases the grade of a log is determined by its size, shape, and number and size of
defects. These criteria correlate to the percentage of a log’s volume that will be in defect-free lumber.
There are two price reports for Indiana. The first is the Indiana Forest Products Price Report
and Trend analysis. It was produced from 1957-2015 by Purdue Cooperative Extension Service in cooperation with the Indiana Agricultural Statistics Service and includes a survey of prices paid for sawlogs and veneer logs by mills in Indiana. This report was taken over by the Indiana DNR Division of Forestry in 2015. The Indiana Association of Consulting Foresters publishes an annual survey of stumpage prices for sales consisting of low, medium, and high-quality timber. The first survey is used primarily to track price trends by calculating a weighted average stand value for an average and quality stand. The quality stand value assumes a well-managed stand.
According to the 2015 survey, the average stand had a delivered log value of $531.40 per
1,000 board feet (MBF). After subtracting the costs to do the logging and hauling from the woods to a mill, an equivalent stumpage price would range from $320 to $335xxxii. The quality stand had an average delivered log value of $727.50 per MBF in 2014. The equivalent stumpage value would range from $517 to $532 per MBF.
Although the long-term trend line for the deflated average delivered log price is still positive, the real value has declined over the last 10 years. The nominal, deflated, and trend lines for average and quality stands are shown in Figures 4 and 5.
The difference between the average unmanaged stand and the quality managed stand is
about $195 per MBF, representing the payback for management. Assuming a stocking level of 3 MBF, the payback from management would be about $585 per acre. Several cost-share programs for management are available from the Natural Resources Conservation Service and Indiana DNR Division of Forestry, reducing the cost to achieve this management premium. Details on these programs are at http://www.in.gov/dnr/forestry/2861.htm.
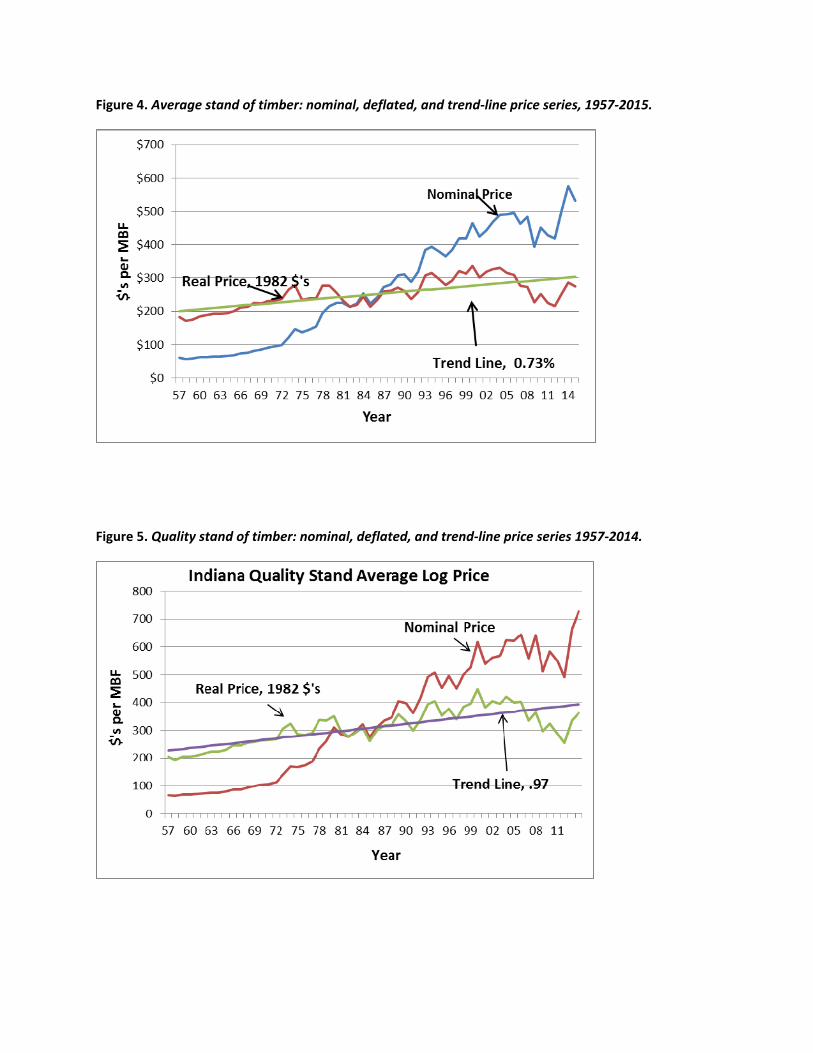
Figure 4. Average stand of timber: nominal, deflated, and trend‐line price series, 1957‐2015.
Figure 5. Quality stand of timber: nominal, deflated, and trend‐line price series 1957‐2014.

The trend lines in Figures 5 and 6 indicate the real price of logs has increased by an average of about 1%. However, for the last 14 years, the real price has declined.
Using the ownership data previously outlined and the above price for average standing
timber, the value of the standing timber in each of the ownership categories can be estimated (Table 3xxxiii). Table 3. Value of standing timber, based on current market price.
Federal
State & Local
Private Total
2009 Intl’l ¼, Mil. BF 3,324 3,246 31,730 38,300
2009 Doyle, Mil BF 2,408 2,352 22,992 27,752
Value based on Doyle, Mil. $ $788 $770 $7,529 $9,087
This value assumes that all timber in each category could be sold at the current market price without driving down the price because of the major increase in the supply hypothetically offered for sale. Sawtimber removals totaled 215 million BF Doyle in 2015xxxiv, 84% of sawtimber volume.
A more realistic approach to placing a value on Indiana’s timber inventory is to capitalize
the value of the perpetual average annual timber revenue. Assuming annual removals of 431 million BF at $327 per MBF gives annual revenues of almost $141 million. Using a real long-term discount rate of 2.5% gives a capital value of almost $5.6 billion. This is the amount an entrepreneur would pay for the right to receive $141 million in revenue in perpetuity from Indiana’s timberland. Logging
Indiana woodlands are harvested primarily by professional loggers; however, many landowners harvest firewood themselves. A significant number of owners also produce sawlogs themselves to supply their portable sawmills. In 2014, according to the Geography Area Series: Country Business Patterns, 68 firms were operating under the forestry/logging industry with 189 employees being reported and a payroll of $5.3 million. These numbers may be too low. The Division of Forestry has 520 individuals/companies on its list of timber buyers (normally, these are loggers). In a similar 2010 report, 68 businesses were reported with 491 employees and an annual payroll of $15.3 million. Approximately 750 people were employed in the logging industry in 2008, spread among 77 firms.xxxv This is the same number of firms reported in 1990; however, during the industry peak in the early 2000s, 96 firms were operating. The average firm employed 9.5 people. The annual payroll of the 77 firms was $21,569,000, making the annual wage $29,358, a significant increase from the 1990 wage of $13,183.

Sector Overview
The industry typically is classified in two sectors, primary and secondary, based on the products made at each stage in the value-added chain. The economic characteristics of the major components of the industry are summarized in Table 4.
Table 4. Economic indicators for major sectors in the hardwood industry, 2012xxxvi
Sector
No. of Firms
No. of Employees
Total Wages Paid (1,000)
Annual Capital Expenditures (1,000)
Total Value of Shipments (1,000)
Logging 77 734 $21,569 Not available Not available
Sawmills, etc. 78 1,129 $40,136 Not available $219,492
Veneer, plywood, etc.
67 3,206 $131,755 $21,845 $753,058
Furniture, etc. 448 18,482 $666,326 $62,518 $3,721,158
Misc. wood mfg.
3,332 9,399 $331,772 $48,305 $1,575,142
Total 1,209
44,333 $1,488,734 $156,775 $7,829,947
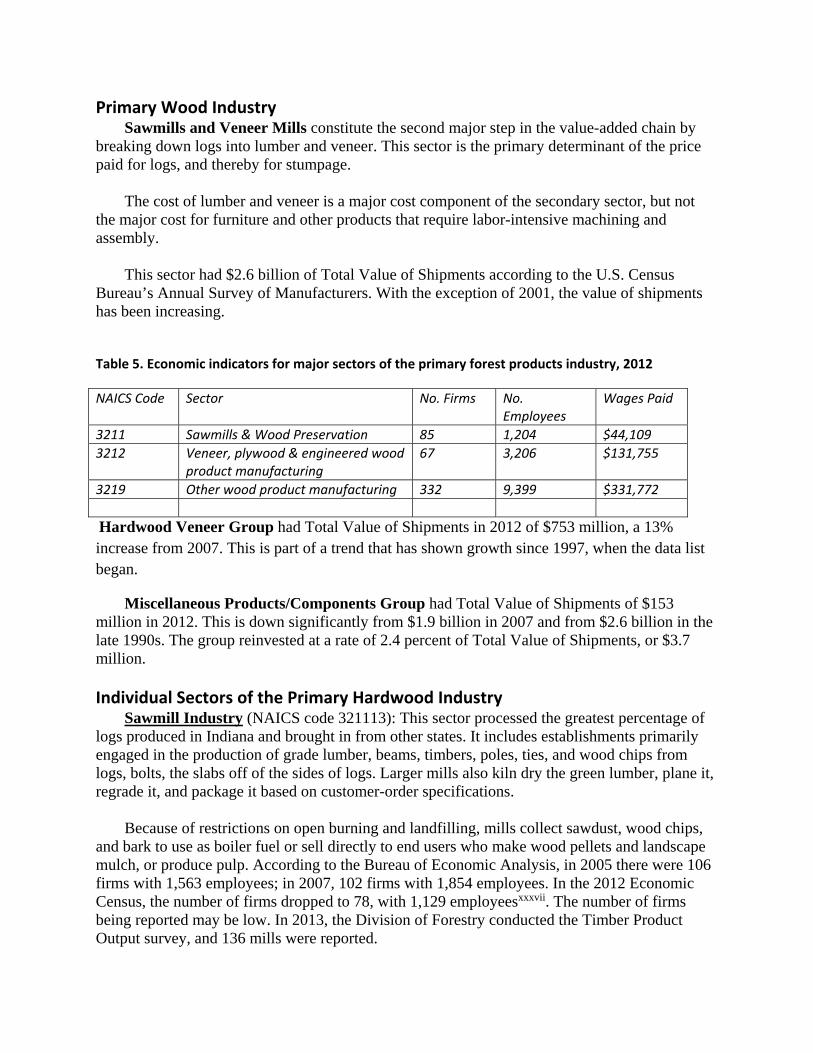
Primary Wood Industry Sawmills and Veneer Mills constitute the second major step in the value-added chain by
breaking down logs into lumber and veneer. This sector is the primary determinant of the price paid for logs, and thereby for stumpage.
The cost of lumber and veneer is a major cost component of the secondary sector, but not
the major cost for furniture and other products that require labor-intensive machining and assembly.
This sector had $2.6 billion of Total Value of Shipments according to the U.S. Census
Bureau’s Annual Survey of Manufacturers. With the exception of 2001, the value of shipments has been increasing.
Table 5. Economic indicators for major sectors of the primary forest products industry, 2012
NAICS Code Sector No. Firms No. Employees
Wages Paid
3211 Sawmills & Wood Preservation 85 1,204 $44,109
3212 Veneer, plywood & engineered wood product manufacturing
67 3,206 $131,755
3219 Other wood product manufacturing 332 9,399 $331,772
Hardwood Veneer Group had Total Value of Shipments in 2012 of $753 million, a 13% increase from 2007. This is part of a trend that has shown growth since 1997, when the data list began.
Miscellaneous Products/Components Group had Total Value of Shipments of $153 million in 2012. This is down significantly from $1.9 billion in 2007 and from $2.6 billion in the late 1990s. The group reinvested at a rate of 2.4 percent of Total Value of Shipments, or $3.7 million.
Individual Sectors of the Primary Hardwood Industry
Sawmill Industry (NAICS code 321113): This sector processed the greatest percentage of logs produced in Indiana and brought in from other states. It includes establishments primarily engaged in the production of grade lumber, beams, timbers, poles, ties, and wood chips from logs, bolts, the slabs off of the sides of logs. Larger mills also kiln dry the green lumber, plane it, regrade it, and package it based on customer-order specifications.
Because of restrictions on open burning and landfilling, mills collect sawdust, wood chips,
and bark to use as boiler fuel or sell directly to end users who make wood pellets and landscape mulch, or produce pulp. According to the Bureau of Economic Analysis, in 2005 there were 106 firms with 1,563 employees; in 2007, 102 firms with 1,854 employees. In the 2012 Economic Census, the number of firms dropped to 78, with 1,129 employeesxxxvii. The number of firms being reported may be low. In 2013, the Division of Forestry conducted the Timber Product Output survey, and 136 mills were reported.

Annual payroll for sawmills in 2007 was $68.7 million. In 2012, that number dropped to
$40.1 million; a 41% decrease. Wood Preservation (NAICS code 321114): This U.S. industry includes establishments
primarily engaged in 1) treating wood sawed, planed, or shaped in other establishments with creosote or other preservatives, such as alkaline copper quat, copper azole, and sodium borates, to prevent decay and to protect against fire and insects, and/or 2) sawing roundwood poles, pilings, and posts, and treating them with preservatives.
Wood Preservation employed 75 people in 2012, a decrease from 348 people in 2007.
However, data have fluctuated. The number of employees has steadily decreased since 2000. Total wages were reported to be $3.9 million, down 67% from $12 million in 2007.
Hardwood Veneer, Wood Container/Pallet, miscellaneous manufacturing: This sector is
the second part of the Primary Wood Industry. It is divided into two groups, hardwood veneer and the wood-manufactured component industry. The NAICS Codes begin with 321 – 321211 for hardwood veneer and plywood manufacturing; 321920 for wood containers and pallet, and 321999 for all other miscellaneous wood-product manufacturing.
Hardwood Veneer and Plywood manufacturing transforms logs into paper-thin sheets of
wood to make furniture. The veneer sector has been relatively stable in terms of establishments. For many years, Indiana (specifically Edinburgh) was considered the veneer capital of the world. The 2012 Economic Census reported 31 firms employing 1,982 employees. In 2007 there were 34 firms employing 2,630 employees, compared with 2,153 in 2005. The low point in employment was in 1992, with 1,732 employees. The high point was 2000, with 2,961.
The sector paid $78.8 million in wages in 2012, for an average annual wage of $39,354.
While the total wages paid was lower, the average annual wage increased 17%.
Wood Container and Pallet manufacturing makes wood pallet, wood box shook, wood boxes, and other wood containers, as well as wood parts for pallets and containers. In 2012, there were 129 firms operating in Indiana employing 2,017 people and an annual payroll of $58.7 million. In 2007, there were 124 firms, 2,220 employees and a payroll of $58.8 million.
All other Miscellaneous Wood Product Manufacturing is the category for firms not
classified elsewhere in the Primary Wood Industry. These firms make cork products (except gaskets), handles (e.g., for brooms, hand tools, mops), kiln-drying lumber, kitchenware, shoe trees, stepladders, dowels, toilet seats, extension ladders, and toothpicks. The Economic Census of 2012 reported 45 establishments with 826 employees with an annual payroll of $27.3 million. In 2007, there were 60 firms with 871 employees earning $26.5 million in total wages. The high point for employment was in 1996, at 1,345.
Secondary Wood Industry (Table 6): This sector uses component parts manufactured or
processed in the primary sector to make finished goods, such as cabinets and furniture. The NAICS codes begin with 337, and the industry descriptions and codes are Wood Kitchen and
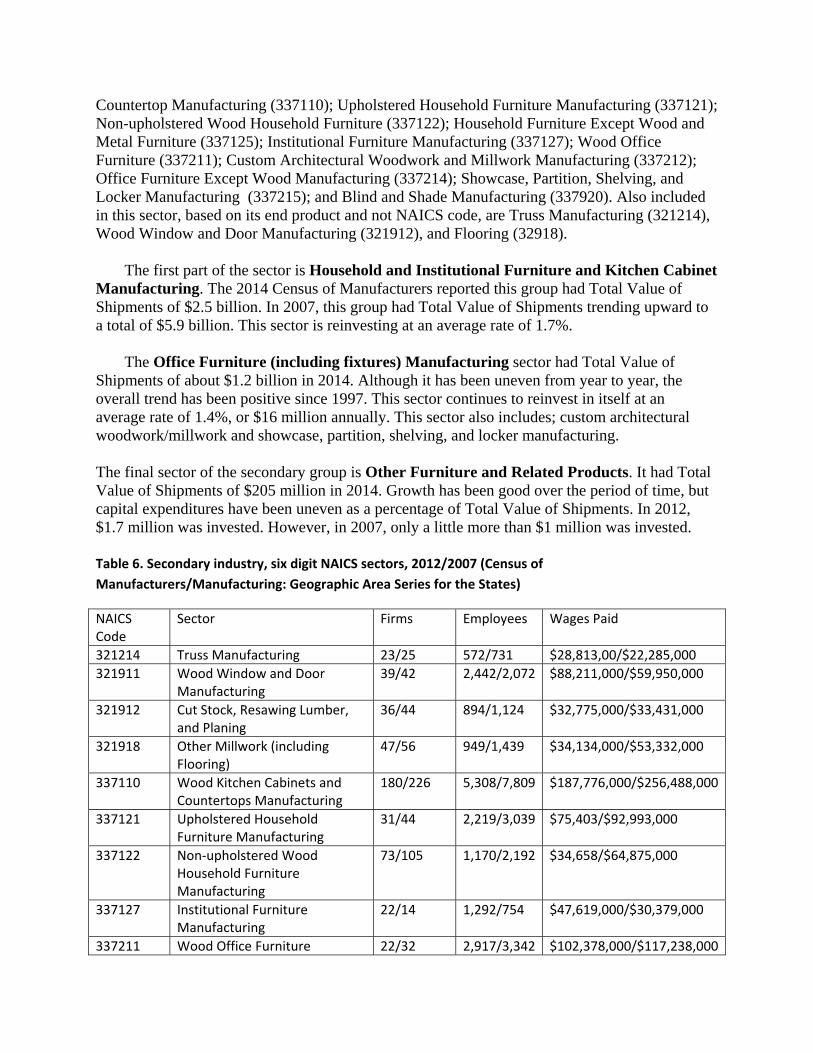
Countertop Manufacturing (337110); Upholstered Household Furniture Manufacturing (337121); Non-upholstered Wood Household Furniture (337122); Household Furniture Except Wood and Metal Furniture (337125); Institutional Furniture Manufacturing (337127); Wood Office Furniture (337211); Custom Architectural Woodwork and Millwork Manufacturing (337212); Office Furniture Except Wood Manufacturing (337214); Showcase, Partition, Shelving, and Locker Manufacturing (337215); and Blind and Shade Manufacturing (337920). Also included in this sector, based on its end product and not NAICS code, are Truss Manufacturing (321214), Wood Window and Door Manufacturing (321912), and Flooring (32918).
The first part of the sector is Household and Institutional Furniture and Kitchen Cabinet
Manufacturing. The 2014 Census of Manufacturers reported this group had Total Value of Shipments of $2.5 billion. In 2007, this group had Total Value of Shipments trending upward to a total of $5.9 billion. This sector is reinvesting at an average rate of 1.7%.
The Office Furniture (including fixtures) Manufacturing sector had Total Value of
Shipments of about $1.2 billion in 2014. Although it has been uneven from year to year, the overall trend has been positive since 1997. This sector continues to reinvest in itself at an average rate of 1.4%, or $16 million annually. This sector also includes; custom architectural woodwork/millwork and showcase, partition, shelving, and locker manufacturing.
The final sector of the secondary group is Other Furniture and Related Products. It had Total Value of Shipments of $205 million in 2014. Growth has been good over the period of time, but capital expenditures have been uneven as a percentage of Total Value of Shipments. In 2012, $1.7 million was invested. However, in 2007, only a little more than $1 million was invested.
Table 6. Secondary industry, six digit NAICS sectors, 2012/2007 (Census of
Manufacturers/Manufacturing: Geographic Area Series for the States)
NAICS Code
Sector Firms Employees Wages Paid
321214 Truss Manufacturing 23/25 572/731 $28,813,00/$22,285,000
321911 Wood Window and Door Manufacturing
39/42 2,442/2,072 $88,211,000/$59,950,000
321912 Cut Stock, Resawing Lumber, and Planing
36/44 894/1,124 $32,775,000/$33,431,000
321918 Other Millwork (including Flooring)
47/56 949/1,439 $34,134,000/$53,332,000
337110 Wood Kitchen Cabinets and Countertops Manufacturing
180/226 5,308/7,809 $187,776,000/$256,488,000
337121 Upholstered Household Furniture Manufacturing
31/44 2,219/3,039 $75,403/$92,993,000
337122 Non‐upholstered Wood Household Furniture Manufacturing
73/105 1,170/2,192 $34,658/$64,875,000
337127 Institutional Furniture Manufacturing
22/14 1,292/754 $47,619,000/$30,379,000
337211 Wood Office Furniture 22/32 2,917/3,342 $102,378,000/$117,238,000
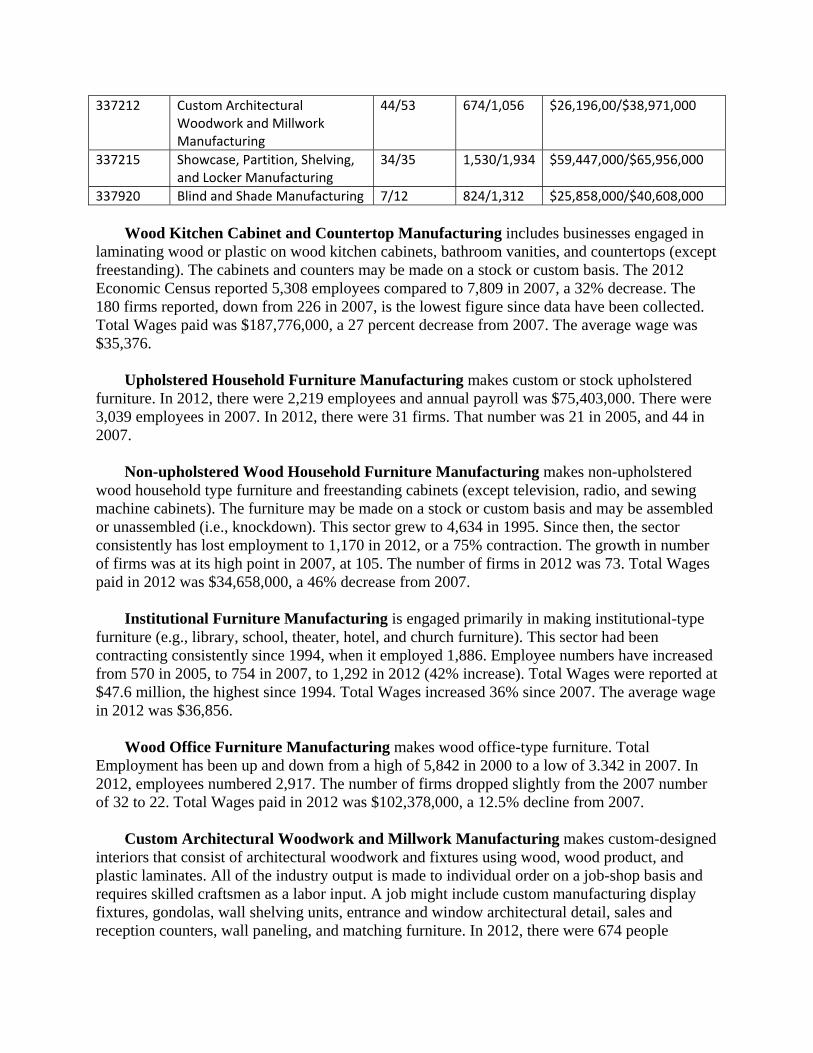
337212 Custom Architectural Woodwork and Millwork Manufacturing
44/53 674/1,056 $26,196,00/$38,971,000
337215 Showcase, Partition, Shelving, and Locker Manufacturing
34/35 1,530/1,934 $59,447,000/$65,956,000
337920 Blind and Shade Manufacturing 7/12 824/1,312 $25,858,000/$40,608,000
Wood Kitchen Cabinet and Countertop Manufacturing includes businesses engaged in
laminating wood or plastic on wood kitchen cabinets, bathroom vanities, and countertops (except freestanding). The cabinets and counters may be made on a stock or custom basis. The 2012 Economic Census reported 5,308 employees compared to 7,809 in 2007, a 32% decrease. The 180 firms reported, down from 226 in 2007, is the lowest figure since data have been collected. Total Wages paid was $187,776,000, a 27 percent decrease from 2007. The average wage was $35,376.
Upholstered Household Furniture Manufacturing makes custom or stock upholstered
furniture. In 2012, there were 2,219 employees and annual payroll was $75,403,000. There were 3,039 employees in 2007. In 2012, there were 31 firms. That number was 21 in 2005, and 44 in 2007.
Non-upholstered Wood Household Furniture Manufacturing makes non-upholstered
wood household type furniture and freestanding cabinets (except television, radio, and sewing machine cabinets). The furniture may be made on a stock or custom basis and may be assembled or unassembled (i.e., knockdown). This sector grew to 4,634 in 1995. Since then, the sector consistently has lost employment to 1,170 in 2012, or a 75% contraction. The growth in number of firms was at its high point in 2007, at 105. The number of firms in 2012 was 73. Total Wages paid in 2012 was $34,658,000, a 46% decrease from 2007.
Institutional Furniture Manufacturing is engaged primarily in making institutional-type
furniture (e.g., library, school, theater, hotel, and church furniture). This sector had been contracting consistently since 1994, when it employed 1,886. Employee numbers have increased from 570 in 2005, to 754 in 2007, to 1,292 in 2012 (42% increase). Total Wages were reported at $47.6 million, the highest since 1994. Total Wages increased 36% since 2007. The average wage in 2012 was $36,856.
Wood Office Furniture Manufacturing makes wood office-type furniture. Total
Employment has been up and down from a high of 5,842 in 2000 to a low of 3.342 in 2007. In 2012, employees numbered 2,917. The number of firms dropped slightly from the 2007 number of 32 to 22. Total Wages paid in 2012 was $102,378,000, a 12.5% decline from 2007.
Custom Architectural Woodwork and Millwork Manufacturing makes custom-designed
interiors that consist of architectural woodwork and fixtures using wood, wood product, and plastic laminates. All of the industry output is made to individual order on a job-shop basis and requires skilled craftsmen as a labor input. A job might include custom manufacturing display fixtures, gondolas, wall shelving units, entrance and window architectural detail, sales and reception counters, wall paneling, and matching furniture. In 2012, there were 674 people
employed, a 36% decrease from 2007. Total wages paid in 2012 were $26.2 million, down from $39 million in 2007.
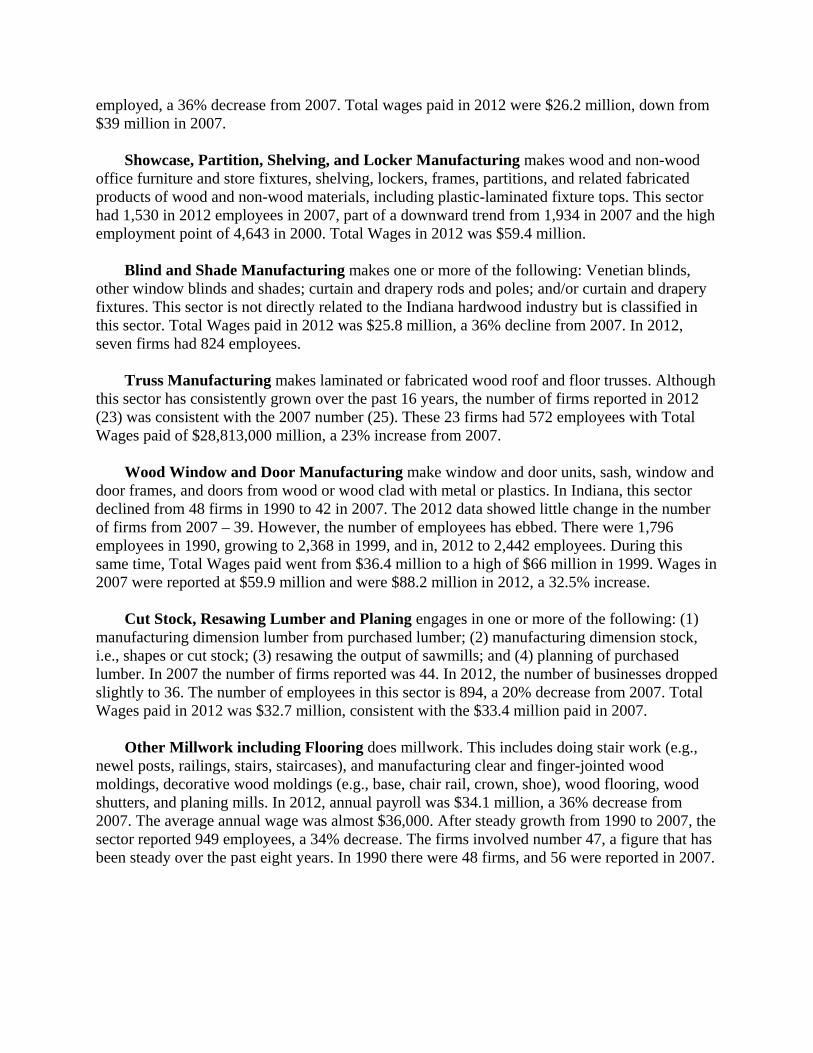
Showcase, Partition, Shelving, and Locker Manufacturing makes wood and non-wood
office furniture and store fixtures, shelving, lockers, frames, partitions, and related fabricated products of wood and non-wood materials, including plastic-laminated fixture tops. This sector had 1,530 in 2012 employees in 2007, part of a downward trend from 1,934 in 2007 and the high employment point of 4,643 in 2000. Total Wages in 2012 was $59.4 million.
Blind and Shade Manufacturing makes one or more of the following: Venetian blinds,
other window blinds and shades; curtain and drapery rods and poles; and/or curtain and drapery fixtures. This sector is not directly related to the Indiana hardwood industry but is classified in this sector. Total Wages paid in 2012 was $25.8 million, a 36% decline from 2007. In 2012, seven firms had 824 employees.
Truss Manufacturing makes laminated or fabricated wood roof and floor trusses. Although
this sector has consistently grown over the past 16 years, the number of firms reported in 2012 (23) was consistent with the 2007 number (25). These 23 firms had 572 employees with Total Wages paid of $28,813,000 million, a 23% increase from 2007.
Wood Window and Door Manufacturing make window and door units, sash, window and
door frames, and doors from wood or wood clad with metal or plastics. In Indiana, this sector declined from 48 firms in 1990 to 42 in 2007. The 2012 data showed little change in the number of firms from 2007 – 39. However, the number of employees has ebbed. There were 1,796 employees in 1990, growing to 2,368 in 1999, and in, 2012 to 2,442 employees. During this same time, Total Wages paid went from $36.4 million to a high of $66 million in 1999. Wages in 2007 were reported at $59.9 million and were $88.2 million in 2012, a 32.5% increase.
Cut Stock, Resawing Lumber and Planing engages in one or more of the following: (1)
manufacturing dimension lumber from purchased lumber; (2) manufacturing dimension stock, i.e., shapes or cut stock; (3) resawing the output of sawmills; and (4) planning of purchased lumber. In 2007 the number of firms reported was 44. In 2012, the number of businesses dropped slightly to 36. The number of employees in this sector is 894, a 20% decrease from 2007. Total Wages paid in 2012 was $32.7 million, consistent with the $33.4 million paid in 2007.
Other Millwork including Flooring does millwork. This includes doing stair work (e.g.,
newel posts, railings, stairs, staircases), and manufacturing clear and finger-jointed wood moldings, decorative wood moldings (e.g., base, chair rail, crown, shoe), wood flooring, wood shutters, and planing mills. In 2012, annual payroll was $34.1 million, a 36% decrease from 2007. The average annual wage was almost $36,000. After steady growth from 1990 to 2007, the sector reported 949 employees, a 34% decrease. The firms involved number 47, a figure that has been steady over the past eight years. In 1990 there were 48 firms, and 56 were reported in 2007.

Exports
Exports of Indiana products are tracked by the U.S. Census Bureau, the U.S. Department of Commerce and the International Trade Administration. In 2010 Indiana exported $369 million of hardwood exports (includes forestry, furniture and wood components). This number decreased gradually until 2014, when the value of hardwood exports was $358.5 million. According International Trade Administration, Trade Stats Express, Indiana had $319.3 million in forestry, furniture and wood-component product exports in 2015, which is 5.8% of the total similar exports of the United States.
See Tables 7, 8a and 8b. The primary products exported from Indiana include: veneer, rough-sawn planks in various
lengths, logs and furniture or furniture parts. Over the past six years, export values have decreased an average of 13%, with a recent decline from 2014 to 2015 of 12.2%. A full listing of exported products and the amounts for the past five years is shown in the tables below.
Canada is the leading importer of Indiana hardwood products (Table 9). The value of
exports decreased in 2015 across the board. This was the result of a stronger U.S. dollar, along with a decline in China and Europe’s economies. Numbers have fluctuated over the last six years. That trend will probably continue into 2016, especially in the Asian and European markets.

Table7. Total Annual Hardwood Exports
2010 2011 2012 2013 2014 2015
Total Annual Exports (millions)
$369.0 $375.0 $301.1 $304.9 $358.5 $319.3
Table 8a. Value of Major Export Categories for 2010‐2015 ( 1,000s.)xxxviii
Product Category 2010 2011 2012 2013 2014 2015
Oak wood, in the rough, not treated
$5,652 $6,119 $7,491
$7,872 $10,058 $11,932
Non‐coniferous wood in the rough NESI, not treated
$8,696 $9,531 $10,645
$10,138 $11,981 $13,086
Oak wood sawn, sliced, etc. over 6MM thick
$11,453 $13,374 $16,784
$21,529 $23,270 $18,941
Non‐coniferous wood sawn, sliced, etc. over 6mm thick
$12,556 $13,423
$16,128
$15,597 $20,596 $19,428
Veneer sheets & sheets for plywood not over 6MM thickness, hardwood
$62,288 $56,935 $47,948
$50,605 $55,318 $54,164
Veneer sheet etc. not over 6MM thick, coniferous
$4,902 $9,831 $6,071
$6,483 $3,143 $62,480
Prefabricated buildings 39,798 72,393 68,173 64,998 58,659 49,283
Table 8b. Indiana’s exports as a percentage of U.S. exports for the categories.
Product Category 2010 2011 2012 2013 2014 2015
Oak wood, in the rough, not treated 2.0 2.4 2.9 3.0 3.2 4.8
Non‐coniferous wood in the rough NESI,
not treated 1.8 2.2 3.0 2.7 2.8 2.8
Oak wood sawn, sliced, etc. over 6mm
thick 2.2 2.2 2.7 2.8 2.3 2.0
Non‐coniferous wood in the rough NESI,
sawn, sliced etc., over 6mm 2.4 2.4 2.5 2.2 2.4 2.8
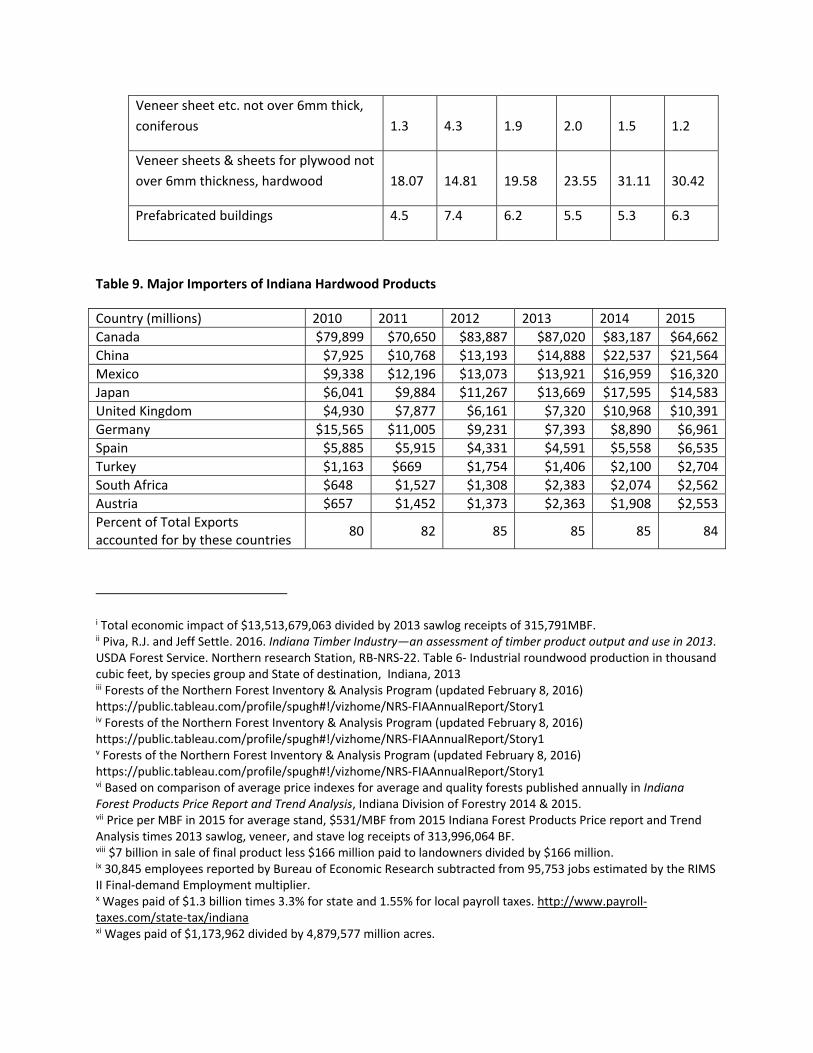
Veneer sheet etc. not over 6mm thick,
coniferous 1.3 4.3 1.9 2.0 1.5 1.2
Veneer sheets & sheets for plywood not
over 6mm thickness, hardwood 18.07 14.81 19.58 23.55 31.11 30.42
Prefabricated buildings 4.5 7.4 6.2 5.5 5.3 6.3
Table 9. Major Importers of Indiana Hardwood Products
Country (millions) 2010 2011 2012 2013 2014 2015
Canada $79,899 $70,650 $83,887 $87,020 $83,187 $64,662
China $7,925 $10,768 $13,193 $14,888 $22,537 $21,564
Mexico $9,338 $12,196 $13,073 $13,921 $16,959 $16,320
Japan $6,041 $9,884 $11,267 $13,669 $17,595 $14,583
United Kingdom $4,930 $7,877 $6,161 $7,320 $10,968 $10,391
Germany $15,565 $11,005 $9,231 $7,393 $8,890 $6,961
Spain $5,885 $5,915 $4,331 $4,591 $5,558 $6,535
Turkey $1,163 $669 $1,754 $1,406 $2,100 $2,704
South Africa $648 $1,527 $1,308 $2,383 $2,074 $2,562
Austria $657 $1,452 $1,373 $2,363 $1,908 $2,553
Percent of Total Exports accounted for by these countries
80 82 85 85 85 84
i Total economic impact of $13,513,679,063 divided by 2013 sawlog receipts of 315,791MBF. ii Piva, R.J. and Jeff Settle. 2016. Indiana Timber Industry—an assessment of timber product output and use in 2013. USDA Forest Service. Northern research Station, RB‐NRS‐22. Table 6‐ Industrial roundwood production in thousand cubic feet, by species group and State of destination, Indiana, 2013 iii Forests of the Northern Forest Inventory & Analysis Program (updated February 8, 2016) https://public.tableau.com/profile/spugh#!/vizhome/NRS‐FIAAnnualReport/Story1 iv Forests of the Northern Forest Inventory & Analysis Program (updated February 8, 2016) https://public.tableau.com/profile/spugh#!/vizhome/NRS‐FIAAnnualReport/Story1 v Forests of the Northern Forest Inventory & Analysis Program (updated February 8, 2016) https://public.tableau.com/profile/spugh#!/vizhome/NRS‐FIAAnnualReport/Story1 vi Based on comparison of average price indexes for average and quality forests published annually in Indiana Forest Products Price Report and Trend Analysis, Indiana Division of Forestry 2014 & 2015. vii Price per MBF in 2015 for average stand, $531/MBF from 2015 Indiana Forest Products Price report and Trend Analysis times 2013 sawlog, veneer, and stave log receipts of 313,996,064 BF. viii $7 billion in sale of final product less $166 million paid to landowners divided by $166 million. ix 30,845 employees reported by Bureau of Economic Research subtracted from 95,753 jobs estimated by the RIMS II Final‐demand Employment multiplier. x Wages paid of $1.3 billion times 3.3% for state and 1.55% for local payroll taxes. http://www.payroll‐taxes.com/state‐tax/indiana xi Wages paid of $1,173,962 divided by 4,879,577 million acres.
xii 4,879,577 acres in 2014 minus 4,713,559 acres in 2009 divided by 4 xiii Forests of the Northern Forest Inventory & Analysis Program (updated February 8, 2016) https://public.tableau.com/profile/spugh#!/vizhome/NRS‐FIAAnnualReport/Story1 xiv Unless stated otherwise all references are to forest land, defined by the U.S. Forest Service as land at least 10‐percent stocked with trees of any size, or formerly having such tree cover, and not currently developed for non‐forest use. Forest land is more inclusive than timberland, defined as forest land that is producing, or is capable of producing, in excess of 20 cubic feet per acre of industrial roundwood products under natural conditions, is not withdrawn from timber utilization by statute or administrative regulation, and is not associated with urban or rural development. xv Miles, P.D. Mon Jun 13 08:51:18 CDT 2016. Forest Inventory EVALIDator web‐application Version 1.6.0.03. St. Paul, MN: U.S. Department of Agriculture, Forest Service, Northern Research Station. [Available only on internet: http://apps.fs.fed.us/Evalidator/evalidator.jsp] xvi USDA Forest Service Forest Inventory and Analysis ‐https://public.tableau.com/profile/spugh#!/vizhome/NRS‐FIAAnnualReport/Story1 xviiUSDA Forest Service Forest Inventory and Analysis ‐https://public.tableau.com/profile/spugh#!/vizhome/NRS‐FIAAnnualReport/Story1 xviii IFWOA Directory of Professional Foresters 2015‐2016 xix Based on Economic Census (2012) and an estimate of 3 workers per firm xx U.S. Bureau of Economic Analysis at the NAICS 6 digit level. xxi http://www.statista.com/statistics/187866/gdp‐of‐the‐us‐federal‐state‐of‐indiana‐since‐1997/ xxii U.S. Dept. of Commerce, Bureau of Economic Analysis. Based on 2002 Input‐Output Tables and 2007 Regional Data for Indiana. (Data purchased 12/10/10) xxiii USDA Forest Service Forest Inventory and Analysis ‐https://public.tableau.com/profile/spugh#!/vizhome/NRS‐FIAAnnualReport/Story1 xxiv USDA Forest Service Forest Inventory and Analysis ‐https://public.tableau.com/profile/spugh#!/vizhome/NRS‐FIAAnnualReport/Story1 xxv USDA Forest Service Forest Inventory and Analysis ‐https://public.tableau.com/profile/spugh#!/vizhome/NRS‐FIAAnnualReport/Story1 xxvi Miles, P.D. Wed May 18 07:55:24 CDT 2016. Forest Inventory EVALIDator web‐application Version 1.6.0.03. St. Paul, MN: U.S. Department of Agriculture, Forest Service, Northern Research Station. [Available only on internet: http://apps.fs.fed.us/Evalidator/evalidator.jsp] xxvii207.3 million cu. ft. of growth divided by total growing stock volume of 9,324 million cu. ft. Miles, P.D. Wed May 18 07:55:24 CDT 2016. Forest Inventory EVALIDator web‐application Version 1.6.0.03. St. Paul, MN: U.S. Department of Agriculture, Forest Service, Northern Research Station. [Available only on internet: http://apps.fs.fed.us/Evalidator/evalidator.jsp] xxviii Piva, R.J. and Jeff Settle. 2016. Indiana Timber Industry—an assessment of timber product output and use in 2013. USDA Forest Service, Northern research Station. Table 8‐Industrial roundwood production by Forest Inventory Unit, species group, and product, Indiana, 2013 xxix Piva, R.J. and Jeff Settle. 2016. Indiana Timber Industry—an assessment of timber product output and use in 2013. USDA Forest Service, Northern research Station. Table 6‐ Industrial roundwood production in thousand cubic feet, by species group and State of destination, Indiana, 2013 xxx Piva, R.J. and Jeff Settle. 2016. Indiana Timber Industry—an assessment of timber product output and use in 2013. USDA Forest Service, Northern research Station. Table 8‐Industrial roundwood production by Forest Inventory Unit, species group, and product, Indiana, 2013 xxxi USDA Forest Service Forest Inventory and Analysis ‐https://public.tableau.com/profile/spugh#!/vizhome/NRS‐FIAAnnualReport/Story1 xxxii Estimating logging costs to be between $195‐210 Mbf xxxiiiMiles, P.D. Fri May 27 12:29:35 CDT 2016. Forest Inventory EVALIDator web‐application Version 1.6.0.03. St. Paul, MN: U.S. Department of Agriculture, Forest Service, Northern Research Station. [Available only on internet: http://apps.fs.fed.us/Evalidator/evalidator.jsp]– Net volume of sawtimber trees by species and ownership group
(Intl. ¼‐inch rule). Intl. ¼‐inch converted to Doyle as 1.38bf Intl. ¼‐inch per Doyle bf. Stumpage price of $327.5 per MBF applied to Doyle volume. xxxiv Miles, P.D. Fri May 27 12:32:58 CDT 2016. Forest Inventory EVALIDator web‐application Version 1.6.0.03. St. Paul, MN: U.S. Department of Agriculture, Forest Service, Northern Research Station. [Available only on internet: http://apps.fs.fed.us/Evalidator/evalidator.jsp] Average annual removals of sawtimber trees, in board feet (International 1/4‐inch rule), on forest land, Indiana 2010‐2015 xxxv U.S. Census Bureau, 2008 County Business Patterns, NAICS 1133. xxxvi US Census of Manufacturers‐2012 xxxvii All sectors: Geographic Area Series: Economy‐Wide Key Statistics: 2012, Economic Census of the US ‐ 2012 xxxviii US Census Bureau & Trade Stats Express of the International Trade Administration