INDIANA UNIVERSITY of PENNSYLVANIA - Welcome to the PA ... · The format for annual ... IUP and the...
27
P E N N S Y L V A N I A ’ S S T A T E S Y S T E M O F H I G H E R E D U C A T I O N INDIANA UNIVERSITY of PENNSYLVANIA 2016-2017 Action Plan
Transcript of INDIANA UNIVERSITY of PENNSYLVANIA - Welcome to the PA ... · The format for annual ... IUP and the...

P E N N S Y L V A N I A ’ S S T A T E S Y S T E M O F H I G H E R E D U C A T I O N
INDIANA UNIVERSITY of PENNSYLVANIA
2016-2017 Action Plan

Action Plan Preface
Looking to the future while understanding where we are today
The System’s Strategic Plan 2020: Rising to the Challenge calls for the development of detailed annual actions plans for each university for transparency and to document progress toward system and university strategic goals. By their very nature, strategic plans look to change over a period of years; in contrast, action plans are designed to look at annual changes in the university and its context. Action plans chronicle where a university has been (previous year), where it is (current year) and where it is going (in the next two years). The format for annual action plans calls for universities to detail—in the context of university mission, vision and strategic directions—distinctive programs and accomplishments, opportunities and challenges, trends in enrollment, student success, and financial management. Looking at action plans annually is important because proposed directions in academic program development, enrollments, and finances are often shaped and re-shaped by critical changes and emerging conditions in student markets, educational interests, and regional economies. As such, they highlight the important balance between thoughtful longer-term planning and the flexibility needed to respond to changing dynamics.
Aligning institutional results and reports
To present a clear picture of the university, where it has been, and where it is going, it is essential that it is aligned with existing data reports, financial information, performance funding, and annual reporting on progress towards strategic goals. Over time, it is anticipated that episodic university reports be minimized and that more of them will be incorporated and summarized within the context of action plans to provide a more thorough understanding of university efforts to meet their mission and that of the State System.

Action Plan 2016-2017
Table of Contents
Preface
Strategy
University Mission, Vision, and Statement of Strategy 1
Academic Programs of Distinction 4
Other Areas of Distinction 5
Strategic Goals 7
University Strengths, Opportunities and Challenges 8
Key Performance Indicators
Strategic Enrollment Management 10
Performance Funding Indicators 11
Academic Programs 12
Financial Information 15

INDIANA UNIVERSITY OF PENNSYLVANIA 2016/2017 ACTION PLAN
University Mission, Vision, and Statement of Strategy
University Mission - Please provide a description of your university's purpose and primary objectives for success.
Mission Statement: Indiana University of Pennsylvania
Indiana University of Pennsylvania is a leading public, doctoral/research university, strongly committed to undergraduate and graduate instruction, scholarship, and public service.
Indiana University of Pennsylvania engages students as learners and leaders in an intellectually challenging, culturally enriched, and contemporarily diverse environment.
Inspired by a dedicated faculty and staff, students become productive national and world citizens who exceed expectations personally and professionally.
Page 1

INDIANA UNIVERSITY OF PENNSYLVANIA 2016/2017 ACTION PLAN
University Mission, Vision, and Statement of Strategy (Continued)
University Vision - Please provide a description of your university's goals and aspirations for the years ahead.
In December 2013, a statement of IUP’s Vision and its Values was approved by the University Senate and, subsequently, by the IUP Council of Trustees. This statement was the culmination of a 16-month long, inclusive effort led by President Driscoll to build a shared vision for what IUP will be when it celebrates its sesquicentennial in 2025. The Vision and Values statement also is a foundation for IUP’s new Strategic Plan.
The Vision for IUP's Future
Indiana University of Pennsylvania is a community where teaching, research, and service empower students to become innovative leaders while enhancing communities throughout the world. Remaining true to its traditions, IUP assesses society’s needs and opportunities and meets them.
Students are hardworking, ready to learn, and come from diverse cultures, places, and backgrounds. Energetic, dedicated, and diverse staff and faculty members welcome them to a personal, vibrant college home. Students participate in many intentional and interconnected learning experiences in their studies, in their lives, and in the world.
Professors are active scholars and teachers in their disciplines who work together to expand their impact. They engage students in carefully designed open-ended, hands-on experiences to reinforce and enrich what students learn in the classroom. Professors use technology to enhance student learning and augment the face-to-face and peer-learning experiences that are the foundation of excellent education.
Alumni say their student experience was the best preparation for work and life. They continue to find joy in the bonds they built as students and the new connections they make with faculty and staff members, students, and other alumni. They are proud and they choose to invest in IUP's future.
IUP and the communities it serves work together to build a strong society and robust economy. IUP uses partnerships and activities to connect community members, students, faculty and staff members, and alumni, building a commitment to their shared future.
IUP Values
• Demonstrating an excellent return on educational investment.• Knowing students as individuals who work closely with faculty and staff members.• Responding to the needs of students and society with a range of innovative programs and scholarship.• Employing evidence in decision making and in demonstrating results.• Drawing on IUP’s tradition in Indiana and western Pennsylvania to serve students worldwide.• Enjoying historic, inspirational, and functional campuses and facilities.• Using technology to reach place-committed students and enhance learning for all.• Celebrating engaged, successful alumni.
Page 2

INDIANA UNIVERSITY OF PENNSYLVANIA 2016/2017 ACTION PLAN
University Mission, Vision, and Statement of Strategy (Continued)
Statement of Strategy - Please provide a description of the strategy for fulfilling your university's vision and mission, given your university's current strengths, challenges, and available resources.
IUP’s mission and vision will be fulfilled in accord with the IUP Strategic Plan 2015-2020, which was ratified by the IUP Council of Trustees on May 7, 2015. The IUP Strategic Plan, shown below in outline form, comprises four goals, twenty-two strategies to attain those goals, and seventy-five tactics that outline specific actions and steps. (Tactics are not shown due to limitations of space.)
1. Goal: Provide innovative academic programs of high quality and value.1.1. Strategy: Offer academic programs that are responsive to disciplinary advances and aligned with the
needs of students and society. 1.2. Strategy: Bring forward new degree-granting programs that respond to student interest, reflect disciplinary
advances, and serve the needs of society, with emphasis on interdisciplinary programs that leverage existing faculty expertise.
1.3. Strategy: Explore relevant and sustainable non-degree, non-credit hour programs. 1.4. Strategy: Strengthen IUP’s academic value to students. 1.5. Strategy: Advance IUP’s status as a Doctoral Research University.
2. Goal: Prepare all of IUP’s students for success in work and life, in addition to academic success.2.1. Strategy: Commit to student success.2.2. Strategy: Focus on access, support, and opportunity for students from traditionally underrepresented and
underserved student populations. 2.3. Strategy: Prepare students to work and live in a culturally diverse and global future.
3. Goal: Secure IUP’s financial future.3.1. Strategy: Increase private philanthropic support to IUP.3.2. Strategy: Align unit funding with institutional priorities and goals. 3.3. Strategy: Develop innovative models of tuition flexibility. 3.4. Strategy: Improve the efficiency of conducting university business. 3.5. Strategy: Employ best practices with regard to regulatory and legislative mandates. 3.6. Strategy: Proactively focus on IT and network security for the protection of our students, faculty, staff, and
off-campus partners. 3.7. Strategy: Ensure that Campus Facilities Master Plan projects are fully funded.
4. Goal: Strengthen IUP’s value to our local, state, and global partners.4.1. Strategy: Increase regional, state, and global recognition of IUP.4.2. Strategy: Advance civility and personal responsibility in the University and community. 4.3. Strategy: Promote IUP as a destination for community enrichment. 4.4. Strategy: Strengthen local, state, federal, and global partnerships in education, research, workforce
development, and economic development. 4.5. Strategy: Strengthen relationships with IUP’s formally recognized affiliated organizations. 4.6. Strategy: Engage alumni to advance IUP. 4.7. Strategy: Reaffirm our commitment to IUP’s most important resource, our people.
Page 3

INDIANA UNIVERSITY OF PENNSYLVANIA 2016/2017 ACTION PLAN
Academic Programs of Distinction
Academic Programs of Distinction - Please identify your university's top 3 or 4 Program Areas of Distinction (An Academic Program of Distinction is defined as a two-digit CIP level which includes general groups of related programs such as Business and Education. You may also use related areas that cross CIP codes such as Visual and Performing Arts or Allied Health Professions. STEM as a Program of Distinction is too broad but Technology and Engineering or Engineering and Math would be a suitable Program of Distinction.) Please provide a brief rationale or narrative as to what makes these programs distinctive.
The following are featured (in alphabetical order) among IUP’s many distinguished programs:
Criminology (CIP 45): IUP offers the B.A. in Criminology, B.A. in Criminology/Pre-Law, M.A. in Criminology (in-person and online program versions), and the Ph.D. in Criminology. IUP’s Ph.D. in Criminology is one of 47 doctoral programs in criminology/criminal justice in the United States. Graduates of the program hold positions with the FBI, Secret Service, and Drug Enforcement Administration, and are employed across the nation as probation officers, parole officers, jail and prison counselors, local police officers, state police, counselors in juvenile and adult programs, coordinators of private security for corporations, and investigators for insurance companies. IUP Criminology graduates go on to leadership positions in active service and in academia: Five of the top 50 most productive criminologists in the country hold IUP Ph.D. degrees.1
English (CIP 23): IUP offers the B.S.Ed. in English Education, the B.A. in English (with five tracks), the M.A. in Literature, M.A. in Composition and Literature, M.A. in Teaching English, M.A. in TESOL, the Ph.D. in Composition and TESOL, and the Ph.D. in Literature and Criticism. The IUP graduate programs in English are internationally recognized and they prepare students for careers in, among others, teaching English, writing, journalism, marketing, and publishing. IUP’s graduate programs in English are the largest in Pennsylvania, and IUP consistently is among the top ten producers of English Ph.D.s in the nation. Quality accompanies quantity; a survey by the Modern Language Association found the IUP doctoral programs in English to be among the most successful in advancing graduates’ careers. The majority of IUP’s English Ph.D. students are employed as English teachers at two- or four-year colleges and universities, with others in secondary education.
Music (CIP 50): IUP offers the B.S. in Music Education, the BFA in Performance and Composition, and the B.A. in General Music, as well as the M.A. with concentrations in Performance or Music Education. Program graduates go on to careers in professional music, teaching, performance, recording, and related areas including music journalism, musicology, concert management, arts administration, music retail, music business, and music therapy.
Psychology (CIP 42): IUP offers the B.A. in Psychology and the Doctor of Psychology degree in Clinical Psychology (Psy.D.). The Psy.D. is accredited by the Commission on Accreditation of the American Psychological Association. It is recognized as being among the nation’s top ten “hidden gem” clinical psychology training programs2 and was listed as one of the nation’s top five Psy.D. programs in clinical psychology for 20163.
Safety Science (CIP 15): IUP offers the B.S. in Safety, Health and Environmental (SHE) Applied Sciences, M.S. in Safety Sciences (online), and the Ph.D. in Safety Sciences (online). A degree in safety sciences prepares for a career as a SHE Professional, with employment in construction, petrochemical, utility, transportation, insurance/consulting, healthcare, government and general industry. Placement rates within the SHE Profession within two months of graduation have averaged 75% the past five years and have been as high as 95%. The B.S. in SHE Applied Sciences has been ABET accredited since 1983 and is one of only twenty safety programs in the United States recognized by the Board of Certified Safety Professionals (BCSP) as a “Qualified Academic Program,” and graduates of the program receive a GSP Designation by the BCSP at the time of graduation. In 2014, the American Society of Safety Engineers (ASSE) recognized the Student Chapter at IUP as the “Outstanding Student Section” in the United States.
1 Cohn and Farrington, 2014. Publication Productivity of Criminologists. Journal of Criminal Justice Education 25:275. 2 Callahan et al., 2013. Hidden gems among clinical psychology training programs. Training and Education in Professional Psychology 74:278. 3 http://www.bestcounselingdegrees.net/best/psy-d-programs-clinical-psychology/#here
Page 4

INDIANA UNIVERSITY OF PENNSYLVANIA
2016/2017 ACTION PLAN
Other Areas of Distinction
Other Areas of Distinction - Please describe your university's admirable characteristics and accomplishments, including services, programs, student success, and community engagement.
Alumni Engagement: IUP Alumni totals over 120,000 individuals living across the country. In the last 3 years, there has been a dramatic increase in alumni engagement due to the visionary leadership of Dr. Driscoll, an approved university and alumni relations strategic plan and the quiet phase introduction of a comprehensive fundraising campaign. The Comprehensive Campaign Executive Cabinet currently consists of 9 very successful alumni. Each academic college and the athletic department has also recruited successful alumni to leadership councils. The alumni volunteer councils have met twice with 72 alumni attending. Community service and engagement: IUP works constructively with and within its community. IUP, with Indiana Borough, White Township, and Indiana County, are partners in the Indiana Community University District (ICUD) initiative to develop a comprehensive master plan for the area around the IUP campus. The ICUD plan will address housing, transportation and mobility, open space, and economic development. Moreover, IUP is a partner in IACT, the Indiana Area Collaborative Team, which is a coalition that also includes Indiana Borough, White Township, Indiana County, law enforcement agencies, and landlords and businesses. IACT was formed in 2014 to coordinate responses to disruptive celebratory behaviors, and has since become a vehicle for town/gown communications. Finally, for four years in a row, IUP has been named to President’s Higher Education Community Service Honor Roll, which recognizes exemplary community service, by the Corporation for National and Community Service. Doctoral/Research University: IUP is designated by the Carnegie Commission on Higher Education as a Doctorate-granting University (DRU: Doctoral/Research University. IUP is one of Pennsylvania’s four public DRUs (with Pitt, PSU, and Temple), and it is the only member of the State System to hold this designation. The designation includes institutions that awarded at least 20 research doctoral degrees per year and excludes doctoral-level degrees that qualify recipients for entry into professional practice, such as the J.D., M.D., Pharm.D., D.P.T., etc. Honors College: The Cook Honors College at IUP successfully combines the resources of a mid-size university with the personal attention of a small college. Since its first students matriculated in 1996, awards and recognitions conferred on CHC graduates include nine Fulbright Awards, two Fulbright alternates, three NSF awards and an NSF Teaching award, two Marshall Awards, two Truman Award finalists, a Freeman Asia Award, a Pickering Award, and a Rhodes Scholar finalist. In 2016, IUP’s sixth Goldwater Award recipient was announced. The CHC has been mentioned prominently in the Chronicle of Higher Education (2002) and was the only honors college profiled in Donald Asher’s Cool Colleges for the Hyper-Intelligent, Self-Directed, Late Blooming, and Just Plain Different (2000 and subsequent revisions, including 2011). International programs: IUP has thriving programs in international education that include faculty exchanges, study abroad opportunities, and programs that bring students from other countries to study at IUP. In fall 2016, IUP hosted 923 undergraduate and graduate students from 60 countries, which is more than half of all international students in the state system as a whole. Military and veterans: The Army Reserve Officers’ Training Corps program (ROTC) was established at IUP in 1950. It is housed in one of the largest ROTC facilities on the East Coast, which includes classrooms with multimedia and Internet capability. The program benefits from a strong regional emphasis on patriotism and service, and rates of enrollment are among the highest in the country. The nation’s top ROTC cadet in 2009 was from IUP, and the ROTC program received the Douglas A. MacArthur Award in 2014, which honors the top ROTC units in the nation. Another succinct statement of success of IUP’s ROTC program is that twelve graduates (including two women) of the IUP ROTC program have become generals. IUP also is nationally recognized for its efforts to assist students who have military service experience. The IUP Military and Veterans Resource Center (MVRC) opened in 2014 and works collaboratively with IUP programs and services to help veterans and military-affiliated students achieve their goals. Between opening the MVRC and today, IUP’s enrollment of military-affiliated students increased by 30 percent. Our military-affiliated students are successful, with a
Page 5

INDIANA UNIVERSITY OF PENNSYLVANIA
2016/2017 ACTION PLAN
Other Areas of Distinction (Continued)
96.8% retention rate and an average GPA of 3.09. Military Advanced Education recognized IUP as an “MAE 2015 Top School” for exhibiting best practices in military and veteran education. IUP is consistently recognized by G.I. Jobs magazine as a “Military Friendly School” and by Military Times magazine as one of the nation’s “Best for Vets” institutions. IUP was one of only 68 four-year colleges in the nation chosen for the “Best for Vets” listing. Program Accreditation: Fifty-one of IUP’s academic programs are eligible for specialized accreditation by agencies that are recognized by the Council on Higher Education Accreditation (CHEA). Of the eligible programs, 98% are accredited by an agency that is appropriate to the discipline. In addition, four programs have received accreditation from professional agencies that are not recognized by the CHEA.
Page 6

INDIANA UNIVERSITY OF PENNSYLVANIA 2016/2017 ACTION PLAN
Strategic Goals
University Strategic Goals – Please describe the initiatives/strategies that will drive improvement towards university goals. Please include how your university goals align to the System strategic goals below. 1. Ensuring academic program excellence and relevance.2. Enabling more students to obtain credentials that prepare them for life, career, and the responsibilities of citizenship.3. Developing new funding strategies, diversifying resources and managing costs to preserve affordability. Initiatives and
strategies should address mitigation of financial risk.4. Increasing accountability and transparency, focusing on results and key performance indicators.
University Goals
Goals and Strategies from the IUP 2015-2020 strategic plan that advance System Goal #1: • Provide innovative academic programs of high quality and value. (IUP 1)
o Offer academic programs that are responsive to disciplinary advances and aligned with the needs ofstudents and society. (IUP 1.1)
o Bring forward new degree-granting programs that respond to student interest, reflect disciplinaryadvances, and serve the needs of society, with emphasis on interdisciplinary programs that leverageexisting faculty expertise. (IUP 1.2)
o Explore relevant and sustainable non-degree, non-credit hour programs. (IUP 1.3)o Strengthen IUP’s academic value to students. (IUP 1.4)o Advance IUP’s status as a Doctoral Research University. (IUP 1.5)
Goals and Strategies from the IUP 2015-2020 strategic plan that advance System Goal #2: • Provide innovative academic programs of high quality and value. (IUP 1)
o Offer academic programs that are responsive to disciplinary advances and aligned with the needs ofstudents and society. (IUP 1.1)
o Explore relevant and sustainable non-degree, non-credit hour programs. (IUP 1.3)• Prepare all of IUP’s students for success in work and life, in addition to academic success. (IUP 2)
o Commit to student success. (IUP 2.1)o Focus on access, support, and opportunity for students from traditionally underrepresented and
underserved student populations. (IUP 2.2)o Prepare students to work and live in a culturally diverse and global future. (IUP 2.3)
Goals and Strategies from the IUP 2015-2020 strategic plan that advance System Goal #3: • Secure IUP’s financial future. (IUP 3)
o Increase private philanthropic support to IUP. (IUP 3.1)o Align unit funding with institutional priorities and goals. (IUP 3.2)o Develop innovative models of tuition flexibility. (IUP 3.3)o Improve the efficiency of conducting university business. (IUP 3.4)o Ensure that Campus Facilities Master Plan projects are fully funded. (IUP 3.7)
Goals and Strategies from the IUP 2015-2020 strategic plan that advance System Goal #4: • Secure IUP’s financial future. (IUP 3)
o Increase private philanthropic support to IUP. (IUP 3.1)o Align unit funding with institutional priorities and goals. (IUP 3.2)o Improve the efficiency of conducting university business. (IUP 3.4)o Employ best practices with regard to regulatory and legislative mandates. (IUP 3.5)o Proactively focus on IT and network security for the protection of our students, faculty, staff, and off-
campus partners. (IUP 3.6)• Strengthen IUP’s value to our local, state, and global partners. (IUP 4)
o Strengthen local, state, federal, and global partnerships in education, research, workforcedevelopment, and economic development. (IUP 4.3)
o Strengthen relationships with IUP’s formally recognized affiliated organizations. (IUP 4.4)
Page 7

INDIANA UNIVERSITY OF PENNSYLVANIA
2016/2017 ACTION PLAN
University Strengths, Opportunities, and Challenges (Anticipated within the next 3 years)
In addition to identifying university strengths, please identify specific opportunities and challenges that the university will be addressing (currently or within the next 3 years), including financial conditions, enrollment trends, community/regional engagement, and student experiences and outcomes.
Core Capabilities
Opportunities
IUP’s academic core – curriculum and faculty – is solid and strong. Our academic programs are well regarded and IUP’s students receive an education of high quality and with good value, as shown by 2016’s successful decennial re-accreditation review by the MSCHE, and by our many alumni with nationally visible leadership positions in business, science, education, criminal justice, safety sciences, and the arts. Last year’s system-wide faculty labor action did not alter the commitment that IUP’s faculty have to the institution, to our students, or to the baccalaureate, masters, and doctoral programs they support. IUP also has stable, talented leadership and a shared sense of purpose, innovation, and forward movement that permits us to move with informed decisiveness. We enjoy a renewed sense of partnership and shared purpose with community leaders, which permits us to explore educational and employment opportunities for our students and to partner in regional economic development initiatives. We are fortunate to have an attractive campus and a dedicated, committed facilities team. Finally, we have a strong and large base of living alumni that are ambassadors for IUP.
IUP has a solid foundation of purpose and progress, which is articulated in and guided by our strategic plan, IUP 2015-2020. Our accelerating progress is shown by new academic programs, including public health (approved in 2016), environmental engineering (coming forward in 2017), and digital sciences and security (coming forward in 2018); by a new, comprehensive enrollment management plan; by a sharp focus on student success that is driven by analytics; by vastly improved town/gown relationships; and by renovation/construction of our academic buildings. Our strategic approach to student success emphasizes co-curricular experiences, and this year we will complete a comprehensive dining facilities program to support this important part of student life. These improvements will help support our new comprehensive enrollment plan which, in addition to recruiting traditional residential students, will expand IUP’s outreach to new regional, out-of-state, and international populations of prospective students. As we recruit more broadly, we also continue to work on effecting social change through campus and community dialogues on race, diversity, and inclusion. We also are capitalizing on opportunities that come through our regional campus locations: In fall, IUP’s highly regarded program in respiratory care will move from West Pennsylvania Hospital to our Northpointe location in Armstrong County, which will improve both access and affordability. IUP also is making significant changes at our Punxsutawney location to better serve Jefferson County. Programming at that location will shift from serving underprepared students from across the Commonwealth to local employment and workforce development needs. This initiative is steered, in part, by an analysis provided by the system’s OEI and will include development of AA and AAS programs in business, hospitality, culinary arts, and expanded programs in allied health.
Page 8

INDIANA UNIVERSITY OF PENNSYLVANIA 2016/2017 ACTION PLAN
Challenges
IUP, other members of the State System, and public institutions across the US share challenges that include financial pressures that come from a decade and more of declines in state funding, mandates to implement policies and procedures that respond to an increasingly nuanced political and regulatory environment, rapid changes in instructional technology and associated changes in pedagogical practice, and a suite of complex challenges posed by the changing characteristics and expectations of the students we serve. The overall financial health of the State System is a serious concern that, hopefully, can be addressed as an outcome of the current system review. Similarly, we are increasingly concerned that IUP’s value to the Commonwealth and our unique potential as a Doctoral Research University is compromised by a combination of the System’s current labor agreements (which are overly restrictive with regard to fostering research activity) and a broad application of metrics that are most appropriate for universities with a focus on delivery of Master’s degrees, but are less suitable for meaningful comparisons outside of this group. In sum, IUP has emerged from institutional stagnation: Leadership is stable and strong, and IUP has a renewed sense of direction and purpose. But, we continue to face roadblocks to innovation.
Page 9

INDIANA UNIVERSITY OF PENNSYLVANIA 2016/2017 ACTION PLAN
Strategic Enrollment Management
Fall 2012Actual
Fall 2013Actual
Fall 2014Actual
Fall 2015Actual
Fall 2016Actual
Fall 2017Projected
Fall 2018Projected
Undergraduate Headcount Enrollment - Associate and Bachelor's Degree SeekingNew Freshmen 23.1% 21.9% 23.2% 22.2% 21.3% 25.2% 25.9%New Transfers 5.4% 5.1% 4.7% 4.8% 4.8% 5.0% 5.2%Veterans 1.1% 1.2% 1.2% 2.5% 3.3% 3.5% 3.7%Adult Learners 5.7% 5.2% 5.3% 5.4% 5.4% 5.4% 5.6%Total Undergraduate Enrollment 12,690 12,108 11,774 11,162 10,314 10,539 10,214
Graduate Headcount EnrollmentMaster's 1,364 1,260 1,293 1,382 1,353 1,459 1,537Research Doctorate 833 824 822 708 743 786 830Professional Doctorate N/A N/A N/A 65 64 70 73Total Graduate Enrollment 2,197 2,084 2,115 2,155 2,160 2,315 2,440
Certificates and Nondegree Students709 733 645 624 640 650 675
Headcount Enrollment by Method of InstructionDistance Education (100% Distance Education) 250 242 302 360 388 400 430Traditional (On Campus) 12,489 11,734 11,004 10,577 9,645 9,300 9,250Off Campus 946 885 840 802 715 680 674
Fall 2012Actual
Fall 2013Actual
Fall 2014Actual
Fall 2015Actual
Fall 2016Projected
Fall 2017Projected
Fall 2018Projected
Persistence Rates of First-time Bachelor's Degree Seeking StudentsSecond Year Persistence 75.3% 73.4% 74.5% 75.6% 74.5% 75.0% 76.0%Third Year Persistence 63.3% 64.0% 64.4% 65.8% 65.9% 66.0% 66.0%Fourth Year Persistence 62.3% 60.0% 61.4% 60.0% 62.0% 62.0% 62.0%
Note: Persistence rates are for those students who are returning in or have graduated by the provided year
2012/13Actual
2013/14Actual
2014/15Actual
2015/16Actual
2016/17Projected
2017/18Projected
2018/19Projected
Graduation Rates for Bachelor's Degree Seeking StudentsFour Year (or less) 35.6% 36.3% 38.0% 36.0% 36.5% 36.8% 37.0%Six Year (or less) 51.2% 52.9% 54.9% 54.0% 54.5% 55.0% 56.0%
2012/13Actual
2013/14Actual
2014/15Actual
2015/16Actual
2016/17Projected
2017/18Projected
2018/19Projected
Average Time to Degree (Bachelor's) (methodology under consideration)
Average Credits at Graduation127.4 127.3 126.5 126.5 126.5 124.0 122.0
Graduates Employed in Pennsylvania (methodology under consideration)
Bachelor's Degree Graduates Continuing Their Education (methodology under consideration)
Completers
Planned Enrollment by Student Type
Persistence Rates
Graduation Rates
Page 10

INDIANA UNIVERSITY OF PENNSYLVANIA 2016/2017 ACTION PLAN
Performance Funding Indicators Of the ten (10) performance funding indicators, five (5) are required of all system universities while five (5) others are chosen by each of the universities to reflect what is most important to their mission and strategic goals. Further refinements in the System’s performance
funding program are anticipated in 2016.
Baseline2012/13
Performance Report
2013/14Performance
Report
2014/15Performance
Report
2015/16Performance
Report
2016/17Targets
Degrees ConferredNumber of Degrees Conferred 2,895 3,292 3,268 3,369 3,336 3,163Undergraduate Degrees per 100 FTE 17.8 16.8 19.2 19.3 21.4 18.6
Closing the Achievement Gaps - 6 Year Graduation RatesPell Recipient Graduation Rate 48.0% 41.6% 40.2% 42.8% 46.1% 48.7%Non-Pell Recipient Graduation Rate 57.0% 53.9% 56.5% 57.4% 59.9% N/AUnderrepresented Minority Graduation Rate 40.0% 38.0% 32.9% 32.8% 38.9% 41.6%Non-Underrepresented Minority Graduation Rate 56.0% 52.2% 55.5% 57.1% 57.7% N/A
Closing the Freshman Access GapsPell Recipient Freshmen 37.0% 38.3% 40.2% 40.9% 44.0% 38.0%
38.0% 38.0% 38.0% 38.0% 38.0% 38.0%Underrepresented Minority Freshmen 13.4% 17.1% 20.6% 20.0% 24.5% 18.0%
18.0% 18.0% 18.0% 18.0% 18.0% 18.0%
Faculty DiversityUnderrepresented Minority Faculty 14.5% 15.4% 15.5% 16.1% 16.8% 16.4%Female Faculty 45.4% 45.3% 44.8% 45.4% 45.8% 50.0%
Baseline2012/13
Performance Report
2013/14Performance
Report
2014/15Performance
Report
2015/16Performance
Report
2016/17Targets
Persistence Rates of First-time Bachelor's Degree Seeking StudentsThird Year Persistence 61.6% 66.2% 63.3% 64.0% 64.4% 65.0%Fourth Year Persistence 58.4% 62.3% 60.0% 61.4% 61.2% 62.0%
STEM and Health Profession (STEM-H) Degree RecipientsPercentage of Total Degrees Awarded that are STEM-H
16.2% 17.4% 17.4% 18.4% 19.4% 18.6%
Support Expenditures35.4% 35.0% 33.2% 34.1% 34.4% 32.9%
Individual DonorsGrowth Rate of Individual Donors* 1 1 1.1 1.1 0.90 >1
External Grant SupportFederal Grants per Faculty** $18,585 $15,725 $14,225 $47,318*** $44,690 N/A
***This measure was revised for the 2014/15 Performance Report to include both Federal and State Grants. Previously only Federal Grants were included.
*This measure is a ratio of the annual difference in the number of individual donors as compared to a set of peers. A value greater than one means IUPoutperformed its peers.**This measure is a ratio of the university's federal grants per faculty compared to the peer group's federal grants per faculty, but this chart only displays theuniversity's federal grants per faculty.
Low Income PA High School Graduates (ages 18-24)
Common to All Universities
University Selected
Underrepresented Minority PA High School Graduates (ages 18-24)
Page 11

INDIANA UNIVERSITY OF PENNSYLVANIA 2016/2017 ACTION PLAN
Academic Programs
Number of Programs in 2015/16 and the Total Number of Completers from 2011/12 through 2015/16 2015/16Certificate Programs
Total Number of Certificate Programs 10Number of Certificate Programs with a Total of 10 or More Completers Over the Previous 5 Years 4Percentage of Certificate Programs with a Total of 10 or More Completers Over the Previous 5 Years 40%
Associate Degree ProgramsTotal Number of Associate Programs 2Number of Associate Programs with a Total of 25 or More Completers Over the Previous 5 Years 1Percentage of Associate Programs with a Total of 25 or More Completers Over the Previous 5 Years 50%
Bachelor's Degree ProgramsTotal Number of Bachelor's Programs 73Number of Bachelor's Programs with a Total of 30 or More Completers Over the Previous 5 Years 59Percentage of Bachelor's Programs with a Total of 30 or More Completers Over the Previous 5 Years 81%
Master's Degree ProgramsTotal Number of Master's Programs 34Number of Master's Programs with a Total of 20 or More Completers Over the Previous 5 Years 28Percentage of Master's Programs with a Total of 20 or More Completers Over the Previous 5 Years 82%
Professional Doctorate Degree ProgramsTotal Number of Professional Doctorate Programs 1Number of Professional Doctorate Programs with a Total of 10 or More Completers Over the Previous 5 Years 1Percentage of Professional Doctorate Programs with a Total of 10 or More Completers Over the Previous 5 Years 100%
Research Doctorate Degree ProgramsTotal Number of Research Doctorate Programs 8Number of Research Doctorate Programs with a Total of 5 or More Completers Over the Previous 5 Years 8Percentage of Research Doctorate Programs with a Total of 5 or More Completers Over the Previous 5 Years 100%
6-digit CIPOffered Via
Distance Learning
Associate Degree Programs
Bachelor's Degree Programs
Master's Degree Programs
Doctorate Degree Programs
Certificates51.1504 Post-Baccalaureate in Child and Adult Advocacy13.1401 Post-Baccalaureate in English as a Second Language Specialist5.0123 Sub-Baccalaureate in Chinese Studies5.0127 Sub-Baccalaureate in Japan Studies5.0108 Sub-Baccalaureate in Middle Eastern Studies54.0199 Sub-Baccalaureate in Digital History14.2501 Post-Baccalaureate in Shale Gas and Energy13.1013 Post-Masters in Autism Spectrum Disorder
Minors51.1403 Child and Adult Advocacy Studies51.1403 Community Health43.0106 Forensic Bioscience
6-digit CIPOffered Via
Distance Learning
Associate Degree Programs
Bachelor's Degree Programs51.0204 B.S. in Speech Language Pathology and Audiology9.0401 B.A. in Journalism and Pubic Relations13.1001
Master's Degree Programs54.0105 M.A. in Public History
Doctorate Degree Programs42.2805 Ph.D. In Educational and School Psychology
Certificates
Minors
Reorganized Programs for 2015/16
Program Name Change
Program Name
Academic Program Activity
New Programs for 2015/16
B.S.Ed. in Special Education paired with Reading Specialist
Page 12

INDIANA UNIVERSITY OF PENNSYLVANIA 2016/2017 ACTION PLAN
Academic Programs
6-digit CIPOffered Via
Distance Learning
Associate Degree Programs
Bachelor's Degree Programs16.9999 B.A in Spanish for International Trade
Master's Degree Programs
Doctorate Degree Programs
Certificate's
Minors
6-digit CIPOffered Via
Distance Learning
Associate Degree Programs40.0807 A.A.S in Electro-Optics52.0201 A.A in Business
Bachelor's Degree Programs16.0901 B.A in French16.9999 B.A in French for International Trade40.0801 B.A in Physics45.9999 B.A in Government and Public Service27.0301 B.S in Applied Mathematics51.2202 B.S in Environmental Health Science16.0901 B.S.Ed in French
Master's Degree Programs40.0801 M.A in Physics45.0701 M.A in Geography
Doctorate Degree Programs
Certificates
Minors
Programs Placed in Moratorium for 2015/16
Program Name
Programs Discontinued for 2015/16
Program Name
Page 13

INDIANA UNIVERSITY OF PENNSYLVANIA 2016/2017 ACTION PLAN
Planned New and Emerging Academic Programs
6-digit CIP
Associate Degree Programs520999520905 A.A.S in Culinary Arts520201 A.A in Business Administration
Bachelor's Degree Programs220302 B.S in Paralegal Studies (LOI to PASSHE 15-16)290207 B.S in Cyber Security150507 B.S in Environmental Engineering (LOI to PASSHE 15-16)
Master's Degree Programs520305 M.S in Accounting and Finance (LOI to PASSHE 15-16)500507 M.F.A in Ensemble, Devised and Applied Theater (LOI to PASSHE in 15-16)290207 M.S in Cyber Security
Doctorate Degree Programs520201 Ph.D. in Business Administration (LOI to PASSHE 15-16)422805 Ed.S. in School Psychology
Certificates
Minors
6-digit CIP
Associate Degree Programs
Bachelor's Degree Programs110801 B.S in Web Design
Master's Degree Programs110501 M.S in Data Analytics40301 M.S in Urban and Regional Planning90900 M.S in Strategic Communications
Doctorate Degree Programs
Certificates
Minors
New Programs for Possible Consideration by the Board of Governors in 2018/19
Program Name System Universities with Similar Program
Program Name
New Programs for Possible Consideration by the Board of Governors in 2017/18
System Universities with Similar Program
A.A in Hospitality
Page 14

INDIANA UNIVERSITY OF PENNSYLVANIA 2016/2017 ACTION PLAN
Budget Assumptions
October 2016% Change
RevenuesTuition Rate $8,430Technology Tuition Fee 448 University Mandatory Fees (University to provide anticipated percent change in rates for future years) 2,489 System's State Appropriation (university's share may vary) $444,224,000
ExpendituresSalaries, required changes to base pay Event
AFSCME 2.75% GPI, Eff. 10/1/16
2.0% GPI, Eff. 7/1/17
1 step (or cash
payment for those at top of payscale), Eff. 1st pay in
Jan. 2018
2.5% GPI, Eff. 7/1/18
1 step (or cash
payment for those at top of payscale), Eff. 1st pay in
Jan. 2019
Faculty N/A 2.75% GPI, Eff. Fall 2016
1 step (or cash payment for those at top of
payscale), Eff. Spring 2016 (Paid after full ratification of
contract)Nonrepresented N/A
SCUPA N/A 2.75% GPI, Eff. 10/1/16 N/A 1.75% GPI,
Eff. 7/1/17
1 step (or cash
payment for those at top of payscale), Eff. 1st pay in
Jan. 2018
2.25% GPI, Eff. 7/1/18
1 step (or cash
payment for those at top of payscale), Eff. 1st pay in
Jan. 2019
SPFPA N/A 3.50% GPI, Eff. 10/1/16 N/A
OPEIU N/A 3.50% GPI, Eff. 10/1/16 N/A 2.00% GPI,
Eff. 7/1/17
1 step (or cash
payment for those at top of payscale), Eff. 1st pay in
Jan. 2018
2.50% GPI, Eff. 7/1/18
1 step (or cash
payment for those at top of payscale), Eff. 1st pay in
Jan. 2019
Coaches 3.00% GPI, Eff. 10/1/16
Lump Sum Cash Payout: $1,500 for permanent full-time coach and $750 for
permanent part-time coach (Paid
after full ratification of contract)
2.75% Annual Salary
Adjustment, Eff. 1/1/18
2.50% Merit Pool, Eff.
7/1/17
2.50% Annual Salary
Adjustment, Eff. 1/1/19
2.50% Merit Pool, Eff.
7/1/18
PSSU N/A 2.75% GPI, Eff. 10/1/16 N/A 2.0% GPI,
Eff. 7/1/17
1 step (or cash
payment for those at top of payscale), Eff. 1st pay in
Jan. 2018
2.5% GPI, Eff. 7/1/18
1 step (or cash
payment for those at top of payscale), Eff. 1st pay in
Jan. 2019
PDA N/A
Retirement % of PaySERS 29.95%PSERS 14.60%ARP 9.29%
PSERS Healthcare Contribution 0.415%
HealthcareCommonwealth Plan Annual Rate
Active Employees (PEBTF - AFSCME, SCUPA, PSSU, and PDA) $11,830Retired Employees (REHP - AFSCME only) $9,412
State System PlanActive Employees, Faculty, PPO Plan $13,663Active Employees, Faculty HMO Plan $17,242Active Employees, Coaches, PPO Plan $16,402Active Employees, Coaches, HMO PlanActive Employees, Other, PPO Plan $12,310Faculty Health & Welfare $1,464Supplemental Healthcare for nonfaculty $865Retiree Healthcare (non AFSCME) $5,200
Consumer Price Index (Urban) 1.80%
Comments:(Include changes in rates and/or assumptions since November 2016)
Same as October Assumption 1.90% 2.40% 2.40%
TO BE DETERMINED N/A TO BE DETERMINED TO BE DETERMINED
6.00% 2.00% 6.00%$16,523
Same as October Assumption 6.00% 2.00% 0.00%Same as October Assumption 6.00% 2.00% 6.00%
Same as October Assumption 4.97% 4.97% 6.00%
Same as October Assumption 0.00% 0.00% 0.00%
$13,005 $14,483 $12,595 6.00%$16,720$15,861 $17,386 $15,626 6.00%
$18,277 $16,523
$18,277$16,720Same as October Assumption
2.75%
Same as October Assumption 0.00% 0.00% -1.20%
Annual Rate
Same as October Assumption 3.96% 3.96%
Same as October Assumption 0.00% 0.00% 0.00%
Same as October Assumption 9.15% 9.15% 7.46%% of Pay % Change % Change % Change
N/A
N/A
N/A N/A N/A
N/A
N/A
Same as October Assumption 6.70% 8.70% 3.30%
Same as October Assumption 0.00% $453,108,000 0.00%
Same as October Assumption
N/A 2.0% GPI, Eff. Fall 2017 N/A
2.75% Merit Pool, Eff. 1/7/17 N/A 4.25% Merit Pool, Eff. 1/6/18 TO BE DETERMINED
Events Events Events
Same as October Assumption
Same as October Assumption 0.00% 0.00% 0.00%
Same as October Assumption 0.00%
2016/17 2017/18
March 2017% Change
October 2016% Change
March 2017 % Change
2018/19% Change
Same as October Assumption 0.00% 0.00% 0.00%
Page 15

INDIANA UNIVERSITY OF PENNSYLVANIA
2016/2017 ACTION PLAN
Education & General (E&G) Fund
Dollars in Millions
2014/15Actual
2015/16Actual
2016/17 Approved
Revised 2016/17
Projected
2017/18 Request
Revised 2017/18
Projected
2018/19Projected
Undergraduate In-State Tuition $75.2 $73.7 $77.3 $77.5 $78.7 $78.4 $79.8Undergraduate Out-of-State Tuition 13.9 14.4 14.7 12.8 14.5 12.7 12.7Graduate In-State Tuition 11.5 11.3 11.6 11.6 11.6 11.4 11.4Graduate Out-of-State Tuition 8.6 9.5 9.7 9.1 9.7 10.1 10.1TOTAL TUITION REVENUE $109.1 $108.8 $113.3 $110.9 $114.5 $112.5 $113.9Total Fees 35.1 34.9 33.7 33.0 33.4 33.2 32.9State Appropriations 51.5 54.4 54.6 53.3 54.6 53.9 53.9All Other Revenue 18.2 17.4 16.4 16.0 16.4 16.0 16.0Planned Use of Carryforward 0.0 0.0 2.9 12.2 2.9 0.0 0.0Total E&G Revenue/Sources $213.9 $215.5 $220.9 $225.5 $221.9 $215.6 $216.8
Total Salaries and Wages $108.1 $105.6 $105.0 $106.6 $105.5 $108.7 $109.8Total Benefits 50.0 52.8 53.6 54.7 56.2 56.9 59.4 TOTAL PERSONNEL EXPENDITURES $158.2 $158.5 $158.6 $161.3 $161.7 $165.6 $169.3Financial Aid 9.3 10.1 12.3 13.0 12.9 13.3 13.8Utilities 4.6 3.8 5.2 6.1 4.9 6.0 6.2Services & Supplies 30.1 33.7 36.5 35.7 36.8 34.9 36.0Capital Expenditures and Transfers 10.4 11.2 8.4 9.4 8.5 8.8 8.3Total E&G Expenditures/Transfers $212.5 $217.3 $220.9 $225.5 $224.8 $228.6 $233.5Total E&G Fund Surplus/(Shortfall) $1.4 ($1.8) $0.0 $0.0 ($2.9) ($12.9) ($16.7)
Undergraduate In-State 10,693.20 10,138.75 9,358.07 9,316.28 9,245.77 9,192.37 9,071.30Undergraduate Out-of-State 1,126.45 1,102.50 1,062.40 935.24 1,049.45 916.89 916.89Graduate In-State 1,030.21 976.38 984.49 985.04 984.19 993.31 993.31Graduate Out-of-State 482.67 555.96 548.57 541.63 548.57 533.66 533.66Total Annualized FTE Enrollment 13,332.53 12,773.59 11,953.53 11,778.19 11,827.98 11,636.23 11,515.16
Faculty 693.83 685.79 667.89 650.55 667.89 650.55 650.55AFSCME 379.98 375.05 372.05 369.10 372.05 369.10 369.10Nonrepresented 181.11 186.72 184.72 183.64 184.72 183.64 183.64SCUPA 50.51 49.45 47.45 51.20 47.45 51.20 51.20All Other 116.85 54.36 54.36 58.38 54.36 58.38 58.38Total E&G Fund Budgeted Annualized FTE Employees 1,422.28 1,351.37 1,326.47 1,312.87 1,326.47 1,312.87 1,312.87
E&G Expenditures/Transfers
Annualized FTE Enrollment
E&G Budgeted Annualized FTE Employees
E&G Revenue/Sources
Page 16

INDIANA UNIVERSITY OF PENNSYLVANIA
2016/2017 ACTION PLAN
Strategic E&G Budget Realignment
Strategic University Specific Budget Realignment Information
Description2014/15Amount
2015/16Amount
2016/17Amount
Strategic Investments:Marketing Initiative $866,200 $860,000 $749,416Admissions 0 0 500,000Engaging and Educating the Shale Gas Partners 20,700 0 03 in 1 Proposals (12, 14 & 15) Latino, Bridge and Probation 9,500 0 0Sutton Scholars Program 44,166 45,712 46,855Veteran's Resource Group 66,000 0 0Creation of Energy Research Cluster 175,916 175,916 175,916Creation of Veterans Reintegration Cluster 175,916 175,916 175,916Center for Academic Excellence Task Force 12,150 0 0Scholarship Initiative - IUP Grant 1,030,000 1,690,000 1,574,254Planned Periodic Maintenance/Investment in Plant 140,000 1,275,200 1,267,894Promote Community Interaction, Communication and Security 76,180 19,400 19,400Background Checks 0 300,000 150,000Scholarships - Tuition Pilot 0 0 1,235,776Academic Success Incentive - Tuition Pilot 0 0 1,250,000Military Resource Director 0 0 82,620Academic Success Center 0 0 160,000Technology For CHSS Building 0 0 100,000Stright Data Center Renovations 0 0 250,000EAB Membership 0 0 200,000University-Wide Emergency Management Preparedness 0 0 200,000Data Firewall 0 0 192,000University - Wide Emergency Communications - Blue Light Upgrade 0 0 300,000University - Wide Professional Development 0 0 75,000Maintenance Equipment Replacement 0 0 75,000Police Equipment/Ammunition/Vehicles 0 0 75,000Grant Street Park 0 500,000 0Admissions IT Systems for Ellucian Recruiter 0 96,564 32,470Royall Marketing Company 0 0 224,000
Total $2,616,728 $5,138,708 $9,111,517
Sources of Funds for Reinvestment:Additional Revenue - Tuition Pilot $0 $0 $2,485,776Educational and General Fund Realignments 1,425,998 2,087,544 2,594,910Carryover Unrestricted Net Assets 1,190,730 3,051,164 4,030,831
Total $2,616,728 $5,138,708 $9,111,517
This page provides information regarding the E&G budget realignment plans of each university, including objectives and how they will be achieved. It should reflect how the budget is being realigned with the university's strategic priorities--new investments vs. reduced emphasis.
Page 17
INDIANA UNIVERSITY OF PENNSYLVANIA
2016/2017 ACTION PLAN
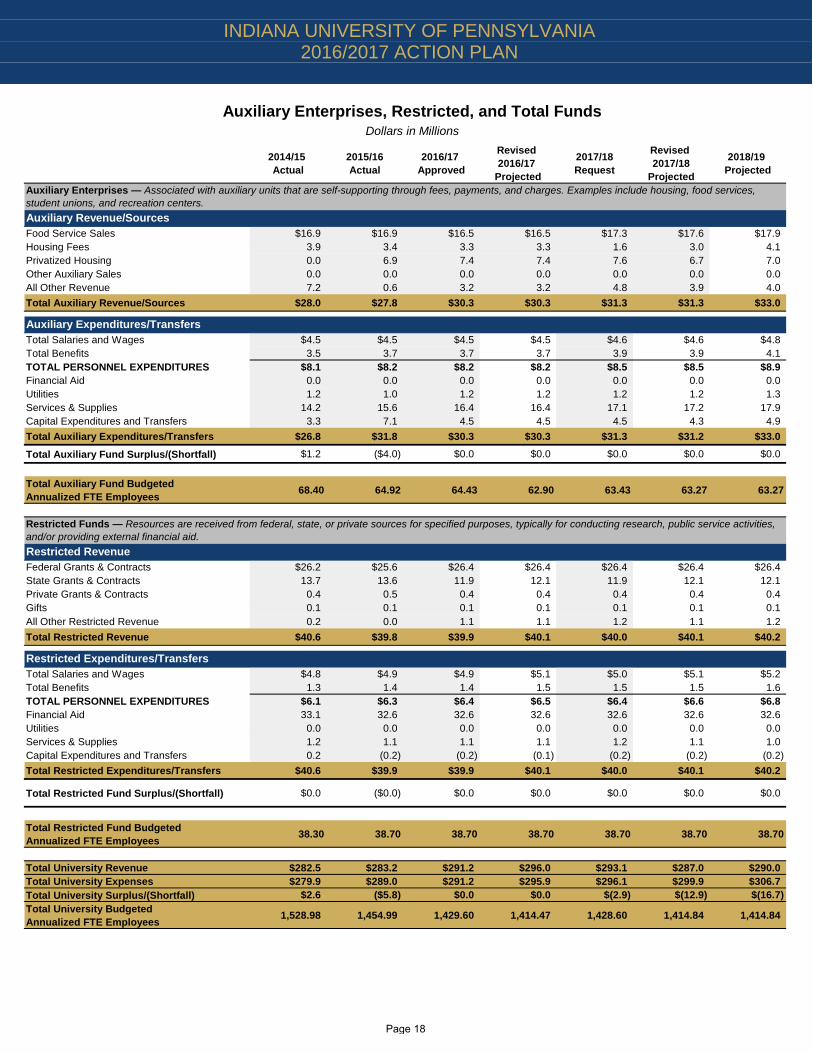
Auxiliary Enterprises, Restricted, and Total Funds
Dollars in Millions 2014/15
Actual2015/16Actual
2016/17 Approved
Revised 2016/17
Projected
2017/18Request
Revised 2017/18
Projected
2018/19 Projected
Food Service Sales $16.9 $16.9 $16.5 $16.5 $17.3 $17.6 $17.9Housing Fees 3.9 3.4 3.3 3.3 1.6 3.0 4.1Privatized Housing 0.0 6.9 7.4 7.4 7.6 6.7 7.0Other Auxiliary Sales 0.0 0.0 0.0 0.0 0.0 0.0 0.0All Other Revenue 7.2 0.6 3.2 3.2 4.8 3.9 4.0Total Auxiliary Revenue/Sources $28.0 $27.8 $30.3 $30.3 $31.3 $31.3 $33.0
Total Salaries and Wages $4.5 $4.5 $4.5 $4.5 $4.6 $4.6 $4.8Total Benefits 3.5 3.7 3.7 3.7 3.9 3.9 4.1TOTAL PERSONNEL EXPENDITURES $8.1 $8.2 $8.2 $8.2 $8.5 $8.5 $8.9Financial Aid 0.0 0.0 0.0 0.0 0.0 0.0 0.0Utilities 1.2 1.0 1.2 1.2 1.2 1.2 1.3Services & Supplies 14.2 15.6 16.4 16.4 17.1 17.2 17.9Capital Expenditures and Transfers 3.3 7.1 4.5 4.5 4.5 4.3 4.9Total Auxiliary Expenditures/Transfers $26.8 $31.8 $30.3 $30.3 $31.3 $31.2 $33.0
Total Auxiliary Fund Surplus/(Shortfall) $1.2 ($4.0) $0.0 $0.0 $0.0 $0.0 $0.0
Total Auxiliary Fund BudgetedAnnualized FTE Employees 68.40 64.92 64.43 62.90 63.43 63.27 63.27
Federal Grants & Contracts $26.2 $25.6 $26.4 $26.4 $26.4 $26.4 $26.4State Grants & Contracts 13.7 13.6 11.9 12.1 11.9 12.1 12.1Private Grants & Contracts 0.4 0.5 0.4 0.4 0.4 0.4 0.4Gifts 0.1 0.1 0.1 0.1 0.1 0.1 0.1All Other Restricted Revenue 0.2 0.0 1.1 1.1 1.2 1.1 1.2Total Restricted Revenue $40.6 $39.8 $39.9 $40.1 $40.0 $40.1 $40.2
Total Salaries and Wages $4.8 $4.9 $4.9 $5.1 $5.0 $5.1 $5.2Total Benefits 1.3 1.4 1.4 1.5 1.5 1.5 1.6TOTAL PERSONNEL EXPENDITURES $6.1 $6.3 $6.4 $6.5 $6.4 $6.6 $6.8Financial Aid 33.1 32.6 32.6 32.6 32.6 32.6 32.6Utilities 0.0 0.0 0.0 0.0 0.0 0.0 0.0Services & Supplies 1.2 1.1 1.1 1.1 1.2 1.1 1.0Capital Expenditures and Transfers 0.2 (0.2) (0.2) (0.1) (0.2) (0.2) (0.2)Total Restricted Expenditures/Transfers $40.6 $39.9 $39.9 $40.1 $40.0 $40.1 $40.2
Total Restricted Fund Surplus/(Shortfall) $0.0 ($0.0) $0.0 $0.0 $0.0 $0.0 $0.0
Total Restricted Fund BudgetedAnnualized FTE Employees 38.30 38.70 38.70 38.70 38.70 38.70 38.70
Total University Revenue $282.5 $283.2 $291.2 $296.0 $293.1 $287.0 $290.0Total University Expenses $279.9 $289.0 $291.2 $295.9 $296.1 $299.9 $306.7Total University Surplus/(Shortfall) $2.6 ($5.8) $0.0 $0.0 $(2.9) $(12.9) $(16.7)Total University BudgetedAnnualized FTE Employees 1,528.98 1,454.99 1,429.60 1,414.47 1,428.60 1,414.84 1,414.84
Restricted Revenue
Restricted Expenditures/Transfers
Auxiliary Revenue/Sources
Auxiliary Expenditures/Transfers
Auxiliary Enterprises — Associated with auxiliary units that are self-supporting through fees, payments, and charges. Examples include housing, food services, student unions, and recreation centers.
Restricted Funds — Resources are received from federal, state, or private sources for specified purposes, typically for conducting research, public service activities, and/or providing external financial aid.
Page 18

INDIANA UNIVERSITY OF PENNSYLVANIA
2016/2017 ACTION PLAN
Tuition and Fees
2014/15Actual
2015/16 Actual
2016/17Actual
2017/18 Request
In-State UndergraduateTuition $6,820 $7,060 N/A N/ATuition Pilot (per-credit tuition) N/A N/A 8,430 8,700Technology Tuition Fee 422 436 448 448University Mandatory Fees 2,228 2,440 2,489 2,654
Total Cost In-State Undergraduate Off Campus or At Home $9,470 $9,936 $11,367 $11,802 Most Common Room and Board Rates 11,346 11,730 12,246 12,328Total Cost In-State Undergraduate On Campus $20,816 $21,666 $23,613 $24,130
Out-of-State Undergraduate Tuition (Most Common) $11,594 $12,002 $12,306 $12,306Technology Tuition Fee 642 664 682 682University Mandatory Fees 3,273 3,521 3,598 3,763
Total Out-of-State Undergraduate Off Campus or At Home $15,509 $16,187 $16,586 $16,751 Most Common Room and Board Rates 11,346 11,730 12,246 12,328Total Cost Out-of-State Undergraduate On Campus $26,855 $27,917 $28,832 $29,079
Price to Most Common Student Living Off Campus or At HomeIn-State Undergraduate Off Campus or At Home
Tuition per Credit $284 $294 $281 $290Technology Tuition Fee Per Credit 18 19 19 19University Mandatory Fees Per Credit (on average) * 97 92 101 106
Total Cost Per Credit In-State Undergraduate Off Campus or At Home $399 $405 $401 $415
Out-of-State Undergraduate Off Campus or At HomeTuition per Credit (Most Common) $483 $500 $513 $513Technology Tuition Fee Per Credit 27 28 29 29University Mandatory Fees Per Credit (on average) ** 125 116 125 130
Total Cost Per Credit Out-of-State Undergraduate Off Campus or At Home $635 $644 $667 $672
Price to Most Common Graduate Student Living Off Campus or At HomeIn-State Graduate Student Living Off Campus or At Home
Tuition per Credit Minimum $454 $470 $483 $483 Maximum $499 $517 $531 $531 Most Common $454 $470 $483 $483Technology Tuition Fee Per Credit $24 $25 $26 $26University Mandatory Fees Per Credit (on average) - Masters*** $119 $129 $139 $144University Mandatory Fees Per Credit (on average) - Doctoral*** $143 $154 $165 $170
Out-of-State Graduate Student Living Off Campus or At HomeTuition per Credit Minimum $681 $705 $725 $725 Maximum $749 $776 $798 $798 Most Common $681 $705 $725 $725Technology Tuition Fee Per Credit $36 $37 $38 $38University Mandatory Fees Per Credit (on average) - Masters*** $155 $166 $177 $182University Mandatory Fees Per Credit (on average) - Doctoral*** $191 $203 $215 $220
* Based on FY2015/16 actual - 4.2 credits taken by in-state undergraduate students
** Based on FY2015/16 actual - 3.8 credits taken by out-of-state undergraduate students*** Based on FY2015/16 actual - both in-state and out-of-state graduate students take an average of 5.9 credits
Full Time Undergraduates (academic year only; 30 credits)
Part Time Undergraduates (per credit)
Graduate Students (per credit)
Page 19
INDIANA UNIVERSITY OF PENNSYLVANIA 2016/2017 ACTION PLAN
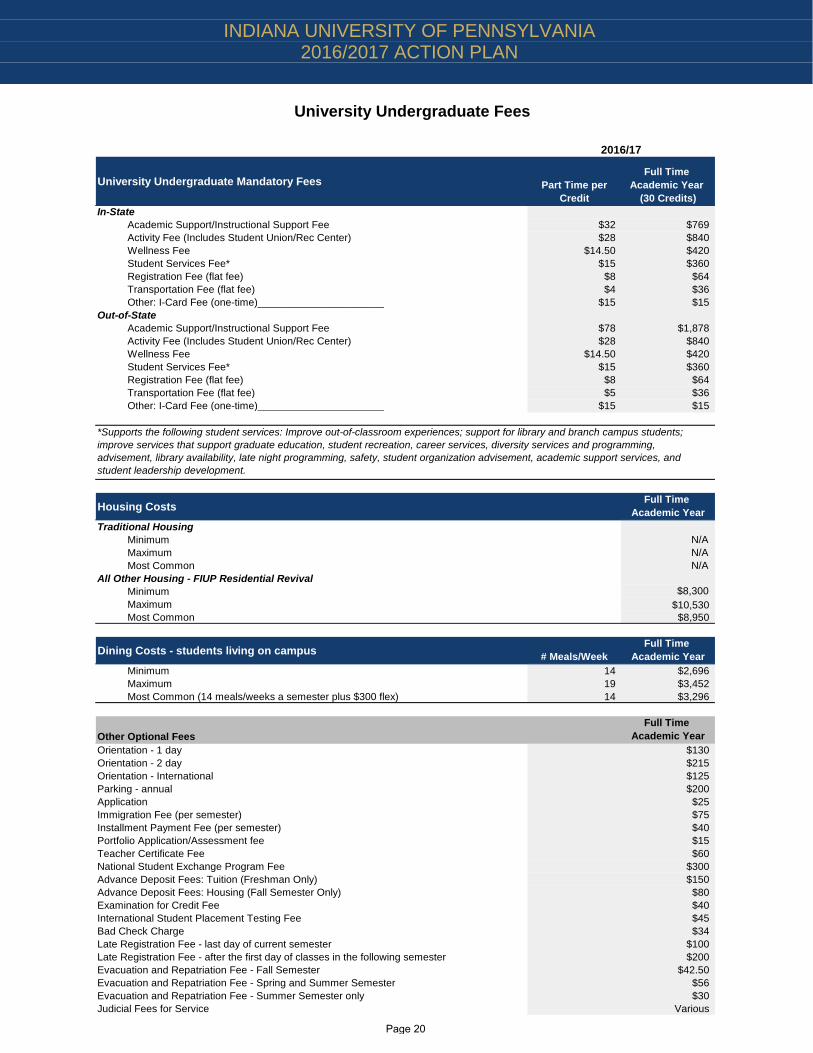
University Undergraduate Fees
University Undergraduate Mandatory Fees Part Time per Credit
Full Time Academic Year
(30 Credits)In-State
Academic Support/Instructional Support Fee $32 $769Activity Fee (Includes Student Union/Rec Center) $28 $840Wellness Fee $14.50 $420Student Services Fee* $15 $360Registration Fee (flat fee) $8 $64Transportation Fee (flat fee) $4 $36Other: I-Card Fee (one-time)______________________ $15 $15
Out-of-State Academic Support/Instructional Support Fee $78 $1,878Activity Fee (Includes Student Union/Rec Center) $28 $840Wellness Fee $14.50 $420Student Services Fee* $15 $360Registration Fee (flat fee) $8 $64Transportation Fee (flat fee) $5 $36Other: I-Card Fee (one-time)______________________ $15 $15
Housing Costs Full Time Academic Year
Traditional HousingMinimum N/A Maximum N/A Most Common N/A
All Other Housing - FIUP Residential RevivalMinimum $8,300Maximum $10,530Most Common $8,950
Dining Costs - students living on campus # Meals/WeekFull Time
Academic YearMinimum 14 $2,696Maximum 19 $3,452Most Common (14 meals/weeks a semester plus $300 flex) 14 $3,296
Other Optional FeesFull Time
Academic YearOrientation - 1 day $130Orientation - 2 day $215Orientation - International $125Parking - annual $200Application $25Immigration Fee (per semester) $75Installment Payment Fee (per semester) $40Portfolio Application/Assessment fee $15Teacher Certificate Fee $60National Student Exchange Program Fee $300Advance Deposit Fees: Tuition (Freshman Only) $150Advance Deposit Fees: Housing (Fall Semester Only) $80Examination for Credit Fee $40International Student Placement Testing Fee $45Bad Check Charge $34Late Registration Fee - last day of current semester $100Late Registration Fee - after the first day of classes in the following semester $200Evacuation and Repatriation Fee - Fall Semester $42.50Evacuation and Repatriation Fee - Spring and Summer Semester $56Evacuation and Repatriation Fee - Summer Semester only $30Judicial Fees for Service Various
2016/17
*Supports the following student services: Improve out-of-classroom experiences; support for library and branch campus students;improve services that support graduate education, student recreation, career services, diversity services and programming,advisement, library availability, late night programming, safety, student organization advisement, academic support services, andstudent leadership development.
Page 20

INDIANA UNIVERSITY OF PENNSYLVANIA 2016/2017 ACTION PLAN
Financial Aid: Gift Aid by Award Year
2012/13Actual
2013/14Actual
2014/15 Actual
2015/16Actual
2016/17Projected
Undergraduate Gift Aid Institutional Aid*
# of Students 1,373 1,334 1,591 1,806 4,572Average Award $4,048 $3,721 $3,608 $3,616 $2,054Total Dollars Awarded $5,557,910 $4,964,064 $5,740,755 $6,530,990 $9,393,069% of Undergraduate Students Receiving Aid 10% 10% 13% 15% 36%
Pennsylvania State Grants# of Students 4,587 4,329 4,245 4,076 3,715Average Award $2,555 $2,923 $2,745 $2,882 $2,924Total Dollars Awarded $11,719,430 $12,652,362 $11,651,270 $11,748,917 $10,863,563% of Undergraduate Students Receiving Aid 34% 33% 33% 34% 30%
Pell Grants# of Students 5,009 4,840 4,711 4,528 4,152Average Award $3,818 $3,953 $4,136 $4,152 $4,170Total Dollars Awarded $19,126,453 $19,132,277 $19,483,344 $18,802,477 $17,313,497% of Undergraduate Students Receiving Aid 37% 37% 37% 38% 33%
All Other Gift Aid**# of Students 3,247 3,083 3,289 3,506 3,529Average Award $1,805 $2,009 $2,123 $2,187 $2,297Total Dollars Awarded $5,860,076 $6,193,509 $6,981,997 $7,666,459 $8,105,349% of Undergraduate Students Receiving Aid 24% 24% 26% 29% 28%
Unduplicated Students Receiving Gift Aid# of Students 7,797 7,369 7,407 7,313 7,613Average Award $5,421 $5,827 $5,921 $6,119 $5,965Total Dollars Awarded $42,263,869 $42,942,212 $43,857,366 $44,748,843 $45,415,271% of Undergraduate Students Receiving Gift Aid 57% 56% 58% 61% 61%
Graduate Student AidGraduate Assistantship Stipends
# of Students 389 502 510 466 506Total Dollars Awarded $938,597 $2,387,977 $2,490,501 $2,353,099 $1,872,260% of Graduate Students Receiving Assistantships 15% 20% 20% 19% 16%
Graduate Tuition Waivers# of Students 467 478 479 437 506Total Dollars Awarded $2,924,510 $2,983,922 $3,105,407 $3,124,584 $3,267,126% of Graduate Students Receiving Waivers 19% 19% 19% 18% 16%
*Institutional Aid includes Board of Governors' waivers; tuition, room and board waivers; etc.
Notes: Number of students and aid awarded are for fall and spring semesters only. Data is only provided for students with an enrollment record during the fall or spring semester.
**All Other Gift Aid includes foundation scholarships, miscellaneous PHEAA grants, grants from other states, third party scholarships, etc.
Page 21

INDIANA UNIVERSITY OF PENNSYLVANIA 2016/2017 ACTION PLAN
Financial Aid: Loans, Cost of Attendance, Family Income
Loans2012/13Actual
2013/14Actual
2014/15Actual
2015/16Actual
2016/17 Projected
Undergraduate Loans (all known)# of Students 10,166 9,677 9,448 8,916 8,156Average Loan $8,575 $8,727 $8,916 $8,969 $9,360Total Dollars Loaned $87,174,616 $84,449,687 $84,235,826 $79,964,902 $76,339,356% of Undergraduate Students Receiving Loans 74% 74% 74% 74% 65%
Graduate Loans (all known)# of Students 1,160 1,099 1,061 976 943Average Loan $15,818 $15,377 $15,741 $15,658 $15,893Total Dollars Loaned $18,348,652 $16,899,074 $16,700,972 $15,282,255 $14,987,178% of Graduate Students Receiving Loans 46% 44% 43% 40% 35%
Student Debt Summary2011/12 Actual
2012/13Actual
2013/14Actual
2014/15Actual
2015/16 Projected
Bachelor's Degree RecipientsPercent of Recipients with Debt 83% 85% 82% 82% 83%Average Amount of Debt (of those graduating with debt) $35,229 $37,457 $33,807 $36,514 $37,418
All Students (undergraduate and graduate)Student Loan Default Rate, 3 year 8.4% 8.8% 8.8% 7.7% 7.3%
Note: Default rates are for students that defaulted on their Federal Stafford and Direct student loans in 2010-2012, 2011-2013, 2012-2014, and 2013-2015
Tuition and Mandatory Fees
Room and Board
Books and Supplies
Transportation, Personal, Other
ExpensesTotal
$9,936 $11,560 $1,100 $2,150 $24,746$9,936 $2,565 $1,100 $3,045 $16,646
$21,835 $11,560 $1,100 $2,451 $36,946$21,835 $2,565 $1,100 $0 $25,500
Note: Costs are based on financial aid packaging costs, not most common
Family Income Groups Headcount Average Net
Cost of Attendance
Average Net Cost Tuition
and Fees
Average Gift Aid Amount
Average Loan Amount
Below $30,000 1,734 $15,316 $(98) $9,777 $8,469$30,001 - $48,000 931 $15,949 $657 $9,064 $7,945$48,001 - $75,000 1,211 $19,486 $4,163 $5,531 $9,475$75,001 - $110,000 1,505 $21,209 $6,042 $3,690 $10,721$110,001 and Above 1,966 $21,275 $5,752 $3,955 $10,030
Comments:Commitment to Access:
Out-of-State Undergraduate Off Campus, Living at Home
FY 2015/16 Estimated Net Cost by Family IncomePA Resident Undergraduates Enrolled Full Time in the Fall and Spring who Filed a FAFSA
Notes: Only includes students who completed a FAFSA. Family Income Groups are based on the Total Family Income (including untaxed income) as reported on student FAFSA records. Average Gift Aid includes all grants and scholarships from Federal, State, University, and other private sources administered by the Financial Aid Office. Student waivers are also included in the Gift Aid amount. Net Cost of Attendance is the actual average of the total Costs of Attendance (which will vary by income group due to the diversity of students living on- and off- campus) minus the average Gift Aid amount. Net Tuition & Mandatory Fees is the actual average of the total costs of tuition and fees (which will vary by income group due to the amount of credit hours students are enrolled) minus the average Gift Aid amount (see page University Undergraduate Fees for list of fees that are included). Average Loan Amount includes Federal (Perkins, Stafford, Ford Direct) and all private student loans known to the university. The bottom-line Average represents the average of all full-time undergraduate Pennsylvania residents. Tuition and Mandatory Fees include all reported mandatory fees and tech fee. Full-time students are considered those with 12 or more attempted credits in both Fall and Spring semesters. Estimated Net Cost by Family Income data excludes clock hour students.
FY 2015/16 Cost of Attendance(Academic Year)In-State Undergraduate On CampusIn-State Undergraduate Off Campus, Living at HomeOut-of-State Undergraduate On Campus
Page 22

INDIANA UNIVERSITY OF PENNSYLVANIA 2016/2017 ACTION PLAN
Pricing Flexibility Pilot for Per-Credit Tuition
Pilot/Title:
Brief Synopsis of Pilot, as Approved by Board of Governors:
Changes Made to Pilot since its Approval and/or Future Expectations for Pilot:
Difference
Assessment Criteria:Base Year:
Fall 2015Current Year:
Fall 2016Fall 2016 –Base Year
Cohort Access4,117.00 3,704.00 (413.00)
Percent Pell Recipients 39.5% 38.4%14.49 14.30 (0.19)
2,085.00 1,961.00 (124.00)Percent Nonmajority 20.0% 20.5%
14.42 14.13 (0.29)5,666.00 5,317.00 (349.00)
Percent of Total 54.4% 55.1%13.96 13.81 (0.15)
Average Student Credit Hours Taken (12+ credits) 14.81 14.67 (0.14)Average Student Credit Hours Taken (all undergraduates) 14.12 13.97 (0.15)Comparison of Breakdown of Number of Credits Taken by Students (additional data may be attached):
4,257.00 3,936.00 (321.00)
1,761.00 1,475.00 (286.00)
N/A 424.00 N/A2,062.00 4,521.00 2,459.00
$3,009 $1,181 ($1,828)
Headcount FAFSA Filers 8,635.00 8,377.00 (258.00)$6,132,854 $5,932,758 ($200,096)
Cohort Enrollment (In-state Undergraduates)9,841.52 8,903.65 (937.87)
10,414.00 9,653.00 (761.00)Annualized FTE Students 10,139.00 9,316.28 (822.72)
Annual Revenue Associated with Cohort2015/16Annual
2016/17Annual
$73,687,884 $77,672,282 $3,984,39827,698,020 27,838,565 140,545
Auxiliary Fee Revenue 42,947,109 41,458,584 (1,488,525)(6,133,104) (6,952,033) (818,929)
$138,199,909 $140,017,398 $1,817,489$2,162,624
Headcount Majority Students/NonPell
Headcount Pell Recipients
Average Number of Credit Hours EnrolledHeadcount Nonmajority Students
Average Number of Credit Hours Enrolled
Charge tuition on a per-credit basis to all in-state undergraduate students. The University will phase in this program over three years, charging 93% of the System's per-credit tuition rate in year 1, 96% of the System's per-credit tuition rate in year 2, 99% of the System's per-credit tuition rate in year 3 and the System's per-credit tuition rate in year 4. The University will assess the program annually and may make appropriate adjustments to this plan. A scholarship pool associated with the university's Academic Success Initiative (ASI) will offer financial incentive to academically successful in-state undergraduate students for the equivalent of up to a two-credit-hour merit award in an academic year. The pool will be funded at $1.25 million and will increase annually as tuition increases. Effective fall 2015 through summer 2018.
Implementation of the pilot was deferred to fall 2016 through summer 2019.
IN01 – Per-Credit Tuition
Fall FTE Students
Observations:
Fall Headcount Students
Average Number of Credit Hours Enrolled
Number of Students Taking More Than 13 Credits Who Filed a FAFSA and Had Unmet NeedNumber of Students Taking More Than 15 Credits Who Filed a FAFSA and Had Unmet Need
Total Institutional Aid Awarded
Number of Students Offered Institutional AidAverage Institutional Aid Award
Other:
Number of Students Registered For More Credits Than They Had at End of Drop/Add Period
The first year of IUP's per-credit tuition pilot for resident undergraduate students yielded credit hours as expected. There was no drastic change in the student registration behavior.
Tuition RevenueE&G Fee Revenue
Institutional Financial Aid (negative number)Net RevenueRevenue Increase due to Normal Rate Changes
Page 23

Page 24