INDIANA DEPARTMENT OF TRANSPORTATION …PCCP -- Core Thickness. The station at which a core is taken...
20
Revised 5/9/2019 1 of 20 INDIANA DEPARTMENT OF TRANSPORTATION OFFICE OF MATERIALS MANAGEMENT RANDOM SAMPLING ITM No. 802-19 1.0 SCOPE. 1.1 This procedure is used to determine the random unit, random quantity, or random location for sampling of construction materials. Use of this method is intended to minimize any bias on the part of the person taking the sample. 1.2 This ITM may involve hazardous materials, operations, and equipment and may not address all of the safety problems associated with the use of the test method. The user of the ITM is responsible for establishing appropriate safety and health practices and to determining the applicability of regulatory limitations prior to use. 2.0 TERMINOLOGY. Definitions for terms and abbreviations shall be in accordance with the Department’s Standard Specifications, Section 101 and ASTM D 16. 3.0 SIGNIFICANCE AND USE. This ITM is used to determine the unit, quantity, or location of the material to be sampled for acceptance in accordance with the Standard Specifications. 4.0 RANDOM NUMBERS. 4.1 The Random Number Tables consist of a list of numbers in blocks which may be used in the random selection process. Random numbers generated by software may be used in place of the Random Number Tables. 4.2 To use a Random Number Table select one block in the table without looking. 4.3 After selecting the block, the top left number in the block is the first random number used. If a pair of random numbers is needed, the adjacent number within the block is used. 4.4 Proceed down the vertical column for additional numbers and proceed to the top of the adjacent column to the right, if available, when the bottom of the column is reached. When the bottom of the last column on the right is reached, proceed to the top of the column of the first column on the left in the table.
Transcript of INDIANA DEPARTMENT OF TRANSPORTATION …PCCP -- Core Thickness. The station at which a core is taken...

Revised 5/9/2019
1 of 20
INDIANA DEPARTMENT OF TRANSPORTATION OFFICE OF MATERIALS MANAGEMENT
RANDOM SAMPLING
ITM No. 802-19 1.0 SCOPE.
1.1 This procedure is used to determine the random unit, random quantity, or random location for sampling of construction materials. Use of this method is intended to minimize any bias on the part of the person taking the sample.
1.2 This ITM may involve hazardous materials, operations, and equipment and may
not address all of the safety problems associated with the use of the test method. The user of the ITM is responsible for establishing appropriate safety and health practices and to determining the applicability of regulatory limitations prior to use.
2.0 TERMINOLOGY. Definitions for terms and abbreviations shall be in accordance with
the Department’s Standard Specifications, Section 101 and ASTM D 16. 3.0 SIGNIFICANCE AND USE. This ITM is used to determine the unit, quantity, or
location of the material to be sampled for acceptance in accordance with the Standard Specifications.
4.0 RANDOM NUMBERS.
4.1 The Random Number Tables consist of a list of numbers in blocks which may be used in the random selection process. Random numbers generated by software may be used in place of the Random Number Tables.
4.2 To use a Random Number Table select one block in the table without looking.
4.3 After selecting the block, the top left number in the block is the first random
number used. If a pair of random numbers is needed, the adjacent number within the block is used.
4.4 Proceed down the vertical column for additional numbers and proceed to the top
of the adjacent column to the right, if available, when the bottom of the column is reached. When the bottom of the last column on the right is reached, proceed to the top of the column of the first column on the left in the table.

ITM 802-19 Revised 5/9/2019
2 of 20
If a pair of numbers is needed, proceed down the vertical column by pairs for additional numbers, and proceed to the adjacent top block to the right, if available. When the bottom pair of numbers on the right is reached, proceed to the top block on the left in the table.
4.5 If each number or pair of numbers in the table is used for the random selection
process, select a new starting block in accordance with 3.3 and repeat the procedure.
4.6 If the random location results in a location that a sample is not allowed, then the
random number shall be discarded and the next random number in sequence will be used, unless otherwise indicated.
5.0 PROCEDURE.
5.1 Random Unit.
5.1.1 Identify the number of units from which a random unit is required and label these units numerically beginning with 1 and increasing until all the units have a different number.
5.1.2 Select a random number in accordance with 4.0.
5.1.3 Multiply the number of units by the random number.
5.1.4 Round up the resulting number to the next whole number to determine the
random unit.
Example: Number of Samples = 4 Random Number = 0.698 Random Sample = 4 x 0.698 = 2.792 (Round up to 3)
5.2 Random Quantity.
5.2.1 Identify the quantity from which a random quantity is required.
5.2.2 Select a random number in accordance with 4.0.
5.2.3 Multiply the quantity by the random number.
5.2.4 The resulting number is the random quantity to be sampled.
5.2.5 The sample is obtained from the truck containing the random quantity.
ITM 802-19 Revised 5/9/2019
3 of 20
Example: Sublot Size = 380 t of HMA Random Number = 0.871 Random Quantity = 380 x 0.871 = 331 t
Sample HMA from the truck containing ton number 331
5.3 Random Location per Length.
5.3.1 Identify the length from which a random location is required.
5.3.2 Select a random number in accordance with 4.0
5.3.3 Multiply the length by the random number.
5.3.4 The resulting number is the random distance.
5.3.5 Add the random distance to the beginning of the length to determine the random location.
5.4 Random Location per Area.
5.4.1 Identify the area from which a random location is required.
5.4.2 Select a pair of random numbers in accordance with 4.0. Use the first
number for the longitudinal location and the second number for the transverse location.
5.4.3 Determine the longitudinal length in accordance with 4.3
5.4.4 Multiply the transverse width by the random number.
5.4.5 The resulting numbers represent the random location.
HMA -- Plate Samples.
The random location of a plate sample is determined from a random quantity, random longitudinal distance, and transverse distance as follows:
1. A random quantity is determined in accordance with 5.2.
2. The random longitudinal distance is determined from the length the
mixture is placed by the truck containing the random quantity. The starting station for the longitudinal distance is the location of the paver where the truck begins to unload the mixture into the paver or material transfer device. Computations are made to the nearest 1 ft.

ITM 802-19 Revised 5/9/2019
4 of 20
3. The random transverse distance is determined using the width of the
course being placed. Computations are made to the nearest 1 ft. The distance is measured from the right edge of the course determined by looking in the direction of increasing station numbers. If the width of the course is 4 ft or less, the sample plate will be placed in the center of the course.
Plate samples will not be taken at the following locations and contract requirements:
1. Less than 1 ft from the edge of the course
2. A course thickness less than 2.0 times the maximum particle size except
4.75 mm mixtures shall be at least 1.5 times but not more than 3 times the maximum particle size
3. Original pay item quantities less than 300 t (Does not apply to SMA)
4. Areas placed with wideners, or specialty equipment approved by the
Engineer. If the random location falls within an area placed by this equipment, another randomly selected location is determined. If the entire sublot falls within an area placed by this equipment, the previous sublot is used for acceptance. If the previous sublot is not available, the subsequent sublot will be used for acceptance.
When additional plate samples are required for gyratory specimens and backup samples, the following procedure is used:
1. The first plate location is determined using the procedure for HMA plate
samples. This sample is used for the MSG and binder content determination. This plate sample will be designated A1.
2. The second plate is placed longitudinally 2 ft ahead station from the first
plate at the same transverse offset. This sample is used for the gyratory specimens. This plate sample will be designated A2.
3. The third plate is placed longitudinally 2 ft ahead station from the second
plate at the same transverse offset. This sample is used to determine the aggregate bulk specific gravity within the mixture. This plate sample will be designated A3.

ITM 802-19 Revised 5/9/2019
5 of 20
4. The backup sample plate for the MSG and binder content is placed
transversely 2 ft from the first plate towards the center of the mat. If the width of the course is 4 ft or less, the sample plate will be placed 2 ft back station from the first plate in the center of the course. This plate sample will be designated B1.
5. The backup sample plate for the gyratory specimens is placed transversely 2 ft from the second plate toward the center of the mat.
The following diagram shows an example of the arrangement of the plate samples when additional samples are required and backup samples are taken transversely from the first and second sample locations:
Example No. 1:
A 25.0 mm base mixture is being placed at 250 lb/yd² for a width of 12 ft. The truck contains 20 t of mixture. The station of the paver when the truck begins unloading is 105+00.
Sublot Size = 1000 t Random Number = 0.613 Random Quantity = 1000 x 0.613 = 613
18000 x ft , x Widthlb/yd Quantity, Planned Avg.
t Weight,Load Load ofLength 2
=
ft 120 18000 x 12 x 250
20 ==
Increasing Station
2 ft
2 ft
B2
B1 A1
A2
A3
2 ft
Random Location MSG and Binder Content Sample

ITM 802-19 Revised 5/9/2019
6 of 20
Random Numbers = 0.428, 0.417 Longitudinal Distance = 120 x 0.428 = 51 ft Random Location = 105+00 + 51 = 105+51 Transverse Distance = 12 x 0.417 = 5 ft
If additional samples are required, the following locations are determined:
Gyratory Specimen Sample: Random Location = 105+51 + 02 = 105+53 (nearest foot) Transverse Distance = 5 ft Aggregate Bulk Specific Gravity Sample: Random Location = 105+53 + 02 = 105+55 (nearest foot) Transverse Distance = 5 ft Backup Sample for MSG and Binder Content: Random Location = 105+51 Transverse Distance = 5 + 2 = 7 ft Backup Sample for Gyratory Specimen: Random Location = 105 + 51 + 02 = 105+53 (nearest foot) Transverse Distance` = 5 + 2 =7 ft
HMA -- Density Using Cores.
The station at which a core is taken is determined using the length of pavement needed for a sublot of HMA. The transverse distance is determined using the width of the course being placed and is measured from the right edge of the course determined by looking in the direction of increasing station numbers. Computations for the longitudinal distance are made to the nearest 1 ft and computations for the transverse distance are made to the nearest 0.1 ft. Cores will not be taken at the following locations and contract requirements:
1. Less than 3 in. from a confined edge of the course being placed
2. Less than 6 in. from a non-confined edge of the course being placed
3. A course thickness less than 2.0 times the maximum particle size
4. Areas placed with wideners, or specialty equipment approved by the
Engineer. If the random location falls within an area placed by this equipment, another randomly selected location is determined. If the entire sublot falls within an area placed by this equipment, the previous sublot is used for acceptance. If the previous sublot is not available, the subsequent sublot will be used for acceptance.
5. Original pay item quantities less than 300 t

ITM 802-19 Revised 5/9/2019
7 of 20
Example:
A 19.0 mm intermediate mixture is being placed at 165 lb/yd² for a width of 12 ft. The starting station of the sublot is 158+00. The sublot size is 1000 t.
18000 x ft , x Widthlb/yd Quantity, Planned Avg.
tSize,Sublot Sublot ofLength 2=
ft 9090 18000 x 12 x 165
1000 ==
Random Numbers = 0.256, 0.561 Longitudinal Distance = 9090 x 0.256 = 2327 ft Random Station = (158+00) + (23+27) = 181+27 Transverse Distance = 12 x 0.561 = 6.7 ft (Say 7 ft)
PCCP -- Core Thickness.
The station at which a core is taken is determined using the length of pavement needed for the sublot of PCCP. The transverse distance is determined using the width of pavement being placed, and is measured from the right edge of the lane determined by looking in the direction of increasing station numbers. Computations for the longitudinal distance are made to the nearest 1 ft and computations for the transverse distance are made to the nearest 1 ft. Cores will not be taken at the following locations:
1. Less than 2 ft from a D-1 contraction joint;
2. Less than 3 in. from the longitudinal joint; or
3. Less than 5 ft from a transverse construction joint. 4. Less than 6 in. from edge of pavement
If a core location is less than 2 ft from a D-1 contraction joint, a new location will be determined by subtracting or adding 2 feet from the random station. If a core location is less than 3 in. from a longitudinal joint, a new location will be determined by subtracting or adding 3 inches from the random transverse distance. If a core location is less than 5 ft from a transverse construction joint, a new location will be determined by subtracting or adding 5 ft from the random station. If a core location is less than 6 in. from the edge of pavement, a new location will be determined by subtracting or adding 6 in. from the random transverse distance. If a core location is over a dowel bar, a new location will be determined by subtracting or adding 3 ft from the random station.

ITM 802-19 Revised 5/9/2019
8 of 20
Example:
A PCCP is being placed at a width of 12 ft and the starting station of the sublot is 75+00. The sublot size is 2400 yd2.
2
22
yd 1ft 9 x
ftnearest Width,yd Size,Sublot Sublot ofLength =
ft 1800 9 x 12
2400==
Random Numbers = 0.935, 0.114 Longitudinal Distance = 1800 x 0.935 = 1683 ft Random Station = (75+00) + (16+83) = 91+83 Transverse Distance = 12 x 0.114 = 1.4 ft (Say 1 ft)
(Too close to edge of pavement) = 1 + 2 = 3 ft Retroreflective Pavement Markings The random location to measure the retro-reflectivity of a pavement marking on a longitudinal line is determined by selecting a random sampling zone within the segment as follows:
Random Segment
1. The section is the number of miles to the nearest 0.1 mi of each color of pavement marking application completed in a single day.
2. Divide the section by three to determine the length of the segments to the nearest
0.1 mi.
Random Sampling Zone
1. Select three random numbers in accordance with 4.0.
2. For the first segment, multiply the first random number by the length of the segment and round to the nearest 0.1 mi. Add this length to the Reference Post (RP) at the beginning of the segment. This number is the beginning of the sampling zone. Repeat this procedure for the second and third segments using the second and third random numbers respectively.
3. The first measurement is taken at the beginning of the sampling zone and all
subsequent measurements are taken at approximately 15 ft intervals.

ITM 802-19 Revised 5/9/2019
9 of 20
Example:
The total length of one color of pavement markings on a longitudinal line placed in one day is 30 mi.
Segment Locations
Section Size = 30 mi Segment Size = 30/3= 10 mi Segment Locations 0 – 10 mi, 10 – 20 mi, 20 – 30 mi
Random Sampling Zone
Random Numbers 0.063, 0.566, 0.968 Segment No. 1 0 – 10 mi): 10 mi x 0.063 = 0.6
0 + 4 0.6 = 0.6 mi (starting location for the first sampling zone is RP 0.6)
Segment No. 2 (10– 20 mi): 10 mi x 0.566 = 5.7 10 + 5.7 = 15.7 mi (starting location for the second
sampling zone is RP 15.7)
Segment No. 3 (20 - 30 mi): 10 mi x 0.968 = 9.7 20 + 9.7 = 29.7 mi (starting location for the third
sampling zone is RP 29.7) The following diagram indicates the start of the random sampling zones:
RP 10 RP 20 RP 30
Start of random sampling
RP 29.7 mi RP 15.7mi RP 0.6 mi
RP 0

ITM 802-19 Revised 5/9/2019
10 of 20
Additional requirements for the sampling locations are as follows:
1. The length required for measurements of skip lines and the combination of skip and solid lines is 290 ft, which is obtained from 10 ft line segments and 30 ft gaps between skip lines. The 105 ft length for double solid lines is obtained by taking 8 measurements on the line spaced at 15 ft intervals. If there is insufficient length in the sampling zone within the segment to obtain the required number of sampling locations, the additional sampling locations will be obtained backward from the beginning of the sampling zone. All retro-reflectivity measurements are made in the direction of the traffic flow, except for only skip lines with two-way traffic.
2. If any portion of the sampling zone is unsafe for taking measurements, the beginning of
the sampling zone is moved forward to the first point which may be inspected safely. Sampling zones are not moved for convenience.
3. If a valid measurement is not attainable at a location within the sampling zone due to a
pothole, grass, obvious tracking, etc., the sampling location is moved forward in the sampling zone to the first available location for a valid measurement. Subsequent measurements are obtained at the calculated random locations.
4. When a sampling zone contains only skip lines, each skip line is measured at two evenly
spaced locations on the line. For two-way traffic, one measurement on each line is taken in one direction and the other measurement on the same line is taken in the opposite direction. This procedure is continued until 16 measurements are obtained as indicated in the following diagram:
5. When a sampling zone contains a skip line and a solid line, each skip line is measured once and the measurement on the solid line is obtained at the same station. Measurements

ITM 802-19 Revised 5/9/2019
11 of 20
are taken in the direction of the traffic flow for each line. This procedure is continued until 16 measurements are obtained as indicated in the following diagrams:
6. When a sampling zone contains two solid lines, measurements are taken alternately on each solid line at the same station and at 15 ft intervals in the direction of the traffic flow for each line. This procedure is continued until 16 measurements are obtained as indicated in the following diagram:
7. For two lane highways, measurements are taken separately for each edge line as indicated in the following diagram:

ITM 802-19 Revised 5/9/2019
12 of 20
8. For multilane highways, divided or undivided, the lane line and white edge line measurements may be combined to reach 16 measurements for each direction of traffic, provided the markings were applied on the same day, as indicated in the following diagram:
Soil Embankment – DCP/LWD Measurements
The testing frequency for Light Weight Deflectometer (LWD) or Dynamic Cone Penetrometer (DCP) testing is based on the volume of material placed. The volume of material for a given lift thickness is converted to an area and the area is converted to a length and width based on the geometry of the lift to be tested. The station at which a LWD or DCP test is taken is determined using the length of embankment construction area. Three LWD tests will be taken at the random station at 2 ft from each edge of the construction area and at 1/2 of the width of the construction area. One DCP test will be obtained at the random station. The transverse distance for the DCP test is determined using the width of the embankment being placed and is measured from the right edge of the construction area determined by looking in the direction of increasing station numbers. Computations for the longitudinal distance and transverse distance are made to the nearest 1 ft.
DCP Example:
The construction area for a soil embankment 6 in. lift is determined to start at station 10+00 and the width of the construction area is 38 ft. The frequency of testing is one test for each 1400 yd3.
Convert 1400 yd3 to the length of embankment placed:
ft 1989 ft 1in. 12 x
in. 61 x
ft 381 x
yd 1ft 27 x yd 1400 3
33 =
Random Numbers = 0.420, 0.607 Longitudinal Distance = 1989 x 0.420 = 835 4 ft (Say 835 ft)

ITM 802-19 Revised 5/9/2019
13 of 20
Random Station = (10+00) + (8+35) = 18+35 Transverse Distance = 38 x 0.607 = 23.1 ft (Say 23 ft)
5.5 Random Target Area.
5.5.1 Determine the area from which a random location is required to the nearest
1 yd2
5.5.2 Divide the area by 100 and round down to the nearest whole number. The resulting number will be the number of segments within the area that are available for sampling.
5.5.3 Divide the area by the number of sample segments to determine the
sample segment size to the nearest 1 yd2
5.5.4 Select a random number in accordance with 4.0
5.5.5 Multiply the number of sample segments by the random number and round down to the nearest whole number. The resulting number represents the random target area. The sample will be taken from material placed within the random target area.
5.5.6 Divide the sample segment size by the width of the area and round to the
nearest 0.1 ft length. The resulting number is the length of the random target area.
5.5.7 Multiply the random target area by the length of the random target area
and round to the nearest whole foot. The resulting number will be the distance to the beginning of the random target area as measured from the start of the area to be sampled.

ITM 802-19 Revised 5/9/2019
14 of 20
Portland Cement Concrete Pavement (PCCP) -- Plastic Concrete Samples.
The location of the random target area is determined for each sublot. The PCCP sample is taken from material placed within the random target area.
Example No. 1:
A PCCP is being placed at a width of 12 ft and the starting station of the sublot is 102+50. The sublot size is 2400 yd2.
241002400 Segments Sample ofNumber ==
2yd 10024
2400 SizeSegment Sample ==
Random Number = 0.830 Random Target Area = 24 x 0.830 = 19.9 (round down to 19)
2
22
yd 1ft 9 x
ft 0.1nearest Width,yd Size,Segment Sample AreaTarget Random ofLength =
ft 75 9 x 12
100==
Distance to the beginning of the Random Target Area = 19 x 75 = 1425 ft
Example No. 2:
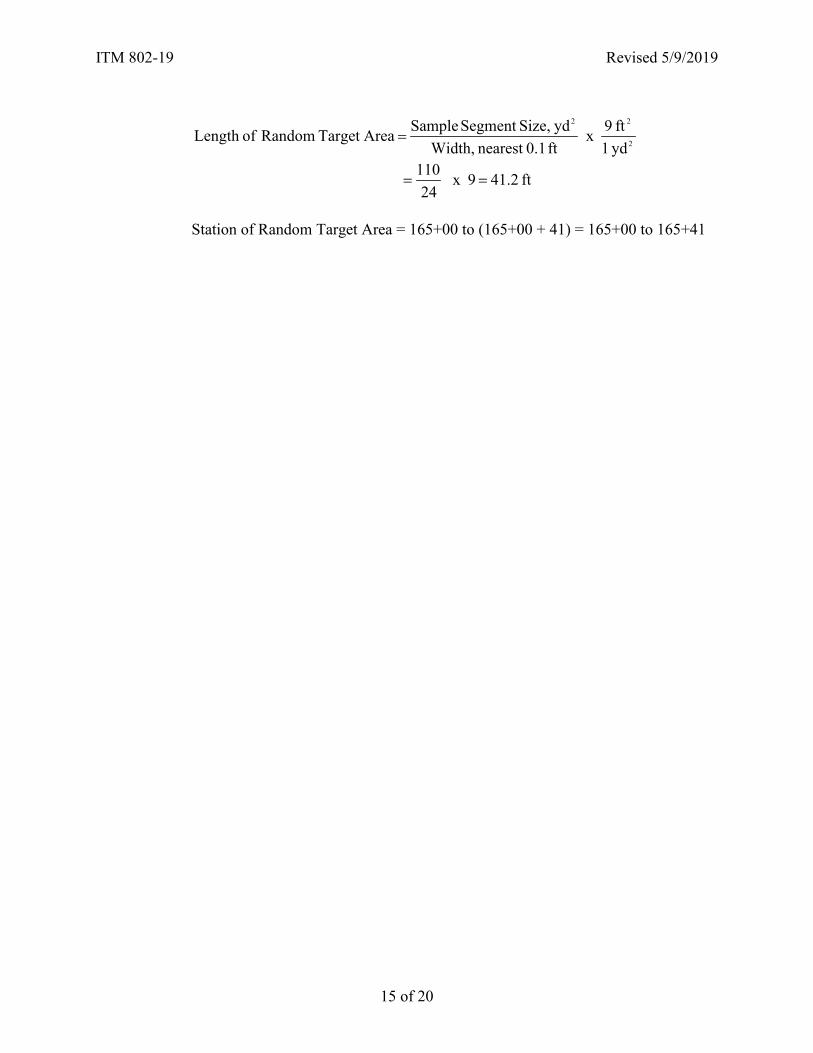
A PCCP is being placed at a width of 24 ft and the starting station of the sublot is 165+00. The sublot size is 550 yd2.
). 5 down to (round 55100550 Segments Sample ofNumber ==
2yd 110
5550 SizeSegment Sample == Random Number = 0.361
Random Target Area = 5 x 0.361 = 1.8 (round down to 1)
ITM 802-19 Revised 5/9/2019
15 of 20
2
22
yd 1ft 9 x
ft 0.1nearest Width,yd Size,Segment Sample AreaTarget Random ofLength =
ft 41.2 9 x 24
110==
Station of Random Target Area = 165+00 to (165+00 + 41) = 165+00 to 165+41

ITM 802-19 Appendix A Revised 2/7/19
16 of 20
RANDOM NUMBER TABLE
0.576 0.730 0.430 0.754 0.271 0.870 0.732 0.721 0.998 0.239 0.892 0.948 0.858 0.025 0.935 0.114 0.153 0.508 0.749 0.291 0.669 0.726 0.501 0.402 0.231 0.505 0.009 0.420 0.517 0.858 0.609 0.482 0.809 0.140 0.396 0.025 0.937 0.310 0.253 0.761 0.971 0.824 0.902 0.470 0.997 0.392 0.892 0.957 0.040 0.463 0.053 0.899 0.554 0.627 0.427 0.760 0.470 0.040 0.904 0.993 0.810 0.159 0.225 0.163 0.549 0.405 0.285 0.542 0.231 0.919 0.081 0.277 0.035 0.039 0.860 0.507 0.081 0.538 0.986 0.501 0.982 0.468 0.334 0.921 0.690 0.806 0.879 0.414 0.106 0.031 0.095 0.801 0.576 0.417 0.251 0.884 0.522 0.235 0.389 0.222 0.509 0.025 0.794 0.850 0.917 0.887 0.751 0.608 0.698 0.683 0.371 0.059 0.164 0.838 0.289 0.169 0.569 0.977 0.796 0.996 0.165 0.996 0.356 0.375 0.654 0.979 0.815 0.592 0.348 0.743 0.477 0.535 0.137 0.155 0.767 0.187 0.579 0.787 0.358 0.595 0.788 0.101 0.434 0.638 0.021 0.894 0.324 0.871 0.698 0.539 0.566 0.815 0.622 0.548 0.947 0.169 0.817 0.472 0.864 0.466 0.901 0.342 0.873 0.964 0.942 0.985 0.123 0.086 0.335 0.212 0.470 0.682 0.412 0.064 0.150 0.962 0.925 0.355 0.909 0.019 0.068 0.242 0.777 0.356 0.195 0.313 0.396 0.460 0.740 0.247 0.874 0.420 0.127 0.284 0.448 0.215 0.833 0.652 0.701 0.326 0.897 0.877 0.209 0.862 0.428 0.117 0.100 0.259 0.425 0.284 0.876 0.969 0.109 0.843 0.759 0.239 0.890 0.317 0.428 0.802 0.190 0.696 0.757 0.283 0.777 0.491 0.523 0.665 0.919 0.246 0.341 0.688 0.587 0.908 0.865 0.333 0.928 0.404 0.892 0.696 0.846 0.355 0.831 0.218 0.945 0.364 0.673 0.305 0.195 0.887 0.882 0.227 0.552 0.077 0.454 0.731 0.716 0.265 0.058 0.075 0.464 0.658 0.629 0.269 0.069 0.998 0.917 0.217 0.220 0.659 0.123 0.791 0.503 0.447 0.659 0.463 0.994 0.307 0.631 0.422 0.116 0.120 0.721 0.137 0.263 0.176 0.798 0.879 0.432 0.391 0.836 0.206 0.914 0.574 0.870 0.390 0.104 0.755 0.082 0.939 0.636 0.195 0.614 0.486 0.629 0.663 0.619 0.007 0.296 0.456 0.630 0.673 0.665 0.666 0.399 0.592 0.441 0.649 0.270 0.612 0.804 0.112 0.331 0.606 0.551 0.928 0.830 0.841 0.702 0.183 0.360 0.193 0.181 0.399 0.564 0.772 0.890 0.062 0.919 0.875 0.183 0.651 0.157 0.150 0.800 0.875 0.205 0.446 0.648 0.685

ITM 802-19 Appendix A Revised 2/7/19
17 of 20
RANDOM NUMBER TABLE
0.206 0.455 0.609 0.131 0.382 0.576 0.589 0.985 0.587 0.410 0.352 0.463 0.735 0.539 0.683 0.419 0.464 0.190 0.014 0.197 0.807 0.721 0.889 0.228 0.889 0.553 0.475 0.104 0.308 0.814 0.992 0.265 0.134 0.914 0.978 0.144 0.330 0.818 0.538 0.519 0.615 0.852 0.291 0.196 0.478 0.271 0.567 0.091 0.052 0.533 0.691 0.944 0.451 0.873 0.945 0.843 0.901 0.743 0.193 0.563 0.456 0.796 0.900 0.222 0.706 0.350 0.466 0.903 0.007 0.409 0.342 0.380 0.314 0.455 0.403 0.818 0.916 0.803 0.370 0.153 0.305 0.745 0.720 0.213 0.804 0.362 0.793 0.685 0.443 0.003 0.125 0.399 0.675 0.403 0.269 0.942 0.800 0.565 0.210 0.095 0.750 0.644 0.178 0.912 0.102 0.378 0.715 0.707 0.060 0.811 0.495 0.674 0.223 0.372 0.790 0.496 0.934 0.762 0.941 0.553 0.749 0.925 0.008 0.386 0.170 0.266 0.869 0.463 0.308 0.044 0.557 0.768 0.417 0.902 0.230 0.775 0.556 0.129 0.602 0.023 0.265 0.158 0.168 0.200 0.650 0.302 0.460 0.811 0.449 0.783 0.461 0.833 0.513 0.754 0.450 0.553 0.154 0.741 0.111 0.693 0.092 0.901 0.948 0.296 0.937 0.401 0.637 0.356 0.108 0.993 0.233 0.487 0.084 0.363 0.719 0.451 0.299 0.063 0.971 0.779 0.178 0.680 0.528 0.814 0.437 0.484 0.265 0.107 0.754 0.234 0.642 0.302 0.860 0.126 0.350 0.477 0.018 0.083 0.648 0.737 0.936 0.847 0.548 0.735 0.843 0.653 0.507 0.678 0.201 0.722 0.886 0.138 0.957 0.002 0.709 0.746 0.112 0.723 0.639 0.381 0.823 0.960 0.512 0.860 0.380 0.903 0.334 0.709 0.734 0.241 0.496 0.030 0.730 0.645 0.605 0.585 0.459 0.856 0.506 0.388 0.624 0.021 0.751 0.172 0.520 0.123 0.616 0.943 0.757 0.946 0.625 0.408 0.690 0.402 0.039 0.189 0.675 0.564 0.244 0.777 0.283 0.915 0.720 0.007 0.406 0.356 0.771 0.975 0.576 0.760 0.296 0.996 0.678 0.920 0.872 0.720 0.426 0.388 0.682 0.142 0.735 0.002 0.388 0.170 0.238 0.711 0.880 0.716 0.728 0.961 0.222 0.103 0.616 0.330 0.512 0.018 0.108 0.558 0.996 0.969 0.632 0.796 0.235 0.924 0.340 0.330 0.644 0.646 0.637 0.825 0.551 0.679 0.022 0.454 0.455 0.858 0.324 0.176 0.965 0.477 0.161 0.282 0.057 0.409 0.417 0.157 0.703 0.636 0.579 0.819 0.600 0.985 0.309 0.414 0.116 0.426 0.577 0.072 0.784 0.143 0.248 0.654 0.277 0.986 0.395 0.607 0.886 0.042 0.577 0.173

ITM 802-19 Appendix A Revised 2/7/19
18 of 20
RANDOM NUMBER TABLE
0.779 0.284 0.210 0.877 0.351 0.611 0.544 0.091 0.483 0.778 0.438 0.495 0.264 0.694 0.005 0.970 0.594 0.757 0.710 0.912 0.071 0.491 0.689 0.601 0.408 0.360 0.483 0.766 0.541 0.674 0.691 0.646 0.759 0.965 0.337 0.494 0.054 0.846 0.485 0.772 0.075 0.270 0.325 0.371 0.381 0.590 0.868 0.643 0.597 0.233 0.888 0.375 0.489 0.450 0.263 0.842 0.586 0.862 0.153 0.228 0.613 0.838 0.358 0.725 0.958 0.146 0.424 0.601 0.363 0.895 0.639 0.967 0.636 0.724 0.495 0.357 0.132 0.797 0.098 0.665 0.272 0.257 0.765 0.217 0.339 0.928 0.241 0.464 0.608 0.348 0.041 0.365 0.358 0.628 0.208 0.297 0.028 0.062 0.326 0.765 0.795 0.849 0.984 0.550 0.453 0.592 0.216 0.100 0.179 0.257 0.961 0.325 0.114 0.732 0.829 0.637 0.706 0.950 0.977 0.265 0.840 0.934 0.012 0.949 0.269 0.581 0.872 0.310 0.763 0.893 0.738 0.848 0.613 0.699 0.129 0.781 0.263 0.397 0.688 0.198 0.594 0.960 0.898 0.519 0.034 0.853 0.070 0.136 0.151 0.829 0.569 0.905 0.347 0.957 0.034 0.302 0.594 0.708 0.529 0.219 0.358 0.828 0.920 0.887 0.349 0.491 0.616 0.785 0.460 0.572 0.458 0.763 0.207 0.483 0.203 0.996 0.186 0.076 0.647 0.883 0.060 0.145 0.114 0.934 0.733 0.786 0.961 0.241 0.172 0.995 0.401 0.248 0.516 0.911 0.669 0.991 0.999 0.617 0.547 0.969 0.964 0.458 0.356 0.414 0.953 0.176 0.987 0.381 0.256 0.309 0.118 0.918 0.142 0.540 0.448 0.889 0.555 0.205 0.879 0.362 0.254 0.600 0.806 0.126 0.299 0.754 0.373 0.779 0.594 0.301 0.254 0.838 0.398 0.389 0.970 0.018 0.132 0.512 0.569 0.608 0.427 0.410 0.434 0.847 0.787 0.001 0.524 0.828 0.448 0.087 0.342 0.746 0.382 0.662 0.670 0.065 0.133 0.067 0.958 0.630 0.112 0.129 0.663 0.666 0.018 0.522 0.454 0.813 0.405 0.698 0.767 0.879 0.390 0.279 0.994 0.474 0.004 0.831 0.323 0.414 0.940 0.989 0.854 0.835 0.957 0.154 0.493 0.642 0.637 0.578 0.271 0.337 0.728 0.173 0.840 0.814 0.777 0.877 0.028 0.794 0.078 0.590 0.712 0.705 0.336 0.603 0.992 0.214 0.934 0.800 0.799 0.519 0.235 0.113 0.936 0.059 0.793 0.504 0.065 0.526 0.033 0.873 0.130 0.921 0.485 0.146 0.330 0.633 0.835 0.172 0.423 0.958 0.967 0.605 0.632 0.710 0.217 0.613 0.259 0.699 0.273 0.945 0.329 0.895 0.813 0.154 0.149 0.425 0.881 0.029

ITM 802-19 Appendix A Revised 2/7/19
19 of 20
RANDOM NUMBER TABLE
0.731 0.731 0.423 0.958 0.950 0.212 0.700 0.267 0.448 0.975 0.799 0.629 0.160 0.292 0.932 0.083 0.068 0.763 0.794 0.785 0.061 0.225 0.782 0.150 0.006 0.645 0.422 0.666 0.818 0.182 0.272 0.685 0.643 0.687 0.945 0.205 0.461 0.399 0.588 0.677 0.941 0.170 0.982 0.792 0.435 0.142 0.244 0.140 0.395 0.295 0.428 0.330 0.534 0.376 0.903 0.036 0.165 0.725 0.200 0.736 0.618 0.542 0.219 0.787 0.114 0.594 0.833 0.070 0.114 0.450 0.080 0.806 0.777 0.185 0.473 0.341 0.810 0.462 0.811 0.736 0.190 0.444 0.671 0.642 0.726 0.451 0.955 0.952 0.859 0.929 0.343 0.766 0.809 0.365 0.646 0.768 0.717 0.848 0.053 0.545 0.281 0.633 0.189 0.261 0.950 0.549 0.906 0.164 0.921 .791 0.974 0.666 0.600 0.834 0.832 0.205 0.163 0.668 0.096 0.350 0.819 0.495 0.392 0.968 0.755 0.917 0.266 0.452 0.341 0.095 0.131 0.253 0.777 0.120 0.753 0.008 0.205 0.626 0.826 0.778 0.522 0.878 0.990 0.159 0.278 0.643 0.024 0.287 0.707 0.373 0.510 0.132 0.722 0.906 0.800 0.932 0.009 0.383 0.677 0.289 0.094 0.058 0.483 0.285 0.264 0.546 0.047 0.761 0.085 0.786 0.186 0.546 0.975 0.715 0.628 0.525 0.231 0.444 0.077 0.066 0.797 0.784 0.884 0.604 0.954 0.992 0.175 0.129 0.224 0.984 0.485 0.263 0.597 0.268 0.498 0.722 0.184 0.686 0.536 0.089 0.573 0.755 0.217 0.463 0.776 0.492 0.420 0.107 0.164 0.940 0.266 0.433 0.175 0.403 0.519 0.730 0.091 0.385 0.984 0.578 0.880 0.037 0.157 0.535 0.466 0.215 0.818 0.636 0.215 0.276 0.396 0.158 0.227 0.636 0.823 0.238 0.172 0.522 0.805 0.109 0.436 0.091 0.271 0.032 0.644 0.475 0.372 0.399 0.481 0.605 0.850 0.863 0.748 0.453 0.925 0.418 0.018 0.570 0.834 0.079 0.839 0.866 0.943 0.093 0.493 0.530 0.995 0.282 0.544 0.532 0.103 0.528 0.632 0.643 0.780 0.752 0.974 0.850 0.997 0.303 0.218 0.786 0.065 0.149 0.903 0.049 0.223 0.487 0.242 0.559 0.693 0.355 0.412 0.535 0.878 0.121 0.031 0.919 0.710 0.069 0.339 0.521 0.001 0.297 0.190 0.802 0.682 0.836 0.694 0.242 0.515 0.885 0.494 0.739 0.373 0.058 0.026 0.386 0.658 0.455 0.076 0.471 0.334 0.422 0.136 0.871 0.818 0.790 0.365 0.276 0.367 0.901 0.023 0.530 0.992 0.758 0.821 0.399 0.926 0.974 0.795 0.218 0.884 0.070 0.291 0.436 0.905 0.271 0.181 0.881

ITM 802-19 Appendix A Revised 2/7/19
20 of 20
RANDOM NUMBER TABLE
0.344 0.569 0.290 0.243 0.451 0.836 0.596 0.159 0.878 0.107 0.409 0.991 0.666 0.609 0.026 0.620 0.772 0.318 0.987 0.197 0.375 0.596 0.892 0.472 0.916 0.252 0.988 0.470 0.980 0.566 0.547 0.253 0.020 0.474 0.462 0.096 0.515 0.729 0.251 0.676 0.350 0.802 0.627 0.825 0.866 0.765 0.999 0.268 0.058 0.968 0.885 0.786 0.077 0.805 0.089 0.953 0.055 0.825 0.436 0.330 0.389 0.889 0.169 0.491 0.804 0.132 0.862 0.703 0.558 0.808 0.839 0.142 0.211 0.099 0.662 0.627 0.919 0.012 0.104 0.378 0.100 0.781 0.332 0.776 0.546 0.370 0.524 0.470 0.919 0.796 0.510 0.331 0.467 0.221 0.364 0.434 0.386 0.642 0.077 0.456 0.481 0.599 0.085 0.647 0.500 0.120 0.592 0.103 0.702 0.999 0.213 0.195 0.999 0.470 0.268 0.215 0.220 0.043 0.360 0.024 0.431 0.730 0.905 0.420 0.210 0.805 0.723 0.137 0.156 0.031 0.029 0.832 0.713 0.435 0.520 0.503 0.452 0.981 0.633 0.118 0.240 0.329 0.015 0.550 0.088 0.086 0.325 0.397 0.061 0.806 0.906 0.743 0.882 0.924 0.310 0.456 0.396 0.784 0.686 0.184 0.559 0.408 0.245 0.212 0.802 0.017 0.841 0.598 0.142 0.228 0.161 0.678 0.660 0.388 0.964 0.169 0.184 0.237 0.222 0.328 0.068 0.035 0.547 0.227 0.818 0.008 0.467 0.353 0.615 0.264 0.459 0.348 0.664 0.718 0.920 0.382 0.824 0.039 0.462 0.235 0.541 0.776 0.752 0.366 0.016 0.827 0.608 0.923 0.601 0.087 0.517 0.859 0.217 0.074 0.766 0.689 0.650 0.404 0.729 0.980 0.669 0.598 0.372 0.594 0.043 0.378 0.416 0.857 0.039 0.905 0.274 0.385 0.352 0.367 0.149 0.327 0.160 0.283 0.840 0.708 0.235 0.165 0.658 0.567 0.982 0.094 0.690 0.319 0.605 0.706 0.881 0.556 0.066 0.062 0.614 0.018 0.030 0.035 0.728 0.859 0.326 0.663 0.566 0.470 0.421 0.477 0.066 0.018 0.825 0.434 0.683 0.304 0.968 0.239 0.663 0.236 0.277 0.317 0.214 0.478 0.618 0.944 0.985 0.105 0.540 0.183 0.748 0.009 0.353 0.963 0.925 0.226 0.388 0.513 0.526 0.718 0.539 0.924 0.442 0.197 0.685 0.943 0.431 0.317 0.476 0.228 0.414 0.064 0.955 0.340 0.658 0.412 0.512 0.885 0.685 0.636 0.851 0.584 0.048 0.951 0.869 0.495 0.608 0.567 0.035 0.493 0.500 0.229 0.826 0.337 0.125 0.157 0.056 0.436 0.657 0.602 0.823 0.453 0.823 0.099 0.569 0.998 0.733 0.097 0.268 0.640 0.272 0.718 0.153 0.644