Indian Terrain Fashions Limited - Microsoft · Q3 FY2017 - Reconciliation - IGAAP and INDAS Page 7...
19
Indian Terrain Fashions Limited
-
Upload
truongkhue -
Category
Documents
-
view
220 -
download
3
Transcript of Indian Terrain Fashions Limited - Microsoft · Q3 FY2017 - Reconciliation - IGAAP and INDAS Page 7...

Indian Terrain Fashions Limited
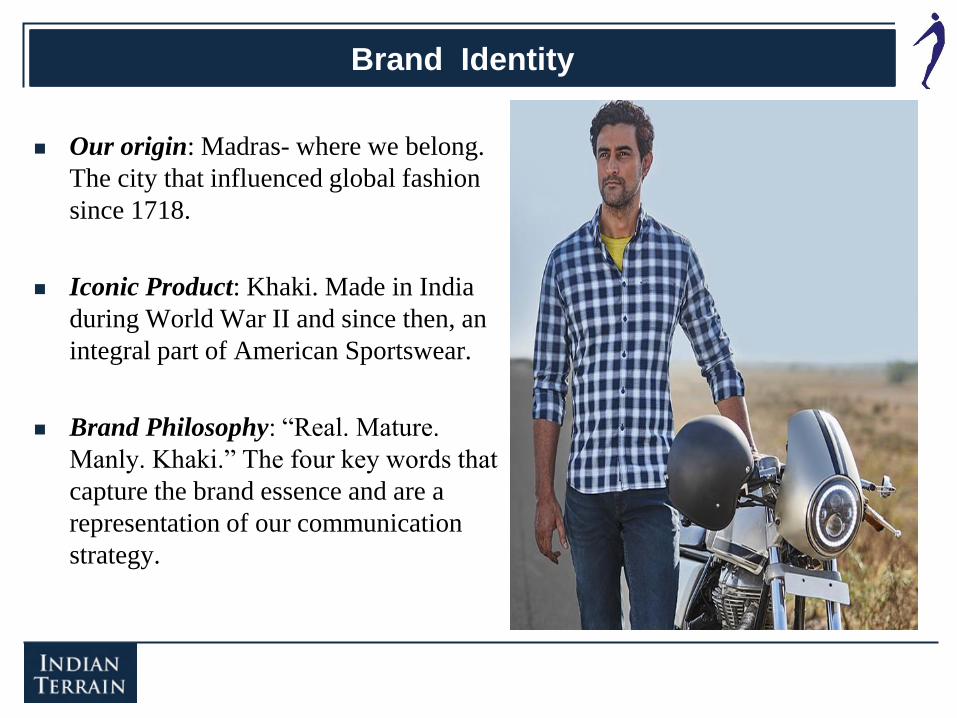
Brand Identity
Our origin: Madras- where we belong.
The city that influenced global fashion
since 1718.
Iconic Product: Khaki. Made in India
during World War II and since then, an
integral part of American Sportswear.
Brand Philosophy: “Real. Mature.
Manly. Khaki.” The four key words that
capture the brand essence and are a
representation of our communication
strategy.
The Company has adopted Indian Accounting Standards (Ind AS) from April 1, 2017. The
financial results for the Quarter and Period ending 31st December 2017 have been
prepared in accordance with the recognition and measurement principles laid down in the
Ind AS 34 Interim Financial Reporting prescribed under Section 133 of the Companies
Act, 2013 read with relevant rules issued thereunder. The date of transition is 1st April
2016 and the impact of the transition has been accounted for in the opening reserves and
the comparative period results have been restated accordingly.
In view of adoption of Ind AS and the resultant reassessment / remeasurement of
financials for the opening and comparative periods, the financial statements for the
Quarter and Period Ending 31st December 2017 is not strictly comparable with the
financial statements for the corresponding period previous year
FY 2017-18 – First Year under Ind AS
Page 3

Revenues (Rs. Cr)
94.5 crs of Revenues; Operating EBITDA of 12.7 crs; Profits of Rs.6.4 crs
82.3
94.5
Q3FY17 Q3FY18
15%
10.7
12.7
Q3FY17 Q3FY18
5.6 6.4
Q3FY17 Q3FY18
15%
Q3 Financial Highlights
Operational EBITDA (Rs. Cr) Profits (Rs. Cr)
Page 4
18%
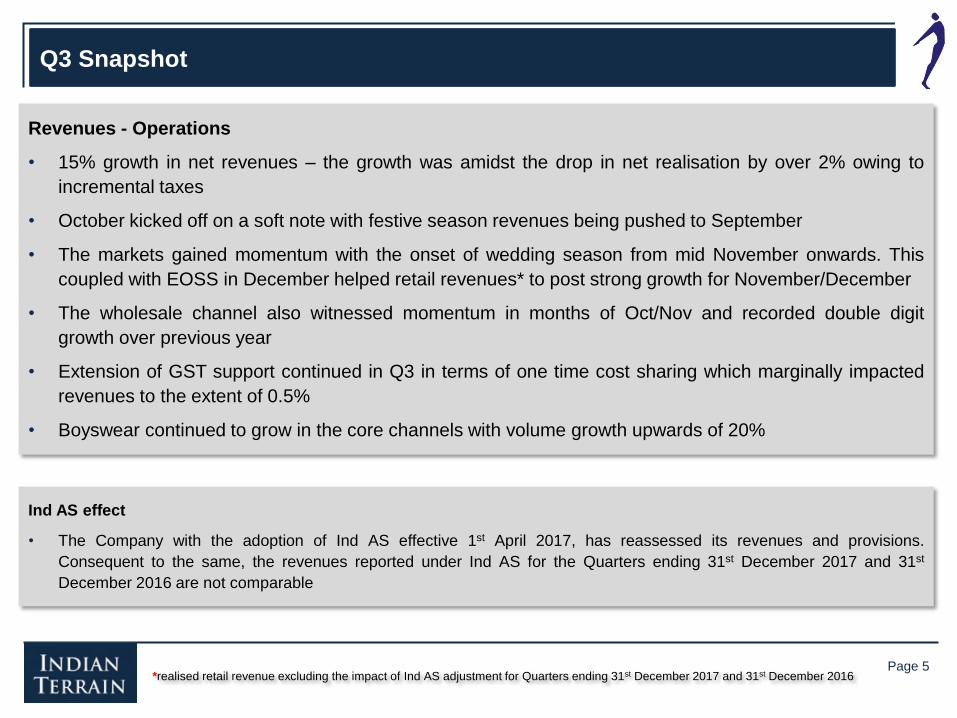
Revenues - Operations
• 15% growth in net revenues – the growth was amidst the drop in net realisation by over 2% owing to
incremental taxes
• October kicked off on a soft note with festive season revenues being pushed to September
• The markets gained momentum with the onset of wedding season from mid November onwards. This
coupled with EOSS in December helped retail revenues* to post strong growth for November/December
• The wholesale channel also witnessed momentum in months of Oct/Nov and recorded double digit
growth over previous year
• Extension of GST support continued in Q3 in terms of one time cost sharing which marginally impacted
revenues to the extent of 0.5%
• Boyswear continued to grow in the core channels with volume growth upwards of 20%
Ind AS effect
• The Company with the adoption of Ind AS effective 1st April 2017, has reassessed its revenues and provisions.
Consequent to the same, the revenues reported under Ind AS for the Quarters ending 31st December 2017 and 31st
December 2016 are not comparable
Q3 Snapshot
Page 5 *realised retail revenue excluding the impact of Ind AS adjustment for Quarters ending 31st December 2017 and 31st December 2016

Operating Margins
EBITDA margins for Q3FY2018 was at 13.4% compared to 13% of Q3FY2017
• Improvement to gross contribution margins by over 1% with improvement to
sourcing efficiencies and flow of GST benefits
• Increase in marketing spends by 18% for improved brand visibility
• Increase in Personnel Costs with expansion of retail footprint coupled with
strengthening of team across critical areas
• Control on other operating costs
Reduction in finance costs and Other Income - reduced utilisation of working capital /
treasury management
PBT at 9.86 crs against 8.53 crs of previous year
Net Profits at 6.44 crs against 5.61 crs of previous year
Q3 Snapshot
Page 6
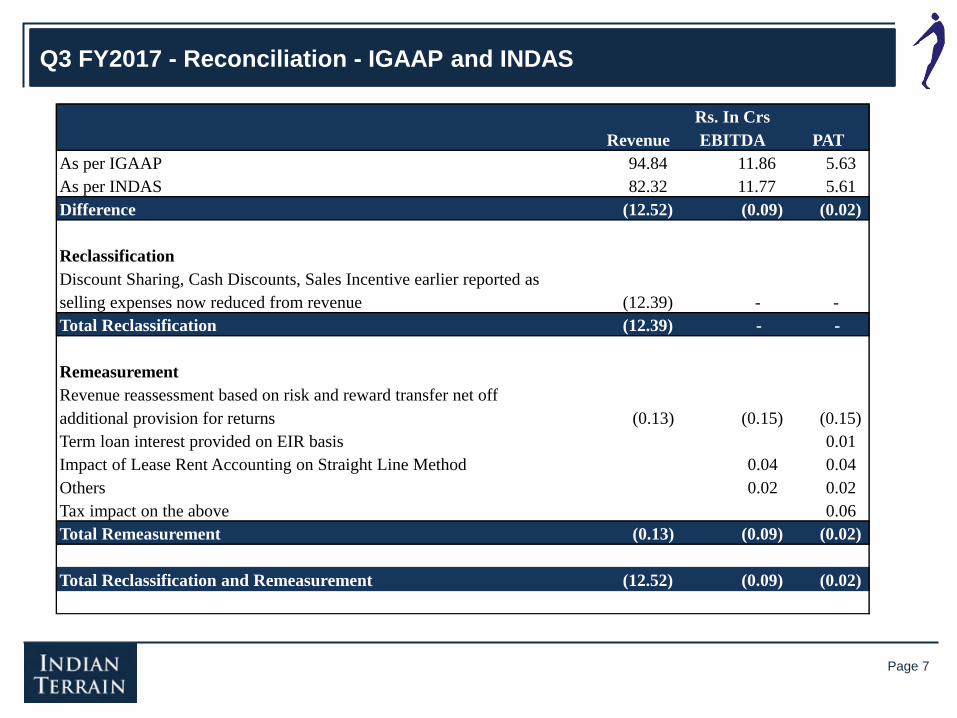
Q3 FY2017 - Reconciliation - IGAAP and INDAS
Page 7
Revenue EBITDA PAT
As per IGAAP 94.84 11.86 5.63
As per INDAS 82.32 11.77 5.61
Difference (12.52) (0.09) (0.02)
Reclassification
Discount Sharing, Cash Discounts, Sales Incentive earlier reported as
selling expenses now reduced from revenue (12.39) - -
Total Reclassification (12.39) - -
Remeasurement
Revenue reassessment based on risk and reward transfer net off
additional provision for returns (0.13) (0.15) (0.15)
Term loan interest provided on EIR basis 0.01
Impact of Lease Rent Accounting on Straight Line Method 0.04 0.04
Others 0.02 0.02
Tax impact on the above 0.06
Total Remeasurement (0.13) (0.09) (0.02)
Total Reclassification and Remeasurement (12.52) (0.09) (0.02)
Rs. In Crs

Financials – Q3 and 9M
Page 8
Rs. In Cr Q3 FY18 Q3 FY17 Change 9M FY18 9M FY17 Change
Revenues 94.53 82.32 14.8% 293.51 237.00 23.8%
Cost of Materials 4.40 8.35 34.08 41.96 Purchase of Finished Goods 32.51 17.35 98.93 77.27 Change in Inventories 12.98 20.27 25.98 6.17 Garment Processing Costs 3.52 1.58 18.70 14.65 Employee Benefit Expenses 7.68 5.61 22.05 16.18 Other Expenses 20.76 18.44 59.98 51.36 Total Expenses 81.85 71.60 14.3% 259.72 207.59 25.1%
Operating EBITDA 12.68 10.72 18.3% 33.79 29.41 14.9%
Other Income 0.30 1.05 1.66 3.91 Gross EBITDA 12.98 11.77 10.3% 35.45 33.32 6.4%
Finance Costs 1.72 2.45 4.52 6.86 Depreciation 1.40 0.79 3.15 2.63 Profit Before Tax 9.86 8.53 15.6% 27.78 23.83 16.6%
Tax Expenses 3.42 2.92 9.62 8.24 Profit After Tax (before other
comprehensive income) 6.44 5.61 14.9% 18.16 15.59 16.5%
Other Comprehensive Income (net of tax) 0.00 (0.02) 0.04 0.01 Total Comprehensive Income 6.44 5.59 15.3% 18.20 15.60 16.7%
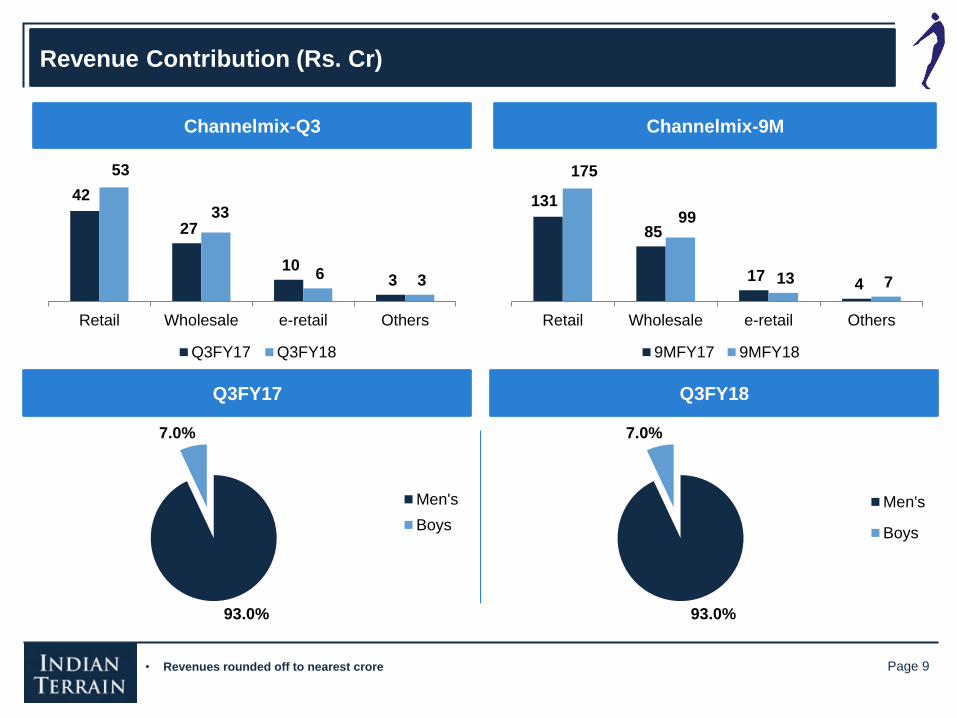
93.0%
7.0%
Men's
Boys
93.0%
7.0%
Men's
Boys
42
27
10 3
53
33
6 3
Retail Wholesale e-retail Others
Q3FY17 Q3FY18
• Revenues rounded off to nearest crore
Revenue Contribution (Rs. Cr)
Channelmix-Q3
Q3FY17 Q3FY18
Page 9
131
85
17 4
175
99
13 7
Retail Wholesale e-retail Others
9MFY17 9MFY18
Channelmix-9M

Page 10
Page 11
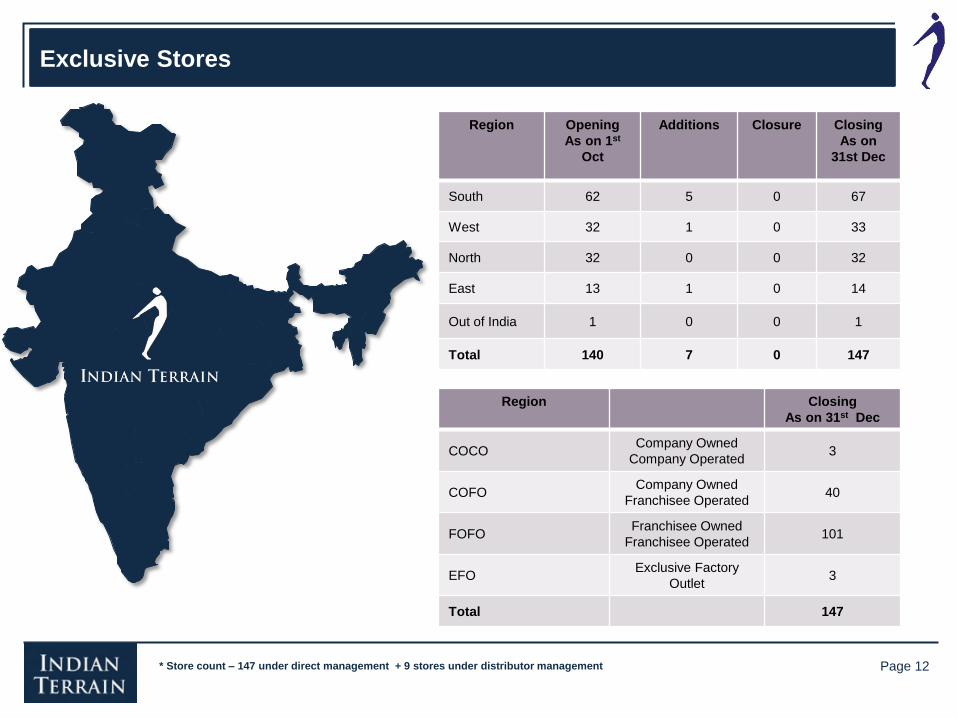
Exclusive Stores
Page 12
Region Opening
As on 1st
Oct
Additions Closure Closing
As on
31st Dec
South 62 5 0 67
West 32 1 0 33
North 32 0 0 32
East 13 1 0 14
Out of India 1 0 0 1
Total 140 7 0 147
* Store count – 147 under direct management + 9 stores under distributor management
Region Closing
As on 31st Dec
COCO Company Owned
Company Operated 3
COFO Company Owned
Franchisee Operated 40
FOFO Franchisee Owned
Franchisee Operated 101
EFO Exclusive Factory
Outlet 3
Total 147

Store Launches
Page 13

Page 14

Store Launches
Page 15

141 157 232 290 325
403
FY12 FY13 FY14 FY15 FY16 FY17
Performance Overview
Revenue growth of 23%
32% growth in Operating EBITDA
Page 16
12 15 24
34 41 47
FY12 FY13 FY14 FY15 FY16 FY17
8.5% 9.6% 10.3%
11.7% 12.6% 11.7%
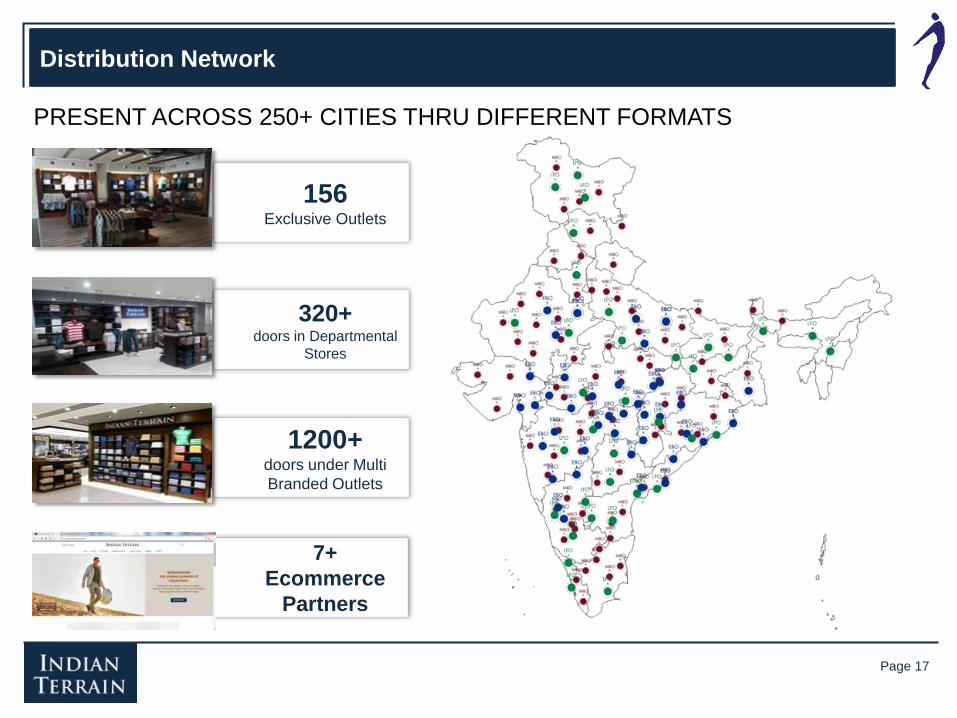
Distribution Network
Page 17
156
Exclusive Outlets
320+ doors in Departmental
Stores
1200+ doors under Multi
Branded Outlets
7+
Ecommerce
Partners
PRESENT ACROSS 250+ CITIES THRU DIFFERENT FORMATS
Overall market sentiments is positive and the markets have settled on GST issues
Q4 looks healthy backed by strong orders from wholesale trade and uptick in retail
markets
Hardstop of EOSS in Jan end will have a marginal impact on topline in Jan/Feb
However with the early onset of new season and improved fresh contribution the
margins are expected to improve
E-Commerce will witness revamped focus starting Q4 and the aim is to bring
synergies in operations
5 exclusive stores and 40 LFO doors are on the pipeline for Q4. Emphasis remains
on high growth potential markets and the strategy is to tap the market with right set
of products and pricing
Boyswear is scaling up fast with strong customer traction and market penetration
Outlook
Page 18

Disclaimer
The information contained in this presentation is only current as of its date. Please note that the past performance of the
Company is not and should not be considered as, indicative of future results.
This presentation may contain certain statements of future expectations and other forward-looking statements, including those
relating to our general business plans and strategy, our future financial condition and growth prospects and future
developments in our sector and our competitive and regulatory environment. In addition to statements which are forward
looking by reason of context, the words ‘may’, ‘will’, ‘should’, ‘expects’, ‘plans’, ‘intends’, ‘anticipates’, ‘believes’, ‘estimates’,
‘predicts’, ‘potential’ or ‘continue’ and similar expressions identify forward looking statements. All forward looking statements
are subject to risks, uncertainties and assumptions that could cause actual results, performances or events to differ materially
from the results contemplated by the relevant forward looking statement. The factors which may affect the results
contemplated by the forward looking statements could include, amongst others, future changes or developments in (i) the
Company’s business, (ii) the Company’s competitive environment, and (iii) political, economic, legal and social conditions in
India.
The Company assumes no responsibility to publicly amend, modify or revise any forward looking statements on the basis of
any subsequent developments, information or events or otherwise. Unless otherwise stated in this document, the information
contained herein is based on management information and estimates.
The information contained herein is subject to change without notice and past performance is not indicative of future results.
Company may alter, modify or otherwise change in any manner the content of this presentation, without obligation to notify any
person of such revision or changes. This presentation may not be copied and disseminated in any manner.
Thank You
Page 19