Indian Institute of Technology Bombayrb/Professional Activities/Microgrids...Bhomji Ka...
52
Indian Institute of Technology Bombay
Transcript of Indian Institute of Technology Bombayrb/Professional Activities/Microgrids...Bhomji Ka...

Indian Institute of Technology Bombay

Department of
Energy Science and EngineeringIIT Bombay
To develop sustainable energy systems
and solutions for the future

ResearchConventional Energy
Energy efficiency,
Process Integration,
DSM, Benchmarking,
Underground Coal
Gasification, Waste to
Energy, Microgrids, Fuel
Cells
Renewable Energy
Solar PV, Solar Thermal,
Biomass, Novel
Batteries – Li , NaS,
Hydrogen Storage
Energy Systems
Analysis
Modelling and Simulation
Energy Planning and
Policy, Water and Energy
Lifecycle Analysis
0
2000
4000
6000
8000
10000
12000
14000
16000
1 2 3 4 5 6 7 8 9 10 11 12 13 14 15 16
Furnace number
SE
C (
kJ
/kg
)
Target SEC Actual SEC

Microgrids in India: Status and Future
Rangan BanerjeeDepartment of Energy Science and Engineering
IIT Bombay
Presentation at Monash University - June 7 20174

Need for distributed power generation in India
Source: Government of India, 2011 Census
• Some states – higher poverty -
Bihar, UP, Jharkhand and Odisha.India - highest electricity access deficit
(Top 20 countries for access deficit in electricity, 2014)
Source: Status of electricity access report, 2017
5

What is a microgrid?
Interconnected loads, distributed generation and energy storage devices
A single controllable entity with respect to the grid with bidirectional power flow
DER’s
DER’s
Dis
trib
uti
on
n
etw
ork
De
ma
nd
Dis
trib
uti
on
n
etw
ork
De
ma
nd
Large Centralised Generation
Transmission network
Grid
ES
S
ES
S
6

Classification of Microgrids
Size
Microgrids
Mode of operation Type Source Scenario
Isolated Grid Connected
HybridAC DC
Renewables Diesel Hybrid
Wind Micro Hydro
Biomass HybridSolar
CommercialResidential Industrial
<10kW
>1 MW
10kW-1MW
7

Global Microgrid Capacity - 2016
Total microgrid power capacity market share by region
Total microgrid power capacity market share by country
Source : Microgrid Deployment Tracker 2Q16 by Navigant Research
Global Microgrid Capacity – 16552 MW
Approx 350 MW of microgrids in India
8

Grid outage for different urban areas
Source: ESMI, Prayas 9
Baghru, Jaipur
Garladinne,
Kundapur, Udupi
Pandeypur, Varanasi
Jamui
0
1
2
3
4
5
6
7
Baghru Garladinne Kundapur Pandeypur Jamui town
Jaipur Anantpur Udupi Varanasi Jamui
Ou
tage
du
rati
on
in h
ou
rs/d
ay
Urban location in India
Jan-16 Feb-16 Mar-16 Apr-16 May-16
Average number of outage hours in a day for a location
9

Microgrid estimates for India (samples)
Source: Schnitzer, D et al., 2014
Microgrid Installed Capacity by developer Microgrid Installed Capacity by generation type kW
*as on 2012
10

Gram Oorja, Darewada ,Pune
Source: Minigrids Electricity for all, CSE, 201611
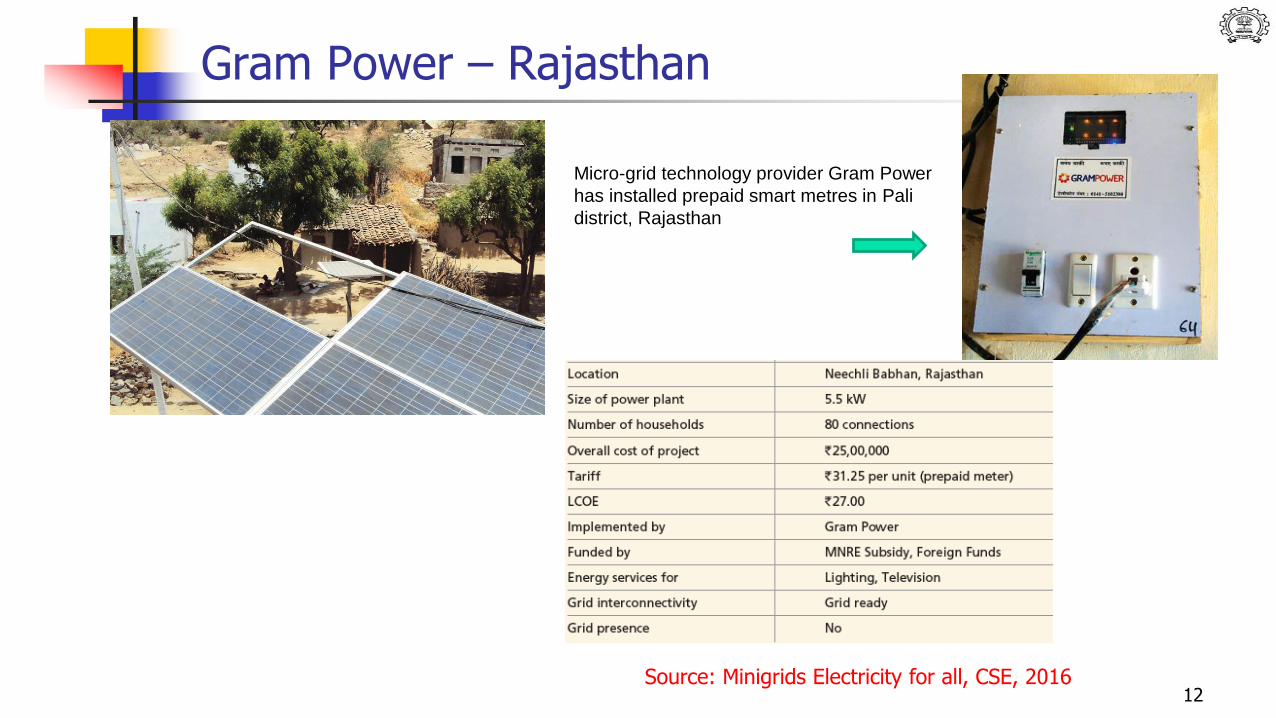
Gram Power – Rajasthan
Micro-grid technology provider Gram Power
has installed prepaid smart metres in Pali
district, Rajasthan
Source: Minigrids Electricity for all, CSE, 201612

Husk Power System - Sahebganj Village
Source: Minigrids Electricity for all, CSE, 201613

Bhomji Ka Gaon,Rajasthan
Location Bhomji Ka Gaon
Type On grid and off grid connections
Size of power plant
500 kWp
Number of households
4000
Off grid dc inverter less system, Rajasthan
The power data measured over a day in an off-grid home in Rajasthan with a solar dc Inverter less system on 25 February 2016
The power data measured in an on-grid home with a solar-dc inverterless system from 23 February 2016 to 24 February 2016.
Source: Solar-dc Microgrid for Indian Homes, IEEE, 2016
14
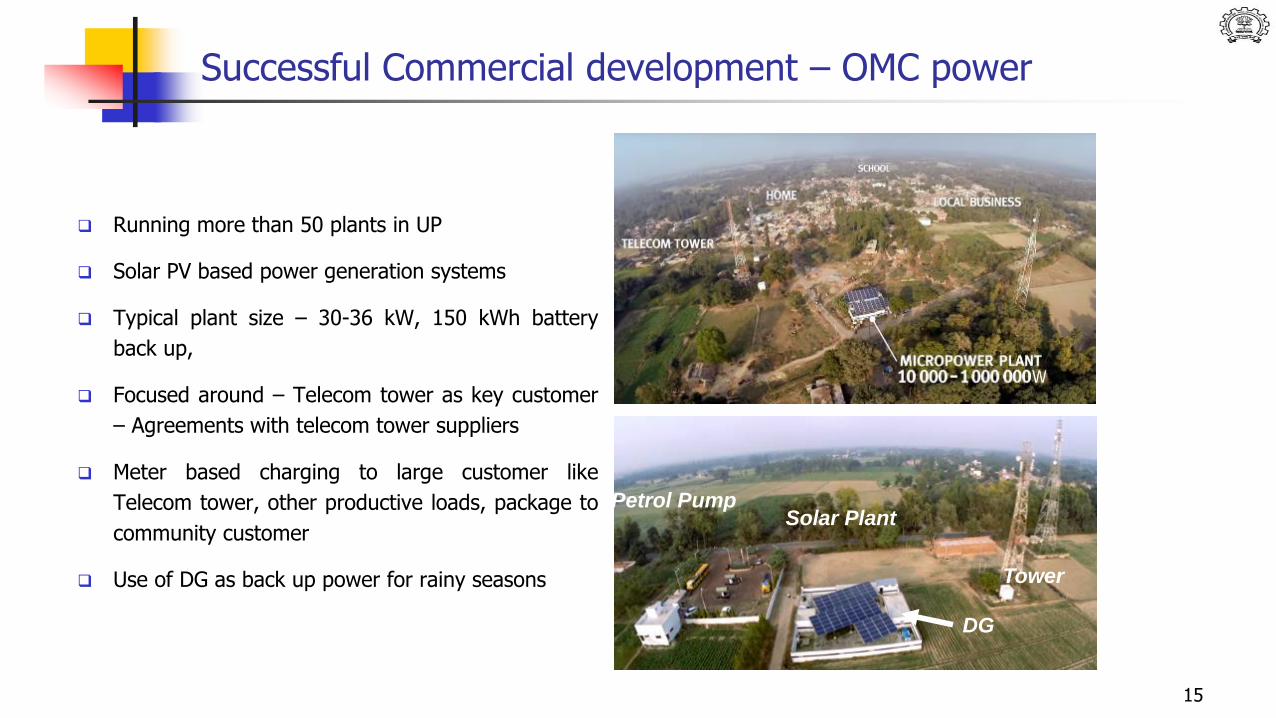
Successful Commercial development – OMC power
Running more than 50 plants in UP
Solar PV based power generation systems
Typical plant size – 30-36 kW, 150 kWh battery
back up,
Focused around – Telecom tower as key customer
– Agreements with telecom tower suppliers
Meter based charging to large customer like
Telecom tower, other productive loads, package to
community customer
Use of DG as back up power for rainy seasons
Petrol PumpSolar Plant
Tower
DG
15

OMC power - PlantSolar Plant MPPT Battery Bank
MetersLoads
16

Husk Power – Biomass gasification based power generation system
Running more than 50 plants in Bihar & UP
Operation through various model based on level of engagement (Ex. BOOM –
Build own operate & Maintain )
Biomass Gasifier engine based power generation system, typical plant size – 32
kW
Rice Husk as fuel – Engagement with rice mills for bulk procuring
Focused around – Market places, small productive loads, collection on daily basis
Electricity supply in Different packages
Unique features:
Local fuel utilization – Lower fuel cost
Gas cleaning system – uses rice husk
Low cost material and local fabrication – Low capital cost
Training and capacity building of operator – Low downtime
Local material for distribution network – Low cost
Use of waste Ash from gasifier – Intense making ; local job creation
17

Husk Power – Biomass gasification systemRice huskGasifierGas CleaningEngine
Monitoring Distribution network End load
Remote data monitoring Billing & Payment collection Intense making from ash
18

Mini grid based on Hybrid system – HUSK Power
Recently husk power has installed hybrid system with an intent to supply 24X7 electricity
Around 3-4 hybrid plants being operated by Husk power
Technology – Biomass gasifier engine system, Solar PV system and Battery
Technical Arrangement: Electricity supply during day time by Solar PV system and during
evening time by Biomass gasification system
Electricity supply in Different packages
Motivation for hybrid system:
Lower solar PV cost
Increasing demand from users
Willingness to use electricity in day time also
19

Storage options
&m-grid scenario
20

For a renewable microgrid scenario
Log of time in seconds
1 (t=0) 3 (t=15minutes) 5 (t=1day) 7.5 (t=1year)
Short term storage Mid Term Storage Long term Storage
o Sudden fluctuation in load averaged over a second
o Load surges 4-8 times average load
o Context: Welding Load, lift load
o Load variation is averaged over 15 minutes
o Context - Residential Buildings with load shedding 2-3 hours
o Seasonal variation in load averaged over the day for an entire year
o Context - Variation in load like summer loads, winter loads
o Diurnal load variationo Load is averaged over the hour
for a dayo Context - Renewable microgrid
Supercapacitor
Classification of Energy Storage Systems
Lithium Battery
Lead Acid Battery
Flywheel Fuel Cell-Hydrogen Storage| Flow batteries
21

22
Scenario 1(a): Isolated Rural with PV battery system
Energy Source Solar PV – 4.3kW
Storage Lead Acid battery – 19kWh
Connected Load 4.4 kW
DistributionVoltage
48V dc (Safety Voltage for distribution)
Boost
Converter
24-48V
MPPT
Charge
Controller
Battery Bank
19kWh
48 VDC bus
Household
load 1 +
Farm 1
Household
load 2+
Farm 2
PV array
3.4kW
0
200
400
600
800
1000
1200
1400
1600
1800
2000
1 6 11 16 21
Lo
ad
(W)
Time(hours)
Load Average load Peak load
Average Load = 0.5kWPeak Load = 2.0kWTotal Load = 4.4kWTotal Energy Consumption/day = 12.7kWh/day

Battery Life in climatic zones and per unit cost
Shillong
Bangalore
Chennai
Jodhpur
New Delhi
Jacob A. S., et al., 2016 23

Sizing based on Pinch Analysis
In isolated energy system Source – Generator
Sink - Demand
Quality – Time (Driving force)
En
erg
yy
(De
ma
nd
, G
en
era
tio
n,
Sto
rag
e)
Time
Cumulative Demand Cumulative Generation
Mismatch
Pinch Point
Storage
24
Maximum mismatch
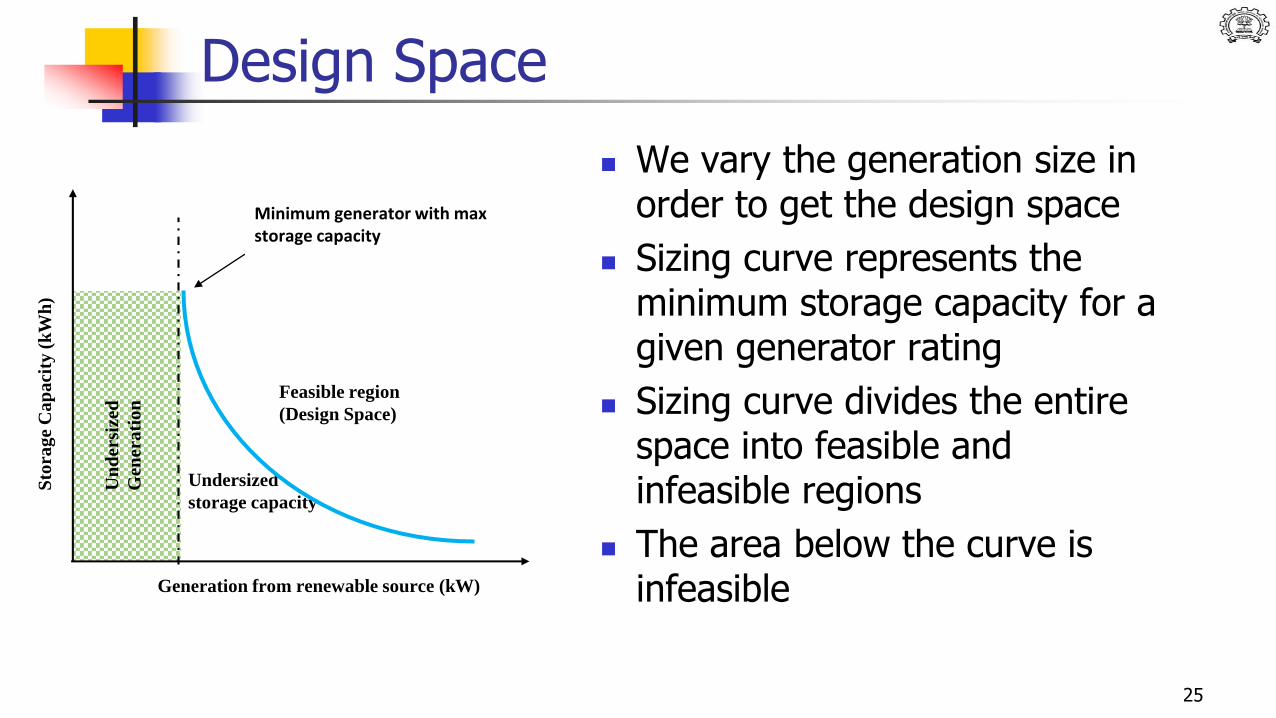
Design Space
We vary the generation size in order to get the design space
Sizing curve represents the minimum storage capacity for a given generator rating
Sizing curve divides the entire space into feasible and infeasible regions
The area below the curve is infeasible
25
Generation from renewable source (kW)
Sto
rag
e C
ap
aci
ty (
kW
h)
Un
der
size
d
Gen
era
tio
n
Undersized
storage capacity
Feasible region
(Design Space)
Minimum generator with max storage capacity

Scenario 1 (b)- Off grid Industrial with PV hybrid storage system
PV arrayBoost
Converter
MPPT
Charge
ControllerHybrid
Storage
24V DC bus
Small
industry –
Welding
Load
26
0
0.5
1
1.5
2
2.5
3
3.5
4
0 365 730 1095 1460 1826 2191 2556 2921 3287
Lo
ad
(k
W)
Time (seconds)
1 hour welding profile logged in Mumbai on Feb’14
Average Load = 428.51WPeak Load = 3800WLoad Factor = 0.113

0.000
0.001
0.002
0.003
0.004
PV size
0
10
20
30
Feasible regionInfeasible
region
Energ
y
cumulativegenerationcumulative load
mismatch
Sho
rt-t
erm
Dat
a in
sec
on
d
Mid
-ter
m
Dat
a in
ho
ur
Lon
g-te
rm
Dat
a in
wee
k
P1 P2
S1
M1
L1
S2
M2
Energ
y
Time
7.5
(t=
1ye
ar)
1 (
t=0
)3
(t=
15
min
ute
s)5
(t=
1d
ay)
tim
e (
in lo
g sc
ale
)
Design Space for hybrid energy storage (kWh)Pinch for ‘P1’ PV size
Pinch Point
Pinch Point
Pinch Point
Infeasibleregion
0.6
0.7
0.8
0.9
Infeasible
region
Feasible region
Energ
y
Feasible region
Ref: Communicated to Energy
Sizing of Hybrid Energy Storage
Sizing of hybrid energystorage for a isolatedsmall scale industry(Welding Shop)
27

Load profile generation
Max load 19.2Minimum load 0.0Average load 9.0
Load profile obtained through house
hold survey to have realistic
assessment of demand
Electricity demand – Peak in evening
but there is demand in afternoon also
Load Considered – Flour Mill, Mobile
Tower, Lighting, Entertainment Water
pumping, HH Chores activities
Load Type Power
Lighting 30 W
Entertainment 80 W
HH Chores 62 W
Water Pumping 1.4 kW
Productive Load 1 - Mobile Tower 2 kW
Productive Load 2 - Atta Chakki 4 kW
Scenario 1 (c)- Isolated Rural with biomass gasifier-battery system
28

Biomass Gasification system - battery Combination
6/23/2017
P = Power generated from Biomass gasifier systemD = Load DemandQB = Stored Energy in Battery
= represent part load power of generator
Minimum generatorrating with storage
Minimum generator
rating without
29

CoE - Continuous Vs Intermittent Operation
30

Continuous Vs Intermittent Operation –Effect of Fuel Cost
8
10
12
14
16
18
10 20 40 60 80 100 150 200 250
Co
E (R
s./k
Wh
)
Transportation distance (km.)
Effect of biomass transportation on CoE
Biomass only
Biomass + Battery
31

Design Space for Hybrid System
32

Cost Comparison for selected systems
33

34
*Load Profile of 1 household * Load Profile of each households are identical in the housing colony with 30 households
Scenario 2 : Urban (PV battery grid backup system)
Component Sizing SpecificationsPV module 26.5 kWp (104x250Wp)
1 x solar battery charger 30 kW
1 x Inverter 50 kW
Array support Rooftop Mounted
Battery VRLA
Li Ion NiCd NiMH NaS
Storage Capacity(kWh) 150 137 140 148 157
Parameter ValueTotal energy 250 kWh/day
Peak load 43 kWAverage load 10.4 kW

Costing PV & Balance of System
35
#1 PV prices : IRENA Renewable Power Generation Costs in 2014
PV Price37%
Battery Price31%
Balance of system
32%
Investment Cost
Assume, d = 10%;O&M PV & BoS = 1% p.a
Item Investment Cost (Million ₹)
Life Annualised life cycle costing(Million ₹)
PU electricity cost
PV Panel Ground mounted(0.9USD/W)#1
1.55 25 years 0.186 ₹5
Balance of System (0.8USD/W)#1
1.378 10 0.234 ₹7
Total 2.928 - 0.424 ₹12

Comparison of PV with different battery pu cost
37
Battery options
Battery size
(kWh)
Battery Cost ₹/kWh
Capital Cost (Million ₹)
Battery ₹/kWh
p.u cost of PV & BoS(₹/kWh)
Total p.ucost of the PV battery system (₹/kWh)
VRLA 150 8650 1.298 9 12 21
Li ion 137 37387 5.122 19 12 31
NiCd 140 36904 5.166 23 12 35
NiMH 148 66346 9.819 86 12 98
NaS 157 33000 5.181 19 12 31
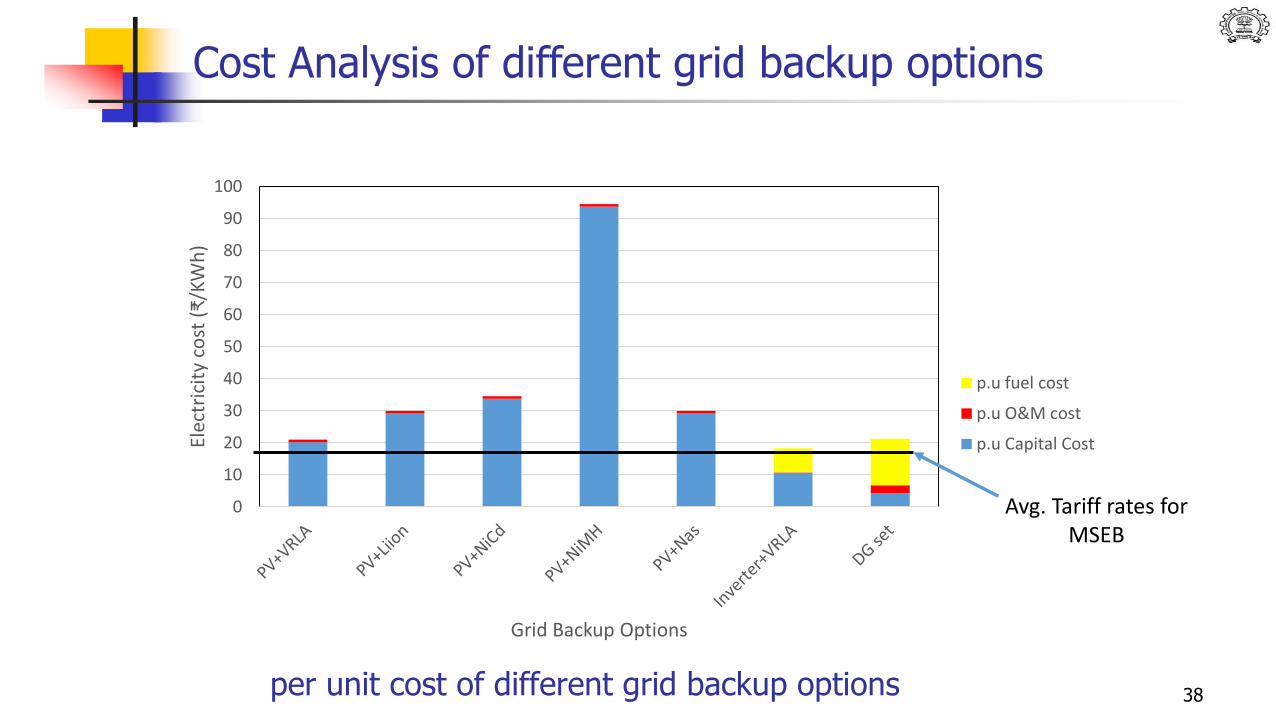
per unit cost of different grid backup options 38
Cost Analysis of different grid backup options
0
10
20
30
40
50
60
70
80
90
100El
ectr
icit
y co
st (
₹/K
Wh
)
Grid Backup Options
p.u fuel cost
p.u O&M cost
p.u Capital Cost
Avg. Tariff rates for MSEB

Cradle to grave energy flow diagram
39
Silicon ProductionPV Cell manufacturing
Fabrication of Frameless PV modules
Material Production Energy
BatteryPV
ModuleBalance
of System
Raw materialsSteel,Al,Lead,Polypropylene
Frame productionInverter and
charge controller components
Manufacturing Energy
BatteryPV
ModuleBalance
of System
Transportation Energy
PV Battery Microgrid
system
Recycling Energy
Material recycling
Waste disposalEmissions to air,water

Life cycle energy analysis boundary for the PV battery system
Raw material production
Electrical and thermal energy
Production
Consumable production
External Scrap supply
Battery
PV module
Balance of System
System components
Material Production
Component Manufacturing
Electricity and heat
Manufacturing
Cradle to gate
Transportation
Decommissioning and recycling of
the system
Transportation Energy
Recycling Energy
Cradle to grave
40

Energy flow diagram for PV battery system
PrimaryFossil
Energy
Production and transport of
Frame and array support
Production and transport of solar charge controller
Production and transport of
battery
Production and transport of
Inverter
Eind,2(BOS)
/tBOS
Eind,1(PV)
Eind,2(BOS)
Eind,3(CH)
Production and transport of
PV array
Eind,4(B)
Eind,5(INV)
Eind,3(CH)
/tCH
Eind,4(B)
/tB
Eind,5(INV)
/tINV
Frame and array supportηBOS, tBOS
Solar Energy
Solar charge controllerηCH, tch
BatteryηB, tB
InverterηI, tI
Energy Output
PV arrayηPV, tPV
Conversion to electricity,αpf,elec=0.35
Conversion to heat,αpf,heat=1
Eind,1(PV)
/tPV
Indirect Energy Input to the system
Direct Energy Input
Legend:Eind – Indirect Energyt - service life (years)η - efficiencyαpf - conversion efficiency
41

Summary of battery energy values in Indian context
Battery Configuration
MaterialProduction Energy Emp
ManufacturingEnergy Emnf
Recycling EnergyErec
Transportation Energy-Etr
for finished product import
Etot=Ectg+ Etr
(MJpf/Wh)
MJpf/kgRecycled materials
MJpf /Wh(Recycled materials)
MJpf
/kgMJpf /Wh MJpf /kg MJpf /Wh (MJpf /kg) (MJpf
/Wh)
VRLA 21.87 0.681 11.6 0.385 2.4 0.075 - - 1.141
LFP-G 96.27 1.05 30 0.33 3.6 0.04 2.9 0.031 1.451
Nickel Metal Hydride(AB2)
41.99 0.763 75 1.36 19.6 0.36 0.988 0.018 2.501
Nickel Metal Hydride(AB5)
33.12 0.602 75 1.36 19.6 0.36 0.988 0.018 2.34
Nickel Cadmium 64.72 1.58 46 1.15 4.85 0.121 - - 2.851
Sodium Sulphur 128.31 0.855 56 0.373 - - 1.34 0.0089 1.24
Lithium Sulphur 242.06 1.59 172 1.13 51.2 0.34 - - 3.06

Energy Flow diagram of the PV panel for India
Quartz Mining 0.85 MJ/kg of
Quartz
Metallurgical Grade(MG) Silicon
188.30 MJ/kg-MG Si
Solar(Electronic) Grade Silicon 1778.78 MJ/kg-EG Si
Czochralski Single Crystal process
production2977.89 MJ/kg CZ-sc-Si
Casting of multi crystalline Silicon 3160.69 MJ/kg mc-Si
Silicon Wafer Production
Silicon Cell Production
2946.52 MJ/m2 of wafer area
3157.82 MJ/m2 of solar cell area
Frame
Panel and laminate assembly
BOS Electrical Installation
PV system
3107.14 MJ/m2 of panel area
Aluminium
Glass, Copper
Aluminium,Steel
Manufacturing Energy
InverterCharge controller
Zinc, Steel,Copper
49.9 MJ/m2 of panel area
507.7 MJ/m2 of panel area
422.22 MJ/m2 of panel area
149.17 MJ/kWp
1074.11 MJ/kWe
Growing of Silicon
Panel Production
43

Summary of photovoltaic panel energy values in Indian context
Component MaterialProduction Energy
ManufacturingEnergy of PV
panel,frame and BOS
Transportation Energy
PV system (polycrystalline-
Silicon)
3107.14MJpf/m2 of
sensing area
49.9 MJpf/m2 of
panel area
0.34 MJpf/kg of panel weight
Frame422.22 MJpf/m
2 of frame area
Balance of System(BOS)
507.7 MJpf/m2 of
panel area
Electrical Installation
149.17 MJpf/kWp
Charge Controller
1074.11 MJpf/kWe
Inverter 1074.11 MJpf/kWe44

Total Energy requirement for the components
Component Life(years) Material Production
Energy-Emp
Manufacturing Energy-
Emnf
Recycling Energy(Erec)
Transportation
Energy(Etr)GJpf GJpf GJpf GJpf
PV module(Polycrystalline Silicon)
25 542.8
8.7
- 0.9
Frame 25 9 1.4Balance of System 25 88.1 - -
Electrical Installation 25 3.9 - -Charge Controller 10 32.2 32.2 -
Inverter 10 53.6 53.6 -Batteries
VRLA 5 102.1 54.1 11.2 -LFP-G 13 145.8 45.1 5.4 4.4
Nickel Metal Hydride(AB2)
4 113.1 20.2 52.8 2.7
Nickel Metal Hydride(AB5)
4 89.2 20.2 52.8 2.7
Nickel Cadmium 3 254.9 18.1 19.1 -Sodium Sulphur 15 119.7 52.2 - 1.2Lithium Sulphur 5 206.7 14.7 43.7 -
45

Comparison of Energy Pay Back Time & Net Energy Ratio
0.0
0.5
1.0
1.5
2.0
2.5
3.0
3.5
4.0
EP
BT
in
ye
ars
PV+ battery technology
0
1
2
3
4
5
6
7
8
NER
PV+ battery technology
𝑁𝐸𝑅 =𝐴𝑛𝑛𝑢𝑎𝑙𝑖𝑠𝑒𝑑 𝑒𝑛𝑒𝑟𝑔𝑦 𝑜𝑢𝑡𝑝𝑢𝑡
𝐴𝑛𝑛𝑢𝑎𝑙𝑖𝑠𝑒𝑑 𝑒𝑛𝑒𝑟𝑔𝑦 𝑖𝑛𝑝𝑢𝑡
46

Results and graphs
0
1000
2000
3000
4000
5000
6000
MJp
f/kW
h o
f o
utp
ut
PV+Battery
PV ,BOS and frame battery inverter and CC
0
10
20
30
40
50
60
70
80
Perc
enta
ge o
f to
tal l
ife
cycl
eBattery
47

Sensitivity Analysis
48

Sensitivity Analysis
49

Summary
Two scenarios identified Isolated – with no grid access
Grid backup – with unreliable grid
Sizing, Design and economic analysis based on life cycle study for isolated scenario such as
PV – battery microgrid
PV – hybrid storage system
Biomass – battery microgrid
Sizing, Design, Life cycle cost and energy analysis for PV-battery grid back-up for an urban system.
Battery life impact
Net Energy Analysis 50
Conclusions
Microgrids – different contexts-urban and isolated –nearly cost effective
Reliability
Focus on large scale centralised renewables
Need for cost reduction, technology development
Hybrid storage technologies
Understanding of load variations
51
Acknowledgment
Balkrishna SurveAjit Paul A.
Thank [email protected]@gmail.com
52
Jani Das
Amit Kumar S. PariharAmmu Susanna Jacob Prakash Ghosh
IMASE

References Banerjee, Comparison of options for distributed generation in India, Energy Policy,34,pp.101-111, 2006.
http://assets.wwf.org.uk/downloads/powerofscotlandrenewed_full.pdf
ESMI, Prayas: Electricity Supply Monitoring Initiative, Prayas, http://www.watchyourpower.org/download_raw_data.php
Schnitzer, D et al., 2014: Microgrids for Rural Electrification: A critical review of best practices based on seven case studies,, United Nations Foundation, CMU and University of California, Feb. 2014. (http://energyaccess.org/wp-content/uploads/2015/07/MicrogridsReportFINAL_high.pdf)
Minigrids Electricity for all, Centrre for Science and Environment Report, 2016 (available online: http://www.cseindia.org/userfiles/mini-grids.pdf)
Solar-dc Microgrid for Indian Homes: A Transforming Power Scenario, IEEE Electrification Magazine, Volume: 4, Issue: 2, June 2016.
Jacob, A. S., Banerjee, R., Ghosh, P.C., Modelling and simulation of a PV battery grid backup system for various climatic zones of India', Proceedings of 43rd IEEE Photovoltaic Specialists Conference, PVSC 2016; Portland; United States; pp 1807-1812, Article number 7749934, June 5-10, 2016.
A. Chatzivasileiadi, E. Ampatzi, I. Knight, Renewable and Sustainable Energy Reviews, 25, 2013.
C.J. Rydh, B. A. Sandén, , Energy Conv. and Mgmt., 46, 2005
Tubular gel 2V VRLA battery Technical Manual, http://www.exideindustries.com/products/solar-batteries/tubular-solar-batteries.aspx, 19-11-2016.
A. Castillo, D.F. Gayme, Energy Conv. and Mgmt., 87, 2014.
J.M Sime, Evaluation of Nickel Cadmium Battery-Electric Subcompact Automobile in Connecticut as an Alternative for Work-trips and Commutes, Research Project: SPR-2223, 2004
NGK Insulators NaS Battery, https://www.ngk.co.jp/nas/specs, 19-11-201653