INDIAN FINANCIAL SYSTEM – AN OVERVIEW - Shodhganga
39
Chapter III INDIAN FINANCIAL SYSTEM – AN OVERVIEW Introduction The Indian financial system can be broadly classified into the formal (organized) financial system and the informal (unorganized) financial system. The formal financial system comes under the purview of the Ministry of Finance (MOF) Reserve Bank of India (RBI), Securities Exchange Board of India (SEBI) and other regulatory bodies. The informal financial system consists of: (i) Individual money lenders such as neighbors, relatives, land lords, traders, store owners and so on. (ii) Groups of persons operating as funds or ‘associations’. These groups function under a system of their own rules. (iii) Partnership firms consisting of local brokers, pawn brokers and non banking financial intermediaries such as finance, investment, chit fund companies. In India the spread of banking in rural areas has helped in enlarging the scope of the formal financial system.
Transcript of INDIAN FINANCIAL SYSTEM – AN OVERVIEW - Shodhganga
Chapter III
INDIAN FINANCIAL SYSTEM – AN OVERVIEW
Introduction
The Indian financial system can be broadly classified into the formal
(organized) financial system and the informal (unorganized) financial system.
The formal financial system comes under the purview of the Ministry of
Finance (MOF) Reserve Bank of India (RBI), Securities Exchange Board of
India (SEBI) and other regulatory bodies. The informal financial system
consists of:
(i) Individual money lenders such as neighbors, relatives, land lords,
traders, store owners and so on.
(ii) Groups of persons operating as funds or ‘associations’. These groups
function under a system of their own rules.
(iii) Partnership firms consisting of local brokers, pawn brokers and non
banking financial intermediaries such as finance, investment, chit
fund companies.
In India the spread of banking in rural areas has helped in enlarging the
scope of the formal financial system.
66
Components of formal financial system
Formal financial system consist of four segments, these are financial
institutions, financial markets, financial instruments and financial services.
Financial institutions are intermediaries that mobilize the savings and facilitate
the allocation of funds in an efficient manner. Financial institutions are
classified as banking and non banking financial institutions. Banking
institutions are creator of credit while non banking financial institutions are
purveyors of credit. In India non banking financial institutions namely the
Development Financial Institutions (DFIs) and Non Banking Financial
Companies (NBFCs) as well as Housing Finance Companies (HFCs) are the
major institutional purveyors of credit.
Financial institutions are further classified as Term Finance Institutions
such as Industrial Development Bank of India (IDBI), Industrial Credit and
Investment Corporation of India (ICICI), Industrial Financial Corporation of
India (IFCI), Small Industries Development Bank of India (SIDBI) and
Industrial Investment Bank of India (IIBI). Specialized finance institutions like
the Export Import Bank of India (EXIM), Tourism Finance Corporation of
India (TFCI), ICICI Venture, Infrastructure Development Finance Company
(IDFC) and sectoral financial institutions such as National Bank for
Agricultural and Rural Development (NABARD) and National Housing Bank
(NHB). Investment institutions in the business of mutual funds (UTI, Public
Sector and Private Sector Mutual Funds) and insurance activity (LIC, GIC and
67
its subsidiaries) are also classified as financial institutions. There are state level
financial institutions such as State Financial Corporation and State Industrial
Development Corporation (SIDCs) which are owned and managed by the State
Governments.
Financial markets are a mechanism enabling participants to deal in
financial claims. Money market and capital market are the organized financial
markets in India. Money market is for short term securities while capital
market is for long term securities. Primary market deals in new issues, the
secondary market is meant for trading in outstanding or existing securities.
Financial instrument is a claim against a person or an institution for the
payment at a future date a sum of money or a periodic payment in the form of
interest or dividend. Financial instruments may be primary or secondary
securities. Primary securities are issued by the ultimate borrowers of funds to
the ultimate savers e.g. Bank Deposits, Mutual Fund Units, Insurance Policies,
etc. Financial instruments help the financial markets and the financial
intermediaries to perform the important role of channelising funds from leaders
to borrowers.
Financial services include merchant banking, leasing, hire purchase,
credit rating etc. Financial services rendered by the financial intermediaries’
bridge the gap between lack of knowledge on the part of the investors and
increasing sophistication of financial market and instruments.
68
The four components are interdependent and they interact continuously
with each other. Their interaction leads to the development of a smoothly
functioning financial system.
Savings and Investment
Saving is abstaining from present consumption for a future use. Savings
are sometimes autonomous coming from households as a matter of habit but
the bulk of the savings come for specific objectives like interest on income,
future needs, contingencies, precautionary purposes, growth in future wealth,
leading to rise in the standard of living etc.
Investment is the exchange of the money or cash for a future claim on
money or the purchase of a security or a promise to pay at a later date along
with a regular income as in the case of a share, bond, debenture etc. Investment
is also a service like consultancy, construction, hotel or hospital and services in
future as in the case of consumer durables.
Securities purchases are investment for the economy and some
investments are offset by corresponding disinvestments. Gross investments are
total investments made from all sources by an economy or a single economic
unit and net investment are those which are gross investment minus
disinvestments for an economic unit. Gross Assets and Investments minus
Depreciation for the economy or a company or corporate sector or government
sector is net investment, which is termed as capital formation.
69
Changes or fluctuations in economic activity may occur when
investment spending is greater or smaller than the savings at a given level of
income. The resources going into the productive process, i.e. capital formation,
may have direct relationship with economic growth. All economic activities –
agricultural, industrial or services – depend on the availability of financial
resources. The amount of financial resources and the volume of capital
formation depend upon the intensity and efficiency with which savings are
encouraged, gathered and directed towards investment.
Investment purpose
The investment purpose of public may be set out in terms of their
savings for:
(i) Transactions purpose (for daily needs or regular payments)
(ii) Precautionary purposes (for contingencies or special needs)
(iii) Speculative or asset purposes (for capital gains and building of
assets).
Investment for Consumption and Business
The income is divided into two components namely Consumption and
Investment. The amounts not consumed are saved and invested. Investments
are also useful for present and future consumption in the case of consumer
durables, cars, gold and silver etc. Investments generally promote larger
70
consumption in future as they lead to more income and larger capital
appreciation in the years to come.
Investment and speculation
Purchases of assets like shares and securities can be for either
investment or speculation or for both. Investment is long term in nature while
speculation is short term. All investments are risky to some extent but
speculation is most risky as it involves short term trading, buying and selling
which may lead to profits sometimes and losses at other times.
Financial Investment and Physical Investment
The savings at household sector which account for the bulk of savings
are measured by the total financial savings and savings in physical assets. The
savings in financial form include savings in currency, bank deposits, non bank
deposits, life insurance funds, provident and pension funds, claims on
government, shares and debentures, units of UTI, mutual funds and trade debts.
The currency and deposits are voluntary savings and motivated by transactions
and precautionary motives and are governed by income and other incentives.
The savings in life insurance, provident fund and pension fund are contractual
savings governed by precautionary and contingency motives. The claims on
government are compulsory deposits, tax credits and investment in government
bonds, etc. The savings in the form of units, shares and debentures etc are
71
voluntary savings and are used for investment in the business sector directly or
indirectly.
The gross savings of the household sector is around 19 percent of the
GDP. This constitutes more than one third is in physical assets and three fourth
in financial assets. The savings in physical form include agricultural
implements, tools, tractors, consumer durables, gold, silver etc among the rural
households and such items as real estate, buildings etc among all house holds.
The savings in physical form are less productive while savings in financial
form are more productive in various degrees depending on the efficiency of
their rise.
The household sector in India has emerged as the single most important
contributor to Gross Domestic Savings. A sustained annual growth rate of 10
percent can be achieved with the right policies aimed at increasing the domestic
savings on the one hand and attracting a larger flow of capital from abroad, on
the other.
Investment avenues
There is large number of investment avenues for savers in India. Some
of them are marketable and liquid while others are more risky and less safe.
Risk and return are the major characteristics which an investor has to face and
handle. The investor has to choose proper avenues from among them
72
depending on his objectives, preferences, needs and abilities to take the
minimum risk and maximize the returns.
Return
Return being prime mover to induce investment and probably is one to
sustain it. Market participants are always tempted to scout for better investment
alternatives for higher return or yield. But the measurement of investment
return has an uphill task with investment literature because presence of idio
syncratic variables with regard to periodicity of return measurement and
performance – return horizon. If the two coincides (which never do) the
measurement criteria become very simple and straight forward.
Risk
Commensurate to investment objectives risks distracts investment flows
with added agility. Conservatism is embedded in investors psychological
texture while making investment decisions. Portfolio investment is primarily
designed to mitigate risk through diversification.
Risk and Return Relationship
Risk and returns are positively related variables. These go along in the
investment process: A higher return is always accompanied with a larger risk
so that lower risk yields lesser return. Under such circumstances investors face
dilemma as to preference for one and distraction for other. Therefore one is
73
destined to face the drama orchestrated by the risk return duo. Preference for
one over the other determines the contour of investment philosophy followed
by investors and fund managers. A conservative investor pre-empts risk
reduction over return magnifications and thus search for such investments
alternatives commensurate with given level of risk tolerance. Aggressive
investors on the other hand pay more weight to return magnification and
readily been the risk accompanied thus scout for investment alternatives
commensurate on this risk return tolerance and preference.
The investor has to choose proper avenues from among them depending
on his objectives, preferences, needs and abilities to take the minimum risk and
maximize the returns.
The financial investment avenues are classified under the following
heads:
1. Corporate Shares, Debentures, Deposits, etc.
2. Bank Deposits and Schemes
3. UTI and Mutual Fund Schemes.
4. Post Office Deposits/Certificates, etc
5. Government and Semi-Government Bonds/Securities
6. PSU Shares and Bonds.
74
Recent Trends in Indian Securities Market
Transfer of resources from those with surplus resources to others who
have a productive need for them is perhaps the most efficiently achieved
through the securities markets. Securities market provide channels for
allocation of savings to investment and thereby decouple these two activities.
As a result, the savers and investors are not constrained by their individual
abilities, but by the economy’s abilities to invest and save respectively, which
investably enhances savings and investments in the economy. Securities
markets channel the savings to the most productive investments which
increases the rate of return on investments. Thus the securities market fosters
economic growth by augmenting the quantities of real savings and capital
formation from any given level of national income and also by raising the
productivity of investments by improving allocation of investible funds.
The securities market has two interdependent and inseparable segments,
the new issues (primary) and the stock (secondary) markets. The primary
market provides the channel for scale of new securities while the secondary
market deals in securities previously issued. The prime signals, which subsume
all information about the issuer and his business including associated risk,
generated in the secondary market, help the primary market in allocation of
funds.
75
The issuers of new securities in the primary market to raise funds for
investment and/ or to discharge some obligation. They do so either through
public issue or private placement. It is a public issue if any body and every
body can subscribe for the securities. If the issue is made to select people, it is
called private placement. If the securities are issued exclusively to the existing
shareholders it is called ‘rights issue’. If a public issue of the offer is made to
public at large.
There are two major types of issuers who issue securities. The corporate
entities issue mainly debt and equity instruments (shares, debentures, etc) while
the governments (central and state governments) issue debt securities (dated
securities and treasury bills).
The securities market has essentially three categories of participants,
namely the issuers of securities, the investors in securities and the
intermediaries. The issuers and the investors are the consumers of services
rendered by the intermediaries while the investors are consumers of securities
issued by the issuers. Those who receive funds in exchange of securities and
those who receive securities in exchange for funds often need the reassurance
that it is safe to do so. This reassurance is provided by law and custom often
enforced by the regulator. The regulator ensures a high standard of service
from the intermediaries and supply of quality securities and non manipulated
demand for them. In the Indian context the regulators have an additional
76
responsibility of developing the market and also the responsibility of protecting
the interest of investors in securities.
There are three main sets of entities depend upon securities market. The
corporate and governments raise resources from the securities markets to meet
their needs of investment and the house holds invest their savings in the
securities. During 2003-04, corporate sector and governments together raised a
total of Rs.267660 crores from the securities market while the household sector
invested Rs.2254 crore of their financial savings through securities market.
The central government and the state governments nowadays finance about two
third and one third of their fiscal deficits respectively through borrowings from
the securities market. Corporate sector finances about one third of its external
finance requirements through the securities market. The household invest about
six per cent of their financial savings in securities
The societies for capital market research and development carries out
periodical surveys of households to estimate the number of investors. The first
survey was carried out in 1990 which placed the total number of share owners
at 90-100 lakh. Their second survey estimated the number of share owners at
around 140-150 lakh by mid 1993. Their latest survey estimates the number of
share owners at around 2 crore by 1997 end. Approximately half of the share
owners at the end of 2000 had, for the first time entered the market.
77
According to the first SEBI-NCAER survey of Indian investors 1999, an
estimated 12.8 million or 7.6% of all Indian households representing 19 million
individuals had directly invested in equity shares and debentures at the end of
financial year 1998-1999. More than 156 million or 92% of all Indian
households were non investor households who did not have any investments in
equity/debentures. The lack of awareness about securities market and absence
of dependable infrastructure and distribution network coupled with aversion to
risk prevents the non-investor house holds from investing in the securities
market. An estimated 15 million (nearly 9%) of all households representing at
least 23 million unit holders had invested in units of mutual funds.
According to the second SEBI-NCAER Survey conducted in late 2000,
13.1 million or 7.4% of all Indian households representing 21 million
individuals directly invested in equity shares and or debentures during the
financial year 2000-2001. There were 19 million unit holders who had
invested in units of MF’s in 2000-01. Of the 48 million urban households an
estimated 8.8 million households (18%) representing 13 million urban investors
owned equity shares and/or debentures. Of the 121 million rural households
only about 4 million households or 3% representing nearly 6 million rural
investors owned these instruments.
An indirect but very authentic source of information about distribution
of investors is the data base of beneficial accounts with the depositories. At the
78
end of March 2004 there were 5.2 million and 0.6 million beneficial accounts
with the National Securities Depository Limited (NSDL) and Central
Depository Services (India) limited (CDSL) respectively.
Average annual capital mobilization by non government public
companies from the primary market is about Rs.70 crore in 1960s and about
Rs.90 crore in the 1970s, increased manifold during the 1980s, with the amount
raised in 1990-91 being Rs.4312 crore.
The Indian Household investor’s Survey 2004 conducted by SCMRD
has found that there has been great improvement in the general public
perception about capital market regulation in India. The availability of good
public issues (particularly PSU disinvestments) with the improved perception
about regulatory effectiveness attracted the attention of investors to public
issues.
Indian market is getting integrated with the global market through in a
limited way through euro issues. Since 1992 when they were permitted access,
Indian companies have raised over Rs.40, 000 crores through ADR/GDR and
ECBs.
The market is getting institutionalized as investors prefer mutual funds
as their investment vehicle, thanks to the evolution of a regulatory framework
for MFs, tax concessions offered by government and preference of investors for
passive investing. Though the MF industry was opened up to private sector

79
only in the 1990s, the private sector MFs accounts for three fourth of the assets
under management.
The primary issues of the central government securities have increased
manifold during the decade of 1990s from Rs.8989 crore in 1990-91 to
Rs.147636 crore in 2003-04. The yield on government securities has been
declining over the years due to soft interest rates, comfortable liquidity and
RBI undertaking substantial private placement. There is a conscious effort to
elongate the maturity profile of the government securities issuing longer dated
securities. The average maturity of securities issued in 2003-2004 increased to
14.94 years with the highest tenor being 30 years.
Stock Market Growth
The number of stock exchanges in India increased from 11 in 1990 to 23
now. All the exchanges are fully computerized and offer 100% on line trading.
9359 companies were available for trading on stock exchanges at the end of
March 2004. The trading platform of the stock exchanges was accessible to
9368 stock brokers 829 derivative brokers and 12815 sub brokers from over
400 cities on the same time. The market capitalization grew ten fold between
1990-91 and 1999-2000. It declined thereafter following major market
misconduct. It however picked up in 2003-2004 to Rs.13, 77, 612 crores which
indicates the size of the market increased sharply to 60% by March 2000.
Traditionally manufacturing companies and financial services sector accounted
80
for a major share in market capitalization. However in the recent past, the
importance of these traditional sectors has declined and new sectors like
information technology, pharmaceuticals and fast moving consumer goods
have picked up.
The trading volumes on exchanges have been witnessing phenomenal
growth during 1990s. The average daily turnover grew from about Rs.150
crore in 1990 to Rs.12000 crore in 2000. The turnover ratio which reflects the
volume of trading in relation to the size of the market has been increasing by
leaps and bounds after the advent of screen based trading system by the NSE.
The turnover ratio for the year 2000-01 increased to 448 but fell substantially
to 118 during 2003-04. The average trade size in the equity segments of the
changes was about Rs.27000 during 2003-04. NSE is the market leader with
over 89% of the total turnover in 2003-04.
Derivative Trading
Derivatives trading commenced in India in June 2000. The exchange
traded derivatives witnessed a volume of Rs.21, 42, 920 crores with about 6
crore contracts during 2003-04. While NSE accounted for about 99.4% of the
total turnover, BSE accounted for the balance. Mumbai contributed for about
48% of the total turnover indicating the all India participation in the derivatives
market. Both in terms of number of contracts traded and national turnover in
stock futures, NSE tops the list of world’s derivative exchanges. It is observed
81
that future are more popular than options; contracts on securities are more
popular than those on indices, call options are more popular than put options,
and near month contracts are more popular than not so near month contracts.
In order to get rid of ills of paper based securities and promote
dematerialisation of securities, though the investors have a right to hold
securities in any form, the regulator introduced some kind of compulsion
through trading and settlement. At the end of March 2004 there are two fully
operational depositories with about 4000 depository participants offering
depository services from over 2000 locations. The growth of dematerialisation
is considered as a success story in Indian securities market as there are about
six million beneficial accounts with these depositories.
The aggregate turnover in central and state government dated securities,
including treasury bills, through SGL transactions increased 50 times
between1994-05 and 2003-04. During 2003-04 it reached a level of
Rs.26,39,244 crore, higher than the trading volumes in cash or derivatives
segments of all exchanges in the country, reflecting deepening of the market.
Reforms in securities market
Given the importance of securities market in the economy and the need
of the economy to grow at the projected rate of six percent to eight percent per
annum the authorities have been promoting the securities market as an engine
of growth to provide an alternative but efficient means of resources
82
mobilization. Authorities have effected fundamental institutional changes in the
market design in the last decade resulting in drastic reduction in transaction
costs and significant improvements in efficiency, transparency and safety. They
have ushered in as much as ten special legislative interventions during the last
decade to support the reforms in the securities market, which is the most
reformed sector in the Indian economy today. It acquired the first ever
autonomous regulator in India. It gave birth to the first ever demutualised stock
exchange in the world. It used satellite based communication technology for
securities for the first time. It started real time live position monitoring of
brokers. It is the first to introduce the straight through processing in securities
transactions and has implemented T+2 rolling settlement. In many areas such
as biometric based identification of market participants, disclosure and
accounting standards, corporate governance rating etc have been introduced.
The Indian securities market is either the first or the best in the world.
These have yielded considerable benefits to the market as evidenced by the
growth in the number of market participants, growth in the volumes of
securities transactions, increasing globalisation of Indian market, reducing in
transaction costs and the level of compliance with international standards.
In order to improve market efficiency, enhance transparency, prevent
unfair trade practices and bring the Indian market up to international standards
a package of reforms consisting of measures to liberalize, regulate and develop
83
the securities market is being implemented since early 1990s. The issuers
complying with the eligibility criteria were allowed freedom to issue the
securities at market determined rates. The market shifted formally and
completely from merit based regulation to disclosure based regulation.
Domestic issuers/investors were allowed choice to raise resources/invest
within/across the borders. Overseas issuers and investors were granted access
to Indian market. The secondary market over came the geographical barriers by
moving to screen based trading. The trading system is now accessed
through10000 trading terminals spread across more than 400 cities/towns in the
Indian sub continent and also through the internet and hand held mobile
devices from all over the world. All kinds of securities debt and equity,
government and corporate – are traded side by side. Traders enjoyed counter
party guarantee. The trading cycle shortened to a day and trades are settled
within 2 working days while all deferral products were banned. Physical
security certificates almost disappeared. A variety of derivatives were
permitted corporate governance practices improved significantly (Table Market
Design)
Securities
The issue of capital to public by Indian companies is governed by the
Disclosure and Investor Protection (DIP) Guidelines of SEBI. The guidelines
provide norms relating to eligibility for companies issuing securities, pricing of
84
issues, listing and disclosure requirements, lock in period for promoters
contribution, contents of offer documents, pre and post issue obligation.
Capital Market Indicators
Eligibility
An unlisted company can make public issue of equity shares or any
other security convertible into equity shares, on fixed price basis or on book
building bias provided –
(i) It has net tangible assets of at least Rs.3 crore in each of the
preceding 3 years.
(ii) It has a pre-issue net worth of not less than Rs.1 crore in each of the
preceding 3 years.
(iii) It has a track record of distributable profits for at least 3 out of the
preceding 5 years and
(iv) The aggregate size of the issues made during the same financial year
and the proposed issue does not exceed 5 times its pre issue
networth.
An unlisted company cannot make allotment of the prospective allottees
is less than 1000. A listed company can access market in a financial year to
raise resources up to 5 times of its pre-issue net worth. If the company listed or
85
unlisted does not meet the above criteria the issue can be made only if it
satisfies two conditions: a) the issue is made through book building with
minimum offer of 50% of the issue size to Qualified Institutional Buyers or the
project has participation of at least 15% from FIs and 10% is allotted to QIBs
and (b) the minimum post issue face value of capital of the company is Rs.10
crore or there is market making for at least 2 years from the date of listing.
These provisions do not apply to a banking company, an infrastructure
company and right issue by a listed company.
Pricing of Securities
An eligible company is free to make public/rights issue of securities of
any denomination and at any price. It can issue the equity shares in the firm
allotment category at a different price than the price at which net offer to public
is made provided the former price is higher than the latter. It has option to
determine the price and justify the same in prospectus or may allow investors
to determine the price through book building. An eligible company is free to
make public or rights issue of equity shares in any denomination. However in
case of Initial Public Offer (IPO) by an unlisted company, the face value can be
less than R.10 (but not less than Re.1) if the issue price is Rs.500, the face
value shall be Rs.10.
The admission to a depository for dematerialisation of securities is a
prerequisites for making a public or rights issue or an offer for sale. The
86
investors have the option of subscribing to securities in either physical for
dematerialized form. All new IPOs are compulsory traded in dematerialized
form. Every public listed company making IPO of any security for Rs.10 crore
or more is required to do so only in dematerialized form. A company cannot
make a public issue unless it has made an application for listing of those
securities with stock exchanges).
Government Securities
The issue is governed by the terms and conditions specified in the
general notification of the government and also the terms and conditions
specified in the specific notification issued in respect of issue of each security.
Government issues securities with fixed coupon rates, floating rate bends, zero
coupon bonds and securities with embedded derivatives. The securities are
issued through auction either on price basis or yield basis.
Trading Platform
The stork exchanges, recognized under the Securities Contract
Regulation Act, are the exclusive centres for trading securities. Though the area
of operation/jurisdiction of an exchange was being specified at the time of its
recognition, they have been allowed to set up trading terminals anywhere in the
country. OTCEI, NSE and ICSE were permitted since their inception to have
nation wide trading. With the extensive use of information the trading
87
platforms of few exchanges are also accessible from any locations through the
internet and mobile devices.
Exchange Management
Mumbai, Ahamedabad, Madhya Pradesh Stock exchanges are organized
in the form of ‘Association of Persons while the balance 20 are organized as
companies either limited by guarantee or by shares. Except NSE all exchanges
are not for profit organisations. Most of the stock exchanges in the country are
organized as ‘Mutuals’ which was considered beneficial in terms of tax
benefits and matters of compliance. The trading members who provide
brokering services also own, control and manage the exchanges. In the
demutualised exchange, the ownership and management and the trading
membership are segregated and vested generally with different set of persons.
The exchanges (except NSE and OTCEI who are already demutualised) have
been mandated by the securities laws (Amendment) Act 2004 to demutualised
and corporatise themselves by an appointed date.
Membership
The trading platform of an exchange is accessible only to brokers. They
execute trade on exchanges either on their own account or on behalf of their
clients. Demutualised exchanges allow free entry and exit of brokers. No stock
broker or sub broker is allowed to buy, sell or deal in securities unless he or she
holds a certificate of registration granted by SEBI. The standards for
88
admission of members stress on factors such as corporate structure, capital
adequacy, track record, education, experience etc and reflect a conscious
endeavour to ensure quality broking services. Out of 9368 brokers registered
with SEBI (March 2004) 3787 were corporate entities. There were 12815 sub
brokers also registered with SEBI.
Listing
A company seeking listing satisfies the exchange that at least 10% of the
securities subject to a minimum of 20 lakh securities, were offered to the public
for subscription, the size of the net offer to the public (ie. the offer price
multiplied by the number of securities offered to the public, excluding
reservations, firm allotment and promoters’ contribution_ was not less than
Rs.100 crore and the issue is made only through book building method with
allocation of 60% of the issue size to the qualified institutional buyers.
Otherwise it is required to offer at least 25% of the securities to the public. The
company is also required to maintain the minimum level of non-promoter
holding on a continuous basis. The basic norms for listing of securities on the
stock exchanges are uniform for all the exchanges. The listing agreements
prescribes a number of requirements to be continuously complied with by the
issuers for continued listing and such compliance is monitored by the
exchanges. It also stipulates the disclosures to be made by the companies and
the corporate governance practices to be followed by them. SEBI has been
89
issuing guidelines/circulars prescribing certain norms to be included in the
listing agreement and to be complied with by the companies. According to
Delisting guidelines, a listed company can voluntarily delist its securities from
a stock exchange after providing an exit opportunity to holders of securities at a
price determined through reverse book building.
The new clause 49 of the listing agreement relating to the corporate
governance has been finally notified with immediate effect. This class though
notified and amended earlier was put under suspension on account of certain
difficulties faced.
Capital Market Indicators
Turnover
BSE + NSE Rs. 172583 Crores
Market capitalisation BSE Rs. 1698428 Crores
Market capitalisation NSE Rs 1585585 Crores
Foreign Institutional Investors equity flow Rs 7502 Crores
Trading mechanism
The exchanges provide an online fully automated screen based trading
system (SBTS) where a member can punch into the computer quantities of
securities and the prices at which he likes to transact and the transactions is
executed as soon as it finds a matching order from a counter party. SBTS
90
electronically matches orders on a strict price/time priority and hence cuts
down on time cost and risk of error as well as on fraud thereby resulting in
improved operational efficiency. It allows a large number of participants,
irrespective of their geographical locations to trade with one another
simultaneously improving the depth and liquidity of the market. It provides
full anonymity by accepting orders, big or small from members without
revealing their identity thus providing equal access to everybody. Trading
platform is also accessible to an investor through the internet and mobile
services such as WAP.
Trading Rules
SEBI has framed regulations to prohibit insider trading as well as unfair
trade practices. The acquisitions and takeovers are permitted in a well defined
and orderly manner. The companies are permitted to buy back their securities
to improve liquidity and enhance the shareholders wealth.
Demat Trading
There are two fully developed depositories which maintain and transfer
ownership records in electronic form for the entire range of securities. A large
variety of instruments including all securities and money market instruments
are held in depositories. Investor is sovereign under the depository legislation
which gives him the right to hold the securities in physical form or demat form.
The depositories operate under the depositories Act, 1996 and SEBI
91
(Depositories and Participants Regulation) 1996. Stamp duty on transfer of
demat securities have been abolished. Securities held in depositories are freely
transferable. The admission to depository for dematerialisation of securities has
been made a prerequisite for making a public or rights issue or an offer for sale.
It has been made compulsory for public listed company making initial public
offer of any security for Rs.10 crore.
Charges
The investors directly on indirectly pay different kinds of charges for
securities transactions. These are ultimately paid to the exchange depositories,
SEBI, state governments and central government. The Securities Transaction
Tax (STT) is payable by the brokers. The maximum brokerage a trading
member can levy in respect of securities transactions is 2.5% of the contract
price exclusive of statutory levies like SEBI fee, service tax nd stamp duty.
Stamp duties are payable as per the rates prescribed by the relevant state. A
depository is required to pay a registration fee of Rs.25 lakhs and an annual fee
of Rs.10 lakhs to SEBI while a Depository Participant (DP) is required to pay a
registration fee of Rs.1 lakh and an annual fee of Rs.1000.
Trading Settlement
The trades accumulate over a trading cycle of one day and at the end of
the day, these are clubbed together and positions are netted and payment of
92
cash and delivery of securities settle the balance after 2 working days. All
trades executed on day “T” are settled on T+2 day.
Regulatory framework
The four main legislations governing the securities markets are (1) SEBI
Act 1992 which established SEBI to protect investors and develop and regulate
securities market, (2) The companies Act 1956 which sets out the code of
conduct for the corporate sector in relation to issue, allotment and transfer of
Securities and disclosures contracts (Regulation) Act 1956 which provides for
regulation of transactions in securities through control over stock exchanges
and (4) The Depositories Act 1996 which provides for electronic maintenance
and transfer of ownership of demat securities.
Regulators
The responsibility for regulating the securities market is shared by
Department of Economic Affairs (DEA), Ministry of Company Affairs
(MoCA), SEBI and Reserve Bank of India (RBI). The activities of these
agencies are co-ordinated by High level committee on Capital and Financial
markets. The orders of SEBI under the securities laws are appellable before
Securities Appellate Tribunals (SAT). The orders of the SAT are appellable
only before the Supreme Court on points of law.
93
The powers of the Department of Economic Affairs under the SCRA are
concurrently exercised by SEBI. The SEBI Act and Depositories Act are
mostly administered by SEBI. The rules under the securities laws are framed
by government while the regulations are framed by SEBI. The powers under
the companies Act relating to issue and transfer of securities and non payment
of dividend are administered by SEBI in case of listed public companies and
public companies proposing to get their securities listed.
The securities market uses the services of a large variety of
intermediaries to bring the suppliers of funds and suppliers of securities. All the
intermediaries in the securities market are now registered and regulated by
SEBI. A code of conduct has been prescribed for each intermediary as well as
for their employees in the regulations; capital adequacy and other norms have
been specified, a system of monitoring and inspecting their operations has been
instituted to enforce compliance; and disciplinary actions are being taken
against them for violating any regulation. All the intermediaries in the market
are mandated to have a compliance officer who reports independently to SEBI
about any non-compliance observed by him.
Globalisation and Capital Market Reforms in India
Globalisation aided by rapid absorption of technology has integrated
financial markets as never before. Equity culture has therefore to address
global issues as well. As it was impossible to leave and operate efficiently in
94
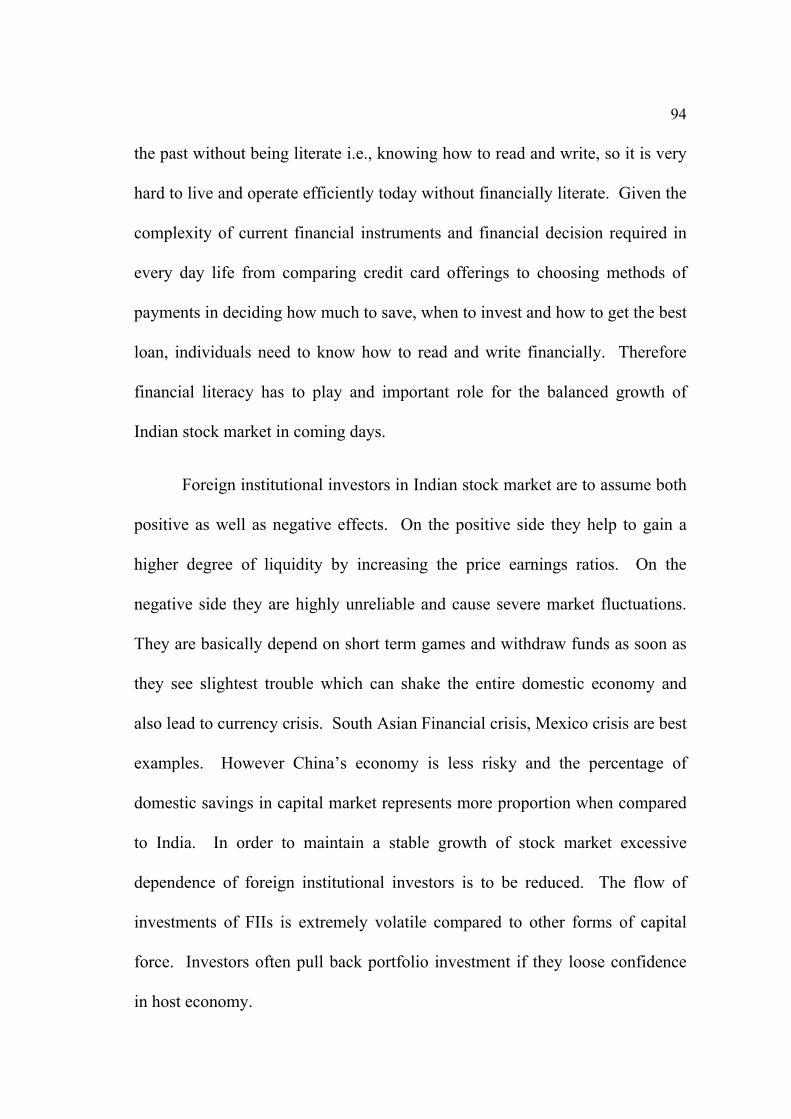
the past without being literate i.e., knowing how to read and write, so it is very
hard to live and operate efficiently today without financially literate. Given the
complexity of current financial instruments and financial decision required in
every day life from comparing credit card offerings to choosing methods of
payments in deciding how much to save, when to invest and how to get the best
loan, individuals need to know how to read and write financially. Therefore
financial literacy has to play and important role for the balanced growth of
Indian stock market in coming days.
Foreign institutional investors in Indian stock market are to assume both
positive as well as negative effects. On the positive side they help to gain a
higher degree of liquidity by increasing the price earnings ratios. On the
negative side they are highly unreliable and cause severe market fluctuations.
They are basically depend on short term games and withdraw funds as soon as
they see slightest trouble which can shake the entire domestic economy and
also lead to currency crisis. South Asian Financial crisis, Mexico crisis are best
examples. However China’s economy is less risky and the percentage of
domestic savings in capital market represents more proportion when compared
to India. In order to maintain a stable growth of stock market excessive
dependence of foreign institutional investors is to be reduced. The flow of
investments of FIIs is extremely volatile compared to other forms of capital
force. Investors often pull back portfolio investment if they loose confidence
in host economy.
95
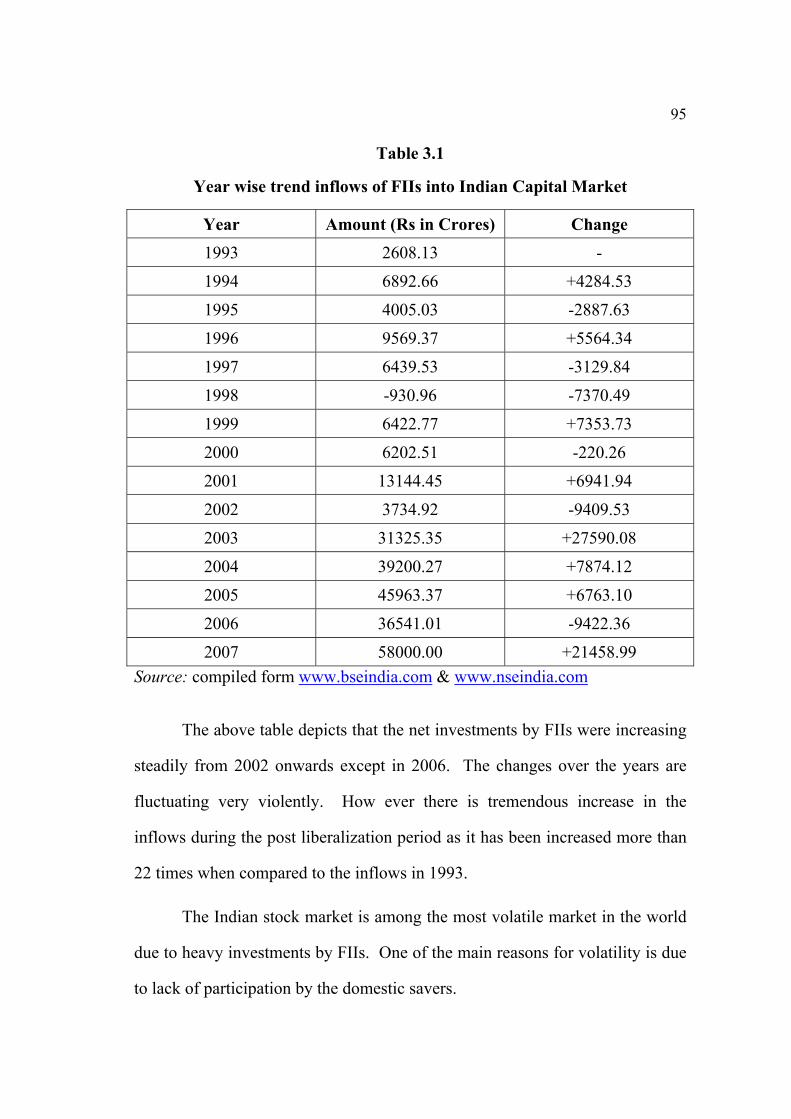
Table 3.1
Year wise trend inflows of FIIs into Indian Capital Market
Year Amount (Rs in Crores) Change 1993 2608.13 -
1994 6892.66 +4284.53
1995 4005.03 -2887.63
1996 9569.37 +5564.34
1997 6439.53 -3129.84
1998 -930.96 -7370.49
1999 6422.77 +7353.73
2000 6202.51 -220.26
2001 13144.45 +6941.94
2002 3734.92 -9409.53
2003 31325.35 +27590.08
2004 39200.27 +7874.12
2005 45963.37 +6763.10
2006 36541.01 -9422.36
2007 58000.00 +21458.99 Source: compiled form www.bseindia.com & www.nseindia.com
The above table depicts that the net investments by FIIs were increasing
steadily from 2002 onwards except in 2006. The changes over the years are
fluctuating very violently. How ever there is tremendous increase in the
inflows during the post liberalization period as it has been increased more than
22 times when compared to the inflows in 1993.
The Indian stock market is among the most volatile market in the world
due to heavy investments by FIIs. One of the main reasons for volatility is due
to lack of participation by the domestic savers.
96
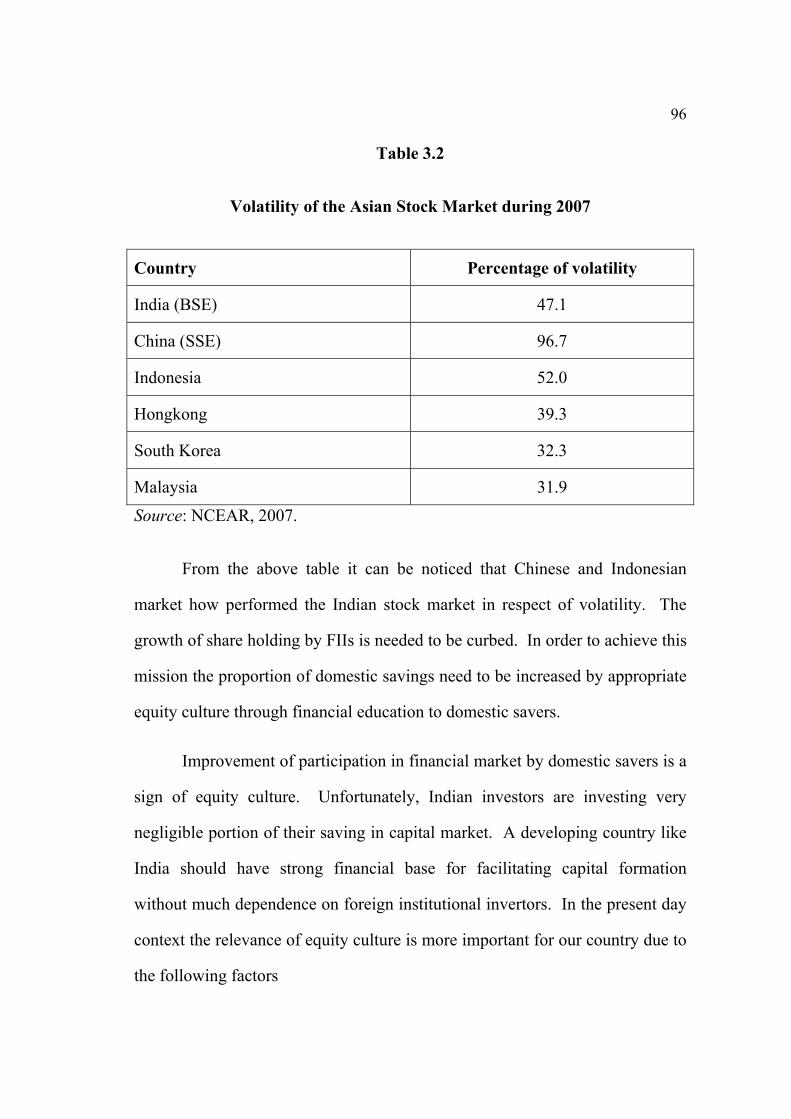
Table 3.2
Volatility of the Asian Stock Market during 2007
Country Percentage of volatility
India (BSE) 47.1
China (SSE) 96.7
Indonesia 52.0
Hongkong 39.3
South Korea 32.3
Malaysia 31.9
Source: NCEAR, 2007.
From the above table it can be noticed that Chinese and Indonesian
market how performed the Indian stock market in respect of volatility. The
growth of share holding by FIIs is needed to be curbed. In order to achieve this
mission the proportion of domestic savings need to be increased by appropriate
equity culture through financial education to domestic savers.
Improvement of participation in financial market by domestic savers is a
sign of equity culture. Unfortunately, Indian investors are investing very
negligible portion of their saving in capital market. A developing country like
India should have strong financial base for facilitating capital formation
without much dependence on foreign institutional invertors. In the present day
context the relevance of equity culture is more important for our country due to
the following factors
97
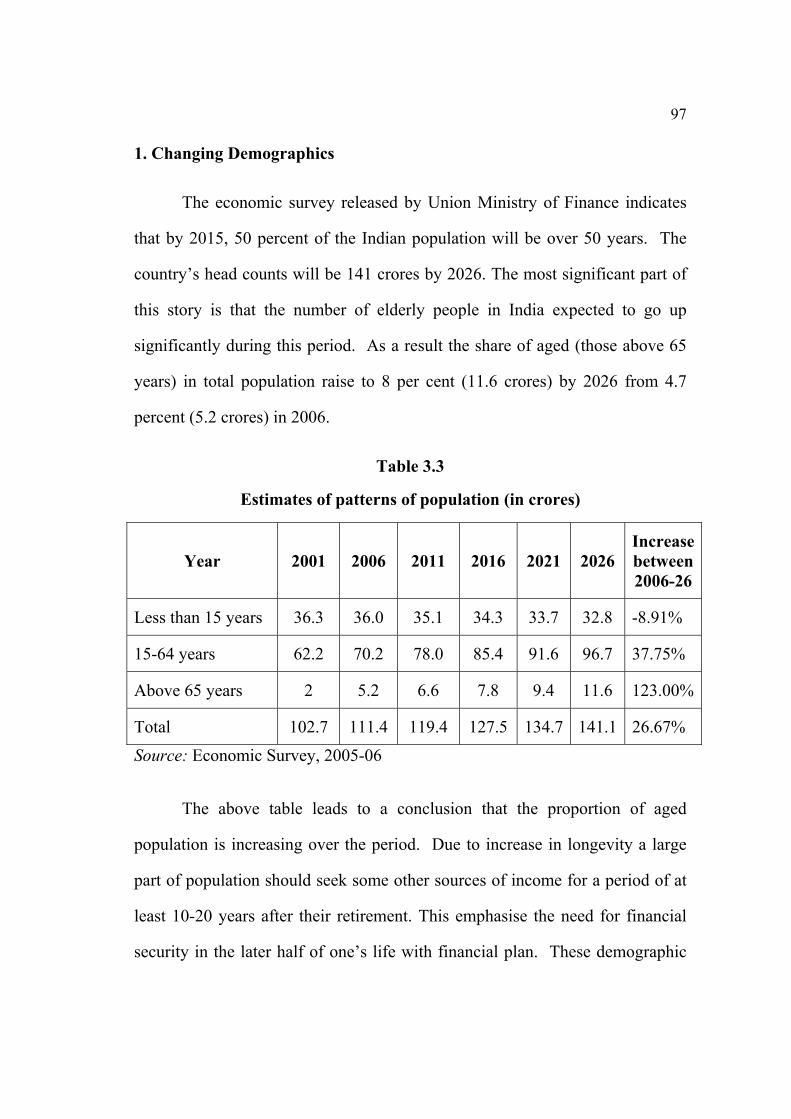
1. Changing Demographics
The economic survey released by Union Ministry of Finance indicates
that by 2015, 50 percent of the Indian population will be over 50 years. The
country’s head counts will be 141 crores by 2026. The most significant part of
this story is that the number of elderly people in India expected to go up
significantly during this period. As a result the share of aged (those above 65
years) in total population raise to 8 per cent (11.6 crores) by 2026 from 4.7
percent (5.2 crores) in 2006.
Table 3.3
Estimates of patterns of population (in crores)
Year 2001 2006 2011 2016 2021 2026 Increase between 2006-26
Less than 15 years 36.3 36.0 35.1 34.3 33.7 32.8 -8.91%
15-64 years 62.2 70.2 78.0 85.4 91.6 96.7 37.75%
Above 65 years 2 5.2 6.6 7.8 9.4 11.6 123.00%
Total 102.7 111.4 119.4 127.5 134.7 141.1 26.67%
Source: Economic Survey, 2005-06
The above table leads to a conclusion that the proportion of aged
population is increasing over the period. Due to increase in longevity a large
part of population should seek some other sources of income for a period of at
least 10-20 years after their retirement. This emphasise the need for financial
security in the later half of one’s life with financial plan. These demographic
98
trends point to a rising on dependency ratio (non working population to
working population).
More over the society evolved in to the industrial age, people who
worked in factories needed to leave their villages and housed in search of work
to be production units were located. This migration started eating into the joint
family support system as nuclear family’s units. In the mean time our economy
has been rapidly evolving into a service economy with further fragmentation of
families. These factors further calls for financial awareness in order to ensure
financial security.
The Indian economy growth has seen the national income increase at a
nominal rate of 14 percent plus over the last three years touching Rs 28,46,762
crores in 2005-06. Given a population growth rate of 1.1 percent the per
capita income is also grown by the 14.3 percent raising from Rs 25716 (2005-
06) to Rs 29382 (2006-07). This clearly indicates the raise if huge middle class
in india. In fact the Indian middle class house holds expected to account for 40
percent of the total population in the next 20 years. The demographic changes
underlined the need for a better financial education for a middle calls people.
Changing Economic Environment and Pattern of Household Savings and
Investment
Pursuant to the process of globalisation the economic and financial
landscape of India is undergoing a significant transformation. In the process
the economy has more diversified with the new sources of growth. In tune
with these changes, we have seen the modernization of financial sector that has
also increasingly more diversified to meet new requirements of the economy.
99
Equity culture assumes importance in changed financial status of the families,
financial literacy can play a major role by equipping consumers with the
knowledge required to choose from a myriad of financial products and
providers.
In India both savings and investment rates are growing but the cause of
concern is where they are investing their savings. Investments in households
have increasingly moved either to risk free, government backed, fixed return,
low yielding investment or non-financial assets. As per RBI report, only 6
percent of house hold savings was invested in equity, mutual funds and
debentures in 2006-07.
It is the household sector which occupies a position of dominance over
other institutional sectors like private corporate sectors and public sectors in
terms of generating savings. This sector is defined to comprise individuals,
non government, non corporate enterprise. The rate of Gross Domestic
Savings has proportion of Gross Domestic Product at current market price has
increased more than thrice form an average of around 10 percent in 50’s to
34.3% in 2006-07.
According to Economic Survey 2007-08 the Per Capita Consumption in
the current fiscal would be 57.56 percent of the income, a drop from the
average 61 percent and 64 percent witnessed during 10th and 11th five year
plans. With a Per Capita Income of Rs 29786 and consumption of Rs 17145,
Indians on an average left with a surplus of Rs 12641 an amount nearly double
what they retained during the 9th plan period.
100
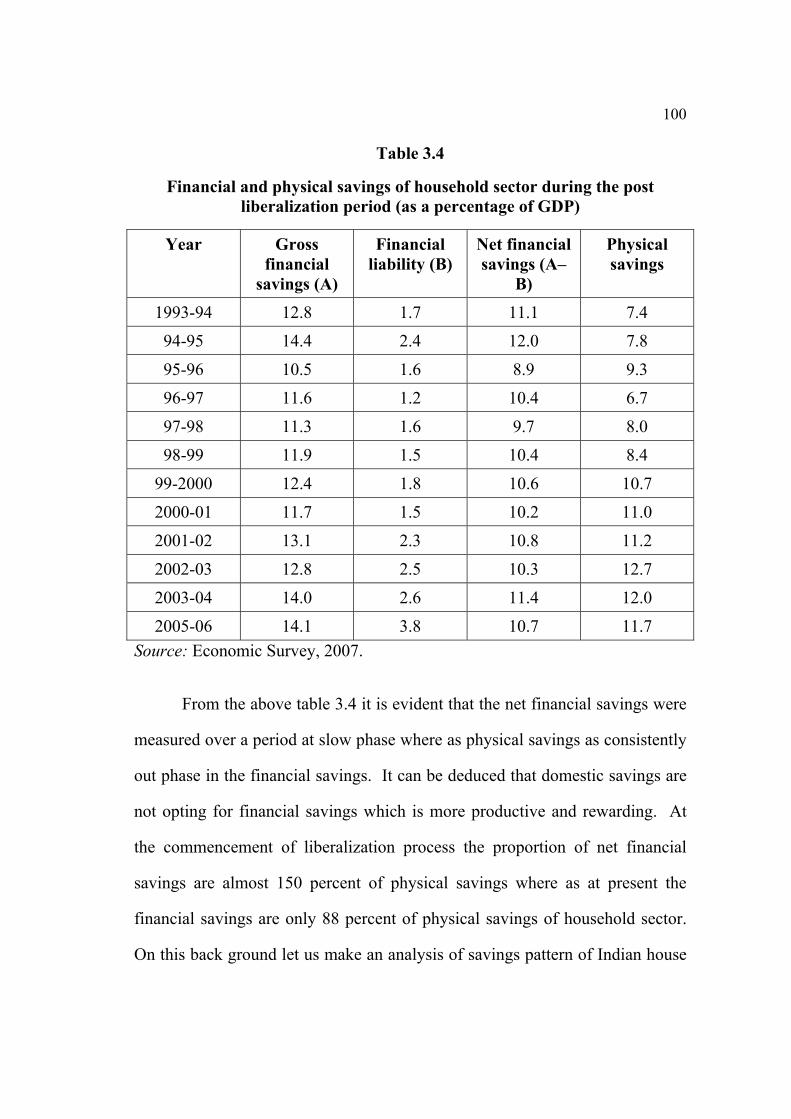
Table 3.4
Financial and physical savings of household sector during the post liberalization period (as a percentage of GDP)
Year Gross financial
savings (A)
Financial liability (B)
Net financial savings (A–
B)
Physical savings
1993-94 12.8 1.7 11.1 7.4
94-95 14.4 2.4 12.0 7.8
95-96 10.5 1.6 8.9 9.3
96-97 11.6 1.2 10.4 6.7
97-98 11.3 1.6 9.7 8.0
98-99 11.9 1.5 10.4 8.4
99-2000 12.4 1.8 10.6 10.7
2000-01 11.7 1.5 10.2 11.0
2001-02 13.1 2.3 10.8 11.2
2002-03 12.8 2.5 10.3 12.7
2003-04 14.0 2.6 11.4 12.0
2005-06 14.1 3.8 10.7 11.7 Source: Economic Survey, 2007.
From the above table 3.4 it is evident that the net financial savings were
measured over a period at slow phase where as physical savings as consistently
out phase in the financial savings. It can be deduced that domestic savings are
not opting for financial savings which is more productive and rewarding. At
the commencement of liberalization process the proportion of net financial
savings are almost 150 percent of physical savings where as at present the
financial savings are only 88 percent of physical savings of household sector.
On this back ground let us make an analysis of savings pattern of Indian house

101
hold during the post liberalization period to access their performance in various
financial assets.
Table 3.5
Saving pattern of households in India during the post liberalization period (Rs in crores)
Year Currency Bank deposit
Non-banking deposit
Life insurance
Provident and
pension fund
Claims on Govt.
Shares and
debentures Units of
UTI Trade debt (Net)
Changes in
financial assets (2-10)
1992-93 6562 29518 6035 7114 14814 3885 8212 5612 (1398) 80354 8 37 8 9 18 5 10 7 2 100
93-94 13367 36236 11654 9548 18323 6908 10067 4705 (1190) 10961812 33 11 9 17 6 9 4 1 100
94-95 15916 55835 11547 11370 21414 13186 13473 3908 (1148) 14550111 38 8 8 15 9 9 3 1 100
95-96 16525 39941 13198 13894 22343 9588 8839 262 (252) 12433713 32 11 11 18 8 7 0 0 100
96-97 13643 50902 25980 16121 30390 11783 6631 3776 (708) 1585199 32 16 10 19 7 4 2 0 100
97-98 12780 74099 6733 19410 32267 22162 4464 595 (770) 1717407 43 4 11 19 13 3 0 0 100
98-99 21822 79433 7670 23428 46408 28220 5105 1887 (6870) 20710311 38 4 11 22 14 2 1 3 100
99-2000 20845 82892 3844 28644 53907 28985 16308 1811 (1023) 2360139 35 2 12 23 12 7 1 0 100
2000-01 15632 94703 6911 33861 47882 39007 11148 934 (183) 2483936 38 3 14 19 16 4 0 0 100
2001-02 28156 112936 7912 41237 46609 51938 9834 1857 (183) 2965829 38 3 14 16 18 3 1 0 100
2002-03 28632 123462 8788 52009 48441 56087 7122 1618 (341) 3225839 38 3 16 15 17 2 1 0 100
2003-04 42675 141967 3803 52240 48952 87372 9078 8586 (114) 37738711 38 1 14 13 23 2 2 0 100
2004-05 36977 158259 3370 67986 56552 106420 8113 3146 (213) 4343189 36 1 16 13 25 2 1 0 100
2005-06 51954 274693 6130 83540 62704 87168 29712 444 (222) 5952359 46 1 14 11 15 5 0 0 100
2006-07 65427 422039 881 113900 69571 39197 48228 310 (183) 7587509 56 0 15 9 5 6 0 0 100
Source: Reserve Bank of India, 2007.
102
It may be noted from the table 3.5 that the savings pattern of household
are varying in nature and during the post liberalization period they are more
interested in fixed return, financial assets rather than shares and securities. The
percentage of bank deposits was increased from 37 percent in 1992-93 to 56
percent in 2006-07. A further look at the table shows that the preference of
households in respect of shares and debentures reduced from 10 percent in
1992-93 to 6 percent in 2006-07.
It may be inferred that in spite of the introduction of a number of
innovative financial instruments in the capital market investors are still going
after less productive instrument avenues. This low preference towards
financial instruments is due to lack of awareness among investors.
It is noted that the financial savings of the households are showing a
decline over the recent years were as the physical savings are showing an
increase in trend. Even in financial assets Indians are having an inherent
reluctance towards financial investments in capital market.
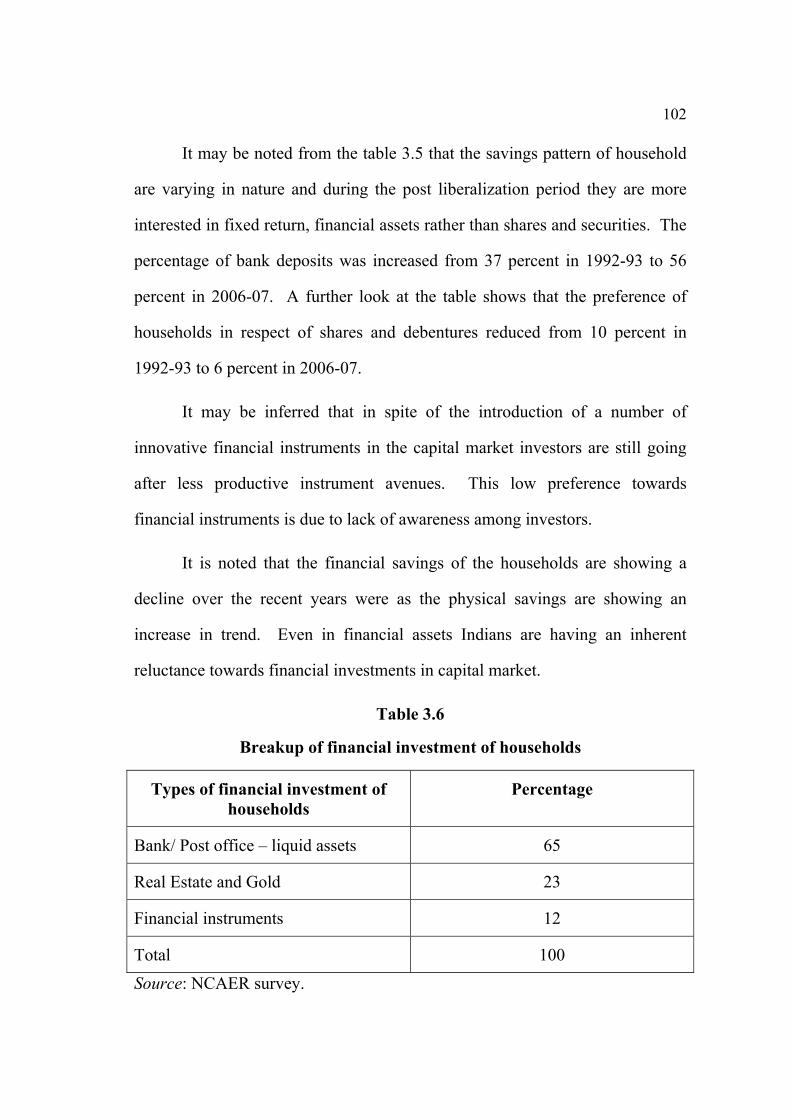
Table 3.6
Breakup of financial investment of households
Types of financial investment of households
Percentage
Bank/ Post office – liquid assets 65
Real Estate and Gold 23
Financial instruments 12
Total 100
Source: NCAER survey.
103
The Table 3.6 indicates that Indians have been savings in fixed return
products and almost neglected the capital markets. The skewed assed
allocation has underlying the demand for a better equity culture for the Indian
households.
The present study is having a different dimension and focuses, mainly
on equity culture of investor in Kerala. This kind of study hasn’t been
attempted so far by the researchers and therefore the research gap in this
respect has properly identified and analysed and results were properly deduced.
Hence the next chapter is devoted for the analysis and interpretation of primary
data collected.
REFERENCES
• SEBI Bulletin, April 2005.
• www.bseindia.com
• www.nseindia.com
• NCAER, 2007.
• Economic Survey, 2005-06.
• Reserve Bank of India, 2007.